Evaluation of Power Grid Investment Effectiveness in New Power Systems Considering Decision Psychology and Sustainable Development: An Empirical Study Based on Chinese Urban Power Grid Simulation

Evaluation of Power Grid Investment Effectiveness in New Power Systems Considering Decision Psychology and Sustainable Development: An Empirical Study Based on Chinese Urban Power Grid Simulation
Yuxuan Tong
1,*
 Zhengyang Guo
2
Quance Ren
3
Zhengyang Guo
2
Quance Ren
3
Received: 26 February 2026 Revised: 13 March 2026 Accepted: 17 March 2026 Published: 30 March 2026

© 2026 The authors. This is an open access article under the Creative Commons Attribution 4.0 International License (https://creativecommons.org/licenses/by/4.0/).
1. Introduction
In recent years, the intensification of global climate change and the frequent occurrence of extreme weather events have posed severe threats to the safe operation of critical infrastructure. Concurrently, global actions addressing climate change have promoted a profound transformation of the energy system, making the construction of new power systems characterized by “clean, low-carbon, safe, and efficient” features an international consensus [1,2]. Against this dual background, power grid investment faces brand-new challenges. On one hand, the frequent occurrence of extreme natural disasters, represented by typhoons and extreme cold, has exposed the vulnerability of traditional power grids under extreme conditions, making the enhancement of grid resilience a focus of attention in both the international academic community and industry [3,4,5,6]. Reference [7] proposed an improvement scheme for microgrid protection strategies under extreme scenarios, providing a technical reference for resilience investment orientation. On the other hand, the integration of a high proportion of renewable energy has put forward higher requirements for the accommodation capability and regulation flexibility of the power grid [8]. The International Energy Agency (IEA) and related studies point out that future grid investment must shift from single capacity expansion to the coordination of multi-dimensional goals supporting system flexibility enhancement and a low-carbon transition [9]. Therefore, how to scientifically evaluate the actual effectiveness of grid investment in promoting system transition and guide the precise flow of funds has become a core issue for achieving the high-quality development of the power industry.
Currently, progress has been made in research on power grid development levels and the evaluation of investment benefits. Regarding the construction of evaluation indicator systems, existing research mainly revolves around traditional dimensions such as security, reliability, and economy [10,11,12]. Reference [13] proposed a distribution network energy storage configuration scheme to enhance resilience targeting typhoon disasters; Reference [14] focused on distributed generation planning under extreme weather. As the energy transition deepens, some scholars have begun to focus on environmental benefits and sustainable development indicators. Reference [15] developed a grid investment benefit evaluation model that considers renewable energy development from a sustainable development perspective; Reference [16] established a multidimensional investment assessment framework for U.S. energy infrastructure, including policy interventions, market mechanisms, and environmental externalities, providing a reference for understanding investment effectiveness during the transition period. Reference [17] further noted that, with the popularization of flexible loads such as electric vehicles, investment benefit evaluation should incorporate their contributions to grid flexibility and life-cycle costs. Reference [18] deeply analyzed the impact of high-penetration renewable energy integration on system voltage stability, enriching the connotation of technical evaluation indicators. However, despite the international community’s increasing emphasis on the low-carbon transition of the power grid, existing indicator systems remain insufficient in quantifying “investment effectiveness”. In particular, they lack an explicit characterization of the “flexible and intelligent” features of the new power system, making it difficult to comprehensively reflect the comprehensive contribution of investment to system resilience and low-carbon transition [19,20,21].
At the level of evaluation methods, Multi-Criteria Decision Making (MCDM) methods are widely applied in the evaluation of complex systems for power grid investment decisions. To balance expert experience with objective data, combined weighting methods (such as AHP-Entropy, BWM-Entropy, etc.) have become research hotspots [22,23,24]. Reference [25] combined the fuzzy group ideal point method with the combined weighting method, effectively solving the problem of subjective bias in determining indicator weights. Reference [26] utilized MCDM methods to comprehensively evaluate power production technologies, providing effective tools for handling correlation and conflict issues among indicators. Reference [27] verified the effectiveness of multi-criteria evaluation methods in handling multi-dimensional objective conflicts regarding the techno-economic optimization of off-grid hybrid energy systems. Reference [28] explored the impact of standardization methods in decision models on evaluation results, providing a theoretical basis for enhancing decision robustness. Meanwhile, considering the complexity and uncertainty of the investment decision environment, behavioral decision theory is gradually being introduced into evaluation models. Existing studies indicate that decision-makers often exhibit bounded rationality, including psychological characteristics such as loss aversion, when facing uncertainty [29]. Prospect theory proposed in Reference [30] provided a theoretical foundation for describing this behavior; subsequent studies like Reference [31] applied it to energy project risk assessment, effectively improving the realistic fitting degree of decision models. On this basis, References [32,33,34] further combined fuzzy set theory with cumulative prospect theory to address issues of fuzzy information and risk preferences in energy project evaluation. Although the aforementioned methods have made contributions in weight determination and decision behavior characterization, they still have limitations, such as insufficient systematic characterization of investment effectiveness and weak orientation toward transition goals when addressing the evaluation needs of multi-dimensional objective coupling and high correlation among indicators in new power systems [35,36,37]. In summary, current research lacks a comprehensive assessment system for grid investment effectiveness that not only fits the characteristics of the new power system but also integrates the behavioral characteristics of decision-makers, which constitutes the entry point of this paper [38,39,40,41].
In view of this, this paper focuses on evaluating the effectiveness of power grid investment in the context of new power system construction. First, closely adhering to the development requirements of being “clean and low-carbon, safe and adequate, economic and efficient, and flexible and intelligent”, an evaluation system containing 13 key indicators is constructed from four dimensions: low-carbon performance, security, economy, and intelligence. Second, to scientifically determine indicator weights, a combined weighting model integrating the Back Propagation Neural Network (BPNN), Criteria Importance Through Intercriteria Correlation (CRITIC), and Entropy Weight Method (EWM) is adopted to comprehensively extract data characteristics, indicator contrast intensity, and conflict information. Furthermore, to incorporate the psychological factors of decision-makers in investment risk assessment into consideration, Improved Cumulative Prospect Theory (ICPT) is introduced to construct value functions and decision weights, and combined with Grey Relational Analysis (GRA) and the Technique for Order Preference by Similarity to an Ideal Solution (TOPSIS), an ICPT-GRA-TOPSIS comprehensive evaluation model is constructed. This aims to reflect objective performance and subjective preferences more comprehensively. Finally, through an empirical analysis of power grids in multiple regions, it is verified that the proposed model can effectively identify the strengths and weaknesses in various dimensions of investment effectiveness for different power grids, thereby providing scientific decision support for the precise planning and differentiated strategy formulation of future power grid investments.
2. Comprehensive Evaluation Algorithm for Power Grid Investment Effectiveness Oriented to New Power Systems
To systematically and accurately evaluate the comprehensive effectiveness of power grid investment under the background of the new power system, this paper constructs a comprehensive evaluation algorithm that integrates a multi-dimensional indicator system, combined objective weighting, and behavioral decision theory. This algorithm aims to overcome the defects of traditional methods, such as subjective weights, single dimensions, and the neglect of decision-makers’ psychological preferences. Through a progressive logical architecture of structured input, standardization processing, comprehensive weighting, psychological perception mapping, and multi-method collaborative evaluation, it forms a complete, rigorous, and practical computational framework that fits actual decision-making scenarios. The modules are tightly coupled through standardized data flows and parameter chains, ensuring the scientificity and objectivity of the evaluation process.
First, establish a multi-level indicator system and specify evaluation criteria. The foundation of the algorithm is the construction of a comprehensive evaluation indicator system covering four dimensions: low-carbon, security, economy, and intelligence. It aims to comprehensively quantify the multi-dimensional outputs of grid investment in promoting energy transition, ensuring system stability, enhancing operational benefits, and facilitating digital upgrades, thereby providing clear evaluation objects and content boundaries for subsequent quantitative analysis.
Second, implement data standardization preprocessing to unify the calculation basis. Addressing the differences in dimensions and utility directions (positive/negative) within the indicator system, the range standardization method is adopted to normalize all original data, generating a clean and comparable standardized decision matrix. As the core data carrier, this matrix seamlessly connects all subsequent weight calculation and comprehensive evaluation modules, eliminating potential computational deviations caused by inconsistent dimensions and directions.
Third, adopt a game theory combination weighting to integrate objective weight information. To scientifically determine the weights of each indicator, the algorithm innovatively integrates three objective weighting methods and coordinates and optimizes them using game theory. First, the BPNN method extracts indicator importance from network connection weights by simulating the complex non-linear relationship between indicators and the system’s comprehensive performance; the CRITIC method considers both the dispersion of indicator data and the conflict between indicators to measure their comprehensive information content; the EWM assigns weights based on the principle of information entropy according to the dispersion of the indicator values themselves. The above three generate independent weight vectors from the perspectives of “non-linear correlation”, “information conflict”, and “data disorder”, respectively. Subsequently, the combination weighting module calculates the covariance matrix for each weight vector to determine a set of optimal combination coefficients that minimize the total deviation between the final comprehensive weight vector and the weights of each single method. The resulting balanced weight vector possesses diverse objectivity and serves as a key parameter throughout all subsequent calculation links.
Fourth, introduce the Improved Cumulative Prospect Theory to characterize decision-making psychology. The algorithm inputs the standardized matrix and combination weights into the ICPT model, transforming objective values into a decision-maker’s psychological perception value matrix through preset risk attitude parameters and sensitivity coefficients. This transformation elevates pure objective data evaluation to the level of behavioral decision-making, enabling subsequent analysis to truly reflect the decision-maker’s risk preferences when facing gains and losses, and endowing the evaluation conclusions with behavioral economics implications.
Fifth, a parallel dual-path collaborative evaluation to integrate geometric and spatial information. Based on the psychological perception value matrix generated by ICPT, the algorithm executes two improved evaluation methods in parallel: ICPT-GRA calculates the grey relational coefficients between each scheme and the ideal solution on the psychological perception sequence, focusing on evaluation from the perspective of curve shape and similarity in development trends; ICPT-TOPSIS calculates the Euclidean distance between the weighted psychological perception vector of each scheme and the ideal solution, focusing on measuring the proximity of absolute distance in multi-dimensional space. The two conduct deep mining on the same psychological perception data from two complementary geometric perspectives: “shape similarity” and “distance proximity”.
Sixth, dynamic fusion based on variance to output robust evaluation results. Finally, instead of simply averaging the scores of the two methods, the algorithm introduces a dynamic weight fusion mechanism. This mechanism automatically assigns combination weights based on the variance of the respective result sequences of ICPT-GRA and ICPT-TOPSIS: the method with more stable results is assigned higher confidence. This adaptive fusion strategy effectively integrates the advantages of both methods, ensuring that the final comprehensive evaluation score possesses both trend sensitivity and positional accuracy, thereby yielding a more robust and reliable ranking scheme.
3. Evaluation Index System for Power Grid Investment Effectiveness
To scientifically evaluate the effectiveness of power grid investment oriented towards new power systems, a comprehensive evaluation index system covering four dimensions—low-carbon performance, security, economy, and intelligence—is constructed, as shown in Table 1. This system closely aligns with the development requirements of new power systems, namely being “clean and low-carbon, safe and adequate, economic and efficient, and flexible and intelligent”. It aims to systematically measure the comprehensive effects of power grid investment in promoting energy transformation, ensuring operational security, enhancing economic benefits, and driving digital transformation. The selection of indicators follows the principles of scientificity, quantifiability, and orientation. It not only connects with the macro goals of new power systems but also focuses on the key outputs of power grid investment, providing a precise and operable quantitative basis for investment decision-making and planning optimization.
Table 1. Evaluation Index System for Power Grid Investment Effectiveness in New Power Systems.
|
Dimension |
Indicator Name |
Indicator Meaning and Calculation Method |
|---|---|---|
|
Low-carbon Performance |
Renewable Energy Penetration Rate (C1) |
(Renewable Energy Generation/Total Electricity Consumption) × 100%, reflecting the level of clean energy integration in the grid |
|
Terminal Electrification Rate (C2) |
(Electricity Terminal Consumption/Total Terminal Energy Consumption) × 100%, indicating the proportion of electricity in energy consumption |
|
|
Renewable Energy Utilization Rate (C3) |
(Actual Renewable Energy Generation/Potential Renewable Energy Generation) × 100%, measuring renewable energy accommodation capability |
|
|
Security |
Interface Transmission Capacity Improvement Rate (C4) |
(Post-investment Interface Transmission Capacity − Pre-investment Interface Transmission Capacity)/Pre-investment Interface Transmission Capacity × 100% |
|
N-1 Passing Rate (C5) |
Percentage of lines satisfying the N-1 security criterion (%), reflecting grid structural strength |
|
|
Power Supply Reliability Rate (C6) |
(1 − Average Customer Interruption Time/Statistical Period Time) × 100%, characterizing continuous power supply capability |
|
|
Disaster Prevention and Resilience Capability Index (C7) |
Comprehensive score (0–100) based on investment proportions for wind protection, flood prevention, and ice resistance, as well as historical fault recovery time |
|
|
Economy |
Network Loss Rate (C8) |
(Grid Transmission and Distribution Loss/Total Power Supply) × 100%, reflecting grid operational energy efficiency |
|
Power Supply Increment per Unit Investment (C9) |
Incremental Power Supply after Investment/Total Corresponding Grid Investment (kWh/CNY) |
|
|
Electricity Sales per Unit Fixed Asset (C10) |
Annual Electricity Sales/Total Grid Fixed Assets (kWh/CNY), reflecting asset utilization efficiency |
|
|
Intelligence |
Distribution Automation Coverage Rate (C11) |
Percentage of lines achieving distribution automation (%) |
|
Acquisition Terminal Coverage Rate (C12) |
Percentage of distribution equipment covered by various monitoring and acquisition terminals (%) |
|
|
Proportion of Low-voltage Distributed Photovoltaic Users with “Four-Capabilities” (C13) |
Percentage of low-voltage distributed photovoltaic users possessing observable, measurable, adjustable, and controllable capabilities (%) |
3.1. Low-Carbon Performance
Low-carbon performance is a core dimension for measuring the promotion of clean energy transition and terminal electrification by grid investment. Grid investment needs to directly enhance the capacity to accommodate and integrate a high proportion of new energy. This dimension selects three key indicators: new energy penetration rate, terminal electrification rate, and new energy utilization rate. The new energy penetration rate directly reflects the cleanliness of the grid’s power source structure; the terminal electrification rate measures the breadth and depth of electrification substitution, which is a key pathway for the low-carbon transformation of energy consumption; the new energy utilization rate evaluates the actual capability of the grid to integrate volatile renewable energy, thereby avoiding wind and solar curtailment. This group of indicators jointly constitutes a low-carbon effectiveness evaluation chain spanning from the power supply side to the load side, precisely guiding the support role of investment in achieving the “Dual Carbon” goals.
3.2. Security
Security is the cornerstone of stable power grid operation. Especially under the background of constructing new power systems with a high proportion of renewable energy integration, higher requirements are placed on the strength and resilience of the grid. This dimension selects four indicators: the improvement rate of interface transmission capacity, the N-1 passing rate, the power supply reliability rate, and the disaster prevention and resilience capability index. The improvement rate of interface transmission capacity measures the enhancement effect of the transmission capability of key corridors; the N-1 passing rate is a classic standard for evaluating grid structural strength and redundancy; the power supply reliability rate is the most direct perception of power supply quality by users; the disaster prevention and resilience capability index comprehensively evaluates the defense and recovery capabilities of the grid against external shocks such as extreme weather. This set of indicators comprehensively characterizes the effectiveness of power grid investment in guaranteeing system security and adequacy from three levels: network structure, power supply quality, and emergency resilience.
3.3. Economy
Economy focuses on the efficiency and benefits of power grid investment and serves as an important yardstick for measuring whether resources are optimally allocated to achieve sustainable development. This dimension selects three indicators: network loss rate, power supply increment per unit of investment, and electricity sales per unit of fixed assets. The network loss rate is a core technical and economic indicator reflecting the operational energy efficiency of the grid; the power supply increment per unit investment directly measures the increment in power supply capability brought about by capital input, reflecting the marginal benefit of investment; the electricity sales per unit fixed asset comprehensively evaluates the overall utilization efficiency and output level of existing grid assets. These indicators jointly constitute an “operational efficiency–investment efficiency–asset efficiency” trinity evaluation framework for the economy, aiming to guide power grid investment away from extensive expansion and towards leanness and high efficiency.
3.4. Intelligence
Intelligence is an inevitable development direction for the power grid to meet the requirements of new power systems for being “observable, measurable, adjustable, and controllable”, reflecting the depth of integration between digital technology and physical systems. This dimension selects three indicators: distribution automation coverage rate, acquisition terminal coverage rate, and the proportion of low-voltage distributed photovoltaic users with “four capabilities”. The distribution automation coverage rate reflects the basic capability of fault automatic processing and operation optimization at the distribution network level; the acquisition terminal coverage rate is the physical foundation for the grid to achieve comprehensive perception and data acquisition; the proportion of low-voltage distributed photovoltaic users with “four-capabilities” specifically addresses the precise control challenge of massive distributed energy integration and is a key indicator for testing the grid’s capability to regulate new elements. This set of indicators aims to evaluate the specific effectiveness of power grid investment in improving digitalization and automation levels, as well as building a flexible and intelligent system.
4. Evaluation Model of Power Grid Investment Effectiveness Based on Combined Weighting and Cumulative Prospect Theory
The evaluation model proposed in this paper, based on combined weighting and cumulative prospect theory, adopts a four-layer structural design. First, the indicators are standardized. Next, a combined weighting approach integrating multiple objective weighting methods is applied. Subsequently, by incorporating Cumulative Prospect Theory (CPT), Grey Relational Analysis (GRA), and the Technique for Order Preference by Similarity to an Ideal Solution (TOPSIS), a comprehensive evaluation model for power grid investment effectiveness is formed. This model takes into account both objective data support and subjective decision-making psychology. It overcomes the limitations of traditional evaluation methods that rely on single perspectives, thereby enhancing the scientificity and practicality of comprehensive power grid evaluation.
4.1. Data Standardization
Data preprocessing is a foundational step in the evaluation model, aimed at eliminating the impact of different dimensions among indicators to ensure the comparability of evaluation results. Standardization transforms all indicators into the [0, 1] interval, preserving the information in the original data while avoiding evaluation bias caused by differences in units and scales. To address the distinction between positive and negative indicators in power grid evaluation, the following standardization formulas are adopted:
where: $${X}_{norm}^{j}$$ is the dimensionless value of the j-th evaluation indicator after standardization, and its value range is within the [0, 1] interval; $${X}^{j}$$ is the original data of the j-th indicator; $$\epsilon$$ is a tiny constant to prevent the denominator from being zero; $${X}_{\max}^{j}$$ and $${X}_{\min}^{j}$$ represent the minimum and maximum values of the evaluation indicator, respectively.
4.2. Objective Combined Weighting Model
This paper integrates the Back Propagation Neural Network (BPNN, objective weight 1), CRITIC (objective weight 2), and the Entropy Weight Method (EWM, objective weight 3) for combined weighting. This approach effectively addresses the issue that a single objective weighting method can lead to weight extremes, resulting in overly limited results. By balancing the three types of weights, the diversity of objectivity regarding the intrinsic laws of the data is preserved, making the weight allocation more scientific and reasonable.
4.2.1. BP Neural Network Objective Weight
The core idea of using a BP neural network to determine indicator weights is to leverage the connection weights between the input and hidden layers of the trained network to reflect the importance of each input indicator to the final output.
In the forward propagation of the network, for the j-th hidden layer neuron, its net input $${z}_{j}$$ and output $${a}_{j}$$ are:
where: $${x}_{i}$$ is the i-th standardized indicator value; $${w}_{ij}$$ is the connection weight from the input indicator i to the hidden neuron j; $${b}_{j}$$ is the bias term; $$\sigma \left(\cdot \right)$$ is the activation function.
In backpropagation, the gradient descent method is employed to update the weights to minimize the loss function $$L$$, driving the network to learn and causing the predicted output to approach the target, thereby implicitly learning the relationships among the indicators:
where: the learning rate is $$\eta >0$$, and the gradient is calculated via the chain rule.
After training is completed, the comprehensive importance (i.e., weight) of the i-th indicator is obtained by averaging the absolute values of its connection weights to all hidden neurons:
where: $$h$$ is the number of neurons in the hidden layer. The denominator is a normalization factor to ensure $$\sum\limits_{i=1}^{n}{\omega }_{i}=1$$. The larger the absolute value of the indicator’s weight, the stronger its influence on the network output, and thus it is assigned a higher weight.
4.2.2. CRITIC Objective Weight
The CRITIC method overcomes the limitation of traditional objective weighting methods that focus only on indicator dispersion, calculating weights based on indicator standard deviation and conflict:
where: $${w}_{\text{critic}}^{j}$$ is the objective weight of the j-th evaluation indicator calculated by the CRITIC method; $${\sigma }_{j}$$ is the standard deviation of indicator j; $${\rho }_{jk}$$ is the correlation coefficient between indicator j and indicator k.
4.2.3. Entropy Weight Method Objective Weight
Starting from the perspective of information theory, the entropy weight method transforms the degree of dispersion of indicators into information quantity, measuring the degree of dispersion of indicators through information entropy:
where: $${E}_{j}$$ is the information entropy of the j-th evaluation indicator, used to measure the degree of disorder or uncertainty of the indicator data; N is the total number of evaluated objects; $${p}_{ij}$$ is the proportion of the i-th evaluated object in the j-th indicator; $${X}_{ij}^{\mathrm{n}\mathrm{o}\mathrm{r}\mathrm{m}}$$ is the standardized value of the i-th evaluated object in the j-th indicator; $${w}_{\mathrm{e}\mathrm{n}\mathrm{t}\mathrm{r}\mathrm{o}\mathrm{p}\mathrm{y}}^{j}$$ is the objective weight of the j-th evaluation indicator calculated by the entropy weight method.
4.2.4. Objective Combination Weighting
Construct the weight matrix $$W={\left[{w}_{\text{bp}},{w}_{\text{critic}},{w}_{\text{entropy}}\right]}^{T}$$, and solve for the combination weights through the covariance matrix:
where: $$S$$ is the covariance matrix of $$W$$; $$\bm{1}$$ is a vector of all ones; $${w}_{\text{comb}}$$ is the final combination weight vector.
4.3. Evaluation Method Integrating ICPT-GRA-TOPSIS
This paper deeply couples the Improved Cumulative Prospect Theory (ICPT) with GRA-TOPSIS, breaking through the single-dimensional limitations of traditional evaluation methods. Through the synergy of psychological perception, correlation analysis, and vector similarity, the unity of scientific rigor and decision adaptability in comprehensive power grid evaluation is achieved.
4.3.1. ICPT Prospect Value Calculation
Traditional evaluation methods regard indicator values as objective facts, ignoring the decision maker’s nonlinear psychological perception of gains and losses. This paper introduces the Improved Cumulative Prospect Theory to transform standardized data into the decision maker’s real psychological perception value. Decision psychological parameters, including risk attitude $$\alpha$$ and $$\beta$$, loss aversion $$\theta$$, and gain sensitivity $$\delta$$, are introduced to modify the traditional utility function:
where: $${V}_{ij}$$ is the psychological perception value of the i-th evaluated object on the j-th indicator after correction by the Improved Cumulative Prospect Theory (ICPT); $${x}^{\text{base}}$$ is the reference point, set as the decision maker’s psychological neutral benchmark. Values higher than this value are regarded as gains, while values lower than this value are regarded as losses.
The improved prospect value function classifies decision makers into three types. If $$0<\alpha <1$$ and $$0<\beta <1$$, the decision maker is cautious; if $$\alpha =1$$ and $$\beta =1$$, the decision maker is balanced; if $$\alpha >1$$ and $$\beta >1$$, the decision maker is aggressive. If $$\delta >\theta =1$$, the decision maker is more sensitive to prospect gains; if $$\theta >\delta =1$$, the decision maker is more sensitive to prospect losses; if $$\delta =\theta =1$$, the decision maker is equally sensitive to prospect gains and losses.
4.3.2. ICPT-GRA Evaluation Method
Traditional GRA focuses only on the numerical distance of indicators. Considering that power grid decision makers pay more attention to “loss avoidance” rather than the numerical magnitude alone, ICPT-GRA calculates the degree of correlation using psychological perception values, making the correlation analysis more consistent with decision logic. Based on ICPT prospect values, the grey relational degrees with the positive and negative ideal solutions are calculated as follows:
where: $${\xi }_{ij}^{\text{pos}}$$ and $${\xi }_{ij}^{\text{neg}}$$ are the grey relational coefficients of the i-th evaluated object on the j-th indicator with the positive ideal solution and the negative ideal solution, respectively; $${\Delta }_{ij}^{\text{pos}}$$ and $${\Delta }_{ij}^{\text{neg}}$$ are the absolute differences between the prospect value of the i-th evaluated object on the j-th indicator and the positive ideal solution and the negative ideal solution, respectively; $$\rho$$ is the distinguishing coefficient, with a value range of $$\left(0, 1\right]$$, usually taken as 0.5; $$\epsilon$$ is a minimal positive number used for numerical stability; $${F}^{\text{GRA}}$$ is the final ICPT-GRA evaluation score, and the closer its value is to 1, the better the solution.
4.3.3. ICPT-TOPSIS Evaluation Method
Traditional TOPSIS method ranks alternatives by calculating the geometric distance between the alternatives and ideal solutions, but it ignores the psychological behavioral characteristics of decision makers. ICPT-TOPSIS combines prospect theory with TOPSIS, calculating Euclidean distance based on ICPT prospect values, making the evaluation results more consistent with the actual psychology of decision makers:
where: $${D}_{i}^{\text{pos}}$$ and $${D}_{i}^{\text{neg}}$$ are the distances between the i-th evaluated object and the positive ideal solution and the negative ideal solution, respectively; $${F}^{\text{TOPSIS}}$$ is the final ICPT-TOPSIS evaluation score, and the closer its value is to 1, the better the solution.
4.3.4. Combination Evaluation Based on Dynamic Weight Fusion
Traditional evaluation methods combine GRA and TOPSIS results via simple averaging or fixed weights, resulting in one-sided outcomes. This paper introduces the concept of variance to achieve dynamic weight allocation:
where: $${w}^{\text{GRA}}$$ is the dynamic fusion weight assigned to the ICPT-GRA method. Its value is directly proportional to the variance of $${F}^{\text{TOPSIS}}$$, meaning that when the TOPSIS method is unstable (high variance), the weight of the GRA method increases; $${w}^{\text{TOPSIS}}$$ is the dynamic fusion weight assigned to the ICPT-TOPSIS method; $${F}^{\text{final}}$$ is the final comprehensive evaluation score, which is the weighted average of the scores from the two methods.
5. Case Study
To verify the effectiveness and applicability of the new power system grid investment effectiveness evaluation model constructed in this paper, 13 major Chinese cities (denoted as A-M) with good representativeness and differences in grid structure and development stages are selected as case objects. The paper analyzes the whole process of the model, from indicator weighting and comprehensive evaluation to psychological sensitivity analysis, providing a basis for differentiated decision-making. The indicator data are simulated based on annual operation reports, production safety statements, planning documents, and public statistical yearbooks of power grid companies in major Chinese cities. To ensure data comparability, all secondary indicator data were normalized by uniformly converting cost-type and benefit-type indicators into positive indicators. The processed data constitute the original evaluation matrix for 13 cities and 13 indicators.
5.1. Indicator Weight Analysis Based on Combination Weighting Method
Scientific and reasonable indicator weights are the foundation for an accurate, comprehensive evaluation. To overcome the weight bias that may result from the inherent assumptions of a single objective weighting method or its specific sensitivity to data distribution, this paper integrates three objective weighting methods with different principles: the Back Propagation Neural Network (BPNN) weighting method, which simulates non-linear relationships; the CRITIC method, which emphasizes the contrast intensity and conflict between indicators; and the Entropy Weight Method (EWM), which measures the dispersion of indicators based on information entropy. By constructing a combination weighting model based on the principle of minimizing deviation, the optimal combination weights are determined, which take into account the intrinsic laws of the data, differences and correlations among indicators, and information content, thereby enhancing the robustness and credibility of the weight allocation. The weights calculated by each method and the final determined combination weights are shown in Figure 1.
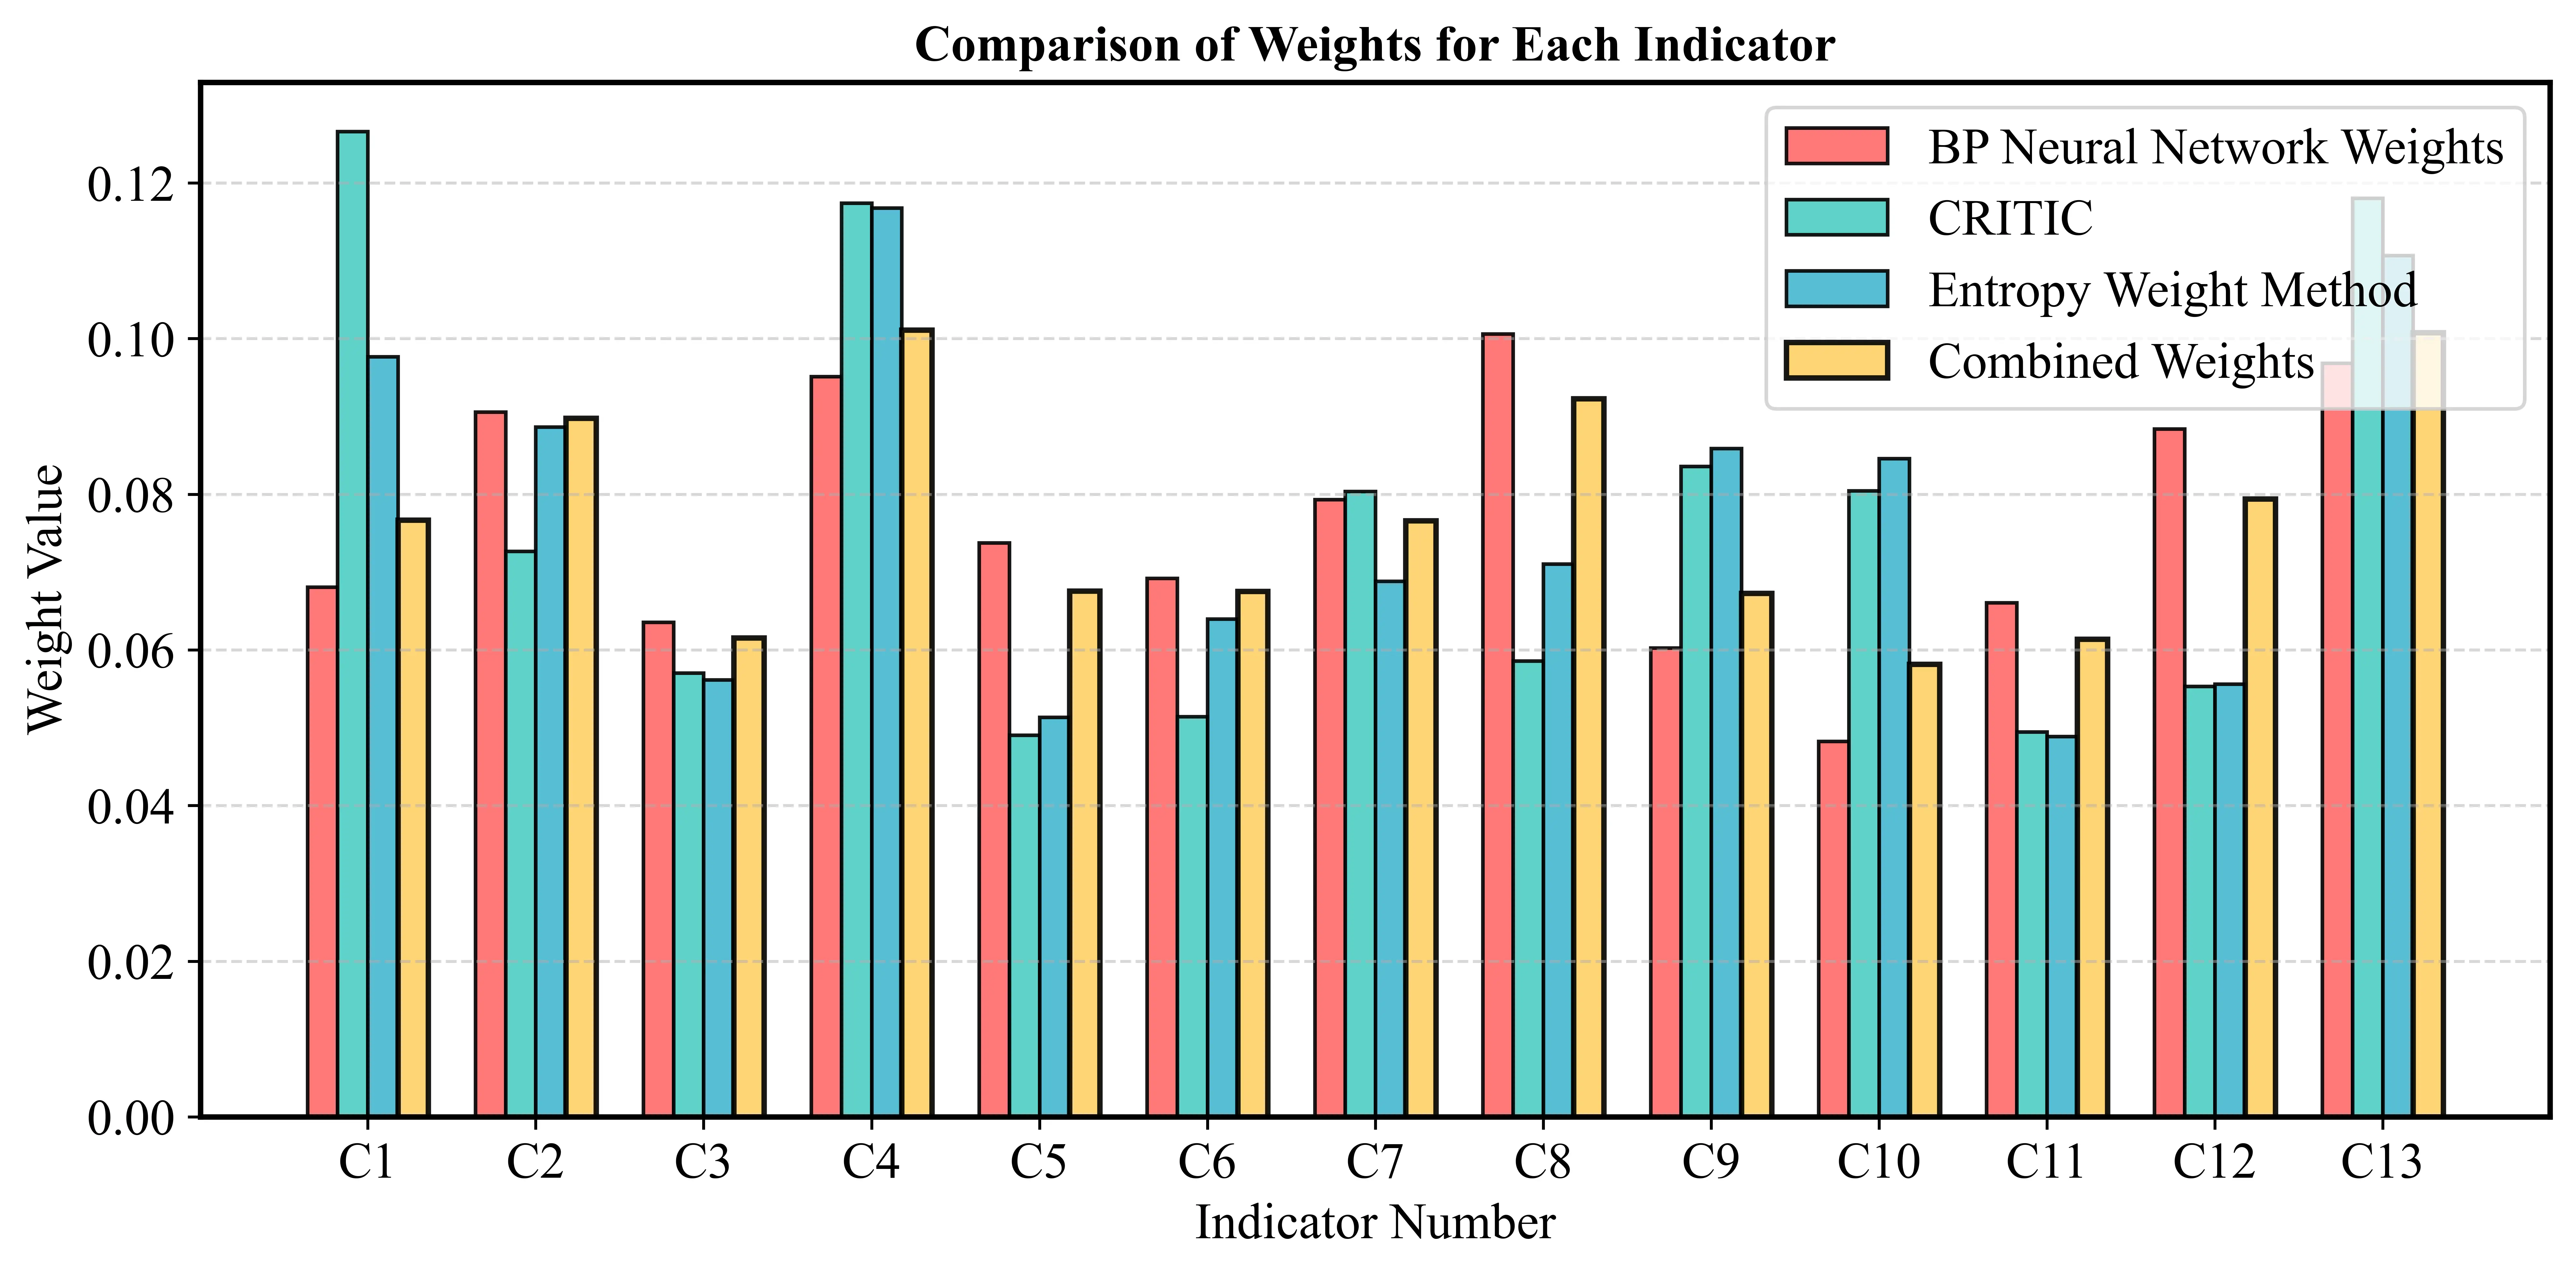
As can be seen from the figure, the combined weights exhibit a significantly differentiated distribution across the four evaluation dimensions. The safety dimension (C4–C7) has the highest total combined weight, a finding that strongly confirms that ensuring grid safety and adequacy remains the cornerstone and primary consideration for investment decisions in the early stages of new-type power system construction. Among these, the enhancement rate of cross-section transmission capacity (C4) ranks highest among all indicators, highlighting its core role in strengthening the main grid framework to meet the demands of large-scale energy resource allocation. The total weights of the economic (C8–C10) and intelligence (C11–C13) dimensions are comparable, reflecting that, against a backdrop of resource constraints, grid investments must balance the dual objectives of improving operational efficiency and advancing digital transformation. In contrast, the weight of the low-carbon dimension (C1–C3) is slightly lower. This does not imply its insignificance, but rather reflects that, at the current stage, grid investments need to synergistically promote the clean energy transition on the premise of solidifying the safety foundation. By comparing the results of the individual methods, the combined weights effectively correct the potential lag caused by the BPNN’s reliance on historical data, as well as the biases that the Entropy Weight Method’s sensitivity to extreme data might introduce. This results in a final weight allocation that is more robust, comprehensive, and aligned with the objective laws of industry development.
Within each dimension, the weight allocation of key indicators has a clear policy and practical orientation. For the Low-carbon dimension, the Terminal Electrification Rate (C2) has the highest weight, indicating that, under the “Dual Carbon” goals, promoting electricity substitution through grid investment and improving the cleanliness of terminal energy use is the most direct and critical path. The weights for the New Energy Penetration Rate (C1) and Utilization Rate (C3) reflect the requirement to place equal emphasis on the accumulation of “quantity” and the improvement of “quality”. For the Safety dimension, the Section Transmission Capacity Improvement Rate (C4) ranks first among all indicators in weight, highlighting the core role of strengthening the main grid framework and enhancing the transmission capacity of key sections to meet the demands of large-scale allocation of energy resources in the process of building a new power system. The Disaster Prevention and Resilience Index (C7) also has a relatively high weight, reflecting the high importance attached to grid resilience against the background of frequent extreme climates. For the Economy dimension, the weight of the Network Loss Rate (C8) is significantly higher than the other two efficiency indicators, indicating that the technical energy efficiency of grid operation is the core link in measuring its economy, and reducing losses is a perpetual technical and economic issue. For the Intelligence dimension, the weights of the Acquisition Terminal Coverage Rate (C12) and the Proportion of “Four-Able” Capabilities for Low-Voltage Distributed Photovoltaics (C13) are prominent. This shows that the evaluation of investment effectiveness pays close attention to the underlying construction of the grid’s digital sensing capability (C12), as well as the precise control capability necessary to face the new challenge of massive distributed energy integration (C13). These two are the physical foundation and advanced embodiment of achieving a “flexible and intelligent” grid.
Comparing the results of single weighting methods, the combined weights effectively integrate the perspectives of different methods. For example, in the BPNN weights, the Network Loss Rate (C8) in the Economy dimension and C13 in the Intelligence dimension have higher weights, potentially focusing more on the predictive importance driven by historical data; the CRITIC and EWM methods assign higher weights to C1 in the Low-carbon dimension and C4 in the Safety dimension, emphasizing the contrastive differences and information volume of these indicators. The combined weights ultimately balance these differences, making the weight allocation reflect not only the objective data characteristics (such as the high information volume and conflict of C4 and C13) but also the learning based on historical patterns (such as the continuous attention to the operational efficiency of C8), avoiding the bias that might result from a single method and making the results more robust and reasonable. In summary, the indicator weights obtained based on the combination weighting method scientifically reflect the multi-objective requirements and their relative importance that should be considered in the evaluation of grid investment effectiveness in the context of new power system construction. The weight allocation aligns with the macroscopic logic of “Security is the foundation, Economy is the constraint, Low-carbon is the direction, and Intelligence is the means”, laying a reasonable quantitative foundation for the subsequent comprehensive performance evaluation.
5.2. Analysis of Comprehensive Evaluation Results Based on ICPT-GRA-TOPSIS
To quantitatively evaluate the comprehensive level of grid investment effectiveness in each city and fully consider the bounded rational psychological characteristics of decision-makers in uncertain environments, the constructed ICPT-GRA-TOPSIS evaluation model is analyzed. The “Balance—Loss Averse” type (parameters set to $$\alpha =\beta =1$$, $$\delta =1$$, $$\theta =2.25$$) is selected as the benchmark decision-making psychological scenario. This scenario simulates the attitude of decision-makers who are relatively symmetric but slightly averse to gains and losses, and are more sensitive to losses. The evaluation results of grid investment effectiveness for different cities are shown in Figure 2.
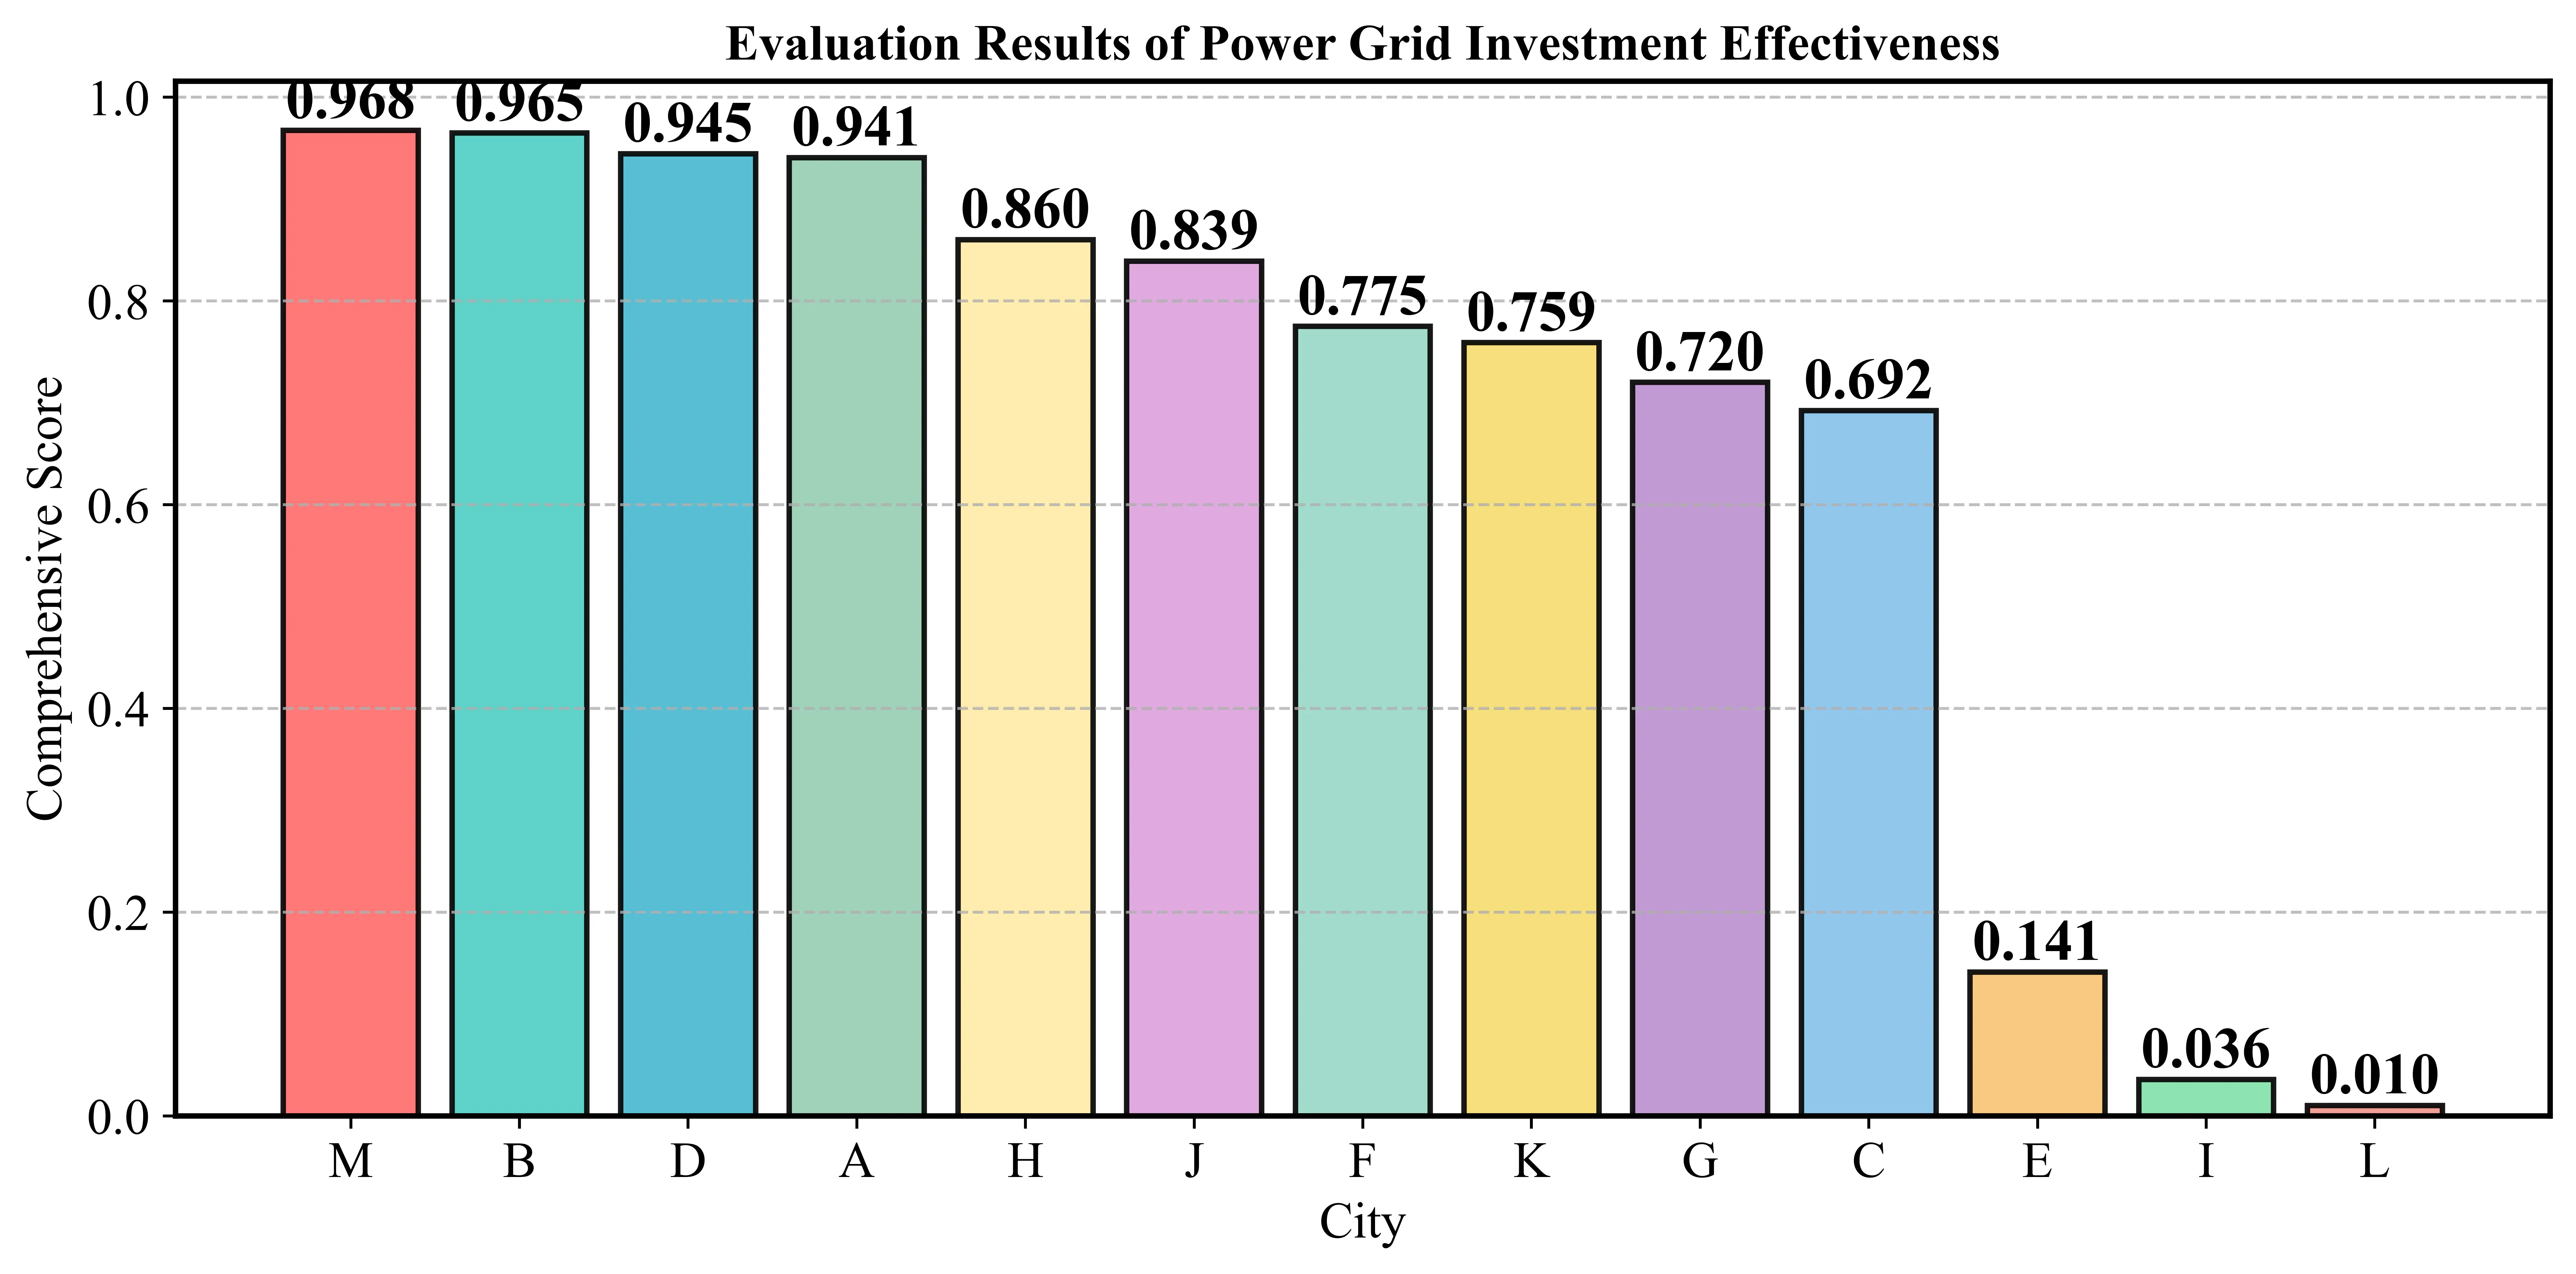
The comprehensive evaluation values of investment effectiveness across urban power grids exhibit a distinct non-uniform distribution and tiered differentiation. With evaluation scores ranging from 0 to 1 (where higher scores indicate superior investment effectiveness), the 13 regions can be broadly categorized into three tiers: The First Tier consists of cities M, B, D, and A. Their scores are closely clustered at a high level, with bar chart heights appearing nearly uniform, demonstrating balanced and leading investment performance. These regions generally excel in high-weight dimensions such as safety (e.g., cross-section transmission capacity, disaster prevention and resistance) and intelligence (e.g., coverage of data acquisition terminals, “four-capability” readiness), while simultaneously balancing low-carbon transition and economic efficiency. Their investment strategies reflect the characteristics of “strengthening foundations, prioritizing intelligence, and promoting synergy”. Specifically, to consolidate the physical grid foundation and enhance resilience, they have vigorously deployed digital infrastructure, using intelligent approaches to holistically address multi-objective challenges involving safety, low-carbon goals, and economics. The Second Tier includes six cities: H, J, F, K, G, and C. Their scores are concentrated in the mid-range but show slight internal fluctuations, reflecting a status of “focused breakthroughs but uneven development”. These cities have adopted a “priority breakthrough” investment strategy. For instance, some regions have invested heavily in new energy integration (low-carbon aspect) but lagged in grid carrying capacity (safety aspect); others have achieved significant results in reinforcing the main grid framework but fell behind in distribution network automation (intelligence aspect) and operational energy efficiency (economic aspect). Their comprehensive evaluation results highlight the necessity of multi-dimensional coordinated development. The Third Tier encompasses cities E, I, and L. Their scores show a significant “gap” compared to the leading regions, particularly for cities I and L. This indicates that the overall investment effectiveness in these areas falls substantially short of the requirements for new power systems, facing severe challenges across multiple key dimensions. Issues may include weak grid structures leading to high safety risks, low asset utilization efficiency resulting in poor investment returns, or severely lagging digital construction unable to adapt to new power system demands. The results suggest that grid investment in these regions requires a comprehensive diagnosis and strategic adjustment to avoid ineffective or inefficient spending in any single direction.
The evaluation values output by the proposed ICPT-GRA-TOPSIS model possess extremely high discrimination, capable of clearly distinguishing regions with different development levels and investment strategies, and precisely identifying leaders (e.g., M, B), catchers-up (e.g., H, J), and those in urgent need of improvement (e.g., I, L). This validates the model’s effectiveness and sensitivity in complex multi-attribute decision-making. The value transformation based on ICPT ensures that the evaluation results are not only based on the relative distance (TOPSIS) and curve shapes (GRA) of objective data, but also incorporate the decision-maker’s non-linear psychological perception of gains and losses. This leads to potential differences between the final ranking and results using traditional TOPSIS or GRA alone, but it aligns more closely with the decision-making logic of “risk aversion” and “prioritizing shortcomings” in actual investment effectiveness evaluation.
5.3. Decision-Making Psychological Sensitivity Analysis
Traditional comprehensive evaluation models usually imply the assumption of “fully rational decision-makers”, overlooking the psychological preferences and differences in risk perception that are prevalent in actual decision-making. To reveal and quantify the impact of these subjective factors on evaluation conclusions, six typical decision-making psychological types are systematically simulated based on the Improved Cumulative Prospect Theory (ICPT) framework, and their sensitivity to the ranking of urban grid development levels is analyzed. The six types are composed of risk attitudes (radical, balanced, prudent) and value orientations (loss-sensitive, gain-sensitive), achieved by adjusting key parameters in the ICPT model. Figure 3 and Figure 4 intuitively display the fluctuations in comprehensive scores and rankings of each city under different decision-making psychologies.
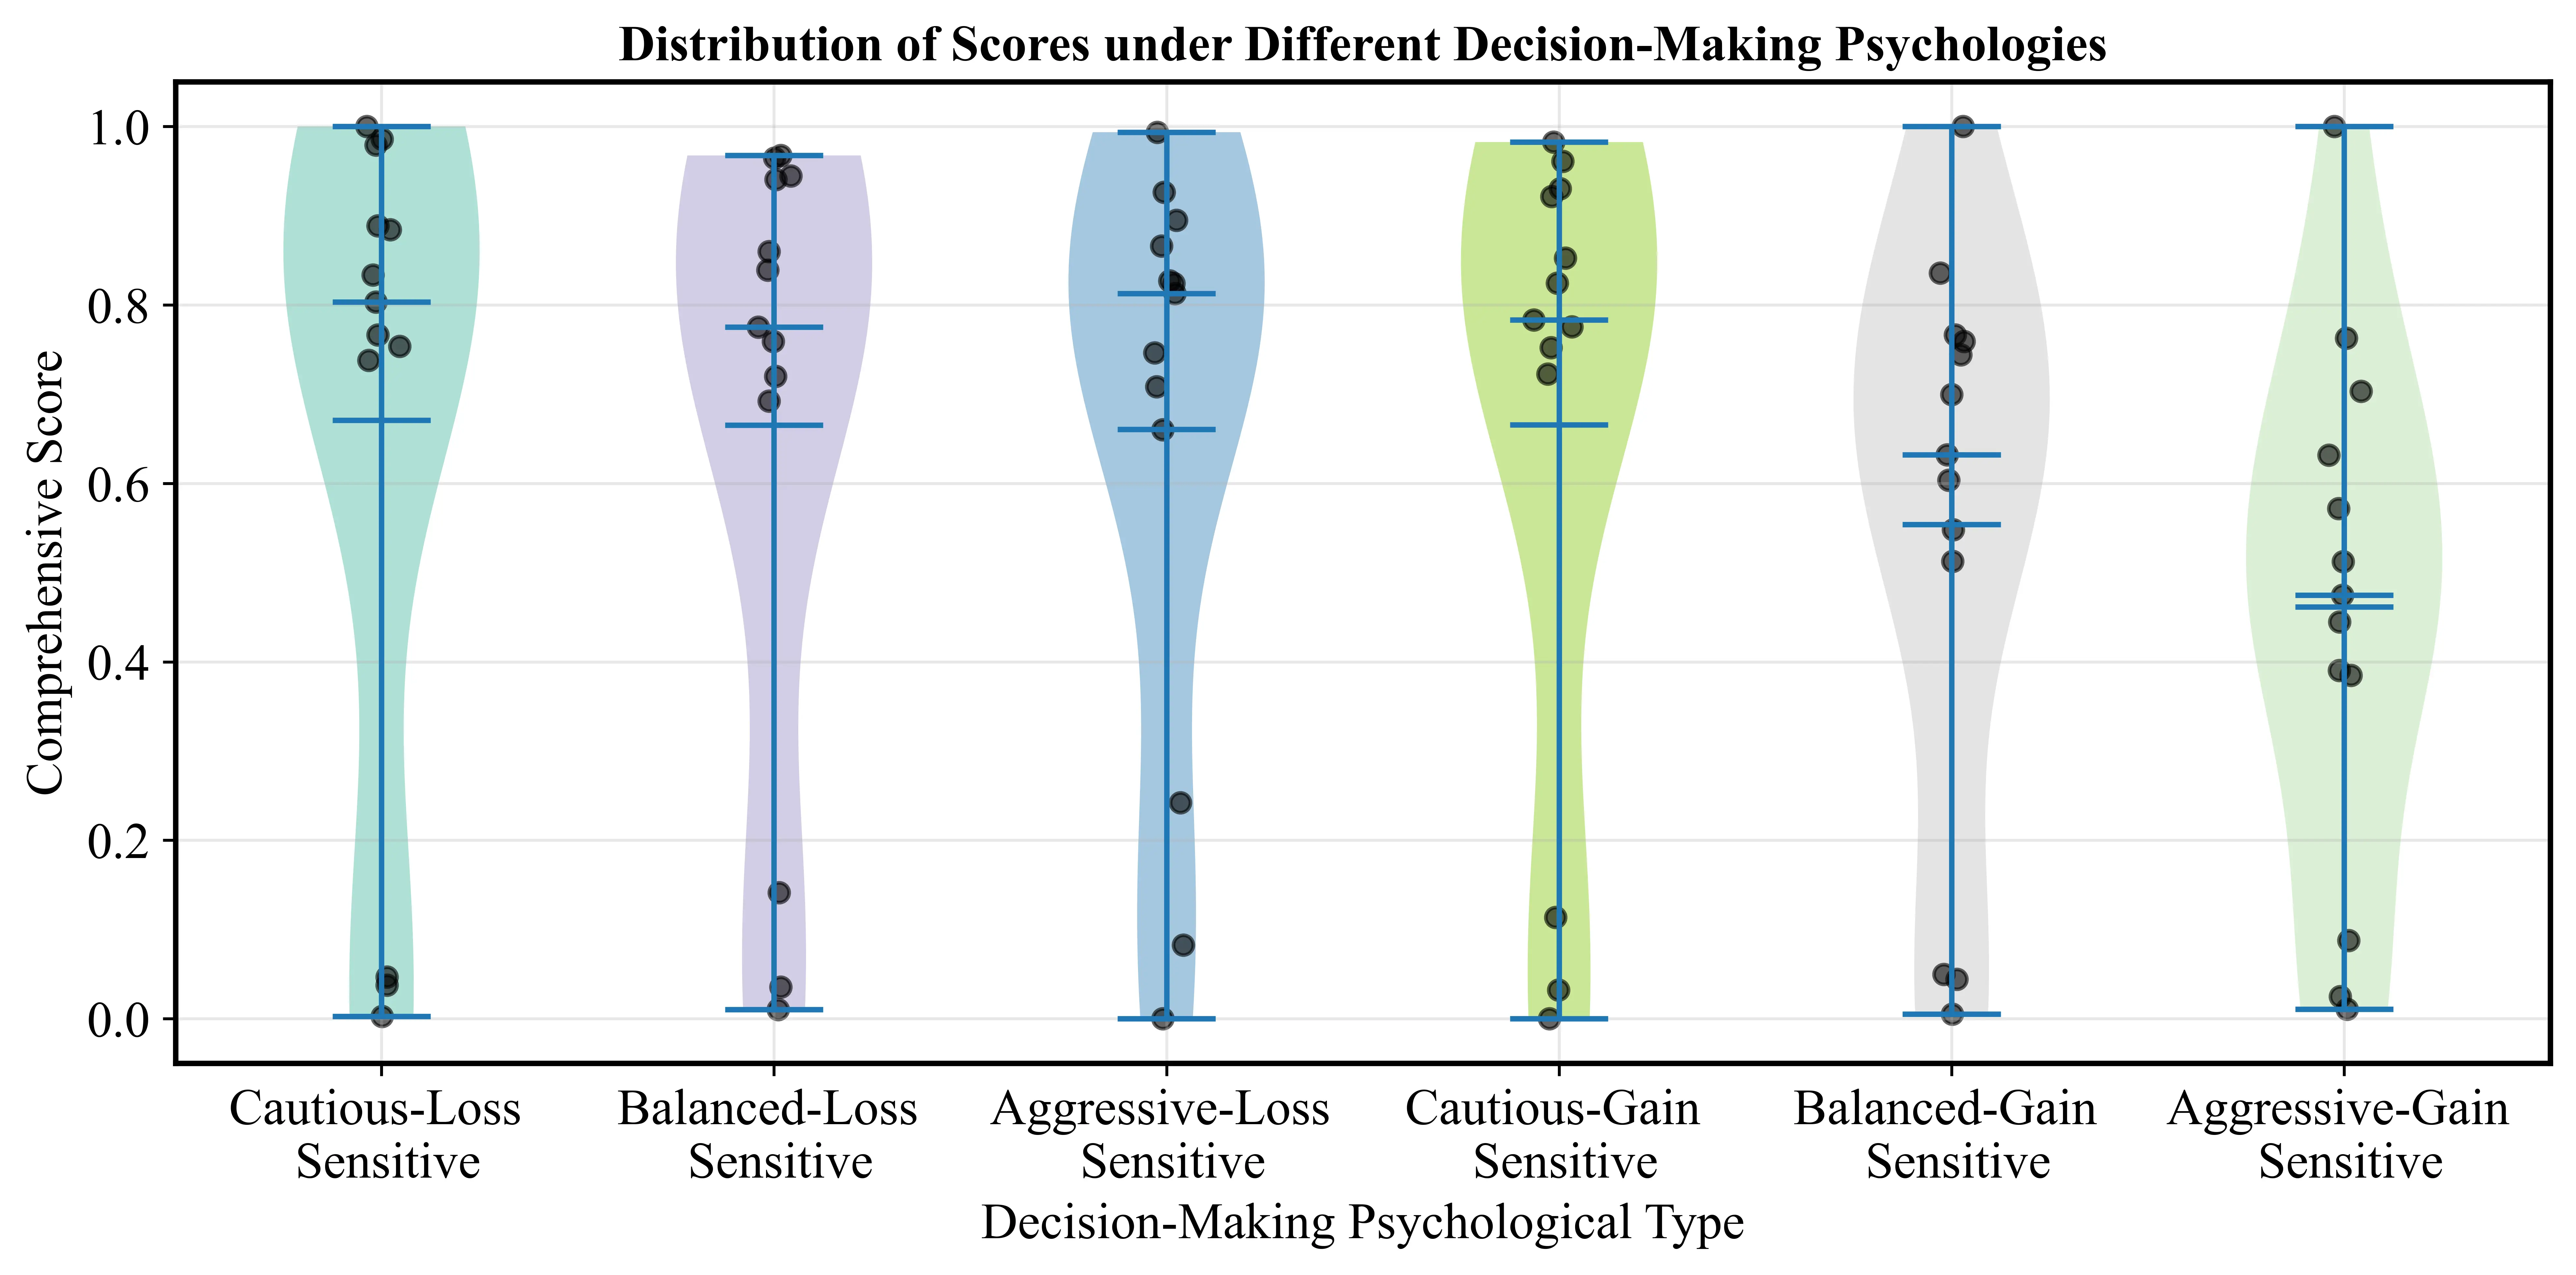
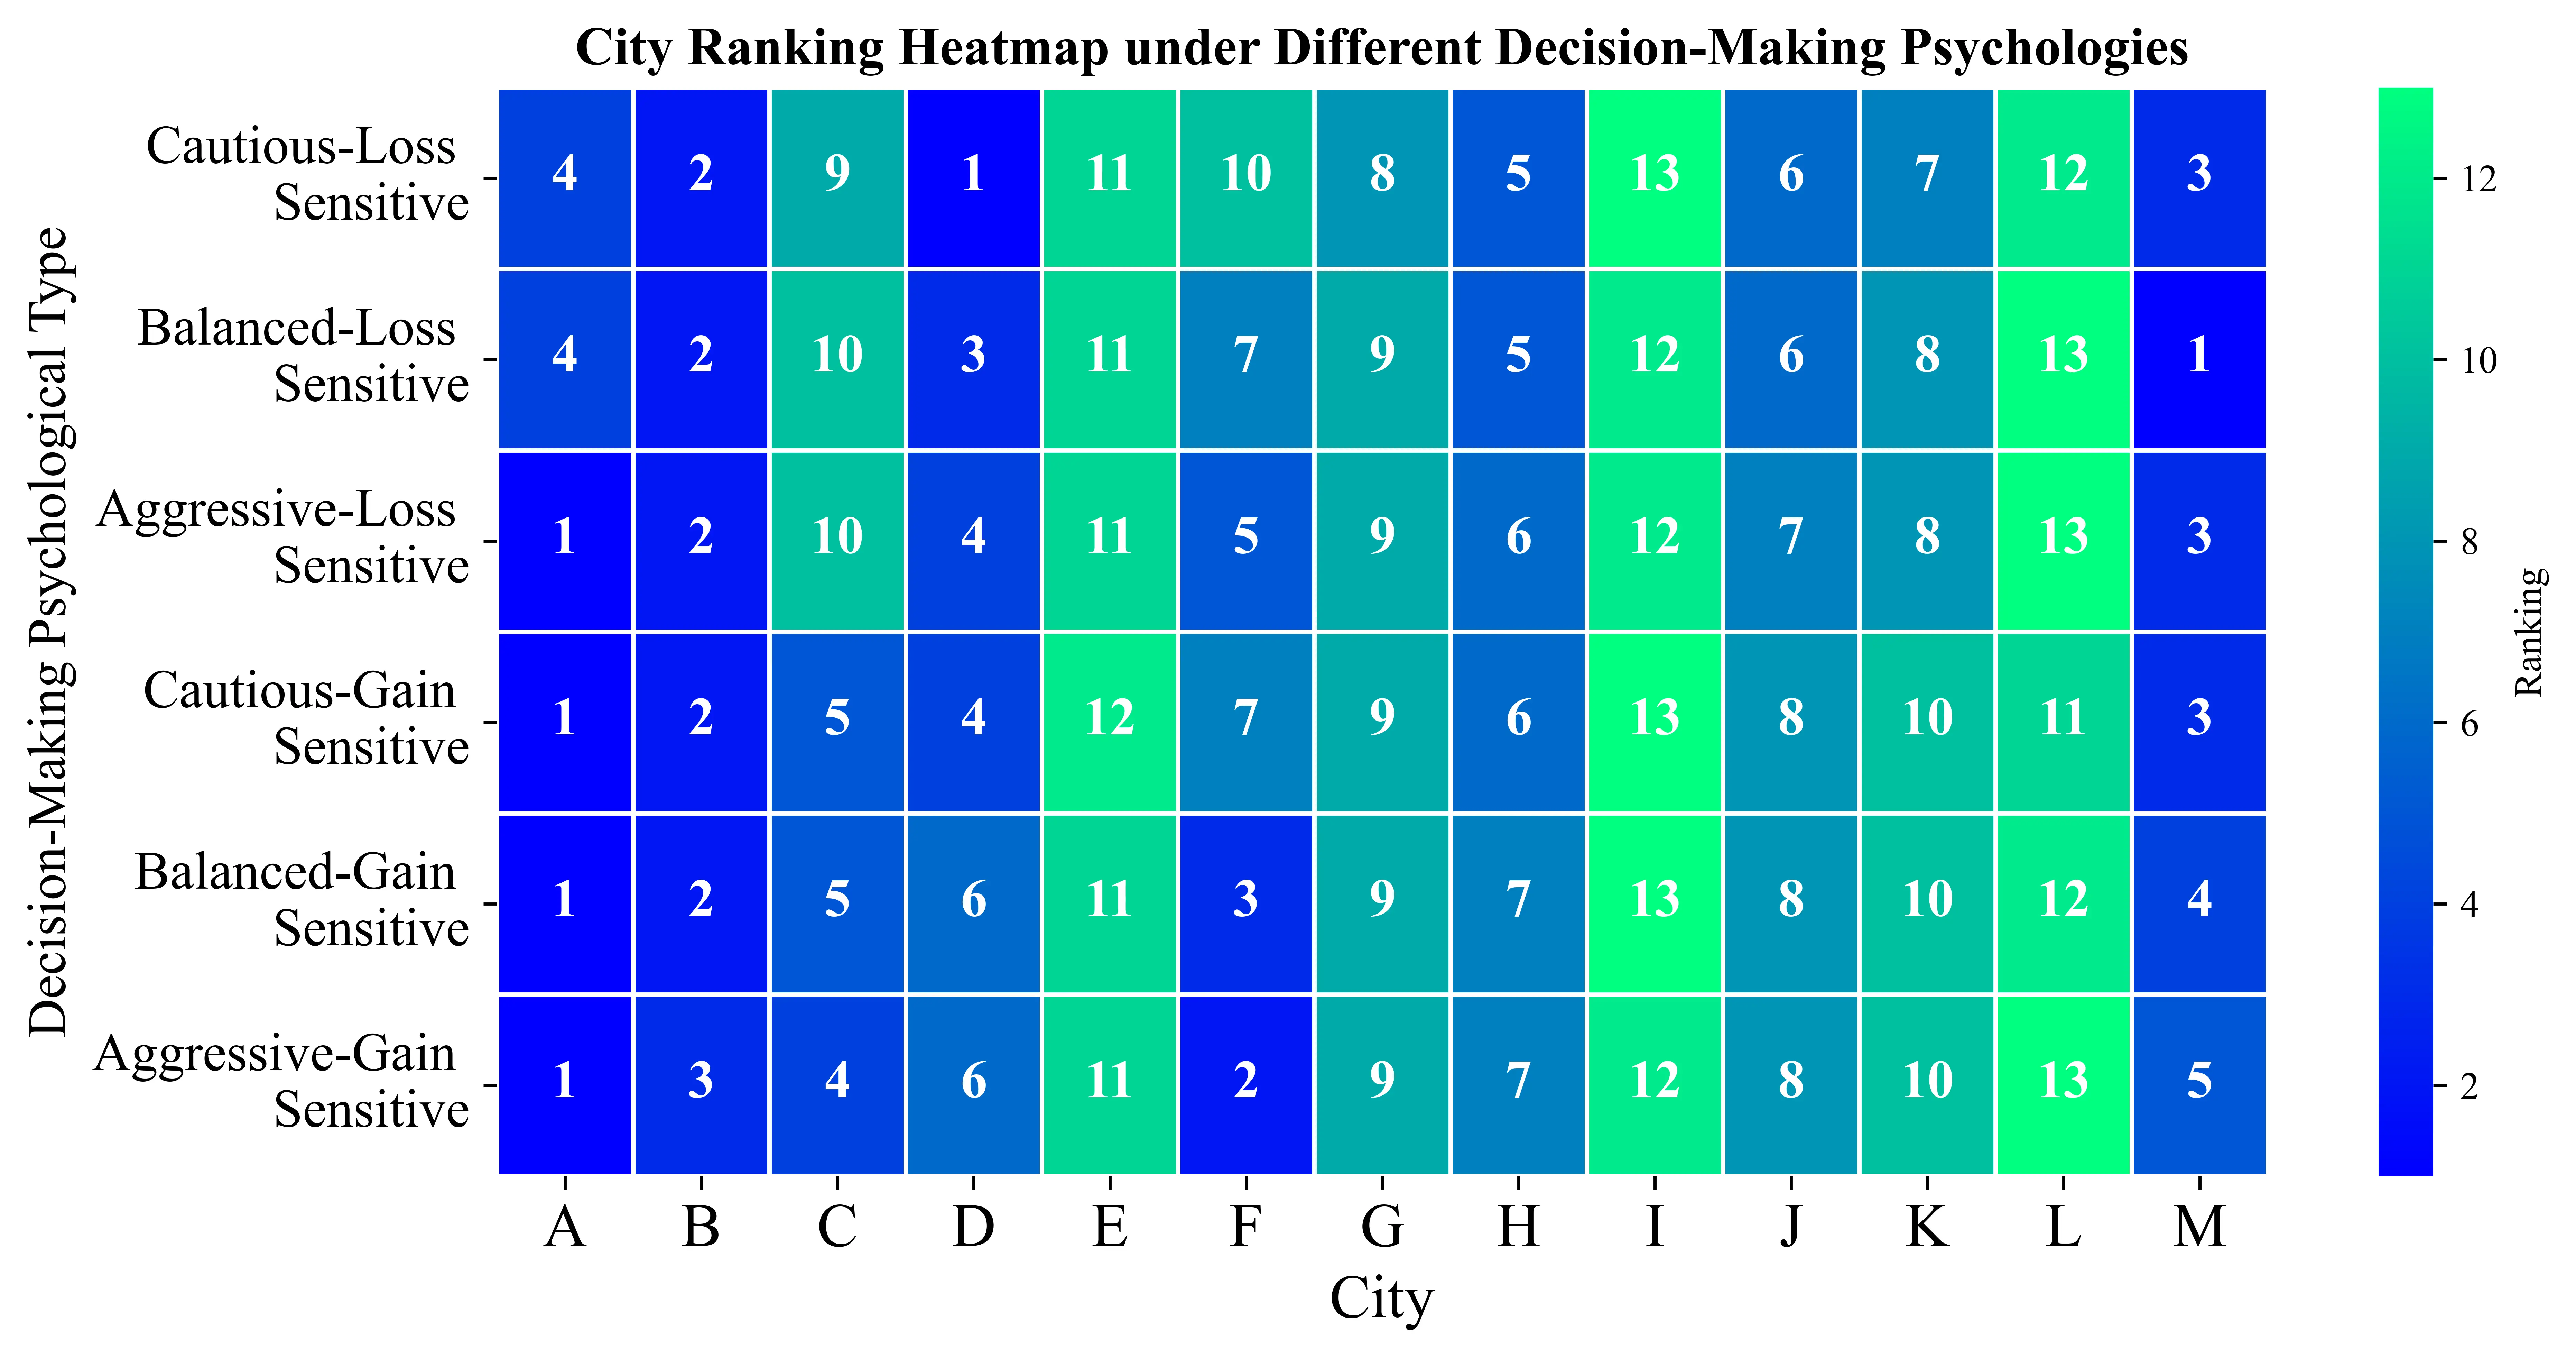
The evaluation results for some cities exhibit high robustness, with their rankings showing minimal impact from changes in decision-making psychology. Cities A and B consistently rank in the top two across all six psychological scenarios, revealing that their grid investment effectiveness possesses an absolute leading advantage. Combined with the previous weight analysis, this indicates that Cities A and B have achieved a high-level balanced development across the four dimensions of low-carbon, security, economy, and intelligence, with no significant shortcomings. Therefore, regardless of whether decision-makers focus more on risk avoidance (loss-sensitive) or on pursuing benefits (gain-sensitive), their comprehensive performance receives consistent recognition. Conversely, Cities I and L rank at the bottom in all scenarios, and City E consistently remains in the lower tier, exposing systematic defects in their investment effectiveness. Under any rational decision-making perspective, they are viewed as objects in urgent need of improvement. Such robust conclusions provide the most reliable basis for decision-makers: Cities A and B can serve as benchmarks to promote their experience, while Cities I, L, and E must undergo a comprehensive diagnosis and fundamental adjustments to their investment strategies.
The rankings of more cities show strong dependence on decision-making psychology, and their evaluation conclusions have a distinct “scenario-specific” nature. This profoundly reflects that the pros and cons of different investment strategies vary with decision goals. From a psychological perspective centered on loss aversion, decision-makers pay high attention to “loss-avoidance” dimensions such as grid security and reliability. City D performs particularly well, ranking 1st under the “Prudent-Loss Sensitive” psychology. This indicates that City D’s investment focuses heavily on improving grid structure and resilience (e.g., section transmission capacity, disaster prevention and resilience capabilities), effectively eliminating key risk points, thus receiving the highest evaluation under the “security first” decision framework. City M also ranks steadily in the top three under this perspective, further confirming its excellent effectiveness in ensuring grid security. From a psychological perspective centered on gain acquisition, decision-makers place more value on the economic returns and efficiency improvements of investment. In this context, City A’s advantage is further expanded, ranking 1st under “Balance-Gain Sensitive” and “Radical-Gain Sensitive” psychologies, highlighting its outstanding performance in improving economic operational efficiency and asset output (e.g., network loss rate, power supply increase per unit investment). Notably, City F’s ranking jumps to 2nd place under the “Radical-Gain Sensitive” psychology, but ranks only between 5th and 10th under all loss-sensitive perspectives. City F performs excellently on “gain-type” indicators such as reducing loss and improving marginal investment efficiency, creating high value perception; however, it has potential risks in “loss-type” indicators, such as grid security reliability (e.g., N-1 pass rate, power supply reliability), so its value is greatly discounted in the eyes of risk-averse decision-makers.
The sensitivity analysis results indicate that a single, fixed ranking cannot adapt to diversified and differentiated strategic decision-making needs. For decision-makers pursuing comprehensive excellence and establishing industry benchmarks, attention should be focused on cities with robust leading rankings, such as A and B, and on learning from their balanced development models. For regions where ensuring grid security and preventing major risks are the primary tasks (e.g., locations of key transmission corridors, areas prone to natural disasters), evaluation results under loss-sensitive psychology should be adopted, focusing on the investment priorities and allocation methods of cities like D and M. For stages or decision-makers where improving investment efficiency and optimizing asset benefits are core goals (e.g., tight investment budgets, extremely high requirements for return rates), reference should be made to evaluation results under gain-sensitive psychology, paying attention to the best practices of cities like A and F on economic benefit indicators, while remaining alert to potential security shortcomings. For cities whose evaluation results are highly dependent on psychological scenarios (such as D, F, K), they themselves need to clarify their investment positioning, and decision-makers should also recognize the complexity of their evaluation to avoid simplistic “good” or “bad” judgments.
6. Conclusions
This paper constructs an evaluation model integrating a combined weighting method with ICPT-GRA-TOPSIS and conducts an empirical study on 13 representative urban power grids in China, yielding the following conclusions:
- (1)
-
The constructed weighting system can scientifically reflect the multi-objective priorities of investment in new power systems. By combining BPNN, CRITIC, and the entropy weight method, quantitative weights were established that prioritize safety as the fundamental premise, balance economy and intelligence, and require coordinated advancement of low-carbon goals. This aligns with the development logic of “safety as the foundation, economy as the constraint, low-carbon as the direction, and intelligence as the pathway”, laying a reasonable basis for evaluation.
- (2)
-
The comprehensive evaluation results clearly reveal tiered differences in the investment effectiveness of different urban power grids. The model effectively distinguishes three typical groups: “multi-objective synergy leaders”, “focused but unbalanced breakthroughs”, and “systemically lagging” entities, validating the model’s effectiveness and discriminative power in complex multi-attribute decision-making.
- (3)
-
Decision-making psychological sensitivity analysis indicates that the merit of investment strategies possesses a “scenario-specific” attribute, providing a critical basis for differentiated decision-making. The performance of some cities is robust, serving as clear benchmarks or targets for improvement; however, the evaluation of many other cities is highly dependent on decision objectives. For instance, strategies emphasizing safety and resilience show significant value from a loss-sensitive perspective, while those focusing on economic benefits are more favored from a gain-sensitive perspective.
These findings suggest that single-dimensional investment evaluation can no longer meet the complex demands of new power systems. The hybrid decision-making framework constructed in this study not only objectively quantifies investment effectiveness but also captures decision-makers’ psychological preferences, providing scientific quantitative support for formulating power grid investment strategies under different risk attitudes. At the industry level, this model helps drive the transformation of power grid investment from “experience-driven” to “data and psychology-integrated driven”, enhancing investment efficiency and risk control capabilities. At the societal level, by guiding investments to precisely target “clean and low-carbon, safe and sufficient, economical and efficient, flexible and intelligent” directions, it contributes to achieving “dual carbon” goals and high-quality energy development. The research results offer powerful tools for power grid enterprises to optimize investment structures and improve resource allocation efficiency, as well as for government departments to formulate differentiated development policies, demonstrating broad application prospects and social value.
Statement of the Use of Generative AI and AI-Assisted Technologies in the Writing Process
During the preparation of this manuscript, the author(s) used DeepSeek in order to refine the language and improve readability. After using this tool, the author(s) reviewed and edited the content as needed and take(s) full responsibility for the content of the published article.
Author Contributions
Y.T.: Data collection, Conceptualization, Methodology, Validation, Case analysis, Resources, Writing—review & editing. Z.G.: Writing—review & editing. Q.R.: Writing—review & editing.
Ethics Statement
Not applicable.
Informed Consent Statement
Not applicable.
Data Availability Statement
The authors do not have permission to share data.
Funding
This research received no external funding.
Declaration of Competing Interest
The authors declare that they have no financial interests or personal relationships with other people or organizations to influence the work reported in this paper.
References
-
REN21. Renewables 2024 Global Status Report; REN21 Secretariat: Paris, France, 2024. [Google Scholar]
-
International Energy Agency (IEA). Power Systems in Transition: Challenges and Opportunities Ahead for Electricity Security; IEA: Paris, France, 2020. [Google Scholar]
-
Wang Q, Xiao H, Tan H, Li Z, Yan F, Mohamed MA. Enhancing pre-disaster resilience of distribution networks considering temporal characteristics of typhoon disasters and cyber-physical collaborative control. Reliab. Eng. Syst. Saf. 2026, 268, 111954. DOI:10.1016/j.ress.2025.111954 [Google Scholar]
-
Panteli M, Mancarella P. The Grid: Stronger, Bigger, Smarter? Presenting a Conceptual Framework of Power System Resilience. IEEE Power Energy Mag. 2015, 13, 58–66. DOI:10.1109/MPE.2015.2397334 [Google Scholar]
-
Bollinger LA, Dijkema GPJ. Evaluating infrastructure resilience to extreme weather events: The case of the Dutch electricity grid. Int. J. Crit. Infrastruct. 2016, 12, 85–105. DOI:10.18757/EJTIR.2016.16.1.3122 [Google Scholar]
-
Goulioti EG, Nikou TΜ, Kontargyri VT, Christodoulou CA. Smart-Grid Technologies and Climate Change: How to Use Smart Sensors and Data Processing to Enhance Grid Resilience in High-Impact High-Frequency Events. Energies 2025, 18, 2793–2793. DOI:10.3390/en18112793 [Google Scholar]
-
Kumar K, Kumar P, Kar S. A review of microgrid protection for addressing challenges and solutions. Renew. Energy Focus 2024, 49, 100572. DOI:10.1016/j.ref.2024.100572 [Google Scholar]
-
Ketterer JC. The impact of wind power generation on the electricity price in Germany. Energy Econ. 2014, 44, 270–280. DOI:10.1016/j.eneco.2014.04.003 [Google Scholar]
-
Brown T, Schlachtberger D, Kies A, Schramm S, Greiner M. Synergies of sector coupling and transmission reinforcement in a cost-optimised, highly renewable European energy system. Energy 2018, 160, 720–739. DOI:10.1016/j.energy.2018.06.222 [Google Scholar]
-
Jamasb T, Pollitt M. Benchmarking and regulation: international electricity experience. Util. Policy 2004, 9, 107–130. DOI:10.1016/S0957-1787(01)00010-8 [Google Scholar]
-
Zournatzidou G, Floros C, Ragazou K. Exploring the Influence of Government Controversies on the Energy Security and Sustainability of the Energy Sector Using Entropy Weight and TOPSIS Methods. Economies 2025, 13, 124–124. DOI:10.3390/ECONOMIES13050124 [Google Scholar]
-
Ai X, Hu H, Ren D, Peng D, Liu H, Xue Y, et al. Improved Fuzzy Evaluation Model and Assessment of Power Grid Development Diagnosis. Electr. Power 2022, 55, 66–75+165. DOI:10.11930/j.issn.1004-9649.202004115 [Google Scholar]
-
Chen L, Zheng Y, Su B, Li M, Li Y, Chen H. Optimal configuration of battery energy storage for resilience enhancement in multi-energy-coupled active distribution networks against typhoon events. J. Energy Storage 2026, 149, 10164. DOI:10.1016/j.est.2025.120164 [Google Scholar]
-
Zhou J, Wu X, Zhang X, Xiao F, Zhang Y, Wang X. Resilience-oriented distributed generation planning of distribution network under multiple extreme weather conditions. Sustain. Energy Grids Netw. 2025, 42, 101675. DOI:10.1016/j.segan.2025.101675 [Google Scholar]
-
Tian H, Zhao L, Guo S. Comprehensive Benefit Evaluation of Power Grid Investment Considering Renewable Energy Development from the Perspective of Sustainability. Sustainability 2023, 15, 8299. DOI:10.3390/su15108299 [Google Scholar]
-
Carley S, Baldwin E, MacLean LM, Brass JN. Global Expansion of Renewable Energy Generation: An Analysis of Policy Instruments. Environ. Resour. Econ. 2017, 68, 397–440. DOI:10.1007/s10640-016-0025-3 [Google Scholar]
-
Alam MJE, Muttaqi KM, Sutanto D. Effective Utilization of Available PEV Battery Capacity for Mitigation of Solar PV Impact and Grid Support With Integrated V2G Functionality. IEEE Trans. Smart Grid 2017, 7, 1562–1571. DOI:10.1109/TSG.2015.2487514 [Google Scholar]
-
Xu Q, Zhao T, Xu Y, Xu Z, Wang P, Blaabjerg F. A Distributed and Robust Energy Management System for Networked Hybrid AC/DC Microgrids. IEEE Trans. Smart Grid 2019. DOI:10.1109/TSG.2019.2961737 [Google Scholar]
-
Ma S, Chen B, Wang Z. Resilience Enhancement Strategy for Distribution Systems under Extreme Weather Events. IEEE Trans. Smart Grid 2018, 9, 1442–1451. DOI:10.1109/TSG.2016.2591885 [Google Scholar]
-
Xie S, Yang Q, Xie E, Zhong W, Zhou G. The coordinated operation strategy for offshore wind farms with energy storage under typhoon conditions considering the operation safety demand of receiver grid. Zhejiang Electr. Power 2023, 42, 17–24. DOI:10.19585/j.zjdl.202310003 [Google Scholar]
-
Wang X, Li X, Li X, Parisio A, Wang C, Jiang T. Soft open points based load restoration for the urban integrated energy system under extreme weather events. IET Energy Syst. Integr. 2022, 4, 335–350. DOI:10.1049/esi2.12064 [Google Scholar]
-
Ai X, Zhao X, Hu H, Wang ZD, Peng D, Zhao L. G1-entropy-independence Weight Method in Situational Awareness of Power Grid Development. Power Syst. Technol. 2020, 44, 3481–3490. DOI:10.13335/j.1000-3673.pst.2019.2429 [Google Scholar]
-
Meng F, Nan Y, Wu Y, Wang X, Huang G, Wang X, et al. Research on comprehensive evaluation method of resilience distribution network based on FAHP—Risk entropy weight method. Results Eng. 2025, 28, 107492. DOI:10.1016/j.rineng.2025.107492 [Google Scholar]
-
Wang Y, Zhou X, Liu H, Chen X, Yan Z, Li D, et al. Evaluation of the Maturity of Urban Energy Internet Development Based on AHP-Entropy Weight Method and Improved TOPSIS. Energies 2023, 16, 5151. DOI:10.3390/en16135151 [Google Scholar]
-
Dai S, Niu D. Comprehensive Evaluation of the Sustainable Development of Power Grid Enterprises Based on the Model of Fuzzy Group Ideal Point Method and Combination Weighting Method with Improved Group Order Relation Method and Entropy Weight Method. Sustainability 2017, 9, 1900. DOI:10.3390/su9101900 [Google Scholar]
-
Treimikien D, Jūrat L, Turskis Z. Multi-criteria analysis of electricity generation technologies in Lithuania. Renew. Energy 2016, 85, 148–156. DOI:10.1016/j.renene.2015.06.032 [Google Scholar]
-
Alamoodi A, Samarraay ASM, Albahri O, Deveci M, Albahri AS, Yussof S. Evaluation of energy economic optimization models using multi-criteria decision-making approach. Expert Syst. Appl. 2024, 255, 124842–124842. DOI:10.1016/J.ESWA.2024.124842 [Google Scholar]
-
Jahan A, Edwards KL. A state-of-the-art survey on the influence of normalization techniques in ranking: Improving the materials selection process in engineering design. Mater. Des. 2015, 65, 335–342. DOI:10.1016/j.matdes.2014.09.022 [Google Scholar]
-
Carlos S, Francisco C, Enrique H. Functional Representation of the Intentional Bounded Rationality of Decision-Makers: A Laboratory to Study the Decisions a Priori. Mathematics 2022, 10, 739–739. DOI:10.3390/MATH10050739 [Google Scholar]
-
Tversky A, Kahneman D. Advances in prospect theory: Cumulative representation of uncertainty. J. Risk Uncertain. 1992, 5, 297–323. DOI:10.1007/BF00122574 [Google Scholar]
-
Wang JJ, Jing YY, Zhang CF, Zhao JH. Review on multi-criteria decision analysis aid in sustainable energy decision-making. Renew. Sustain. Energy Rev. 2009, 13, 2263–2278. DOI:10.1016/j.rser.2009.06.021 [Google Scholar]
-
Ge Y, Xiang P, Hao X. Risk assessment of salt cavern hydrogen storage projects based on spherical fuzzy sets and cumulative prospect theory—TOPSIS. Energy Sustain. Dev. 2026, 91, 101923. DOI:10.1016/j.esd.2025.101923 [Google Scholar]
-
Chai N, Chen Z, Zhou W, Lodewijks G. Sustainable battery supplier selection of battery swapping station using an interval type-2 fuzzy method based on the cumulative prospect theory. J. Clean. Prod. 2025, 495, 145007. DOI:10.1016/j.jclepro.2025.145007 [Google Scholar]
-
Taikun L, Hong W, Yonghui L. Selection of renewable energy development path for sustainable development using a fuzzy MCDM based on cumulative prospect theory: The case of Malaysia. Sci. Rep. 2024, 14, 15082. DOI:10.1038/S41598-024-65982-6 [Google Scholar]
-
Zheng Y, Wu Z, Shu S, Xu J, Fang C, Xie W. Lightning risk assessment model for transmission lines with lift-based improved analytic hierarchy process. IETGener. Transm. Distrib. 2021, 15, 2905–2914. DOI:10.1049/gtd2.12227 [Google Scholar]
-
Zhang Z, Li Y, Wang W, Zhao Q, He J. Advancement assessment of regional grid in main cities towards high penetration of renewable energy: A case in western Inner Mongolia. Energy Rep. 2023, 10, 1434–1449. DOI:10.1016/j.egyr.2023.08.011 [Google Scholar]
-
Strbac G. Demand side management: Benefits and challenges. Energy Policy 2008, 36, 4419–4426. DOI:10.1016/j.enpol.2008.09.030 [Google Scholar]
-
Odetayo B, Maccormack J, Rosehart WD, Zareipour H, Seifi R. Integrated planning of natural gas and electric power systems. Int. J. Electr. Power Energy Syst. 2018, 103, 593–602. DOI:10.1016/j.ijepes.2018.06.010 [Google Scholar]
-
Li Y, Zio E. A multi-state model for the reliability assessment of a distributed generation system via universal generating function. Reliab. Eng. Syst. Saf. 2012, 106, 28–36. DOI:10.1016/j.ress.2012.04.008 [Google Scholar]
-
Olatomiwa L, Mekhilef S, Huda ASN, Ohunakin OS. Economic evaluation of hybrid energy systems for rural electrification in six geo-political zones of Nigeria. Renew. Energy 2015, 83, 435–446. DOI:10.1016/j.renene.2015.04.057 [Google Scholar]
-
Hongliang W, Daoxin P, Ling W. Research on Utility Evaluation of Grid Investment considering Risk Preference of Decision-Makers. Math. Probl. Eng. 2020, 2020, 3568470. DOI:10.1155/2020/3568470 [Google Scholar]