Assessing the Role of Renewable Energy, Environmental Taxes, and Energy Use in Shaping Greenhouse Gas Emissions in Nigeria

Assessing the Role of Renewable Energy, Environmental Taxes, and Energy Use in Shaping Greenhouse Gas Emissions in Nigeria
Received: 03 February 2026 Revised: 04 March 2026 Accepted: 02 April 2026 Published: 20 April 2026

© 2026 The authors. This is an open access article under the Creative Commons Attribution 4.0 International License (https://creativecommons.org/licenses/by/4.0/).
1. Introduction
As the world has become more interconnected over the last few decades, the threat of climate change and environmental destruction has emerged as a critical global challenge. Nations must now prioritize balancing continued economic activity with a reduction in the GHGE [1,2]. The rising concentration of these gases, which is largely a consequence of the utilization of fossil fuels and carbon intensive energy systems, pose an overwhelming threat to the environmental stability as well as the economic and human wellbeing [1]. Therefore, both developed and developing countries have less and less time to implement policies that allow their economies to grow while decoupling themselves from carbon.
As the largest economy and most populated country in Africa, Nigeria faces significant environmental hardships, particularly the increased Global GHGE [3]. The demand for energy, which has led to unstoppable economic growth and population increase, along with urbanization and industrialization, has skyrocketed and is still predominantly met with the consumption of fossil fuels [4]. Despite being a major crude oil producer, Nigeria continues to rely heavily on energy imports (EI), especially refined petroleum products, due to inadequate domestic refining capacity [5]. This reliance on EI not only worsens environmental quality through the burning of fossil fuels and inefficient energy use, but also makes the economy vulnerable to external shocks in energy prices [6].
Nigeria’s energy and financial systems further increase the stress placed on the environment. Environmental degradation has been addressed using a form of market-based policy called environmental taxes (ET) [7,8]. ET are designed to internalize the monetary costs associated with pollution. Moreover, ET serves to increase the cost of ecologically damaging activities related to the production and use of carbon [7,9]. However, the potential of ET to mitigate GHGE in Nigeria is questionable. Weak enforcement, limited tax scope, and institutional constraints undermine the capacity of ETs to contribute meaningfully to emission reduction efforts [10].
In this regard, the use of renewable energy (RNE) has become an important factor in reducing GHGE and supporting Nigeria’s transition toward a low carbon economy [1,11,12,13]. RNE promotes the use of cleaner energy sources such as solar, wind, and hydro, while also improving energy efficiency and supporting environmentally sustainable activities [14,15]. It also has the potential to reduce reliance on fossil fuel based energy and lower the environmental impact of economic activities [16]. Although this potential exists, there remains a gap between the level of RNE adoption and its available capacity in Nigeria, which makes it important to further examine its role in addressing GHGE.
Green technology (GT) plays a critical role in mitigating the adverse environmental effects of GHGE. These technologies improve the efficiency of energy use, promote the production of clean energy, and facilitate the adoption of RNE sources [17]. However, while technological innovation generally contributes to environmental improvement, its expansion, when associated with carbon intensive processes or inefficient implementation, may lead to increased emissions [18]. Therefore, technology innovations within Nigeria, and their overall environmental impacts, help assess the impacts of development and their emissions to provide the information needed to improve the use of technology in Nigeria.
The effectiveness of governance and other policies remains key to the success of policies on the environment and energy. Effective governance, with respect to the environment and the energy transition, facilitates the enforcement of policies, and improves the transparency and the positive deployment of such policies [1,13]. In the Nigerian context, institutional deficiencies, the absence of coherent policies, and inadequate regulatory enforcement have limited the scope of positive actions on the environment [19]. It is therefore important to strengthen institutional development, as this will increase the impact of other policies, the energy transition, and globalization on emissions reductions.
Although the literature on environmental sustainability is expanding, most studies focus on RNE and environmental degradation [15,20]. Empirical evidence examining the combined effects of renewable energy, energy efficiency, and economic growth on GHGE in Nigeria remains limited. A study by [21] on energy efficiency and emissions suggested that future research should investigate the interaction between energy efficiency and renewable energy in shaping emission outcomes. This study aims to fulfill the above-mentioned gap by analyzing the impacts of RNE, GT, ET, EI, and EG on GHGE. The study will aid policymakers address the RNE policies and the effects of energy efficiency on emissions. This study is advantageous for Nigeria’s environmental protection agencies in managing the significant environmental degradation within the country. The present study seeks to examine the correlation among RNE, GT, ET, EI, EG, and GHGE with the following specific objectives:
- (1)
-
To investigate the impact of RNE on GHGE in Nigeria.
- (2)
-
To examine the influence of EI on GHGE in Nigeria.
- (3)
-
To investigate the impact of ET on GHGE in Nigeria.
- (4)
-
To examine the influence of GT on GHGE in Nigeria.
- (5)
-
To investigate the correlations between economic growth and GHGE.
- (6)
-
To examine the influence of the government on GHGE in Nigeria.
In accordance with the aforementioned study objectives, the present research posits the following questions that require resolution:
-
-
Q1. Does RNE influence GHGE in Nigeria?
-
-
Q2. What is the impact of EI on GHGE in Nigeria?
-
-
Q3. What is the effect of ET on GHGE in Nigeria?
-
-
Q4. Does GT contribute to reducing GHGE in Nigeria?
-
-
Q5. How does EG influence GHGE in Nigeria?
-
-
Q6. How does the effectiveness of the government influence GHGE in Nigeria?
Furthermore, this research examines the impact of RNE, GT, ET, EG, EI, and GE on GHGE in Nigeria in the short and long run using the Autoregressive Distributed Lag (ARDL) modelling technique. The ARDL technique enables the capture of the dynamics of the relationships among the variables and the long-term equilibrium position. This research seeks to fill the knowledge gap by providing first-hand Nigerian data on the impacts of policy instruments for the promotion of a green economy and the importation of energy on the economy and the environment, to inform Nigeria’s policy and strategies for the mitigation of the adverse impacts of climate change and the attainment of sustainable economic development.
The remainder of the paper is organized as follows: Section 2 reviews the relevant literature; Section 3 outlines the data and methodology; Section 4 discusses the results; and Section 5 concludes with policy implications, limitations, and directions for future research.
2. Literature Review
The existing body of work on greenhouse gas emissions in Nigeria offers a relatively unified yet complex understanding of the interplay among renewable energy, energy consumption, and environmental taxation. Many scholars note the key role of renewable energy in the process of reducing emissions. For example, ref. [22] note that an increase in renewable energy adoption would reduce carbon emissions, while ref. [23] argue that Nigeria has one of the smallest shares of emissions in the world and, therefore, has a large mitigation potential. These assertions are further supported by the fact that Nigeria’s energy system is still largely dependent on fossil fuels, and Nigeria is likely to maintain a high level of emissions. However, the latest research shed more light on the nuances of this relationship. Ref. [24] note that while renewable energy subsidies may lead to an expansion of the sector, emissions may be less responsive than anticipated based on the way the policies are designed and implemented. This adds a considerable degree of policymaking to what is often treated as a technical problem. Energy use has been well established as one of the primary causes of environmental degradation in Nigeria. Over the decades, empirical data has shown that the higher the energy use, especially fossil fuel use, the higher the emissions. This relationship has been well established in the studies of [25,26]. Nevertheless, some studies suggest the possibility of changing the relationship through the implementation of certain policy measures. For instance, in the study by [27], it was shown that energy taxation, both directly and interactively, could moderate this relationship, albeit to a limited extent, depending on the economic climate. This area of study has produced some mixed results. However, the empirical studies have been rather conservative. In this regard, ref. [28] found that some of the major tax instruments, which include the gas exploration tax and the petroleum profit tax, have limited and in some instances no effect on the levels of emissions. In contrast, spending on the environment appears to have a greater effect. The divergence in perception and reality shows that weaknesses in policy design and implementation exist, and are further strengthened by the claim that Nigeria does not have an adequate institutional configuration for environmental taxation. A smaller but significant portion of the literature looks at energy imports, but the results are still unclear. Ref. [29] states that imports lead to the deterioration of the environment, while ref. [30] find a threshold effect and state that the negative environmental impacts of imports are scale dependent, as well as the economic environment. These opposite results show the need for further study and add to the complexity of the interrelation.
Taken together, the literature provides clear evidence that renewable energy, energy consumption, and environmental taxation are closely linked to greenhouse gas emissions in Nigeria. However, existing studies often treat these factors separately, rely heavily on projections or short time periods, and in some cases produce conflicting results. Consequently, there remains a need for a more integrated empirical analysis that jointly considers these variables while accounting for policy design, institutional quality, and the structural characteristics of the Nigerian economy.
Theoretical Background
A solid part of the literature suggests that a switch from fossil fuels to renewable energy technologies results in a positive change to the environment. Available studies [1,31,32,33] have researched the positive impacts of renewable energy expansion on greenhouse gases. Tighter control of emissions from the implementation of renewable technologies have the best results where energy policies are embedded in strategies throughout the entire energy systems (implementation of energy policies). The link between technology and renewable energy is that technology better enables the adoption of energy-efficient and less polluting production. Refs. [32,34] demonstrated that emissions can be very low where renewable energy is used, and modern technology is taken to be supportive of the system. With respect to economic expansion, the impact is theoretically ambiguous. Earlier studies, refs. [35,36,37] indicate that when growth is coupled with clean production processes and resource use efficiency, growth can support environmental improvements. In countries like Nigeria, which still predominantly rely on fossil fuels, economic growth will unavoidably drive-up emissions unless there is a change in the type of fuels towards cleaner alternatives. Hence, energy consumption is a key variable because without increased efficiency in energy consumption or a shift in the utilized energy fuels, the consumption will contribute to increased energy related environmental harms. Studies have shown the importance of environmental policies, such as taxes, which are aimed at pollutants as a means to economically incentivizing firms to switch to cleaner options. Environmental policies are also aimed at providing funds for the cleanup of polluted environments, as well as for the protection of the environments in which people live. Moreover, recent studies that have recognized the importance of these policies of promoting cleaner production and use of energy. Some of the recent literature has argued that the strength of the policies and the institutional framework is crucial, especially in the developing countries where the enforcement of policies is not rigorous.
3. Data and Research Method
This study utilizes annual data spanning from 1990 to 2024 to examine the influence of renewable energy, environmental tax, economic growth, energy import, and government effectiveness on greenhouse gas emissions in Nigeria. We created a logarithmic version of the research model, which is as follows, in accordance with [38]:
$${lnGHGE}_{it}$$ is greenhouse gas emissions, $${lnRNE}_{it}$$ is renewable energy, $${lnGT}_{it}$$ is green technology, $${lnET}_{it}$$ is environmental tax, $${EG}_{it}$$ is economic growth, $${EI}_{it}$$ is the energy import and $${GE}_{it}$$ is government effectiveness. $${\phi }_{0}$$ denote the intercept while $${\phi }_{1}$$ to $${\phi }_{6}$$ are the coefficients. Finally, $${\delta }_{it}$$ represent the error term. Furthermore, Table 1 presents extensive information regarding the research variable.
Table 1. Variables Information.
|
Abb. |
Variables |
Source |
Measurement |
|---|---|---|---|
|
GHGE |
Greenhouse Gas Emissions |
WDI |
Total greenhouse gas emissions including LULUCF (Mt CO2e) |
|
RNE |
Renewable Energy |
WDI |
Renewable energy consumption (% of total final energy consumption) |
|
GT |
Green Technology |
OECD |
environment related patent |
|
EG |
Economic Growth |
WDI |
GDP per capita (annual % growth) |
|
ET |
Environmental Tax |
OECD |
Environmentally related tax revenue |
|
EI |
Energy Import |
WDI |
Energy imports, net (% of energy use) |
|
GE |
Government Effectiveness |
WDI |
Government Effectiveness: Estimate |
Source: Author’s compilation, OECD = Organisation for Economic Co-operation and Development (https://data-explorer.oecd.org/, accessed on 10 October 2025) and WDI = World Bank (https://databank.worldbank.org/
reports.aspx?source=world-development-indicators&preview=on, accessed on 10 October 2025).
3.1. Variable Selection
3.1.1. Explained Variable
GHGE, measured as total greenhouse gas emissions including land use, land-use change, and forestry (Mt CO2e) (WDI), serves as the dependent variable in this study. It captures the environmental impact of economic, technological, and policy-related factors in Nigeria and reflects the effectiveness of RNE, GT, ET, EI, EG, and GE in mitigating climate change [39,40].
3.1.2. Explanatory Variables
Renewable energy consumption is included in this study as an important indicator of Nigeria’s progress in integrating cleaner energy sources into its overall energy structure. This variable reflects the shift from fossil fuel dependence toward renewable energy adoption, thereby capturing the extent to which the energy mix is transitioning toward more sustainable sources [1,38]. By focusing on renewable energy consumption, the analysis evaluates how increased reliance on clean energy contributes to reducing GHGE and improving environmental sustainability in Nigeria.
Green technology is included to capture the role of technological innovation in promoting environmental sustainability in Nigeria. It is measured using environment related patent data from the OECD, which records patents associated with environmental management, energy efficiency, and low carbon technologies. Although Nigeria is not an OECD member, the database covers selected non OECD countries using standardized patent classification systems. This allows the study to assess how environmentally oriented innovation contributes to reducing greenhouse gas emissions [33,40].
Energy imports, measured as net energy imports as a percentage of total energy use (WDI), capture Nigeria’s reliance on external energy sources. This variable reflects the country’s energy security and the extent to which imported energy contributes to the national energy mix, which can influence greenhouse gas emissions (GHGE) through the type and efficiency of energy utilized [34].
Environmental tax is included to capture fiscal measures aimed at reducing pollution and encouraging sustainable practices. The data are drawn from the OECD environmental tax database, which compiles information for both member and selected non OECD countries, including Nigeria, based on national fiscal statistics and international sources. The variable covers taxes on energy, transport, pollution, and natural resources, reflecting the role of environmental policy in influencing emissions [10].
3.1.3. Control Variables
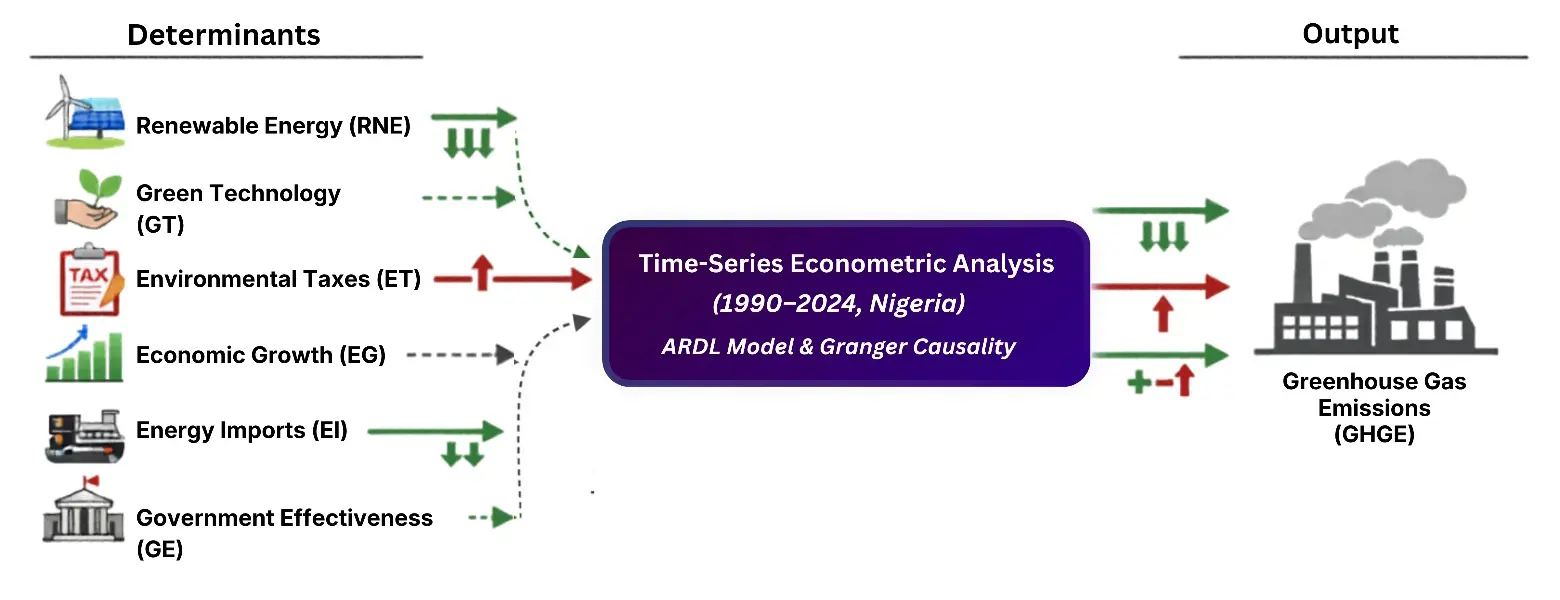
This study incorporates other pertinent control variables to address possible variables that may affect GHGE and to mitigate the impact of the omission of variables. Economic growth is measured as the annual growth rate of GDP per capita and reflects the impact of industrial production and economic activity on energy demand and emissions [1,40]. Government effectiveness is included in the model to capture the level of institutional capacity in implementing environmental policies, which may have a direct impact on the GHGE [41]. Although this indicator is perception based and may involve subjective assessments of governance quality, it remains widely used in empirical studies as a proxy for institutional effectiveness and policy implementation capacity. Collectively, these control variables provide a comprehensive framework for contextualizing the effects of RNE, GT, EI, and ET on environmental sustainability in Nigeria. Figure 1 illustrates the key determinants of GHGE in Nigeria.
3.2. Estimation Techniques
3.2.1. Stationary Test
This examination was performed to determine if the data exhibit stationarity or not. A stationary data method is one in which the distributions of the probability stay constant across time; specifically, if any set of random variables from the sequence is shifted forward by a defined time interval, the joint probability distribution is required to be invariant. If data exhibit non-stationarity, a false regression may occur between the two series. Although they are independent, a very significant link may be shown by regression analysis of these time series. The often used stationary test encompasses the “Dickey–Fuller tests”. The formulae for estimating the stationary test are as follows:
Consequently, the individual construct’s stationarity was analyzed independently, and the estimated models for each construct are shown below:
3.2.2. Granger Causality (GC) Test
Relationship does not indicate causation, since correlation or variance represents an inverted, bilateral interaction: cov(x, y) ≠ cov(y, x). GC, as described by [42], may suggest potential causal relationships among pairs of indicators. X is considered to be a “Granger cause” Y when historical values of X contribute to the forecasting of Yt, provided that the influences of previous values of Y on Yt have already been controlled, i.e., X ≥ Y. Time series must exhibit stationarity to conduct the GC test.
3.2.3. ARDL Bound Test and ARDL Model
The ARDL Model is a versatile econometric technique based on the works of [43], and it can be used when the variables of interest are integrated of order I(1), I(0), or a combination of the two, so long as none of them is I(2). The ARDL framework works well with small sample sizes, calculates different optimal lag lengths for each variable, and has the ability to better capture the dynamic relationships of interest. The framework of the ARDL is a single reduced-form equation, which makes the analysis and interpretation easier, and it addresses some of the possible problems of “multicollinearity and endogeneity” through the bounds testing approach to cointegration [43]. In the absence of cointegration, the ARDL model focuses solely on short-run dynamics without incorporating an error-correction term, and the relationship among variables is examined using the short-run ARDL specification.
Equation (10) represents the short run specification of the ARDL model in first differences, where Δ denotes the differencing operator, and μt is the error term. The lag length of the dependent variable is represented by p, while q denotes the optimal lag structure of the explanatory variables. The difference between short-term level deviations and long-term equilibrium level variances is defined in this study as (ECTerm). The following equations represent the ECM (Equation (11), Equation (12), Equation (13), Equation (14), Equation (15), Equation (16) and Equation (17)):
ECT represents the error correction term. $$\gamma =\left(1-\sum _{i=1}^{q}\partial i\right)$$, speed of adjustment parameter with a negative sign. $${a}_{1i}$$ to $${a}_{7i}$$ represent the short-run dynamic coefficients of the models adjustment to the long-run equilibrium.
4. Results and Discussion
The descriptive statistics of the selected indicator for the study analysis are shown in Table 2. The descriptive outcomes show that all variables display a positive mean except EI, which displays a negative mean. Moreover, EG has the highest value (12.2104) while EI has the lowest value (−333.4). The low standard deviations show little variation around the mean, and positive skewness values for the majority of the variables indicate right-skewed distributions.
Table 2. Descriptive statistics.
|
GHGE |
RNE |
GT |
EG |
ET |
EI |
GE |
|
|---|---|---|---|---|---|---|---|
|
Mean |
6.44061 |
4.4324 |
0.13943 |
1.57072 |
1.68132 |
−230.11 |
−1.0209 |
|
Median |
6.42657 |
4.43675 |
0.10879 |
1.49716 |
0 |
−270.61 |
−0.9983 |
|
Maximum |
6.57248 |
4.48413 |
1.65465 |
12.2104 |
4.71341 |
−66.288 |
−0.8479 |
|
Minimum |
6.3561 |
4.38078 |
−1.109 |
−4.5972 |
0 |
−333.4 |
−1.2132 |
|
Std. Dev. |
0.05233 |
0.03265 |
1.00313 |
3.64672 |
2.10441 |
84.9791 |
0.09114 |
|
Skewness |
0.89577 |
−0.1149 |
0.25651 |
0.51352 |
0.44984 |
0.59894 |
−0.5477 |
|
Kurtosis |
3.0468 |
1.62 |
1.57888 |
3.74779 |
1.25219 |
2.01701 |
2.5248 |
|
Jarque-Bera |
4.68388 |
2.85421 |
3.32907 |
2.35377 |
5.6354 |
3.50171 |
2.07948 |
|
Probability |
0.09614 |
0.24 |
0.18928 |
0.30824 |
0.05974 |
0.17363 |
0.35355 |
|
Sum |
225.421 |
155.134 |
4.88021 |
54.9751 |
58.8462 |
−8053.9 |
−35.732 |
|
Sum Sq. Dev. |
0.09311 |
0.03625 |
34.2134 |
452.151 |
150.571 |
245,529 |
0.28241 |
|
Observations |
35 |
35 |
35 |
35 |
35 |
35 |
35 |
Source: Authors compilation; Outcomes retrieved Eviews-13; Note: GHGE = Greenhouse Gas Emissions; RNE = Renewable Energy; GT = Green Technology; EG = Economic Growth; ET = Environmental Tax; EI = Energy Import; GE = Government Effectiveness.
The findings in Table 3 show that (GHGE, RNE, GT, ET, and EI) are stationary at the first difference, while EG and GE are stationary at the level, as confirmed by both tests. Since none of the variables are stationary at the second difference, this validates the application of the ARDL model. After successfully completing the unit root tests, it is necessary to do the cointegration test to demonstrate the long-term relationship between variables.
Table 3. Unit root test.
|
ADF Unit Root |
Phillip Perron Unit Root |
|||
|---|---|---|---|---|
|
Level |
1st Diff |
Level |
1st Diff |
|
|
GHGE |
−2.457 |
−6.707 *** |
−2.439 |
−6.796 *** |
|
RNE |
−1.542 |
−6.279 *** |
−1.528 |
−6.330 *** |
|
GT |
−1.955 |
−6.692 *** |
−1.948 |
−6.676 *** |
|
EG |
−3.936 *** |
−4.115 *** |
||
|
ET |
−1.575 |
−6.931 *** |
−1.616 |
−6.209 *** |
|
EI |
0.124 |
−6.315 *** |
0.436 |
−6.365 *** |
|
GE |
−3.390 ** |
−3.408 * |
||
Source: Authors compilation; Outcomes retrieved Eviews-13; Note: GHGE = Greenhouse Gas Emissions; RNE = Renewable Energy; GT = Green Technology; EG = Economic Growth; ET = Environmental Tax; EI = Energy Import; GE = Government Effectiveness. ***, ** and * denote 1%, 5% and 10% level of significance, respectively.
The ARDL bound test is presented in Table 4. The null hypothesis of no levels relationship is rejected at the 10%, 5%, 2.5% and 1% significance levels, confirming a robust long-run cointegrating relationship among the variables.
Table 4. ARDL Bound Test.
|
F-Bounds Test |
Null Hypothesis: No Level Relationship |
|||
|---|---|---|---|---|
|
Test Statistic |
Value |
Sig. |
I(0) |
I(1) |
|
F-statistic |
5.15478 |
10% |
2.2 |
3.09 |
|
5% |
2.56 |
3.49 |
||
|
2.50% |
2.88 |
3.87 |
||
|
1% |
3.29 |
4.37 |
||
Source: Authors compilation; Outcomes retrieved Eviews-13.
The ARDL estimation results reported in Table 5 indicate that the selected explanatory variables exert heterogeneous effects on GHGE in both the long and short run. These emissions reflect the importance of RNE and other variables, such as green tech and environmental taxes, as well as economic growth, government efficiency, and energy imports, on emissions. The estimated ECT is negative and significantly so, which indicates that the variables possess a consistent long-run relationship. In particular, the ECT coefficient of −0.741 shows that about 74% of the short-run disequilibrium is corrected in one instance, indicating a swift movement towards the long-run equilibrium.
Negative and statistically significant effects on GHGE, both in the short and long run, were found for RNE. In the long run, 1 percent increase in RNE is associated with a 1.23 percent reduction in GHGE. While the magnitude appears relatively large, it may reflect underlying structural characteristics of the Nigerian economy, particularly its strong reliance on fossil fuel based energy systems. This is especially true in a situation where the share of RNE is low, and modest adoption of renewable energy can lead to very significant emissions reductions. This suggests that the estimated elasticity may be capturing a transition effect rather than a purely proportional relationship. In the short run, 1 percent increase in RNE is associated with a 1.35 percent reduction in greenhouse gas emissions. This indicates that changes in renewable energy consumption can generate relatively immediate environmental benefits, likely due to the displacement of fossil fuel based energy sources in the energy mix. In the Nigerian context, where conventional energy remains dominant, even small increases in renewable energy use may lead to noticeable reductions in emissions in the short term. These findings are consistent with the conclusions of [1], who also reported that RNE consumption contributes to emission mitigation in the country.
In both the long run and short run, GT shows a negative effect, although statistically, the impact is negligible, on GHGE. While it is theoretically possible that advancements in technology could lead to a decrease in emissions, the negligible impact reinforces that during the time frame of the study, the diffusion and the scale of the green technologies may have been too small to impact GHGE. Similar to the findings of [44], the research results also confirm the same trend. The insignificance of green technology indicates that, although legislative objectives, the implementation and dissemination of clean technologies in Nigeria are constrained by elevated prices, insufficient infrastructure, and a reliance on fossil-fuel-dependent systems.
ET exhibit a weak but positive association with GHGE across both short- and long-run horizons. Specifically, a 1% increase in ET is associated with an approximate 0.01% increase in GHGE in the long run, while a similar increase in ∆ET yields a comparable effect in the short run. This positive relationship suggests that ET may not yet be effective in curbing emissions in Nigeria. One plausible explanation lies in the presence of adjustment costs, where firms initially respond to new tax regimes by restructuring production processes, which may temporarily increase emissions. Furthermore, structural inefficiencies, weak enforcement mechanisms, and the potential misallocation of tax revenues may limit the effectiveness of such fiscal instruments. In developing economies such as Nigeria, where institutional capacity and regulatory enforcement remain constrained, environmental taxes may inadvertently coincide with increased industrial activity and energy consumption, thereby offsetting their intended environmental benefits. This finding is consistent with prior empirical evidence [10].
EG exhibits a statistically insignificant effect on GHGE in the long run, as indicated by the positive but insignificant coefficient, suggesting that economic expansion does not exert a meaningful long-term influence on emission levels. Conversely, in the near term, ΔEG coefficient is negative and statistically weak significant at the 10% level (β = −0.0022, p = 0.0965), implying that economic growth of 1% achieves 0.22% decrease in GHGE in the near run. This short-term improvement may be related to Nigeria’s growing investments in cleaner energy projects and to policy changes that encourage energy diversification. Moreover, there has been a reduction in the use of diesel generators (and therefore a reduction in emissions) while the Solar Power Naija project and the off-grid renewables have had an impact on the economy. In the long term, however, the minimal importance attributed to growth suggests that there cannot be a continued decrease in emissions solely as a result of economic growth. The pattern of growth in Nigeria is closely linked to industrialization, the rise of urban centers, and the growing demand for energy (predominantly fossil fuels). Furthermore, the positive long term association of [1] with emissions and negative in the short term for Pakistan goes with this result.
EI exhibits a positive effect on GHGE in the long run but a negative impact in the short run. In the long run, a 1 percent increase in energy imports is associated with a 0.0005 percent rise in GHGE, suggesting that sustained reliance on imported energy, largely composed of fossil fuel based petroleum products, may contribute to higher emission levels over time. However, in the short run, a 1 percent increase in ΔEI leads to a 0.001 percent decline in emissions. The short-term decrease may signify an adequate role for energy imports in temporarily balancing the domestic energy supply and relieving the inefficiencies related to local production processes. In the Nigerian case, where domestic refining and electricity generation have been constrained operationally over time, imported energy may, in the short term, help avoid reliance on very inefficient substitutes, even though the imported energy could result in greater emissions in the long term. This corroborates the findings of [45,46].
GE shows a negative but statistically insignificant impact on GHGE in the short and long run. While stronger institutional quality is expected to improve environmental governance, the empirical evidence suggests that government effectiveness alone does not have a direct, measurable impact on emissions reduction during the study period. The negligible impact of government efficacy suggests that institutional capacity has not yet led to concrete environmental improvements, perhaps owing to governance impediments, policy implementation deficiencies, and regulatory discrepancies.
Table 5. ARDL estimations.
|
βeta |
T Statistics |
p-Value |
|
|---|---|---|---|
|
Long run |
|||
|
RNE |
−1.229821 ** |
−2.162641 |
0.0429 |
|
GT |
−0.012842 |
1.537028 |
0.14 |
|
EG |
0.001439 |
0.812359 |
0.4261 |
|
ET |
0.012148 * |
1.814585 |
0.0846 |
|
EI |
0.000549 *** |
−3.527848 |
0.0021 |
|
GE |
−0.059436 |
−0.694869 |
0.4951 |
|
Short run |
|||
|
∆RNE |
−1.347076 *** |
−4.179685 |
0.0005 |
|
∆GT |
−0.009982 |
−1.102657 |
0.2839 |
|
∆EG |
−0.002214 * |
−1.748501 |
0.0965 |
|
∆ET |
0.010868 ** |
2.385079 |
0.0276 |
|
∆EI |
−0.000992 *** |
−4.45016 |
0.0003 |
|
∆GE |
−0.051336 |
−0.918582 |
0.3698 |
|
ECT |
−0.740644 *** |
−4.840303 |
0.0001 |
Source: Authors compilation; Outcomes retrieved Eviews-13; Note: RNE = Renewable Energy; GT = Green Technology; EG = Economic Growth; ET = Environmental Tax; EI = Energy Import; GE = Government Effectiveness; ECT = Error Correction Term. ***, ** and * denote 1%, 5% and 10% level of significance respectively.
In addition, we conducted diagnostic analyses to determine the robustness of the ARDL model, the results of which are presented in Table 6. The “Breusch-Pagan-Godfrey test” shows there is no heteroscedasticity (F = 2.234079, p = 0.0692), and the “Breusch-Godfrey LM test” shows no evidence of serial correlation (F = 1.351322, p = 0.2552). In addition, the “Ramsey RESET test” reports a p-value of 0.0701, which suggests that the model is generally well specified. Although this result is not significant at the conventional 5 percent level, it is marginally significant at the 10 percent level, which may indicate the presence of minor functional form misspecification. Overall, the diagnostic results affirm the dependability of the constructed model.
Table 6. Diagnostic results.
|
Diagnostic Tests |
F-Statistic |
p-Value |
Decision |
|---|---|---|---|
|
Breusch-Pagan-Godfrey |
2.234079 |
0.0692 |
No heteroscedasticity |
|
Breusch-Godfrey Test |
1.351322 |
0.2552 |
No serial correlation exists |
|
Ramsey RESET Test |
2.672821 |
0.0701 |
The model is properly specified |
Source: Authors compilation; Outcomes retrieved Eviews-13.
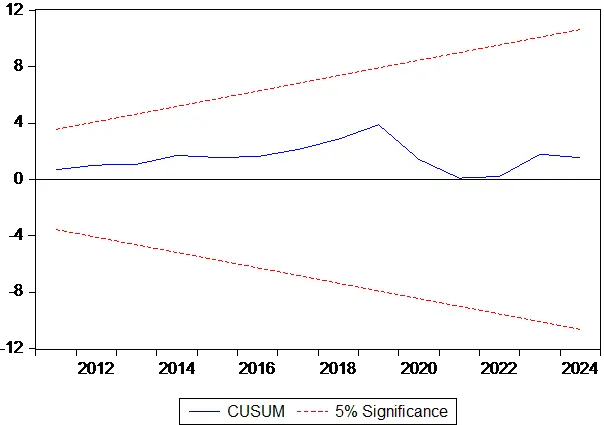
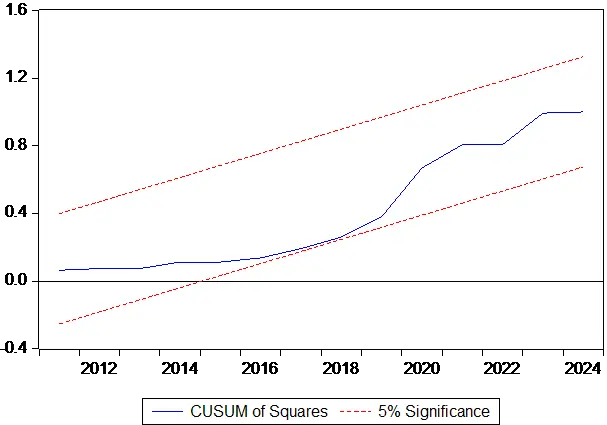
Furthermore, Figure 2 shows that throughout the course of the investigation, “CUSUM and the CUSUM of square tests” stayed inside the crucial boundaries at the 5% significant level, suggesting model stability. Therefore, we may conclude that the ARDL models’ long-term and short-term coefficients are both stable.
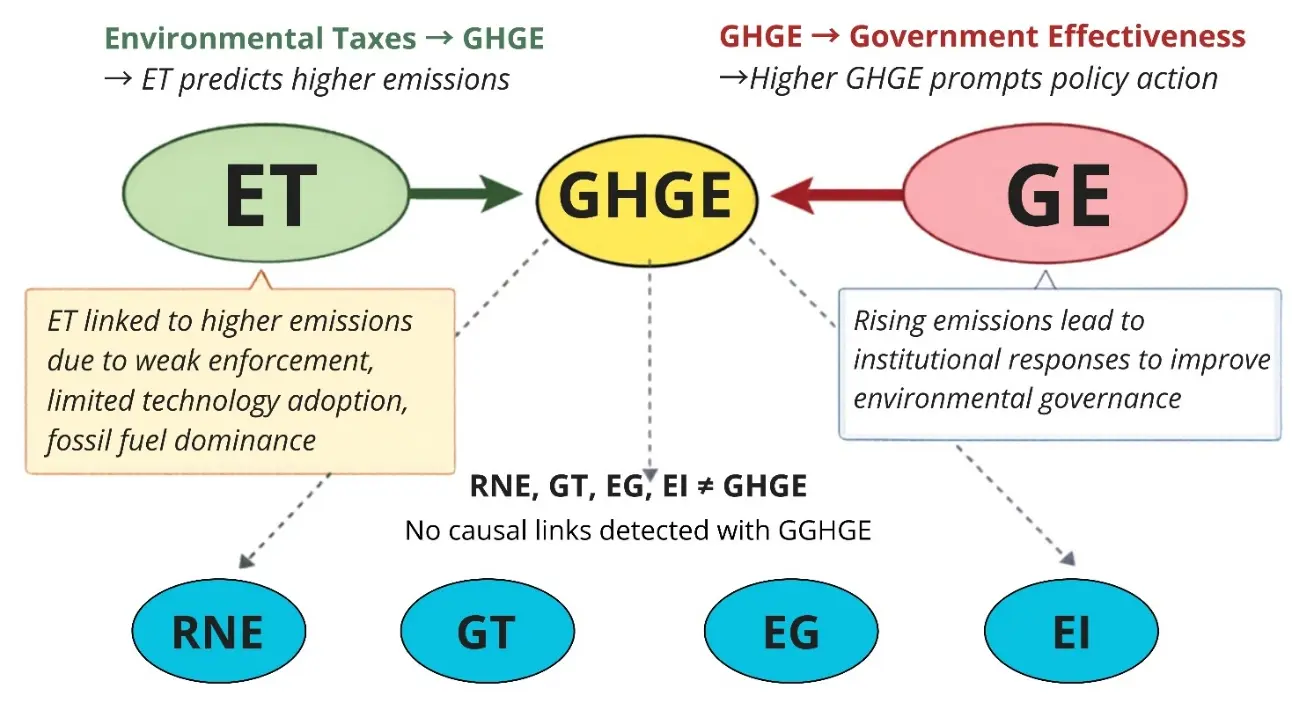
Furthermore, as presented in Table 7, this study employed pairwise Granger causality tests to examine the directional causal relationships among the variables and to strengthen the robustness of the empirical analysis. The results reveal two unidirectional causal relationships. Specifically, the unidirectional Granger causality from ET to GHGE (→) indicates that changes in ET policies have predictive power over emission dynamics in Nigeria. However, this causality does not imply that ET necessarily reduces emissions. When considered alongside the positive outcomes of the ARDL analysis, the evidence suggests that ET, in its current form, is associated with an increase rather than a reduction in emissions. This outcome may reflect structural and institutional challenges, including weak policy enforcement, limited technological adoption, and the dominance of fossil fuel–based production systems. Consequently, while ET influences emission patterns, its effectiveness as a mitigation tool remains constrained in Nigeria. Likewise, the unidirectional causality from GHGE to GE (←) indicates that rising emission levels may prompt institutional responses aimed at strengthening environmental governance. Increasing environmental pressure may therefore encourage policymakers to implement stricter regulations, improve policy enforcement, and promote sustainable development initiatives to address environmental challenges in Nigeria. However, no causal relationships are identified from RNE, GT, EG and EI to GHGE (≠) suggesting that these variables do not exhibit predictive causality with emissions within the examined framework. Additionally, Figure 3 presents a visual representation of the results.
Table 7. Causality estimations.
|
Null Hypothesis |
F-Statistic |
Prob. |
Causality Direction |
|---|---|---|---|
|
RNE ≠ GHGE |
0.02493 |
0.8756 |
≠ |
|
GHGE ≠ RNE |
0.00972 |
0.9221 |
|
|
GT ≠ GHGE |
0.46918 |
0.4985 |
≠ |
|
GHGE ≠ GT |
0.00019 |
0.9891 |
|
|
EG ≠ GHGE |
0.26452 |
0.6107 |
≠ |
|
GHGE ≠ EG |
2.41734 |
0.1301 |
|
|
ET ≠ GHGE |
3.42128 |
0.0739 |
→ |
|
GHGE ≠ ET |
0.1733 |
0.6801 |
|
|
EI ≠ GHGE |
0.66302 |
0.4217 |
≠ |
|
GHGE ≠ EI |
0.04772 |
0.8285 |
|
|
GE ≠ GHGE |
0.30177 |
0.5867 |
← |
|
GHGE ≠ GE |
3.04927 |
0.0907 |
Source: Authors’ compilation; Outcomes retrieved Eviews-13; Note: GHGE = Greenhouse Gas Emissions; RNE = Renewable Energy; GT = Green Technology; EG = Economic Growth; ET = Environmental Tax; EI = Energy Import; GE = Government Effectiveness. Causality direction: “→” denotes first-to-second causality, “←” represents second-to-first causality, and “≠” indicates no causality.
5. Conclusions
This study shows that the selected factors significantly influence GHGE in Nigeria from 1990 to 2024. In the long run, RNE and EI significantly reduce GHGE, supporting Nigeria’s transition toward a low-carbon economy, while environmental taxes exhibit a positive correlation with GHGE. However, GT, EG, and GE exhibit insignificant long-run effects. In the short run, RNE, ET, EG, and EI significantly affect GHGE, underscoring the importance of short-term policy interventions.
Additionally, the causality analysis shows two causal relationships: from ET to GHGE and from GHGE to GE, suggesting that increasing emissions may trigger some form of institutional and regulatory response. The lack of causality between the other variables and GHGE indicates that their impacts result from long-term structural processes rather than short-term predictive ones.
5.1. Practical Implications
Based on the findings of this study, the following policy implications are proposed to strengthen Nigeria’s transition toward a low-carbon and environmentally sustainable economy.
First, RNE should remain central to Nigeria’s emission mitigation strategy, given its effectiveness in both the short and long run. To maximize its impact, policymakers should strengthen regulatory frameworks and institutional capacity to ensure effective enforcement, project implementation, and sectoral accountability. Furthermore, investment in enabling infrastructure, including energy storage systems and decentralized energy solutions, is essential to support integration and expand access to clean energy, particularly in underserved regions. Complementing these efforts with research and development initiatives and technical training will enhance domestic technological capabilities and facilitate the sustained adoption of renewable energy. Collectively, these measures can accelerate a resilient and sustainable energy transition while aligning environmental objectives with long-term economic development.
Second, given the contribution of imported energy to the mitigation of GHGE, Nigeria should prioritize energy diversification toward cleaner and more efficient sources of energy. Nigeria should adopt policies that strengthen energy infrastructure and access to cleaner imported energy and that minimize gas flaring to reduce the inefficiencies of domestic energy. Over the long run, these policies will align with the boosting of renewables in Nigeria and will improve energy security and to some degree emittance of harmful gases.
Third, the weak relationship between environmental tax and emissions highlights the need for improved policy design and implementation. Strengthening regulatory enforcement and ensuring that environmental fiscal measures effectively target pollution intensive activities may enhance their role in reducing emissions.
Furthermore, Policymakers need to direct attention to the formulation of incentives and support mechanisms for the creation, adoption, and diffusion of green technologies, such as environmentally oriented patents, innovations for increased energy efficiency, and clean production technologies, even if immediate measurable impacts on emissions are modest.
Finally, there is a need to strengthen Nigeria’s Institutional Capacity and Governance Effectiveness. Although there is no direct impact of government effectiveness on GHGE, the causation analysis confirms that increasing GHGE tends to trigger an institutional reaction. Nigeria needs to enhance its regulatory frameworks, policy coherence, and the institutional strengthening of its monitoring and evaluation systems to support a pragmatic approach to the implementation of the competing policy on climate and energy. These are the changes that will enable Nigeria to honour its commitments towards reductions of greenhouse gas emissions, environmental sustainability and economic resilience.
5.2. Limitations
This research examines the impact of RNE, GT, EG, ET, EI, and GE on GHGE in Nigeria, using data from 1990 to 2024. As a result, other relevant factors such as renewable energy consumption, urbanization, and environmental regulation stringency are not considered. The ARDL strategy yields strong findings; however, further research may use different methodologies or expand the study to panel data across African economies for more comprehensive insights. In addition, future studies may incorporate other variables such as FDI, industrial sector composition, and regulatory stringency that may have an impact on GHGE. Moreover, following the studies of [47], future research could explore the spatial optimization of new green infrastructure in Nigeria to expand on the findings regarding the low-carbon transition. It is also important to acknowledge that relying on national-level aggregate macroeconomic data may obscure significant regional, state-level, or sector-specific variations within Nigeria’s highly diverse economic landscape. This limitation suggests that future research could benefit from disaggregated state-level or sectoral data analysis, if available, to capture intra-national variations more accurately and to provide more elaborate policy recommendations. We also acknowledge that exploring alternative lag structures could provide further robustness. As a result, future studies should use a larger data span, include lag selection in their research process, and add structural breaks in their analysis.
Author Contributions
P.O.I. wrote the manuscript, while O.A.S. and H.O. administered and supervised the manuscript.
Ethics Statement
This paper does not contain any studies with human participants performed by the author.
Informed Consent Statement
Not applicable.
Data Availability Statement
Data sources have been made available in the manuscript.
Funding
This research received no external funding.
Declaration of Competing Interest
The authors declare that they have no known competing financial interests or personal relationships that could have appeared to influence the work reported in this paper.
References
- Ali M, Igunnu PO, Tursoy T. Do green finance and energy prices unlock environmental sustainability in Pakistan? Fresh evidence from RALS-EG cointegration. OPEC Energy Rev. 2024, 48, 370–390. DOI:10.1111/opec.12319 [Google Scholar]
- Li S, Samour A, Irfan M, Ali M. Role of renewable energy and fiscal policy on trade adjusted carbon emissions: Evaluating the role of environmental policy stringency. Renew. Energy 2023, 205, 156–165. DOI:10.1016/j.renene.2023.01.047 [Google Scholar]
- Pona HT, Duan X, Ayantobo OO, Tetteh ND. Environmental health situation in Nigeria: Current status and future needs. Heliyon 2021, 7, e06330. DOI:10.1016/j.heliyon.2021.e06330 [Google Scholar]
- Akpoghelie EO, Metu AG, Chukwuka SM, Chiadika EO, Keremah SC. Energy consumption, human development, and industrial sector performance in Nigeria. In Energy Efficiency in Critical Times; Elsevier: Amsterdam, The Netherlands, 2025; pp. 93–106. [Google Scholar]
- Olujobi OJ, Olarinde ES, Yebisi TE. The conundrums of illicit crude oil refineries in Nigeria and its debilitating effects on Nigeria’s economy: A legal approach. Energies 2022, 15, 6197. DOI:10.3390/en15176197 [Google Scholar]
- Guinea L, Puch LA, Ruiz J. Energy news shocks and their propagation to renewable and fossil fuels use. Energy Econ. 2024, 130, 107289. DOI:10.1016/j.eneco.2023.107289 [Google Scholar]
- Kalaš B, Mirović V, Bolesnikov D, Akadiri SS, Radulescu M. Environmental Taxes and Sustainable Development in the EU: A Decade of Data-Driven Insights. Systems 2025, 13, 503. DOI:10.3390/systems13070503 [Google Scholar]
- Mpofu FY. Green Taxes in Africa: Opportunities and challenges for environmental protection, sustainability, and the attainment of sustainable development goals. Sustainability 2022, 14, 10239. DOI:10.3390/su141610239 [Google Scholar]
- Koval V, Laktionova O, Udovychenko I, Olczak P, Palii S, Prystupa L. Environmental taxation assessment on clean technologies reducing carbon emissions cost-effectively. Sustainability 2022, 14, 14044. DOI:10.3390/su142114044 [Google Scholar]
- Wolde-Rufael Y, Mulat-Weldemeskel E. Effectiveness of environmental taxes and environmental stringent policies on CO2 emissions: The European experience. Environ. Dev. Sustain. 2023, 25, 5211–5239. DOI:10.1007/s10668-022-02262-1 [Google Scholar]
- Ali M, Igunnu PO, Seraj M, Raza A. Effect of green finance and institutional quality on economic growth: An evidence from novel MMQR approach. SN Bus. Econ. 2025, 5, 136. DOI:10.1007/s43546-025-00911-x [Google Scholar]
- Ezeumeh IJ. Achieving a Low Carbon Economy in Nigeria via the Climate Change Mechanisms in the Paris Agreement. Master’s Thesis, University of Calgary, Calgary, AB, Canada, 2023. [Google Scholar]
- Michailidis M, Zafeiriou E, Kantartzis A, Galatsidas S, Arabatzis G. Governance, Energy Policy, and Sustainable Development: Renewable Energy Infrastructure Transition in Developing MENA Countries. Energies 2025, 18, 2759. DOI:10.3390/en18112759 [Google Scholar]
- Bazbauers AR. Sustainable, green, and climate-resilient cities: An analysis of multilateral development banks. Clim. Dev. 2022, 14, 689–704. DOI:10.1080/17565529.2021.1974331 [Google Scholar]
- Glemarec Y. Financing green and climate resilient infrastructure in ASEAN countries. Environ. Prog. Sustain. Energy 2023, 42, e14097. DOI:10.1002/ep.14097 [Google Scholar]
- Sun H, Chen F. The impact of green finance on China’s regional energy consumption structure based on system GMM. Resour. Policy 2022, 76, 102588. DOI:10.1016/j.resourpol.2022.102588 [Google Scholar]
- Habiba U, Cao X, Anwar A. Do green technology innovations, financial development, and renewable energy use help to curb carbon emissions? Renew. Energy 2022, 193, 1082–1093. DOI:10.1016/j.renene.2022.05.084 [Google Scholar]
- Igunnu PO, Ali M. Drivers of Carbon Emissions in Turkey and Indonesia: The Roles of Energy Use, Natural Disasters, and Technological Change. New Energy Exploit. Appl. 2025, 4, 47–64. DOI:10.54963/neea.v4i2.1365 [Google Scholar]
- Ogunkan DV. Achieving sustainable environmental governance in Nigeria: A review for policy consideration. Urban Gov. 2022, 2, 212–220. DOI:10.1016/j.ugj.2022.04.004 [Google Scholar]
- Saleem H, Khan MB, Mahdavian SM. The role of green growth, green financing, and eco-friendly technology in achieving environmental quality: Evidence from selected Asian economies. Environ. Sci. Pollut. Res. 2022, 29, 57720–57739. DOI:10.1007/s11356-022-19799-3 [Google Scholar]
- Shove E. What is wrong with energy efficiency? Build. Res. Inf. 2018, 46, 779–789. DOI:10.1080/09613218.2017.1361746 [Google Scholar]
- Yahaya O, Nwabuogo OE. Renewable energy deployment as climate change mitigation in Nigeria. Glob. J. Hum.-Soc. Sci. 2016, 16. Available online: https://www.academia.edu/download/87445282/4-Renewable-Energy-Deployment.pdf (accessed on 1 January 2026).
- Obada DO, Muhammad M, Tajiri SB, Kekung MO, Abolade SA, Akinpelu SB, et al. A review of renewable energy resources in Nigeria for climate change mitigation. Case Stud. Chem. Environ. Eng. 2024, 9, 100669. DOI:10.1016/j.cscee.2024.100669 [Google Scholar]
- Omoju OE, Beyene LM, Ikhide EE, Dimnwobi SK, Ehimare OA. Being green and prudent: Economy-wide and environmental impacts of renewable energy production subsidy in Nigeria. J. Dev. Areas 2024, 58, 47–66. DOI:10.1353/jda.2024.a929940 [Google Scholar]
- Achike A, Onoja AO. Greenhouse gas emission determinants in Nigeria: Implications for trade, climate change mitigation and adaptation policies. Br. J. Environ. Clim. Change 2014, 4, 83–94. DOI:10.9734/BJECC/2014/8576 [Google Scholar]
- Udo ES, Chiyem IR, Abner IP, Onyemere I, Okoh JI, Ajudua EI. Exploring the energy consumption and carbon emissions nexus in Nigeria. Stud. Univ. “Vasile Goldis” Arad–Econ. Ser. 2025, 35, 92–121. DOI:10.2478/sues-2025-0014 [Google Scholar]
- Gbadebo AD. Economic Growth, Trade Liberalization, and Carbon Emissions in Europe: An Empirical Analysis of Determinants and Policy Implications. Revista Científica Profundidad Construyendo Futuro 2026, 24, 49–64. [Google Scholar]
- Omodero CO, Okafor MC, Nmesirionye JA, Abaa EO. Environmental taxation and CO2 emission management. Environ. Ecol. Res. 2022, 10, 1–10. DOI:10.13189/eer.2022.100101 [Google Scholar]
- Yusuf A. Dynamic effects of energy consumption, economic growth, international trade and urbanization on environmental degradation in Nigeria. Energy Strategy Rev. 2023, 50, 101228. DOI:10.1016/j.esr.2023.101228 [Google Scholar]
- Adewuyi AO, Awodumi OB. Environmental pollution, energy import, and economic growth: Evidence of sustainable growth in South Africa and Nigeria. Environ. Sci. Pollut. Res. 2021, 28, 14434–14468. DOI:10.1007/s11356-020-11446-z [Google Scholar]
- Lorek S, Spangenberg JH. Sustainable consumption within a sustainable economy–beyond green growth and green economies. J. Clean. Prod. 2014, 63, 33–44. DOI:10.1016/j.jclepro.2013.08.045 [Google Scholar]
- Rasoulinezhad E, Taghizadeh-Hesary F. Role of green finance in improving energy efficiency and renewable energy development. Energy Effic. 2022, 15, 14. DOI:10.1007/s12053-022-10021-4 [Google Scholar]
- Yu M, Zhou Q, Cheok MY, Kubiczek J, Iqbal N. Does green finance improve energy efficiency? New evidence from developing and developed economies. Econ. Change Restruct. 2022, 55, 485–509. DOI:10.1007/s10644-021-09355-3 [Google Scholar]
- Carfora A, Pansini RV, Scandurra G. Energy dependence, renewable energy generation and import demand: Are EU countries resilient? Renew. Energy 2022, 195, 1262–1274. DOI:10.1016/j.renene.2022.06.098 [Google Scholar]
- Algarni S, Tirth V, Alqahtani T, Alshehery S, Kshirsagar P. Contribution of renewable energy sources to the environmental impacts and economic benefits for sustainable development. Sustain. Energy Technol. Assess. 2023, 56, 103098. DOI:10.1016/j.seta.2023.103098 [Google Scholar]
- Schandl H, Hatfield-Dodds S, Wiedmann T, Geschke A, Cai Y, West J, et al. Decoupling global environmental pressure and economic growth: Scenarios for energy use, materials use and carbon emissions. J. Clean. Prod. 2016, 132, 45–56. DOI:10.1016/j.jclepro.2015.06.100 [Google Scholar]
- Choudhury T, Kayani UN, Gul A, Haider SA, Ahmad S. Carbon emissions, environmental distortions, and impact on growth. Energy Econ. 2023, 126, 107040. DOI:10.1016/j.eneco.2023.107040 [Google Scholar]
- Nawaz MA, Seshadri U, Kumar P, Aqdas R, Patwary AK, Riaz M. Nexus between green finance and climate change mitigation in N-11 and BRICS countries: Empirical estimation through difference in differences (DID) approach. Environ. Sci. Pollut. Res. 2021, 28, 6504–6519. DOI:10.1007/s11356-020-10920-y [Google Scholar]
- Khizar S, Anees A. Role of green finance, trade openness, FDI, economic growth on environmental sustainability in Pakistan. iRASD J. Econ. 2023, 5, 91–102. DOI:10.52131/joe.2023.0501.0113 [Google Scholar]
- Ruza C, Caro-Carretero R. The non-linear impact of financial development on environmental quality and sustainability: Evidence from G7 countries. Int. J. Environ. Res. Public Health 2022, 19, 8382. DOI:10.3390/ijerph19148382 [Google Scholar]
- Ali SH, Puppim de Oliveira JA. Pollution and economic development: An empirical research review. Environ. Res. Lett. 2018, 13, 123003. DOI:10.1088/1748-9326/aaeea7 [Google Scholar]
- Granger CW. Investigating causal relations by econometric models and cross-spectral methods. Econom. J. Econom. Soc. 1969, 37, 424–438. DOI:10.2307/1912791 [Google Scholar]
- Pesaran MH, Shin Y, Smith RJ. Bounds testing approaches to the analysis of level relationships. J. Appl. Econom. 2001, 16, 289–326. DOI:10.1002/jae.616 [Google Scholar]
- Bahmani-Oskooee M, Usman A, Ullah S. Asymmetric J-curve in the commodity trade between Pakistan and United States: Evidence from 41 industries. Eurasian Econ. Rev. 2020, 10, 163–188. DOI:10.1007/s40822-019-00137-x [Google Scholar]
- Wang Z, Rasool Y, Zhang B, Ahmed Z, Wang B. Dynamic linkage among industrialisation, urbanisation, and CO2 emissions in APEC realms: Evidence based on DSUR estimation. Struct. Change Econ. Dyn. 2020, 52, 382–389. DOI:10.1016/j.strueco.2019.12.001 [Google Scholar]
- Dong K, Han Y, Dou Y, Shahbaz M. Moving toward carbon neutrality: Assessing natural gas import security and its impact on CO2 emissions. Sustain. Dev. 2022, 30, 751–770. DOI:10.1002/sd.2270 [Google Scholar]
- Giannelos S, Konstantelos I, Pudjianto D, Strbac G. The impact of electrolyser allocation on Great Britain’s electricity transmission system in 2050. Int. J. Hydrogen Energy 2026, 202, 153097. DOI:10.1016/j.ijhydene.2025.153097 [Google Scholar]