Driftless Area Streams in Karstic Agricultural Watersheds: Best Management Practices, Biotic Integrity, and Environmental Stressors

Driftless Area Streams in Karstic Agricultural Watersheds: Best Management Practices, Biotic Integrity, and Environmental Stressors

Received: 04 January 2026 Revised: 22 January 2026 Accepted: 15 May 2026 Published: 28 May 2026

© 2026 The authors. This is an open access article under the Creative Commons Attribution 4.0 International License (https://creativecommons.org/licenses/by/4.0/).
Graphical Abstract
1. Introduction
Intensive agricultural practices (e.g., crop and livestock production) can have strong, negative effects on surface waters within agricultural watersheds [1,2,3,4]. Streams and rivers that drain croplands, livestock pastures, and feedlots often are subjected to contaminated runoff containing eroded soils, livestock wastes, and a myriad of agricultural chemicals (fertilizers, pesticides, herbicides, fungicides) that reduce water quality, alter lotic habitats, and impair aquatic life [1,2,5,6,7,8,9,10]. The high percentage (often exceeding 80%) of agricultural land uses within many rural watersheds strongly suggests that negative impacts to stream and river systems are likely to occur [11,12,13,14]. This may be especially true in regions with karst geology, where cracks and fissures in underlying bedrock formations can serve as direct conduits between surface activities and groundwater, and between groundwater and spring-fed stream systems [15,16].
To lessen the direct and indirect impacts of agriculture on surface waters, Best Management Practices (BMPs) are typically implemented within watersheds to reduce runoff, prevent soil erosion, and better manage livestock waste storage and application [17,18,19,20,21]. The extent and placement of BMPs are crucial to their success, as too few or poorly located BMPs may not reduce runoff sufficiently to produce a measurable positive change in stream habitat or lotic communities [22,23,24,25,26]. This is especially true in watersheds where a threshold-level response may limit observable effects of BMPs on stream conditions until a certain proportion of the landscape has been brought under control [27]. Deciding what type(s) of BMPs to use, how many BMPs to use, and where to locate them requires knowledge of (1) the numbers and types of activities that may impact streams and rivers draining a watershed, (2) the locations where potentially contaminated snowmelt or stormwater runoff are most likely to enter drainage networks, and (3) the extent to which surface water quality may be compromised by that runoff [18,21].
BMP selection and implementation can be highly complex due to the wide variety of variables (e.g., type of contaminant, landscape topography, soil conditions, costs, maintenance needs, projected lifespan of the BMP, changing climates, landowner willingness, others) that may influence the effectiveness of the various BMPs [18]. Consequently, the types, numbers, siting, and potential effectiveness of BMPs (both planning/pre-implementation and post-implementation) often is estimated by various types of modeling tools (e.g., Storm Water Management Model (SWMM), Soil and Water Assessment Tool (SWAT), Variable Source Loading Function (VSLF)), hopefully to determine the best approach(es) among various alternatives to maximize contaminant runoff control while also maximizing cost-effectiveness [28,29,30,31,32,33,34,35,36,37,38,39]. Although modeling tools can often estimate potential contaminant reductions without local data on in-stream contaminant concentrations, including such localized contaminant data for model calibration and validation greatly improves the accuracy of reduction estimates [33,36,38].
Even as BMPs are implemented in watersheds to counteract land use impacts, there is a continuing need to both monitor the effectiveness of the BMPs already in place (although it might require years to decades after BMP implementation to detect the effects of the BMP) [40,41] and to determine where additional BMPs might be needed to further protect streams and rivers from on-going activities [42,43,44,45,46]. To accomplish these, regular (or at least periodic) water quality and aquatic community assessments are needed [45,47,48]. These data are used to validate and calibrate models designed to simulate the complex, ever-changing agricultural outputs within watersheds and to estimate their potential contributions to pollutant transport and fate [33].
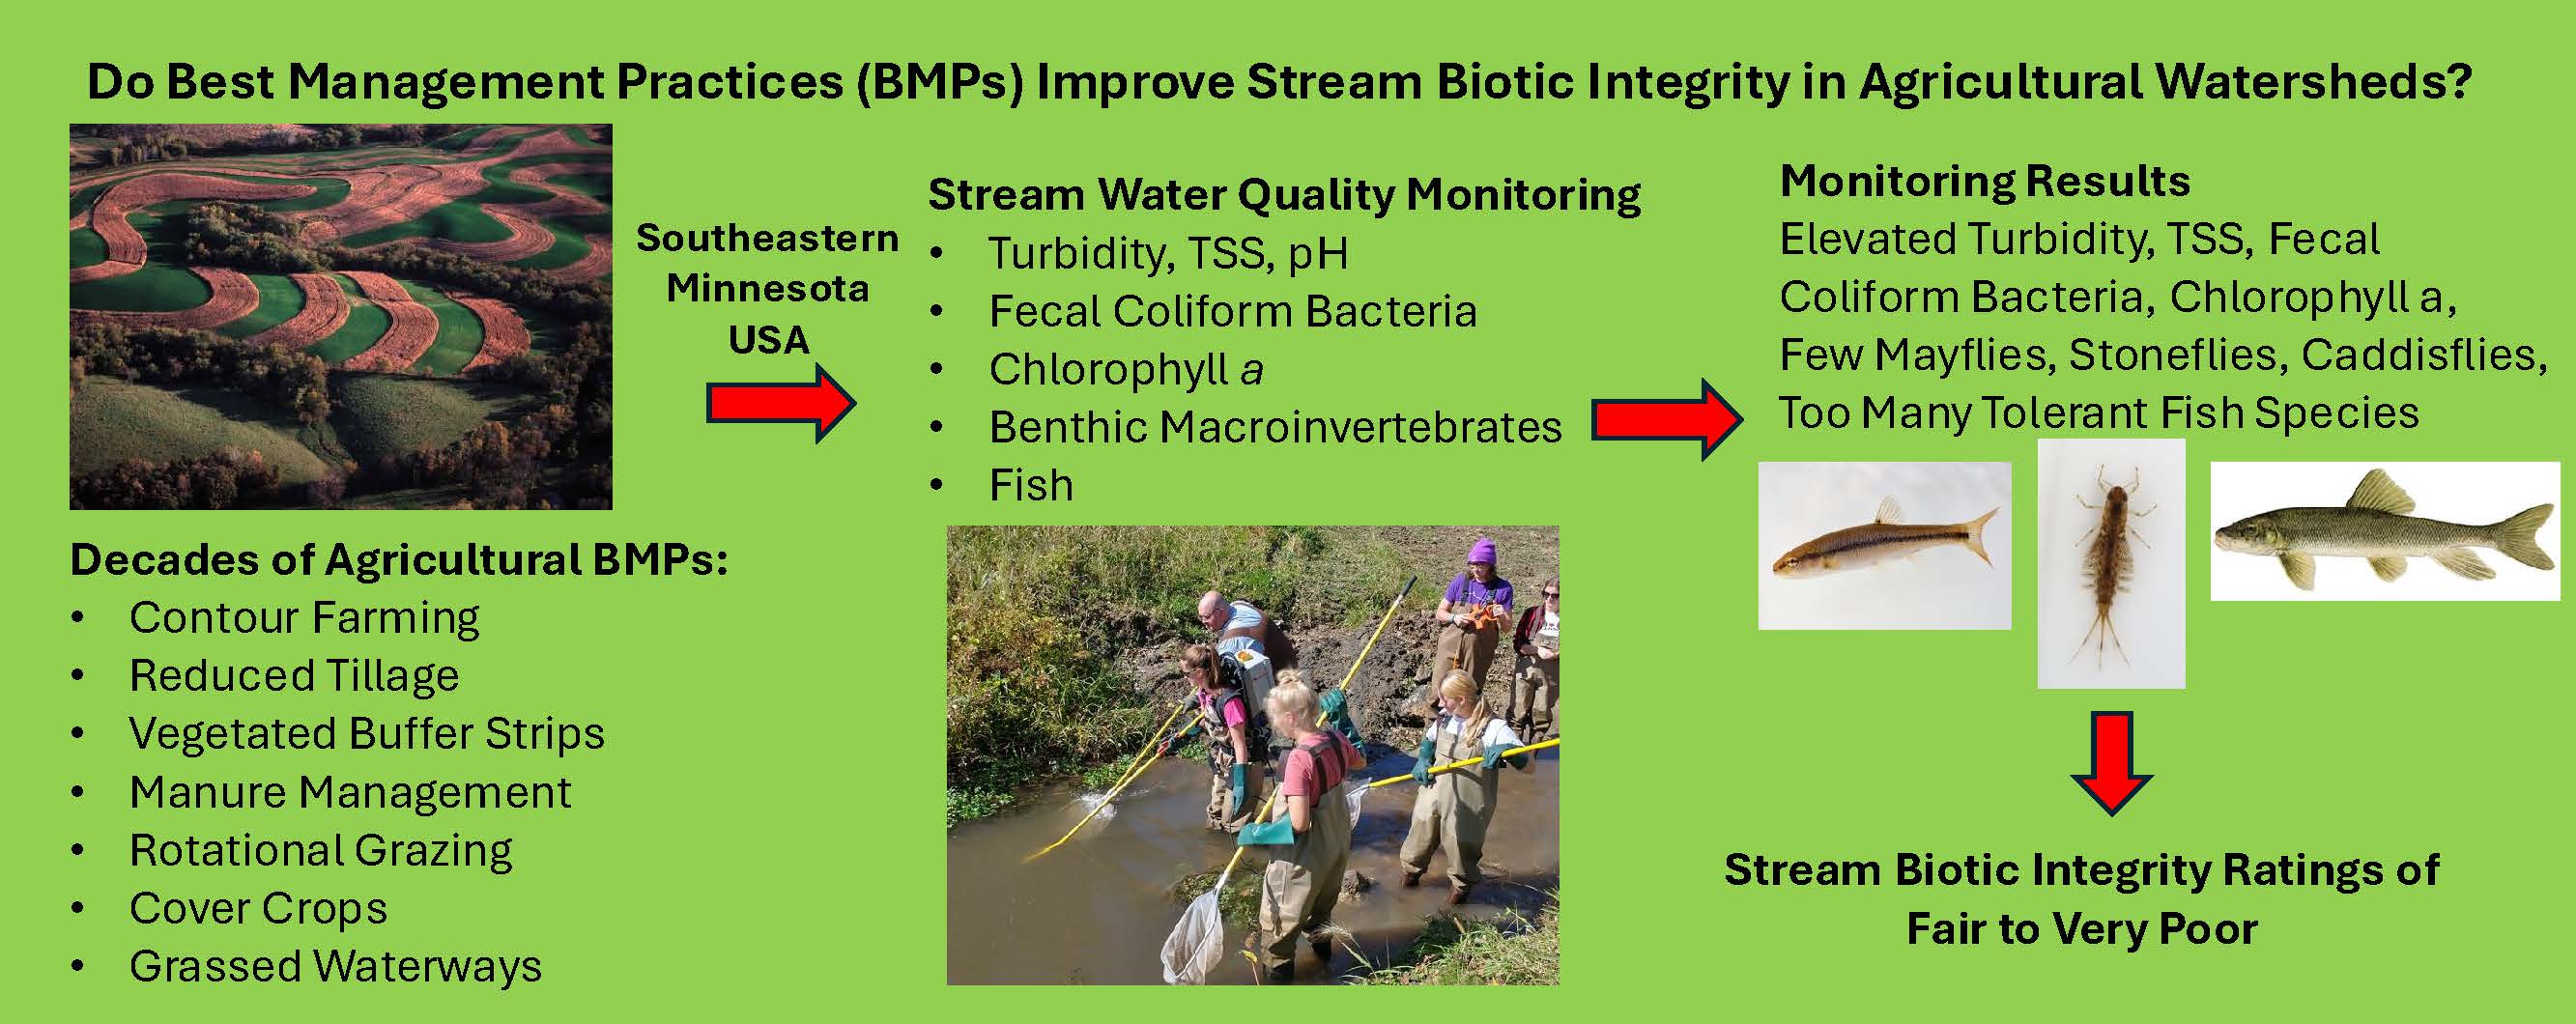
The present study was conducted to assess water quality indicators in two watersheds in southeastern Minnesota where targeted BMPs have been utilized for many decades to protect coldwater streams and rivers from agricultural runoff. Physical/chemical water quality data spanning three growing seasons (2000–2002) were collected regularly at multiple stream sites more than 20 years ago to add to the regional water quality database, but were never analyzed independently. Consequently, I used the 2000–2002 data to evaluate, at the subwatershed level, the general effectiveness of BMPs already in place in the watersheds by the early 2000s. Aquatic communities (benthic macroinvertebrates, fish) also had been surveyed at these same sites, and their biotic integrities were used as additional measures of BMP effectiveness. Viewing through the lens of more recent studies within these watersheds [49,50,51,52], I hypothesized that: (1) watersheds would exhibit poor water quality despite the widespread implementation of many BMPs before the year 2000, (2) water quality should not differ between watersheds due to their close proximity, similar agricultural activities, and underlying karst geology (although watershed size may have some effect), and (3) both fish and benthic macroinvertebrate community integrity would be significantly correlated with physical/chemical water quality variables.
2. Study Area
The study was conducted in two adjacent watersheds (Whitewater River, Garvin Brook/Rollingstone Creek) in southeastern Minnesota, USA (Figure 1), within the Driftless Area ecoregion [15], a region bypassed by recent glaciation events and spanning over 62,000 km2 across southeastern Minnesota, west-central Wisconsin, northeastern Iowa, and northwestern Illinois [53]. The Driftless Area is underlain by karst geology, resulting in a network of over 600 cold, groundwater spring-fed streams and rivers that extend for over 9300 km and drain to the upper Mississippi River [53]. These coldwater streams variously support naturally reproducing populations of native brook trout (Salvelinus fontinalis) and non-native brown trout (Salmo trutta), plus stocked rainbow trout (Oncorhynchus mykiss) that sustain Driftless Area recreational angling activities valued at over US $1 billion per year [53].
 |
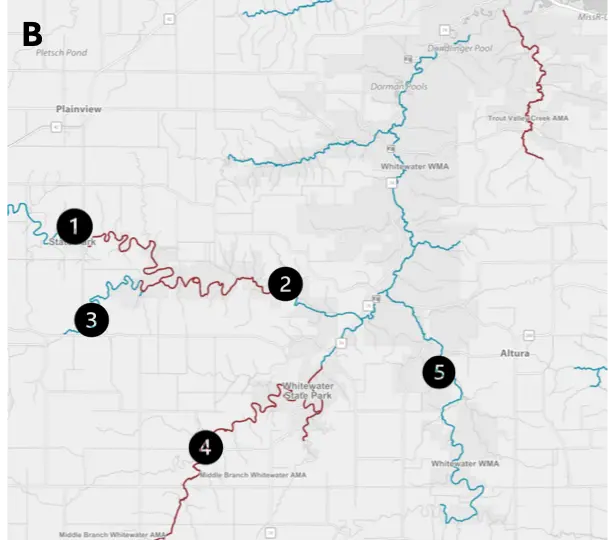 |
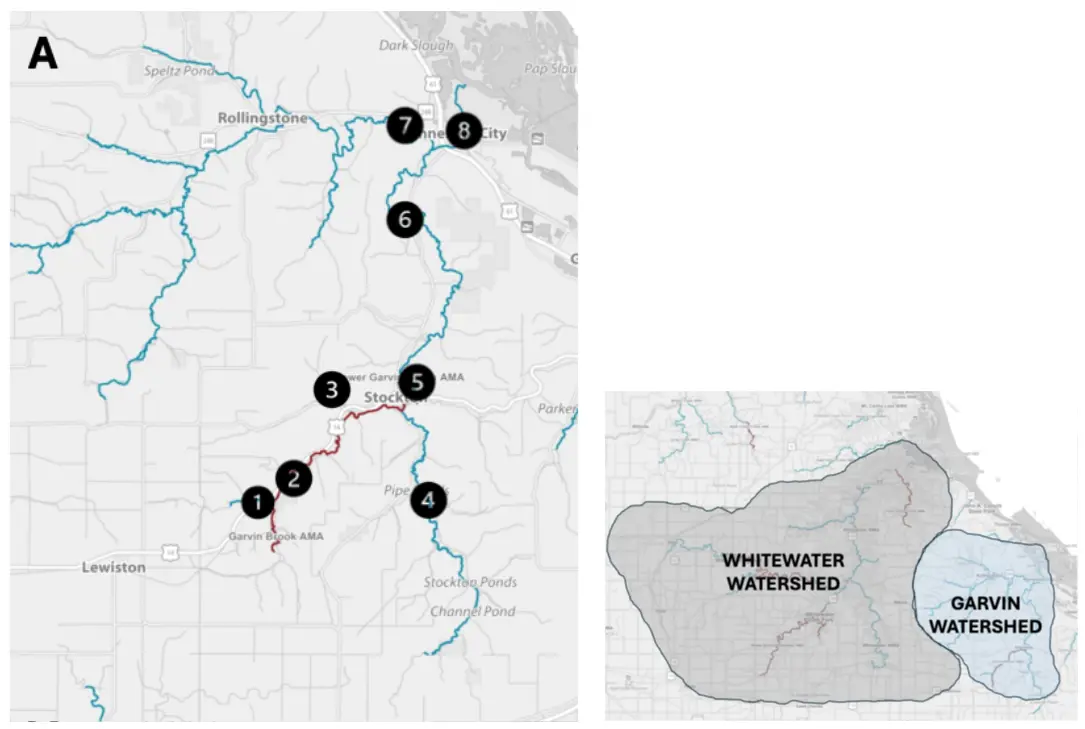
Figure 1. Maps of the two study watersheds in southeastern Minesota USA with stream sites designated by numbers: (A) Garvin Brook watershed (1—Peterson Creek, 2—Garvin Brook Upper, 3—Unnamed tributary, 4—Stockton Valley Creek, 5—Garvin Brook Stockton, 6—Garvin Brook Lower, 7—Rollingstone Creek, 8—Garvin Brook Minnesota City); (B) Whitewater River watershed (1—North Fork Carley, 2—North Fork Fairwater, 3—Logan Creek, 4—Middle Fork Quincy, 5—South Fork Crystal Springs). Blue lines represent designated coldwater trout streams, and red lines indicate reaches available for public angling access. A small inset map shows the proximities and boundaries of the two watersheds.
Streams within the Driftless Area are impacted by a variety of human activities (e.g., several small cities with populations <5000 with permitted municipal wastewater treatment discharges), but agriculture (row crops, haylands, livestock grazing, confined feedlots) dominates most regional watersheds [49,54,55,56,57,58]. The Garvin Brook watershed (12,432 hectares) was one of 21 rural watersheds in the USA selected during the 1980s to evaluate the effects of agricultural best management practices (BMPs) in controlling nonpoint source pollution and protecting both surface water and groundwater resources [59]. In the Whitewater River watershed (83,059 hectares), >1000 documented BMP sites/practices have been implemented to reduce the impacts of agriculture on water and soil health, some dating back to the 1930s [49]. Despite these ambitious efforts, surface water quality issues persist in both watersheds, and there is a continuing need for additional fine-tuning of BMPs (i.e., locations, types, magnitude) to protect and restore water quality to the greatest extent possible.
In general, streams in both watersheds are largely free-flowing and contain only modest hydrotechnical structures. Both watersheds contain dozens of small earthen check dams situated high in small valleys to capture and manage surface water runoff [16], but neither watershed contains in-channel dams or canals that might limit or alter stream flows. Numerous road and railway crossings in the watersheds require streams to flow through various galvanized metal or concrete culverts sized to allow for free water movement during all but the most extreme runoff events. The downstream portion of the Whitewater River contains a complex of diked pools and marshes within a wildlife management area that can be filled or drained for waterfowl habitat management [15]; none of the sampling for this study was conducted within or near these diked pools.
3. Methods
This study was conducted during May through October 2000 and May through August 2001 and 2002. Within the Whitewater River watershed, the same five sites (North Fork-Carley, Logan Creek, North Fork-Fairwater, Middle Fork-Quincy, and South Fork-Crystal Springs) were monitored during each of the three years (Figure 1). Within the Garvin/Rollingstone watershed, three sites (Garvin upper and lower, Stockton Valley Creek) were monitored during 2000, four additional sites (Peterson Creek, Unnamed tributary to Garvin Brook, Garvin Brook-Stockton, Garvin Brook-Minnesota City; seven sites total) were monitored in 2001, and one additional site (Rollingstone Creek; eight sites total) was monitored in 2002 (Figure 1). Sites were chosen in consultation with personnel from the Minnesota Pollution Control Agency to represent reaches within subwatersheds where additional water quality data were needed to determine whether legal water quality standards were being met.
3.1. Fieldwork
Stream sites were visited weekly during the study period, plus on additional days associated with rain events. During each visit, three separate grab water samples were collected for analysis of total suspended solids (TSS), fecal coliform bacteria, and chlorophyll a. Samples were held on ice until delivery to a local analytical testing lab within a few hours after collection.
In addition to collecting water samples, several other stream water variables were assessed during each site visit. Water temperature (°C) and pH were measured with a portable meter (HI 8314 pH/temperature meter, Hanna Instruments, Woonsocket, RI, USA), turbidity (NTUs) was measured with a portable turbidimeter (DRT-15CE with a 0.02 NTU reference standard, HF Scientific, Inc., Fort Myers, FL, USA), water transparency was measured with a 60-cm (in 2000) or 100-cm (in 2001 and 2002) transparency tube, and stream discharge (m3/s) was calculated as the product of stream width, mean depth (based on depths measured at 12 equally spaced locations across the stream transect), and mean current velocity (based on measurements at 0.6-depth at same 12 locations as depth, using a Marsh-McBirney Model 2000 Flo-Mate portable velocity meter, Frederick, MD, USA).
During 2002, fish communities in a 150-m reach at each of the 13 stream sites were surveyed via single-pass (downstream to upstream) electrofishing using one or more backpack electrofishing units (Smith-Root Type VII, 12-B POW, LR-24, or LR-20B, Vancouver, WA, USA) and dip nets. All fish collected were identified, counted, and returned alive back into the stream. Single-pass electrofishing is sufficient for documenting the fish communities at sites in small streams such as those in this study [60,61,62,63].
Also, during 2002, benthic macroinvertebrate communities were surveyed at the 13 stream sites. Separate macroinvertebrate samples were collected in each of three successive riffle habitats at each site by using a D-frame aquatic dip net (0.5-mm mesh). The net was placed against coarse substrates on the stream bottom, and the substrate upstream from the open net mouth was kicked for 30 s to dislodge invertebrates, which drifted downstream into the net. A single sample consisted of all the invertebrates collected during two 30-s kicks, one in a “fast” section of the riffle and one in a “slow” section. The net contents (invertebrates plus debris) were washed into a sample jar and preserved in the field in 70% ethanol until the samples could be processed in the laboratory.
3.2. Laboratory Procedures
Stream water samples were tested for TSS, fecal coliform bacteria, and chlorophyll a at a local certified surface water and wastewater testing lab (Southeast Minnesota Analytical Service, Department of Chemistry, Winona, MN, USA). All analyses followed standard testing protocols required for certified facilities at the time of the study (2000–2002) [64].
In the laboratory, benthic macroinvertebrates in each sample were hand-picked from sample debris with the aid of an illuminated magnifier (10× magnification; Taber Luxo-Lighting, Strathmore, CA, USA). Invertebrates were counted and identified to the lowest practical taxonomic level (usually genus) [65,66,67,68] with the aid of a dissecting microscope (8 to 50× magnification; Nikon SMZ645, Nikon Instruments Inc., Melville, NY, USA). Midge larvae and pupae (Chironomidae) were identified only to the family level.
3.3. Data Analyses
Stream site physical/chemical and water quality variables (pH, water temperature, turbidity, transparency, discharge, TSS, total coliform bacteria, and chlorophyll a) were analyzed in a variety of ways. Initially, data were combined across all sites and years within each watershed to create two separate watershed datasets for comparison to one another. Values for each variable were sorted into varying numbers of bins (e.g., 1 °C bins for water temperature, 0.25 pH unit bins for pH, and so on; see figures in Results for specific bins for each variable). Different bins for some variables were set to correspond to either meeting or exceeding existing state water quality standards (e.g., coldwater stream turbidity < 10 NTUs; coliform bacteria < 1000 colony-forming units/100 mL) [69]. The distributions of counts across bins were compared between the Garvin/Rollingstone and Whitewater watersheds with a contingency table Chi-square test for each variable, to determine if there were significant differences in the distributions for each variable between watersheds (i.e., values skewed higher or lower between basins).
Next, physical/chemical and water quality data were compiled and summarized (median values) separately for each site/year combination to examine potential differences among sites within each watershed and between watersheds. Using median values for these eight variables, principal components analysis (PCA; JMP Pro 18, JMP Statistical Discovery LLC, Cary, NC, USA) was used to visualize and compare relationships among the 33 site/year combinations within the two watersheds. Possible correlations among the physical/chemical and water quality variables were assessed using multivariate analysis based on Spearman rank correlation coefficients (rho) in JMP Pro 18.
Various metrics were used to assess the fish and benthic macroinvertebrate communities present at the 13 stream sites in the two watersheds. These metrics included simple taxa richness (number of species present), Shannon and Simpson community diversity indices [70], and separate indices of biotic integrity (IBI) for fish (regional coldwater IBI) and benthic macroinvertebrates (benthic IBI) [71,72]. These two IBIs assessed fish and benthic macroinvertebrate community characteristics and scored them compared to best possible conditions, to evaluate the collective impact of a variety of stressors (e.g., urbanization, agricultural activities, logging, construction activities, natural disturbances, elevated water temperatures) to stream habitat and water quality [71,72]. The fish IBI was based on values and scoring of 12 coldwater fish community metrics (Table 1) to rate stream conditions on a scale of 0 (very poor) to 120 (excellent) [68], whereas the benthic invertebrate IBI utilized 10 metrics (Table 2) to assess stream sites on a scale of 0 (very poor) to 100 (excellent) [72].
Each of these five indices was compared between the eight Garvin and five Whitewater watershed stream sites with separate Mann-Whitney tests (VassarStats: vassarstats.net; accessed on 15 January 2026). Collective fish and benthic macroinvertebrate communities (i.e., all fish collected at all sites within a watershed, all invertebrates collected at all sites within a watershed) within the two watersheds also were compared between watersheds with several community similarity indices (Sorensen index, Renkonen percentage of similarity index, Bray-Curtis community similarity index, Canberra metric, Morisita’s index of overlap, Horn index of community overlap [all ranging from 0 = no similarity, to 1 = complete similarity] using Quantan (Quantitative Analysis in Ecology, May 1997 version) software [70]. Because fish sampling effort (i.e., electrofishing time) was variable among sites due to differences in stream area and habitat complexity, fish taxa richness values were standardized (taxa/1000 s electrofishing time) across sites prior to statistical comparisons. Similarly, individual fish species abundances were standardized (individuals/1000 s electrofishing time) prior to calculating diversity and similarity values. Because benthic macroinvertebrate sampling effort did not vary among stream sites, no standardization was needed for either taxa richness or species abundances.
Fish and benthic macroinvertebrate data were analyzed separately with non-metric multi-dimensional scaling (NMDS using Bray-Curtis dissimilarity; JMP Pro 18 software) on transformed fish and invertebrate count data (Hellinger transformation; square root of relative abundances at each site) [73]. Two ordination plots (separate plots for fish and invertebrates) were created to visualize the level of community dissimilarity and potential site clustering among the 13 stream sites within the two watersheds. Spearman rank correlation coefficients (JMP Pro 18) were then used to compare each of the fish and invertebrate taxa individually to each dimension of the respective fish and invertebrate NMDS models, to assess which species were most related to the ordination space in each model.
Table 1. Coldwater fish index of biotic integrity (IBI) metric values, scoring, and total integrity scores and ratings for stream sites in the Whitewater River and Garvin Brook watersheds in 2002. Stream site designations as in Figure 1.
|
Whitewater Sites |
Garvin Sites |
|||||||||||||||||||||||||
|---|---|---|---|---|---|---|---|---|---|---|---|---|---|---|---|---|---|---|---|---|---|---|---|---|---|---|
|
1 |
2 |
3 |
4 |
5 |
1 |
2 |
3 |
4 |
5 |
6 |
7 |
8 |
||||||||||||||
|
Coldwater IBI Metrics |
Value |
Score |
Value |
Score |
Value |
Score |
Value |
Score |
Value |
Score |
Value |
Score |
Value |
Score |
Value |
Score |
Value |
Score |
Value |
Score |
Value |
Score |
Value |
Score |
Value |
Score |
|
Number of Species |
9 |
5 |
4 |
10 |
7 |
0 |
7 |
5 |
5 |
5 |
3 |
5 |
3 |
10 |
2 |
5 |
3 |
5 |
3 |
10 |
3 |
10 |
6 |
5 |
12 |
0 |
|
Number of Coldwater Species |
2 |
5 |
2 |
5 |
2 |
5 |
3 |
5 |
2 |
5 |
3 |
10 |
3 |
5 |
2 |
5 |
1 |
0 |
2 |
5 |
1 |
0 |
1 |
0 |
2 |
5 |
|
Number of Minnow Species |
3 |
5 |
1 |
10 |
3 |
0 |
3 |
5 |
1 |
10 |
0 |
10 |
0 |
10 |
0 |
10 |
0 |
10 |
0 |
10 |
0 |
10 |
2 |
5 |
2 |
5 |
|
Number of Benthic Species |
4 |
0 |
3 |
0 |
3 |
0 |
3 |
0 |
2 |
5 |
1 |
5 |
1 |
5 |
1 |
5 |
2 |
0 |
1 |
10 |
2 |
5 |
4 |
0 |
6 |
0 |
|
Number of Tolerant Species |
4 |
0 |
1 |
10 |
2 |
0 |
3 |
5 |
2 |
5 |
0 |
10 |
0 |
10 |
0 |
10 |
1 |
10 |
1 |
10 |
1 |
10 |
2 |
5 |
0 |
10 |
|
Percent Salmonids as Brook Trout |
0.0 |
0 |
0 |
0 |
0 |
0 |
0 |
0 |
0 |
0 |
16.3 |
5 |
1.7 |
0 |
0 |
0 |
0 |
0 |
0 |
0 |
0 |
0 |
0 |
0 |
78.8 |
5 |
|
Percent Intolerant Individuals |
0.0 |
0 |
17.7 |
5 |
0 |
0 |
61.7 |
10 |
0.7 |
0 |
69.8 |
10 |
55.1 |
10 |
77.9 |
10 |
0 |
0 |
0 |
0 |
0 |
0 |
0 |
0 |
36.3 |
5 |
|
Percent Coldwater Individuals |
14.0 |
0 |
63.9 |
5 |
13.6 |
0 |
71.4 |
5 |
94.8 |
10 |
100 |
10 |
100 |
10 |
100 |
10 |
77.2 |
5 |
88.2 |
10 |
2.7 |
0 |
24.4 |
0 |
45.2 |
5 |
|
Percent White Suckers |
26.9 |
0 |
4.2 |
0 |
30.5 |
0 |
19.4 |
0 |
3.6 |
0 |
0 |
10 |
0 |
10 |
0 |
10 |
19.3 |
0 |
11.8 |
0 |
51.4 |
0 |
36.6 |
0 |
0 |
10 |
|
Percent Top Carnivores |
14.0 |
0 |
46.1 |
5 |
4.2 |
0 |
9.7 |
0 |
94.2 |
10 |
36.1 |
5 |
45.7 |
5 |
22.1 |
0 |
77.2 |
10 |
44.7 |
5 |
0 |
0 |
24.4 |
0 |
46.6 |
5 |
|
Number of Coldwater Individuals per 150 m |
24 |
0 |
198 |
10 |
25 |
0 |
140 |
10 |
292 |
10 |
443 |
10 |
385 |
10 |
317 |
10 |
44 |
5 |
67 |
5 |
3 |
0 |
10 |
0 |
66 |
5 |
|
Number of Warmwater Individuals per 150 m |
147 |
0 |
112 |
0 |
161 |
0 |
56 |
5 |
16 |
5 |
0 |
10 |
0 |
10 |
0 |
10 |
13 |
10 |
9 |
10 |
108 |
0 |
31 |
5 |
90 |
0 |
|
Total score |
15 |
60 |
5 |
50 |
65 |
100 |
95 |
85 |
55 |
75 |
35 |
20 |
55 |
|||||||||||||
|
Rating |
Poor |
Fair |
Very poor |
Fair |
Fair |
Good |
Good |
Good |
Fair |
Good |
Fair |
Poor |
Fair |
|||||||||||||
Table 2. Benthic macroinvertebrate index of biotic integrity (BIBI) scoring and rating criteria and metric scoring system. Modified from [72].
|
Total BIBI |
||||
|---|---|---|---|---|
|
Integrity Rating |
Score |
Benthic Community Characteristics |
||
|
Excellent |
65–100 |
The best condition; the community has been disturbed minimally by humans and there is a rich variety of taxa; >20 taxa are present; =15 Clinger taxa; =6 Diptera taxa; >5 Ephemeroptera taxa |
||
|
Good |
50–60 |
Slight impairment with a variety of taxa; =14 taxa present; =4 Diptera taxa; 3–5 Ephemeroptera taxa |
||
|
Fair |
30–45 |
Moderate impairment with modest variety of taxa; usually =10 taxa present; =2 Ephemeroptera and =2 Diptera taxa present |
||
|
Poor |
10–25 |
High impairment with low variety of taxa; often only 5–9 taxa present; 1–2 Ephemeroptera taxa and 1–2 Diptera taxa; Gammarus usually present |
||
|
Very poor |
0–5 |
Severe impairment; <5 taxa present; often high numbers of Gammarus |
||
|
Assigned Metric Score |
||||
|
BIBI Metrics |
0 |
5 |
10 |
|
|
Percent Plecoptera |
<6 |
6–12 |
>12 |
|
|
Percent Long-lived |
<6 |
6–12 |
>12 |
|
|
Percent Predators |
<6.5 |
6.5–13 |
>13 |
|
|
Number Total Taxa |
0–6 |
7–12 |
>12 |
|
|
Number Plecoptera Taxa |
0 |
1 |
>1 |
|
|
Number Trichoptera Taxa |
0–1 |
2–3 |
>3 |
|
|
Number Long-lived Taxa |
0 |
1 |
>1 |
|
|
Number Diptera Taxa |
0–2 |
3–4 |
>4 |
|
|
Number Intolerant Taxa |
0–1 |
2–3 |
>3 |
|
|
Number Filterer Taxa |
0–2 |
3–4 |
>4 |
|
4. Results
4.1. Physical/Chemical and Water Quality Variables
Across the three sampling years, 593 site visits (307 in the Garvin watershed, 286 in the Whitewater watershed) were used to collect physical/chemical data and water samples to assess stream water quality. These data are summarized (median, minimum, and maximum values) by site and year in Table S1. Most measures exhibited high variability within each yearly study period, as streams responded to rain event runoff with flashy discharges and/or maintained steady baseline flows fed by groundwater spring discharges during periods of reduced rainfall (Figure 2).
When all data from all sites and years within a watershed were grouped together and compared between watersheds (Table 3), Whitewater sites exhibited significantly higher water temperatures (Figure 3A), lower pH values (Figure 3B), higher turbidity (Figure 4), and higher coliform bacteria levels (Figure 5A) than Garvin watershed sites. State coldwater stream standards for turbidity of 10 NTUs and for fecal coliform bacteria of 1000 colony forming units/100 mL were exceeded by 43% and 28% of Garvin watershed samples and by 66% and 43% of Whitewater watershed samples, respectively. Chlorophyll a levels did not differ between watersheds (Table 3, Figure 5B), with >80% of all measurements in each watershed under 10 micro g/L. Turbidity levels in both watersheds were negatively correlated to transparency levels and positively correlated to TSS levels (Table 4). TSS levels were also positively correlated to coliform levels, but more strongly at Garvin watershed sites than at Whitewater watershed sites (Figure 6).
Principal components analysis of the physical/chemical and water quality data based on separate site-year groupings resulted in a plot where the first two axes (PCA1 and PCA2) accounted for 74.6% of the variability among site-year groups (Figure 7). PCA1 was strongly related to water temperature, turbidity, TSS, and transparency, whereas PCA2 was influenced most strongly by discharge and pH. Most Garvin watershed sites clustered along the negative portion of PCA1 (corresponding to cold, clear water), although some sites were positioned on the extreme positive portion of PCA1. Whitewater watershed sites were positioned more narrowly within the positive portion of PCA1 and more widely along PCA2 (Figure 7). Across all sites from both watersheds, correlations were highly significant among water temperatures, turbidity, transparency, TSS, discharge, and coliform counts (Table 4).
4.2. Fish and Benthic Macroinvertebrates
Across all sites in the two watersheds, 2487 fish representing 22 species and one hybrid were encountered during the 2002 electrofishing effort (Table S2), whereas 11,203 benthic macroinvertebrates representing 40 taxa (27 insect taxa, 13 non-insect taxa) were collected during that same year (Table S3). There were no significant differences in taxa richness, Simpson diversity, or Shannon diversity between the two watersheds for either fish or benthic invertebrates (Table 5). The various community similarity indices generally indicated moderate similarity (0.3 to 0.7) between watersheds for both the fish and invertebrate communities (Table 6), with invertebrate communities exhibiting significantly higher (paired t5 = 4.69, p = 0.005) similarities than fish communities for the indices examined.
Coldwater fish IBI scores and ratings were variable among sites in both the Garvin (5 to 65, very poor to fair) and Whitewater (20 to 100, poor to good) watersheds (Table 1). Fish communities that were poorly rated generally lacked intolerant coldwater species and contained too many warmwater tolerant species. However, likely due to this variability, coldwater fish IBI scores did not differ significantly between watersheds (Table 5). Similarly, benthic IBI scores and ratings for benthic invertebrate samples varied greatly among sites in both the Garvin (0 to 50, very poor to good) and Whitewater (10 to 55, poor to good) watersheds (Figure 8). Coldwater fish IBI scores were significantly positively correlated to water transparency and negatively correlated to water temperature, turbidity, discharge, TSS, and fecal coliform levels (Table 4). Benthic invertebrate communities with poorer ratings generally lacked Plecoptera, intolerant, and long-lived taxa, while also lacking filterer taxa. Consequently, benthic IBI scores did not differ significantly between watersheds (Table 5). Benthic IBI scores were not significantly correlated to any of the physical/chemical water quality variables or to coldwater fish IBI scores (Table 4).
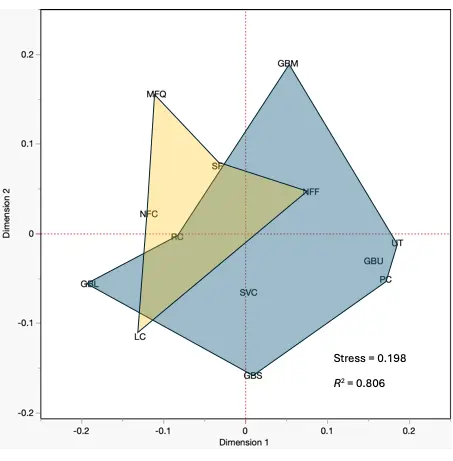
NMDS ordinations of study sites based on fish and benthic macroinvertebrate communities displayed differing patterns when sites in the two watersheds were compared (Figure 9). The two ordinations both had stress levels <0.2, indicating that they were fair representations of the original data. In the fish ordination, sites within the Garvin watershed were widely scattered throughout the ordination space, indicating variable fish communities among the study sites (Figure 9A). In contrast, Whitewater sites were more closely spaced, suggesting a greater level of similarity among fish communities. There was considerable overlap of the polygons spanning sites within the two watersheds. Five fish species were correlated significantly with Dimension 1 of the ordination, and three different species were correlated with Dimension 2 (Table 7).
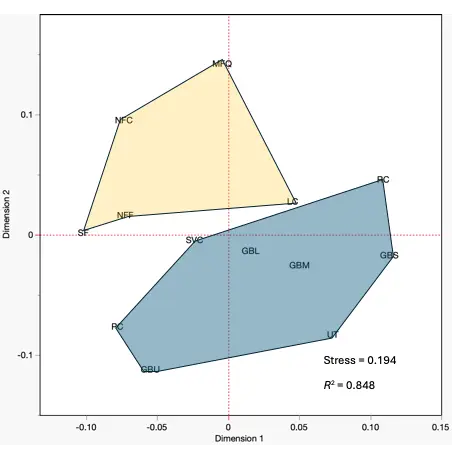
The NMDS ordination based on benthic macroinvertebrate communities indicated greater differences in invertebrate communities between sites in different watersheds, with Whitewater watershed sites clearly separated from Garvin watershed sites largely along Dimension 2 within the ordination space (Figure 9B). Seven taxa (three mayfly genera, a beetle, a crane fly, water mites, and an amphipod) were correlated significantly with Dimension 1 of the ordination, and two additional taxa (a caddisfly and a blackfly) were correlated with Dimension 2 (Table 7).
Table 3. Statistical comparisons of select water quality variables between Garvin Brook and Whitewater River stream samples, 2000–2002.
|
Variable |
Garvin |
Whitewater |
Statistics |
||||
|---|---|---|---|---|---|---|---|
|
n |
Median |
n |
Median |
Chi-Square |
df |
p |
|
|
Water temperature (°C) |
306 |
13.3 |
284 |
14.8 |
43.4 |
8 |
<0.001 |
|
pH |
302 |
7.98 |
283 |
7.86 |
35.6 |
7 |
<0.001 |
|
Turbidity (NTUs) |
307 |
7.75 |
280 |
17.91 |
55.6 |
8 |
<0.001 |
|
Coliform bacteria (number/100 mL) |
288 |
420 |
274 |
700 |
29.6 |
8 |
<0.001 |
|
Chlorophyll a (micro g/L) |
183 |
1.55 |
206 |
1.50 |
8.4 |
4 |
0.078 |
Table 4. Spearman rank correlation matrix displaying relationships among physical/chemical water quality variables and aquatic community integrity scores for Whitewater River and Garvin Brook stream sites, 2000–2002.
|
Variables |
pH |
Water Temperature |
Turbidity |
Transparency |
Discharge |
TSS |
Coliforms |
BIBI |
|---|---|---|---|---|---|---|---|---|
|
Water temperature |
−0.292 |
* |
* |
* |
* |
* |
* |
* |
|
Turbidity |
−0.334 |
0.740 **** |
* |
* |
* |
* |
* |
* |
|
Transparency |
0.459 ** |
−0.724 **** |
−0.908 **** |
* |
* |
* |
* |
* |
|
Discharge |
−0.228 |
0.528 ** |
0.545 ** |
−0.441 * |
* |
* |
* |
* |
|
TSS |
−0.347 * |
0.839 **** |
0.926 **** |
−0.865 **** |
0.561 *** |
* |
* |
* |
|
Coliforms |
−0.320 |
0.599 *** |
0.721 **** |
−0.708 **** |
0.256 |
0.732 **** |
* |
* |
|
Chlorophyll |
−0.549 * |
0.185 |
0.255 |
−0.435 |
0.273 |
0.304 |
0.099 |
* |
|
BIBI |
−0.389 |
−0.119 |
−0.319 |
0.321 |
−0.450 |
−0.483 |
−0.334 |
* |
|
Fish IBI |
0.282 |
−0.759 ** |
−0.723 ** |
0.765 ** |
−0.578 * |
−0.739 ** |
−0.568 * |
0.106 |
* p < 0.05, ** p < 0.01, *** p < 0.001, **** p < 0.0001.
Table 5. Fish and benthic macroinvertebrate community comparisons between Garvin Brook and Whitewater River watershed sites, 2002. Values are means with standard deviations in parentheses.
|
n Values |
|||||
|---|---|---|---|---|---|
|
Variable |
Garvin, Whitewater |
Garvin |
Whitewater |
Mann-Whitney U |
p Value |
|
Taxa richness |
|||||
|
Fish |
8, 5 |
3.1 (1.4) |
3.9 (1.7) |
13 |
0.342 |
|
Invertebrates |
8, 5 |
14.1 (3.4) |
15.0 (2.7) |
17 |
0.660 |
|
Simpson diversity |
|||||
|
Fish |
8, 5 |
0.720 (0.103) |
0.564 (0.182) |
9 |
0.124 |
|
Invertebrates |
8, 5 |
0.643 (0.156) |
0.575 (0.248) |
24 |
0.610 |
|
Shannon diversity |
|||||
|
Fish |
8, 5 |
0.637 (0.130) |
0.440 (0.227) |
7 |
0.067 |
|
Invertebrates |
8, 5 |
0.622 (0.152) |
0.579 (0.248) |
21 |
0.944 |
|
IBI score |
|||||
|
Fish |
8, 5 |
65 (29) |
39 (27) |
30 |
0.165 |
|
Invertebrates |
24, 15 |
20 (12) |
21 (12) |
184 |
0.928 |
Table 6. Community similarity comparisons of fish and benthic macroinvertebrates between Whitewater River and Garvin Brook watershed sites, 2002.
|
Index |
Fish |
Invertebrates |
|---|---|---|
|
Sorensen-Dice |
0.516 |
0.750 |
|
Percent of similarity |
0.387 |
0.462 |
|
Bray-Curtis |
0.358 |
0.433 |
|
Canberra |
0.138 |
0.236 |
|
Morisita’s |
0.455 |
0.553 |
|
Horn |
0.572 |
0.681 |
Table 7. Significant Spearman rank correlations of fish and benthic macroinvertebrate taxa abundances with each dimension of the fish and invertebrate NMDS models.
|
Fish NMDS Model |
||
|---|---|---|
|
Dimension 1 |
||
|
Fish taxa |
Spearman correlation |
p |
|
Brown trout |
0.648 |
0.0165 |
|
Creek chub |
−0.595 |
0.0321 |
|
White sucker |
−0.928 |
<0.0001 |
|
Johnny darter |
−0.786 |
0.0014 |
|
Slimy sculpin |
0.819 |
0.0006 |
|
Dimension 2 |
||
|
Spearman correlation |
p |
|
|
Longnose dace |
0.751 |
0.0031 |
|
Brook stickleback |
−0.699 |
0.0079 |
|
Fantail darter |
0.611 |
0.0266 |
|
Invertebrate NMDS Model |
||
|
Dimension 1 |
||
|
Invertebrate taxa |
Spearman correlation |
p |
|
Baetis |
−0.758 |
0.0027 |
|
Ephemerella |
−0.585 |
0.0356 |
|
Tricorythodes |
−0.598 |
0.0308 |
|
Stenelmis |
−0.554 |
0.0497 |
|
Dicranota |
0.718 |
0.0057 |
|
Acari |
−0.620 |
0.0237 |
|
Gammarus |
0.852 |
0.0002 |
|
Dimension 2 |
||
|
Spearman correlation |
p |
|
|
Hydropsyche |
0.637 |
0.0191 |
|
Simulium |
−0.560 |
0.0468 |
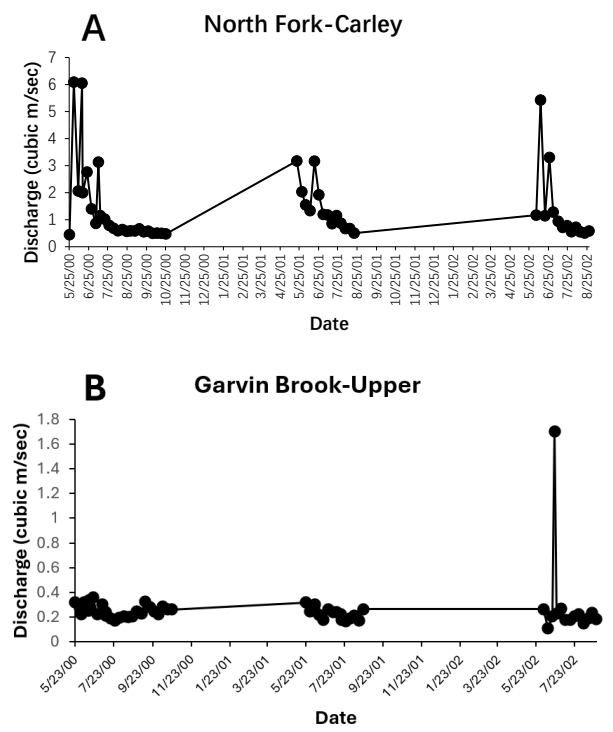
Figure 2. Measured stream discharges at two representative study stream sites ((A)—North Fork Carley; (B)—Garvin Brook Upper) during the 2000–2002 agricultural growing seasons.
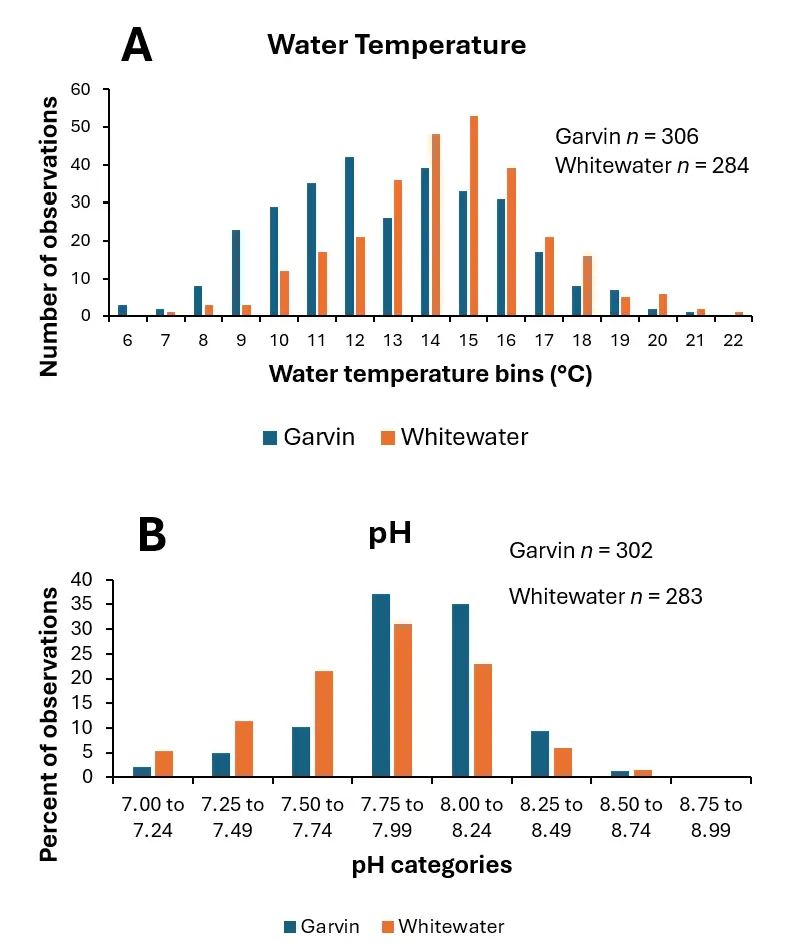
Figure 3. Distributions of measured stream water temperatures (A) and pH (B) at the study sites in the Garvin Brook and Whitewater River watersheds, 2000–2002.
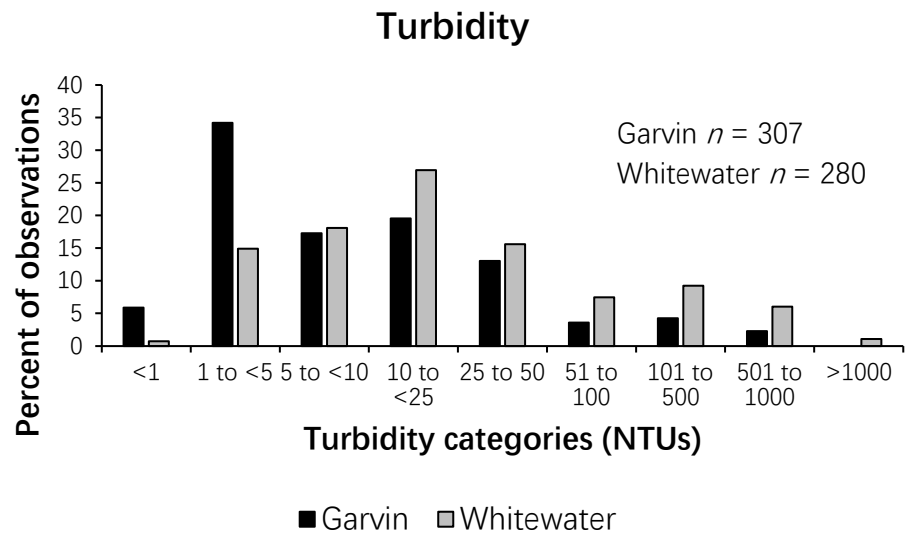
Figure 4. Distribution of measured stream turbidity levels at the study sites in the Garvin Brook and Whitewater River watersheds, 2000–2002.
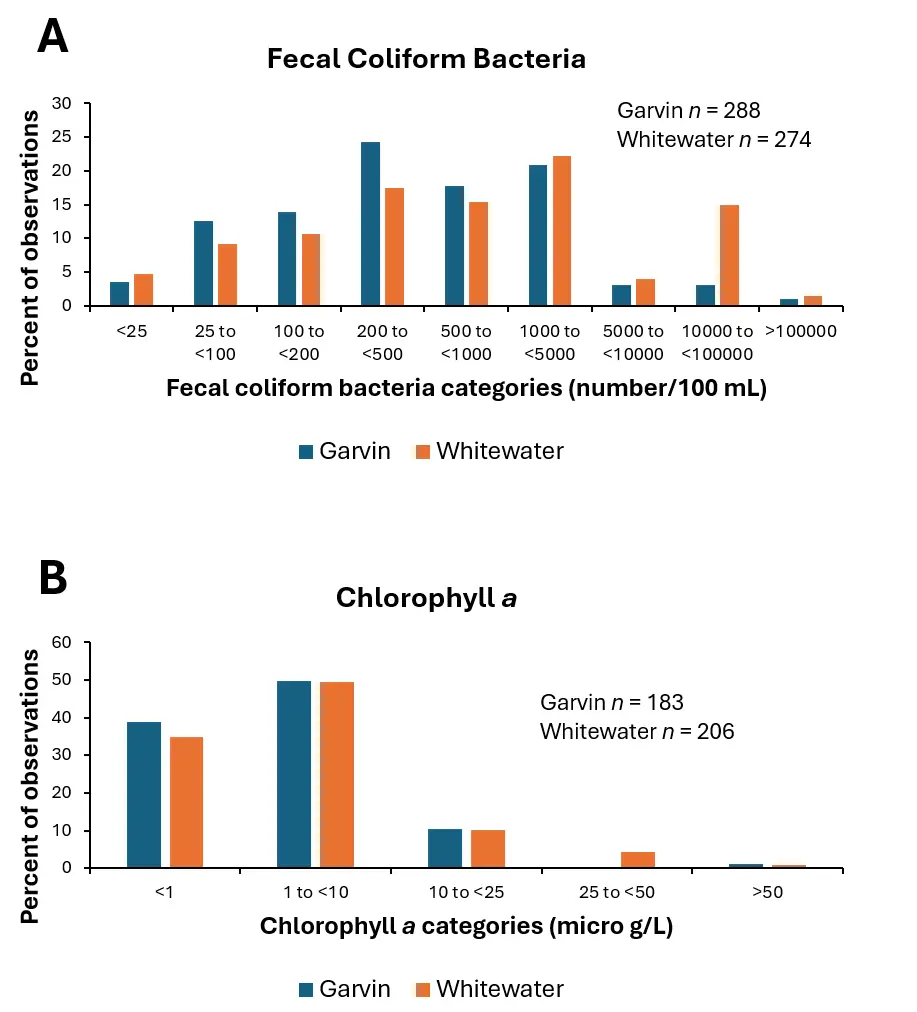
Figure 5. Distributions of fecal coliform bacteria levels (A) and chlorophyll a concentrations (B) at the study sites in the Garvin Brook and Whitewater River watersheds, 2000–2002. Chlorophyll concentrations were not measured during 2002.
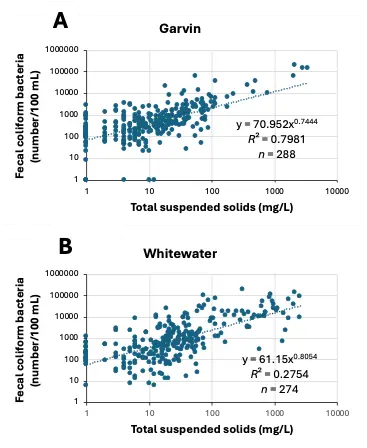
Figure 6. Relationships between total suspended solids (TSS) and fecal coliform bacteria levels at the study sites in the Garvin Brook (A) and Whitewater River (B) watersheds, 2000–2002.
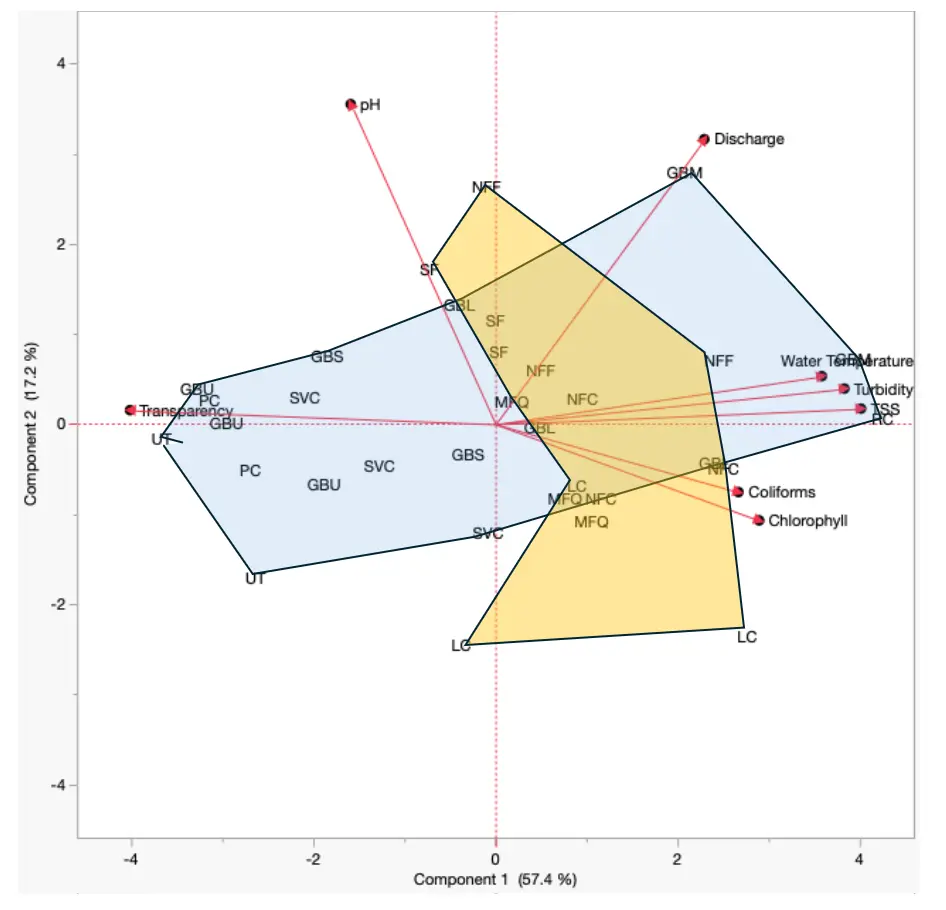
Figure 7. Principal components analysis (PCA) plot based on water quality variables at the study sites in the Garvin Brook and Whitewater River watersheds, 2000–2002. Capital letters represent stream sites, and vectors are displayed to indicate the direction of influence of each variable. Polygons represent the range of sites in each watershed (Garvin Brook—blue; Whitewater River—orange) within the plot.
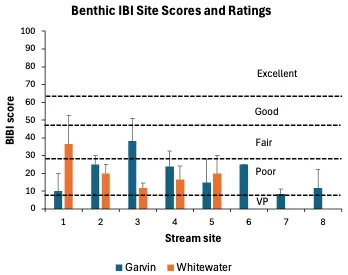
Figure 8. Benthic IBI scores and ratings for stream sites within the Garvin Brook and Whitewater River watersheds, 2002. Values are means and error bars represent one standard deviation. Horizontal dashed lines separate rating categories (VP = Very poor). Stream site designations as indicated in Figure 1.
 |
|
(A) |
 |
|
(B) |
Figure 9. Non-metric multi-dimensional scaling (NMDS) ordination plots based on fish (A) and benthic macroinvertebrate (B) abundances at stream sites within the Garvin Brook and Whitewater River watersheds, 2002. Capital letters represent stream sites, and polygons represent the range of sites in each watershed (Garvin Brook—blue; Whitewater River—orange) within the ordinations.
5. Discussion
This broad-based assessment of physical, chemical, and biological water quality indicators at stream sites in two watersheds in southeastern Minnesota USA, produced several important findings relevant to this region and beyond. First, many of the different variables examined indicated that water quality during 2000–2002 remained compromised in several portions of each watershed even after decades of BMP implementation. Next, sites within the Whitewater River watershed overall displayed greater physical/chemical/biological impairment than those in the Garvin Brook watershed. Finally, fish community integrity in these watersheds was more strongly correlated with physical/chemical indicators than was benthic macroinvertebrate community integrity.
BMPs in agricultural watersheds are intended to reduce the impacts of agricultural activities on surface waters [17,18,19,20,21,22]. Practices such as livestock exclusion and pasture management, manure management, cover crops, conservation tillage, riparian buffers, grass waterways, retention basins, and contour farming can reduce or prevent runoff from fields, feedlots, and pastures, lessening impacts to receiving waters [18]. These and similar practices have resulted in significant reductions in the amounts of eroded soils, nutrients, pesticides/herbicides, and fecal coliform bacteria delivered to streams, rivers, and lakes [32,33,34,35,39,42,47].
The Whitewater River and Garvin Brook watersheds in southeastern Minnesota, USA, have had hundreds to thousands of agricultural BMPs implemented since the 1930s to address water quality issues [16,49,55,59,74]. Other monitoring efforts within these watersheds [49,55,56,59,74] have shown that some BMPs (either individually or in aggregate) have been effective at improving stream water quality, whereas others have not. Studies in these and other watersheds have suggested that detectable changes in stream water quality after BMP implementation may require decades or even longer to occur [25,40,41,46,74], as legacy contaminants (e.g., eroded soils) work through the system and the aquatic ecosystems respond to the improvements [40].
Lack of visible BMP effectiveness also may result from the inability of the numbers, types, or localities of implemented BMPs to compensate for the level of impact caused by agricultural activities within a watershed or subwatershed [20,48]. Some watersheds may exhibit a threshold effect relative to contaminants and BMPs, requiring a certain proportion or area of the watershed to be in conservation management before measurable effects can be observed [27]. In many watersheds, BMP implementation requires participation from private landowners [46], with implementation costs (or government-supported programs that pay for them) as a major factor determining whether a farmer is willing to participate in implementation [23,46,55]. Slow rates of BMP adoption by farmers can significantly impair contaminant reductions in some watersheds [46]. In addition, the placement of BMPs at specific sites (i.e., targeting) versus random locations within a watershed or locations that may be convenient for landowners can greatly alter their overall effectiveness [24,35]. Within the Whitewater River watershed, targeted BMPs have been implemented on ~20% of all agricultural lands [49], although small “gaps” between BMPs can still allow contaminants in some subwatersheds to bypass management controls and prevent recovery of stream ecosystems [56]. The Garvin Brook watershed has similar “gaps” in BMP coverage [59,74] and, consequently, has also experienced the negative effects of contaminated runoff from agricultural lands [74,75,76]. Some modeling studies on large watersheds have suggested that BMPs need to be implemented on 50% or more of watershed agricultural lands to produce an observable effect on water quality or stream community integrity [77,78], more than double the level in the Whitewater River watershed [49].
Several sites in the Garvin Brook and Whitewater River watersheds displayed at least occasional high concentrations or levels of TSS, turbidity, and fecal coliform bacteria, reduced transparencies, and reduced biotic integrity for both fish and benthic macroinvertebrate communities. Strong correlations among TSS, turbidity, fecal coliform bacteria, fish IBI, and water temperatures suggest that these sites continued to experience impaired runoff not fully managed or mediated by the BMPs in place during the study period. These results seem to indicate that additional BMPs may be needed to prevent runoff from agricultural lands from reaching the drainage network. However, it is also possible that the watersheds continued to suffer from the ghost of past land abuses [16,57]. Unsustainable agricultural practices (e.g., farming on steep slopes, livestock overgrazing) during the late 1800s and early 1900s resulted in severe soil erosion throughout southeastern Minnesota, burying stream valleys beneath several meters of transported sediments, leading to the abandonment of farms and small farming communities [16,57]. Decades later, fine sediment deposits (e.g., sand, silt, clay) that erode easily under high stream flows remained in streambeds and banks in middle and lower portions of watersheds throughout the Driftless Area [16], producing elevated TSS and turbidity levels and embedding coarse stream-bottom substrates, reducing instream habitat quality for benthic macroinvertebrates and fish [55,56]. Specific legacy sediment conditions in the study streams have not been studied. However, recent stream restoration projects within the two study watersheds have been designed to reduce streambank erosion by lowering and sloping banks and stabilizing them with boulders and/or tree trunks while narrowing stream channels to increase velocities to flush away fine stream bottom sediments (M. Majewski, EOR Incorporated, Saint Paul, MN, USA, personal communication). Likely, some combination of additional targeted BMPs throughout the watersheds and extensive streambank protection or stabilization practices would be needed after the 2000–2002 study period to improve water quality within these watersheds.
Several of the stream sites in the Garvin Brook watershed had relatively good water quality, based on a variety of indicators, compared to those in the Whitewater River watershed. Garvin Brook sites such as Peterson Creek, Garvin Brook Upper, the unnamed tributary, Stockton Valley Creek, and Garvin Brook Stockton typically exhibited colder water temperatures, lower turbidities, TSS, and fecal coliform levels, higher transparencies, and fair to good fish biotic integrity in contrast to sites elsewhere in the watershed and in the Whitewater River watershed. Locations of the sites within their respective watersheds, sizes of the various subwatersheds, land use near the sites, and aquifer sources of springs entering these streams may, in part, explain these differences in water quality between the two watersheds.
The five, better-water-quality Garvin watershed sites represented the more headwater (1st- and 2nd-order streams) locations within the watershed. By comprising >60% of the eight sites monitored within the watershed, the collective water qualities of these sites likely skewed the overall assessment of this watershed relative to the Whitewater River watershed, where only a single site (Logan Creek; 20% of sites monitored) represented a low-order stream. The subwatersheds draining to low-order streams typically are much more responsive to both disturbance [79] and to BMP implementation due to the greater proportional areas represented by the BMPs in small versus large subwatersheds [18,26,27,42]. Also, since the lands draining to low-order streams may be owned and managed by a small number of landowners, conservation actions by even a single landowner may be sufficient to produce observable effects on stream water quality [18,23,35,46]. Headwater locations within the region are also less likely to be influenced by problematic historical land use, with legacy deposits of eroded soils having been flushed away downstream over several decades into higher-order locations where they may continue to negatively affect water quality [16].
Differing spring sources of streams within the karst geology of the two study watersheds may also influence water quality in the different systems. Higher-elevation aquifers feeding headwater springs of the main forks of the Whitewater River have a history of contamination by bacteria and agricultural chemicals, since they are located relatively near the land surface [80] and are surrounded by agricultural lands [49]. Water quality and biotic integrity in the headwaters of the North, Middle, and South forks typically is moderate to poor [49]. In contrast, lower elevation aquifers that feed springs in the Garvin Brook headwaters are much better insulated from surface activities and less susceptible to contamination via infiltration [59]. Consequently, a variety of factors may collectively impact water quality more at the Whitewater monitoring sites than at the Garvin sites, causing the Whitewater watershed to appear more impaired than the Garvin watershed. However, even if more headwater sites had been monitored in the Whitewater system, it appears possible that they would have exhibited poorer water quality than their Garvin watershed counterparts. A headwaters-to-headwaters comparative study would be needed to specifically address this speculation.
Lotic fish and benthic macroinvertebrate communities have long been used as effective and responsive biological indicators of water quality [81,82]. They are common in all permanent streams and rivers, are relatively easy to collect and identify, and they exhibit predictable responses to a variety of environmental stressors [71,83,84]. In particular, these aquatic communities are known to be responsive to many different types of agricultural pollutants, from eroding soils and feedlot runoff to numerous types of herbicides and pesticides [58,81,84,85]. They have been used successfully to assess stream and river habitat and water quality in southeastern Minnesota for many decades [49,54,56,58].
Although fish community biotic integrity in the Garvin and Whitewater watersheds was significantly correlated with several of the other water quality variables (e.g., turbidity, TSS, fecal coliform bacteria levels), invertebrate IBI scores were not correlated with any of the water quality variables or with the fish IBI. Even though NMDS modeling based on macroinvertebrate abundances clearly distinguished between Garvin and Whitewater study sites, macroinvertebrate community structure did not appear to be directly responsive to water quality differences among those sites. Benthic macroinvertebrate communities are used successfully by governmental agencies in Minnesota and elsewhere to assess stream and river water quality and monitor compliance with legally enforceable water quality standards [86,87].
In southeastern Minnesota, some studies [49,54,56] reported that benthic macroinvertebrate community metrics were significantly correlated with instream habitat quality and/or chemical water quality indicators, whereas others [49,50,55] found that invertebrate communities displayed little if any response to changing habitat or water quality conditions. In the present study, it could be that benthic invertebrate communities were slower than fish communities in responding to improving water quality and instream habitat due to differences in mobility. If intolerant species remain within a stream network, fish naturally can be highly mobile, moving many km rather quickly (e.g., within weeks or months) to recolonize stream reaches with improved water quality [75,76]. Intentional reintroductions of sensitive fish species by natural resource agencies can also accelerate community change [88,89,90]. In contrast, sensitive aquatic insects and non-insect invertebrates, if they remain within a watershed after long-term exposure to environmental stressors, may be more sedentary and unable to move large distances within rivers and streams (except for downstream drift) [91,92]. Swimming abilities may be lacking or extremely limited, and many adult aquatic insects are weak fliers, unable to move comparatively large distances (e.g., >10 km) between watersheds to recolonize improving streams [50,51,91,92]. Past land abuses within the Garvin and Whitewater watersheds [7,16] may have extirpated many aquatic invertebrate taxa throughout the streams in both watersheds, and barring reintroductions, there would be little driving force to shift macroinvertebrate community structure as water quality improves [51].
After the 2000–2002 study period, several significant events and changes occurred within the two study watersheds. Catastrophic flooding (one-in-2000 years flood event) struck both watersheds in 2007, leading to severe channel damage, channel abandonment, and the creation of new channels in various locations [52]. To repair some of that channel damage, multiple stream habitat restoration projects were undertaken in both watersheds [93,94]. In 2014, a new Minnesota state law mandated the establishment of permanent vegetated buffers (minimum width = 9 m) along all state waterways to help insulate streams and rivers from nearby human activities [51]. Finally, BMP implementation has continued in both watersheds since the study period [49]. Despite these activities during the past 20 years aimed at improving stream habitat and water quality within these watersheds, recent studies [49,50,51] suggest that only modest improvements have occurred in overall stream health in the watersheds, mostly the result of reductions in fine sediments and substrate embeddedness [51]. Additionally, as of 2024, most stream reaches within both the Garvin and Whitewater watersheds remain on Minnesota’s impaired waters list [95]. Six reaches that encompass nearly the entire length of Garvin Brook, Rollingstone Creek, and three of their tributaries are listed as variously impaired for turbidity, fecal coliform bacteria, and their fish and benthic macroinvertebrate communities [95]. No stream reaches within this watershed have been delisted (i.e., removed from the impaired waters list) after initial listing during the early 2000s. Similarly, 17 reaches spanning most of the Whitewater River watershed are currently (based on 2024 data) listed as impaired for such stressors as total suspended sediments, turbidity, fecal coliform bacteria, Escherichia coli, and nitrates, resulting in many impairments of fish and benthic macroinvertebrate communities [95]. Two additional reaches (Beaver Creek, upper South Fork Whitewater River) that previously had been listed as impaired for fish and benthic macroinvertebrate communities were delisted in 2024 after exhibiting recent improvements [95]. These recent studies and listings indicate that the data gathered during the 2000–2002 study period remain relevant today and demonstrate long-term water quality issues within the study watersheds.
6. Conclusions
This study demonstrated that water quality remained impaired (based on multiple physical/chemical and biological indicators) during the 2000–2002 study period at several stream sites in two karstic agricultural watersheds in southeastern Minnesota, even after long-term efforts to protect surface waters by implementing hundreds to thousands of BMPs since the 1930s. Runoff contaminated by high concentrations of eroded soils and fecal coliform bacteria still entered streams in various locations during precipitation events within the study period, negatively impacting stream habitats and aquatic communities.
While both Garvin and Whitewater watersheds had stream sites with impaired water quality during 2000–2002, Garvin Brook study sites in low-order stream reaches exhibited much better water quality. Better conditions at these sites may be related to greater BMP effectiveness in smaller subwatersheds, earlier flushing of legacy contaminants from headwater reaches, and/or deeper aquifers that are better insulated from surface activities, discharging higher-quality water from springs. Inclusion of more low-order stream sites in the Garvin Brook watershed makes water quality in the Whitewater watershed appear worse by comparison.
Fish community integrity in both watersheds during 2002 was significantly correlated to other water quality indicators, indicating a strong community structure response to varying stream conditions. However, benthic macroinvertebrate community integrity was not correlated with differing water quality, suggesting a lack of community responsiveness to variable stream conditions in the two study watersheds. Why these two communities differ in their responses to altered stream conditions is not known, although stronger recolonization abilities of fishes and the intentional reintroduction of sensitive native fish species may, in part, explain why fish communities have recovered at some sites, whereas invertebrate communities have not.
Based upon this 2000–2002 study of water quality, more recent studies within the region, and current impaired waters listings, both the Garvin Brook and Whitewater River watersheds would benefit from additional water quality monitoring efforts in the future. While some headwater sites appear to have already responded positively to past BMP implementation, more widespread and detailed monitoring efforts targeting both headwater and higher-order stream sites are needed across both watersheds to highlight specific subwatersheds where more remediation efforts are needed. By prioritizing future BMP implementation in problematic subwatersheds, both watersheds can demonstrate improved water quality even as agricultural activities continue to contribute to the regional economy.
Supplementary Materials
The following supporting information can be found at: https://www.sciepublish.com/article/pii/1031, Table S1: Summary of water quality variables at stream sites in the Whitewater River and Garvin Brook watersheds, 2000–2002. Values are medians, with minimum and maximum values in parentheses; Table S2: Fish collected at stream sites in the Whitewater River and Garvin Brook watersheds during 2002. Stream site designations as in Figure 1; Table S3: Benthic macroinvertebrates collected at stream sites in the Whitewater River and Garvin Brook watersheds during 2002. Stream site designations as in Figure 1.
Acknowledgments
I wish to thank the many Winona State University biology students who assisted with field collections and macroinvertebrate sorting and identification. Laboratory analysis of water samples was conducted by the Southeast Minnesota Analytical Service, Department of Chemistry, Winona State University. Collecting permits were provided by the Minnesota Department of Natural Resources-Fisheries.
Ethics Statement
Fish collections were carried out under special permit (No. 10907; approved 4 February 2002) from the Minnesota Department of Natural Resources, Division of Fish and Wildlife, Section of Fisheries. At the time the field studies were conducted (2000–2002), the Winona State University Institutional Animal Care and Use Committee excluded field studies of lower vertebrates from its purview. However, this research complied with all current ethical standards.
Informed Consent Statement
Not applicable.
Data Availability Statement
Data available from the authors upon reasonable request.
Funding
Funding was provided by the Minnesota Pollution Control Agency.
Declaration of Competing Interest
The author declares that he has no known competing financial interests or personal relationships that could have appeared to influence the work reported in this paper.
References
-
Armour CL, Duff DA, Elmore W. The effects of livestock grazing on riparian and stream ecosystems. Fisheries 1991, 16, 7–11. Available online: https://www.cabidigitallibrary.org/doi/full/10.5555/19911957963 (accessed on 26 December 2025).
-
Matthaei CD, Piggott JJ, Townsend CR. Multiple stressors in agricultural streams: Interactions among sediment addition, nutrient enrichment and water abstraction. J. Appl. Ecol. 2010, 47, 639–649. DOI:10.1111/j.1365-2664.2010.01809.x [Google Scholar]
-
Hall LW, Jr., Anderson RD, Killen WD, Alden RW, III. An analysis of multiple stressors on resident benthic communities in a California agricultural stream. Air Soil Wat. Res. 2018, 11, 1178622118777761. DOI:10.1177/1178622118777761 [Google Scholar]
-
Derose KL, Battaglia CF, Eastburn DJ, Roche LM, Becchetti TA, George HA, et al. Riparian health improves with managerial effort to implement livestock distribution practices. Rangeland J. 2020, 42, 153–160. DOI:10.1071/RJ20024 [Google Scholar]
-
Burdon FJ, McIntosh AR, Harding JS. Habitat loss drives threshold response of benthic invertebrate communities to deposited sediment in agricultural streams. Ecol. Appl. 2013, 23, 1036–1047. DOI:10.1890/12-1190.1 [Google Scholar]
-
Agouridis CT, Workman SR, Warner RC, Jennings GD. Livestock grazing management impacts on stream water quality: A review. J. Am. Water Res. Assoc. 2005, 41, 591–606. DOI:10.1111/j.1752-1688.2005.tb03757.x [Google Scholar]
-
Davis S, Golladay SW, Vellidis G, Pringle CM. Macroinvertebrate biomonitoring in intermittent coastal plain streams impacted by animal agriculture. J. Environ. Qual. 2003, 32, 1036–1043. DOI:10.2134/jeq2003.1036 [Google Scholar]
-
Fitzpatrick FA, Scudder BC, Lenz BN, Sullivan DJ. Effects of multi-scale environmental characteristics on agricultural stream biota in eastern Wisconsin. J. Am. Water Res. Assoc. 2001, 37, 1489–1507. DOI:10.1111/j.1752-1688.2001.tb03655.x [Google Scholar]
-
Dale VH, Polasky S. Measures of the effects of agricultural practices on ecosystem services. Ecol. Econ. 2007, 64, 286–296. DOI:10.1016/j.ecolecon.2007.05.009 [Google Scholar]
-
Teufl B, Weigelhofer G, Fuchsberger J, Hein T. Effects of hydromorphology and riparian vegetation on the sediment quality of agricultural low-order streams: Consequences for stream restoration. Environ. Sci. Pollut. Res. 2013, 20, 1781–1793. DOI:10.1007/s11356-012-1135-2 [Google Scholar]
-
Heitke JD, Pierce CL, Gelwicks GT, Simmons GA, Siegwarth GL. Habitat, land use, and fish assemblage relationships in Iowa streams: Preliminary assessment in an agricultural landscape. Am. Fish. Soc. Symp. 2006, 48, 287–303. [Google Scholar]
-
Schilling KE, Tomer MD, Gassman PW, Kling CL, Isenhart TM, Moorman TB, et al. A tale of three watersheds: Nonpoint source pollution and conservation practices across Iowa. Choices 2007, 22, 87–95. Available online: https://www.jstor.org/stable/pdf/choices.22.2.0087.pdf (accessed on 26 December 2025).
-
Herringshaw CJ, Stewart TW, Thompson JR, Anderson PF. Land use, stream habitat and benthic invertebrate assemblages in a highly altered Iowa watershed. Am. Midl. Nat. 2011, 165, 274–293. DOI:10.1674/0003-0031-165.2.274 [Google Scholar]
-
Brendel C, Soupir ML. Relating watershed characteristics to elevated stream Escherichia coli levels in agriculturally dominated landscapes: An Iowa case study. Water 2017, 9, 154. DOI:10.3390/w9030154 [Google Scholar]
-
Waters TF. The Streams and Rivers of Minnesota; University of Minnesota Press: Minneapolis, MN, USA, 1977. [Google Scholar]
-
Trimble SW. Historical Agriculture and Soil Erosion in the Upper Mississippi Valley Hill Country; CRC Press: Boca Raton, FL, USA, 2013. [Google Scholar]
-
Poudel DD. Surface water quality monitoring of an agricultural watershed for nonpoint source pollution control. J. Soil Water Conserv. 2016, 71, 310–326. DOI:10.2489/jswc.71.4.310 [Google Scholar]
-
Kroll SA, Oakland HC. A review of studies documenting the effects of agricultural best management practices on physiochemical and biological measures os stream ecosystem integrity. Nat. Areas J. 2019, 39, 58–77. DOI:10.3375/043.039.0105 [Google Scholar]
-
Palacios-Linares D, Guzman SM. Systematic review of best management practice implementation for agricultural phosphorus management in Florida: A 30-year overview. J. Nat. Res. Agric. Ecosys. 2024, 2, 139–152. DOI:10.13031/jnrae.15912 [Google Scholar]
-
Bodrud-Doza M, Yang W, Liu Y, Yerubandi R, Daggupati P, DeVries B, et al. Evaluating best management practices for nutrient load reductions in tile-drained watersheds of the Laurentian Great Lakes Basin: A literature review. Sci. Total Environ. 2025, 965, 178657. DOI:10.1016/j.scitotenv.2025.178657 [Google Scholar]
-
Liu Y, Yang W, Bass B, Rao YR. Effectiveness of agricultural BMPs on phosphorus load reduction for the Canadian Lake Erie Basin: A literature review. Environ. Rev. 2025, 33, 1–24. DOI:10.1139/er-2024-0069 [Google Scholar]
-
Johengen TH, Beeton AM, Rice DW. Evaluating the effectiveness of best management practices to reduce agricultural nonpoint source pollution. Lake Reserv. Manag. 1989, 5, 63–70. DOI:10.1080/07438148909354682 [Google Scholar]
-
Gitau MW, Veith TL, Gburek WJ. Farm-level optimization of BMP placement for cost-effective pollution reduction. Trans. Am. Soc. Agric. Eng. 2004, 47, 1923–1931. DOI:10.13031/2013.17805 [Google Scholar]
-
Vieth TL, Wolfe ML, Heatwole CD. Cost-effective BMP placement: Optimization versus targeting. Trans. Am. Soc. Agric. Eng. 2004, 47, 1585–1594. DOI:10.13031/2013.17636 [Google Scholar]
-
Pearce NJT, Yates AG. Agricultural best management practice abundance and location does not influence stream ecosystem function or water quality in the summer season. Water 2015, 7, 6861–6876. DOI:10.3390/w7126661 [Google Scholar]
-
Lintern A, McPhillips L, Winfrey B, Duncan J, Grady C. Best management practices for diffuse nutrient pollution: Wicked problems across urban and agricultural watersheds. Environ. Sci. Technol. 2020, 54, 9159–9174. DOI:10.1021/acs.est.9b07511 [Google Scholar]
-
Yates AG, Bailey RC, Schwindt JA. Effectiveness of best management practices in improving stream ecosystem quality. Hydrobiologia 2007, 583, 331–344. DOI:10.1007/s10750-007-0619-4 [Google Scholar]
-
Yuan Y, Dabney SM, Bingner RL. Cost effectiveness of agricultural BMPs for sediment reduction in the Mississippi Delta. J. Soil Water Conserv. 2002, 57, 259–267. DOI:10.1080/00224561.2002.12457455 [Google Scholar]
-
Easton ZM, Walter MT, Steenhuis TS. Combined monitoring and modeling indicate the most effective agricultural best management practices. J. Environ. Qual. 2008, 37, 1798–1809. DOI:10.2134/jeq2007.0522 [Google Scholar]
-
Rao NS, Easton ZM, Schneiderman EM, Zion MS, Lee DR, Steenhuis TS. Modeling watershed-scale effectiveness of agricultural best management practices to reduce phosphorus loading. J. Environ. Manag. 2009, 90, 1385–1395. DOI:10.1016/j.jenvman.2008.08.011 [Google Scholar]
-
Merriman KR, Gitau MW, Chaubey I. A tool for estimating best management practice effectiveness in Arkansas. Appl. Eng. Agric. 2009, 25, 199–213. DOI:10.13031/2013.26333 [Google Scholar]
-
Tuppad P, Kannan N, Srinivasan R, Rossi CG, Arnold JG. Simulation of agricultural management alternatives for watershed protection. Water Res. Manag. 2010, 24, 3115–3144. DOI:10.1007/s11269-010-9598-8 [Google Scholar]
-
Zhang X, Zhang M. Modeling effectiveness of agricultural BMPs to reduce sediment load and organophosphate pesticides in surface runoff. Sci. Total Environ. 2011, 409, 1949–1958. DOI:10.1016/j.scitotenv.2011.02.012 [Google Scholar]
-
Liu R, Zhang P, Wang X, Wang J, Yu W, Shen Z. Cost-effectiveness and cost-benefit analysis of BMPs in controlling agricultural nonpoint source pollution in China based on the SWAT model. Environ. Monit. Assess. 2014, 186, 9011–9022. DOI:10.1007/s10661-014-4061-6 [Google Scholar]
-
Geng R, Wang X, Sharpley AN, Meng F. Spatially-distributed cost-effectiveness analysis framework to control phosphorus from agricultural diffuse pollution. PLoS ONE 2015, 10, e0130607. DOI:10.1371/journal.pone.0130607 [Google Scholar]
-
Xie H, Chen L, Shen Z. Assessment of agricultural best management practices using models: Current issues and future perspectives. Water 2015, 7, 1088–1108. DOI:10.3390/w7031088 [Google Scholar]
-
Li P, Muenich RL, Chaubey I, Wei X. Evaluating agricultural BMP effectiveness in improving freshwater provisioning under changing climate. Water Res. Manag. 2019, 33, 453–473. DOI:10.1007/s11269-018-2098-y [Google Scholar]
-
Sharma S, Bijukshe S, Puppala SS. Monitoring, modeling and planning best management practices (BMPs) in the Atwood and Tappan Lake watersheds with stakeholders engagements. Water 2023, 15, 3028. DOI:10.3390/w15173028 [Google Scholar]
-
Chen G, Liu L, Wang W, Wang R, Li Y, Tang X, et al. Effectiveness of best management practices for non-point source pollution in intensively managed agricultural watersheds. J. Clean. Prod. 2025, 495, 145076. DOI:10.1016/j.jclepro.2025.145076 [Google Scholar]
-
Meals DW, Dressing SA, Davenport TE. Lag time in water quality response to best management practices: A review. J. Environ. Qual. 2010, 39, 85–96. DOI:10.2134/jeq2009.0108 [Google Scholar]
-
Melland AR, Fenton O, Jordan P. Effects of agricultural land management changes on surface water quality: A review of meso-scale catchment research. Environ. Sci. Policy 2018, 84, 19–25. DOI:10.1016/j.envsci.2018.02.011 [Google Scholar]
-
Edwards DR, Daniel TC, Scott HD, Moore PA, Jr., Murdoch JF, Vendrell PF. Effect of BMP implementation on storm flow quality of two northwestern Arkansas streams. Trans. Am. Soc. Agric. Eng. 1997, 40, 1311–1319. DOI:10.13031/2013.21389 [Google Scholar]
-
Vowell JL. Using stream bioassessment to monitor best management practice effectiveness. For. Ecol. Manag. 2001, 143, 237–244. DOI:10.1016/S0378-1127(00)00521-1 [Google Scholar]
-
Inamdar SP, Mostaghimi S, McClellan PW, Brannan KM. BMP impacts on sediment and nutrient yields from an agricultural watershed in the Coastal Plain region. Trans. Am. Soc. Agric. Eng. 2001, 44, 1191–1200. DOI:10.13031/2013.6449 [Google Scholar]
-
Gabel KW, Wehr JD, Truhn KM. Assessment of the effectiveness of best management practices for streams draining agricultural landscapes using diatoms and macroinvertebrates. Hydrobiologia 2012, 680, 247–264. DOI:10.1007/s10750-011-0933-8 [Google Scholar]
-
Wilcock RJ, Monaghan RM, Quinn JM, Srinivasan MS, Houlbrooke DJ, Duncan MJ, et al. Trends in water quality of five dairy farming streams in response to adoption of best practice and benefits of long-term monitoring at the catchment scale. Mar. Freshw. Res. 2013, 64, 401–412. DOI:10.1071/MF12155 [Google Scholar]
-
Lizotte R, Knight S, Locke M, Steinriede W, Testa S, Bryant C. Water quality monitoring of an agricultural watershed lake: The effectiveness of agricultural best management practices. Trans. Ecol. Environ. 2012, 160, 283–294. DOI:10.2495/DN120251 [Google Scholar]
-
Liu Y, Engel BA, Flanagan DC, Gitau MW, McMillan SK, Chaubey I. A review on effectiveness of best management practices in improving hydrology and water quality: Needs and opportunities. Sci. Total Environ. 2017, 601–602, 580–593. DOI:10.1016/j.scitotenv.2017.05.212 [Google Scholar]
-
Varela WL, Mundahl ND, Bergen S, Staples DF, Cochran-Biederman J, Weaver CR. Physical and biological stream health in an agricultural watershed after 30+ years of targeted conservation practices. Water 2023, 15, 3475. DOI:10.3390/w15193475 [Google Scholar]
-
Mundahl ND, Mundahl ED. Aquatic community structure and stream habitat in a karst agricultural landscape. Ecol. Process. 2022, 11, 18. DOI:10.1186/s13717-022-00365-1 [Google Scholar]
-
Mundahl ND, Varela WL, Weaver C, Mundahl ED, Cochran-Biederman JL. Stream habitats and aquatic communities in an agricultural watershed: Changes related to a mandatory riparian buffer law. Environ. Manag. 2023, 72, 945–958. DOI:10.1007/s00267-023-01864-3 [Google Scholar]
-
Mundahl ND, Hunt AM. Recovery of stream invertebrates after catastrophic flooding in southeastern Minnesota, USA. J. Freshw. Ecol. 2011, 26, 445–457. DOI:10.1080/02705060.2011.596657 [Google Scholar]
-
Anderson D. Economic Impact of Recreation Trout Angling in the Driftless Area; University of Wisconsin-La Crosse: La Crosse, WI, USA, 2016. [Google Scholar]
-
Troelstrup NH, Jr., Perry JA. Water quality in southeastern Minnesota streams: Observations along a gradient of land use and geology. J. Minn. Acad. Sci. 1989, 55, 6–13. Available online: https://digitalcommons.morris.umn.edu/jmas/vol55/iss1/2/ (accessed on 26 December 2025).
-
Nerbonne BA, Vondracek B. Effect of local land use on physical habitat, benthic macroinvertebrates, and fish in the Whitewater River, Minnesota, USA. Environ. Manag. 2001, 28, 87–99. DOI:10.1007/s002670010209 [Google Scholar]
-
Vondracek B, Blann KL, Cox CB, Nerbonne JF, Mumford KG, Nerbonne BA, et al. Land use, spatial scale, and stream systems: Lessons from an agricultural region. Environ. Manag. 2005, 36, 775–791. DOI:10.1007/s00267-005-0039-z [Google Scholar]
-
Thorn WC, Anderson C, Lorenzen W, Hendrickson D, Wagner J. A review of trout management in southeast Minnesota streams. N. Am. J. Fish. Manag. 1997, 17, 860–872. DOI:10.1577/1548-8675(1997)017<0860:AROTMI>2.3.CO;2 [Google Scholar]
-
Mundahl ND. Characterizing stream condition with benthic macroinvertebrates in southeastern Minnesota, USA: Agriculture, channelization, and karst geology impact lotic habitats and communities. Insects 2025, 16, 59. DOI:10.3390/insects16010059 [Google Scholar]
-
Wall DB, McGuire SA, Magner JA. Water Quality Monitoring and Assessment in the Garvin Brook Rural Clean Water Project Area; Minnesota Pollution Control Agency: Saint Paul, MN, USA, 1989. [Google Scholar]
-
Kruse CG, Hubert WA, Rahel FJ. Single-pass electrofishing predicts trout abundance in mountain streams with sparse habitat. N. Am. J. Fish. Manag. 1998, 18, 940–946. DOI:10.1577/1548-8675(1998)018<0940:SPEPTA>2.0.CO;2 [Google Scholar]
-
Meador MR, McIntyre JP, Pollock KH. Assessing the efficacy of single-pass backpack electrofishing to characterize fish community structure. Trans. Am. Fish. Soc. 2003, 132, 39–46. DOI:10.1577/1548-8659(2003)132<0039:ATEOSP>2.0.CO;2 [Google Scholar]
-
Bertrand KN, Gido KB, Guy CS. An evaluation of single-pass versus multiple-pass backpack electrofishing to estimate trends in species abundance and richness in prairie streams. Trans. Kansas Acad. Sci. 2006, 109, 131–138. DOI:10.1660/0022-8443(2006)109[131:AEOSVM]2.0.CO;2 [Google Scholar]
-
Kauth MJ, Schumann DA, Graeb KNB, Hoback WW. Suitability of single-pass backpack electrofishing to estimate fish abundance and describe assemblage structure in prairie streams. Prairie Nat. 2019, 51, 17–24. Available online: https://digitalcommons.unl.edu/tpn/275/ (accessed on 26 December 2025).
-
Franz JL. Procedure Manual and Quality Assurance Plan; Southeast Minnesota Analytical Service, Department of Chemistry, Winona State University: Winona, MN, USA, 2002. [Google Scholar]
-
Hilsenhoff WL. Aquatic Insects of Wisconsin: Generic Keys and Notes on Biology, Ecology and Distribution; Technical Bulletin No. 89; Wisconsin Department of Natural Resources: Madison, WI, USA, 1975. [Google Scholar]
-
Pennak RW. Fresh-Water Invertebrates of the United States, 2nd ed.; John Wiley & Sons: New York, NY, USA, 1978. [Google Scholar]
-
Merritt RW, Cummins KW. (Eds.). An Introduction to the Aquatic Insects of North America, 2nd ed.; Kendall-Hunt Publishing Company: Dubuque, IA, USA, 1984. [Google Scholar]
-
Thorp JH, Covich AP. (Eds.). Ecology and Classification of North American Freshwater Invertebrates; Academic Press: San Diego, CA, USA, 1991. [Google Scholar]
-
Minnesota Water Pollution Control Agency. Water Quality Standards; Minnesota Pollution Control Agency: Saint Paul, MN, USA, 2025. Available online: https://www.pca.state.mn.us/business-with-us/water-quality-standards (accessed on 26 December 2025).
-
Brower JE, Zar JH, von Ende CN. Field and Laboratory Methods for General Ecology, 4th ed.; WCB McGraw-Hill: Boston, MA, USA, 1998. [Google Scholar]
-
Mundahl ND, Simon TP. Development and application of an index of biotic integrity for coldwater streams of the upper midwestern United States. In Assessing the Sustainability and Biological Integrity of Water Resource Quality Using Fish Assemblages; Simon TP, Ed.; Lewis Publishers: Boca Raton, FL, USA, 1998; pp. 383–415. [Google Scholar]
-
Wittman E, Mundahl ND. Development and validation of a benthic index of biotic integrity (B-IBI) for streams in southeastern Minnesota. Winona State Univ. Floruit 2004, 1, 41–48. [Google Scholar]
-
Legendre P, Gallagher ED. Ecologically meaningful transformations for ordination of species data. Oecologia 2001, 129, 271–280. DOI:10.1007/s004420100716 [Google Scholar]
-
Wall DB, Evenson MG, Regan CP, Magner JA, Anderson WP. Understanding the groundwater system: The Garvin Brook experience. In Proceedings of the National Rural Clean Water Program Symposium; US Environmental Protection Agency, Office of Research and Development: Washington, DC, USA, 1992; pp. 59–70. [Google Scholar]
-
Schnaser AC, Mundahl ND. Recovery of a headwater stream population of brown trout after a fish kill in southeastern Minnesota, USA. Environ. Biol. Fish. 2022, 105, 1179–1192. DOI:10.1007/s10641-022-01331-8 [Google Scholar]
-
Mundahl ND. Recovery of a population of slimy sculpin (Uranidea cognata) after an autumn fish kill in the headwaters of a Minnesota trout stream. Water 2024, 16, 283. DOI:10.3390/w16020283 [Google Scholar]
-
Herman MR, Nejadhashemi AP, Daneshvar F, Ross DM, Woznicki SA, Zhang Z, et al. Optimization of conservation practice implementation strategies in the context of stream health. Ecol. Eng. 2015, 84, 1–12. DOI:10.1016/j.ecoleng.2015.07.011 [Google Scholar]
-
Ahsan A, Das SK, Khan MHRB, Ng AWM, Al-Ansari N, Ahmed S, et al. Modeling the impacts of best management practices (BMPs) on pollution reduction in the Yarra River catchment, Australia. Appl. Water Sci. 2023, 13, 98. DOI:10.1007/s13201-022-01812-2 [Google Scholar]
-
Doppelt B, Scurlock M, Frissell C, Karr J. Entering the Watershed: A New Approach to Save America’s River Ecosystems; Island Press: Washington, DC, USA, 1993. [Google Scholar]
-
Runkel AC, Tipping RG, Alexander EC, Jr., Green JA, Mossler JH, Alexander SC. Hydrogeology of the Paleozoic Bedrock in Southeastern Minnesota; Minnesota Geological Survey Report of Investigations 61; Minnesota Geological Survey: Saint Paul, MN, USA, 2003. [Google Scholar]
-
Karr JR, Chu EW. Restoring Life in Running Waters: Better Biological Monitoring; Island Press: Washington, DC, USA, 1999. [Google Scholar]
-
Simon TP. (Ed.). Biological Response Signatures: Indicator Patterns Using Aquatic Communities; CRC Press: Boca Raton, FL, USA, 2003. [Google Scholar]
-
Gammon JR, Faatz WC, Simon TP. Patterns in water quality and fish assemblages in three central Indiana streams with emphasis on animal feedlot operations. In Biological Response Signatures: Indicator Patterns Using Aquatic Communities; Simon TP, Ed.; CRC Press: Boca Raton, FL, USA, 2003; pp. 373–417. [Google Scholar]
-
Carlisle DM, Stewart PM, Butcher JT. Macroinvertebrate assemblages associated with patterns in land use and water quality. In Biological Response Signatures: Indicator Patterns Using Aquatic Communities; Simon TP, Ed.; CRC Press: Boca Raton, FL, USA, 2003; pp. 271–285. [Google Scholar]
-
Waters TF. Sediment in Streams: Sources, Biological Effects and Control; American Fisheries Society Monograph 7; American Fisheries Society: Bethesda, MD, USA, 1995. [Google Scholar]
-
Minnesota Pollution Control Agency. River and Stream Biological Monitoring; Minnesota Pollution Control Agency: Saint Paul, MN, USA, 2026. Available online: https://www.pca.state.mn.us/air-water-land-climate/river-and-stream-biological-monitoring (accessed on 2 January 2026).
-
Ohio Environmental Protection Agency. Biological Criteria for the Protection of Aquatic Life; Ohio Environmental Protection Agency: Columbus, OH, USA, 2025. Available online: https://epa.ohio.gov/divisions-and-offices/surface-water/reports-data/biological-criteria-for-the-protection-of-aquatic-life (accessed on 2 January 2026).
-
Huff DD, Miller LM, Vondracek B. Patterns of ancestry and genetic diversity in reintroduced populations of the slimy sculpin: Implications for conservation. Conserv. Genet. 2010, 11, 2379–2391. DOI:10.1007/s10592-010-0124-6 [Google Scholar]
-
Minnesota Department of Natural Resources. Brook Trout Reintroduction Program; Minnesota Department of Natural Resources: Lanesboro, MN, USA, 2026. Available online: https://www.dnr.state.mn.us/areas/fisheries/lanesboro/brooktrout.html (accessed on 2 January 2026).
-
Lamothe KA, Drake DAR, Pitcher TE, Broome JE, Dextrase AJ, Gillespie A, et al. Reintroduction of fishes in Canada: A review of research progress for SARA-listed species. Environ. Rev. 2019, 27, 575–599. DOI:10.1139/er-2019-0010 [Google Scholar]
-
Williams DD, Williams NE. The upstream/downstream movement paradox of lotic invertebrates: Quantitative evidence from a Welsh mountain stream. Freshw. Biol. 1993, 30, 199–218. DOI:10.1111/j.1365-2427.1993.tb00802.x [Google Scholar]
-
Petersen I, Winterbottom JH, Orton S, Friberg N, Hildrew AG, Spiers DC, et al. Emergence and lateral dispersal of adult Plecoptera and Trichoptera from Broadstone Stream, U.K. Freshw. Biol. 1999, 42, 401–416. DOI:10.1046/j.1365-2427.1999.00466.x [Google Scholar]
-
Mundahl ND. Analysis of a catch-and-harvest fishing contest for brown trout spanning 50+ years: Long-term trends influenced by fisheries management actions and angler behavior. N. Am. J. Fish. Manag. 2022, 42, 1653–1664. DOI:10.1002/nafm.10853 [Google Scholar]
-
Mundahl ND, Schnaser AC. Abundance, cover use, and clustering of brown trout spawning redds during stream habitat rehabilitation. Ecol. Freshw. Fish. 2023, 32, 902–915. DOI:10.1111/eff.12731 [Google Scholar]
-
Minnesota Pollution Control Agency. Minnesota’s Impaired Waters List; Minnesota Pollution Control Agency: Saint Paul, MN, USA, 2026. Available online: https://www.pca.state.mn.us/air-water-land-climate/minnesotas-impaired-waters-list (accessed on 27 March 2026).