Domain-Specific Cloud Business Operating System for New Power Systems: Concept, Key Technologies and Initial Applications

Domain-Specific Cloud Business Operating System for New Power Systems: Concept, Key Technologies and Initial Applications
Junbo Zhang * Jiaming Hu Yijian Luo Souyuan Tao Weijian Yuan Yang Liu Ziming Lin Ying Peng Zicheng Huang
Received: 17 November 2025 Revised: 05 January 2026 Accepted: 03 March 2026 Published: 16 March 2026

© 2026 The authors. This is an open access article under the Creative Commons Attribution 4.0 International License (https://creativecommons.org/licenses/by/4.0/).
Graphical Abstract
1. Introduction
With the advancement of digitization in new power systems, numerous business applications need to orchestrate domain-specific functional modules in series or parallel, forming complex, long-chain computational tasks [1,2]. However, dedicated digital platforms independently developed by various business departments expose a series of critical operational issues when confronting large-scale, long-chain, and rapidly evolving business demands [3,4].
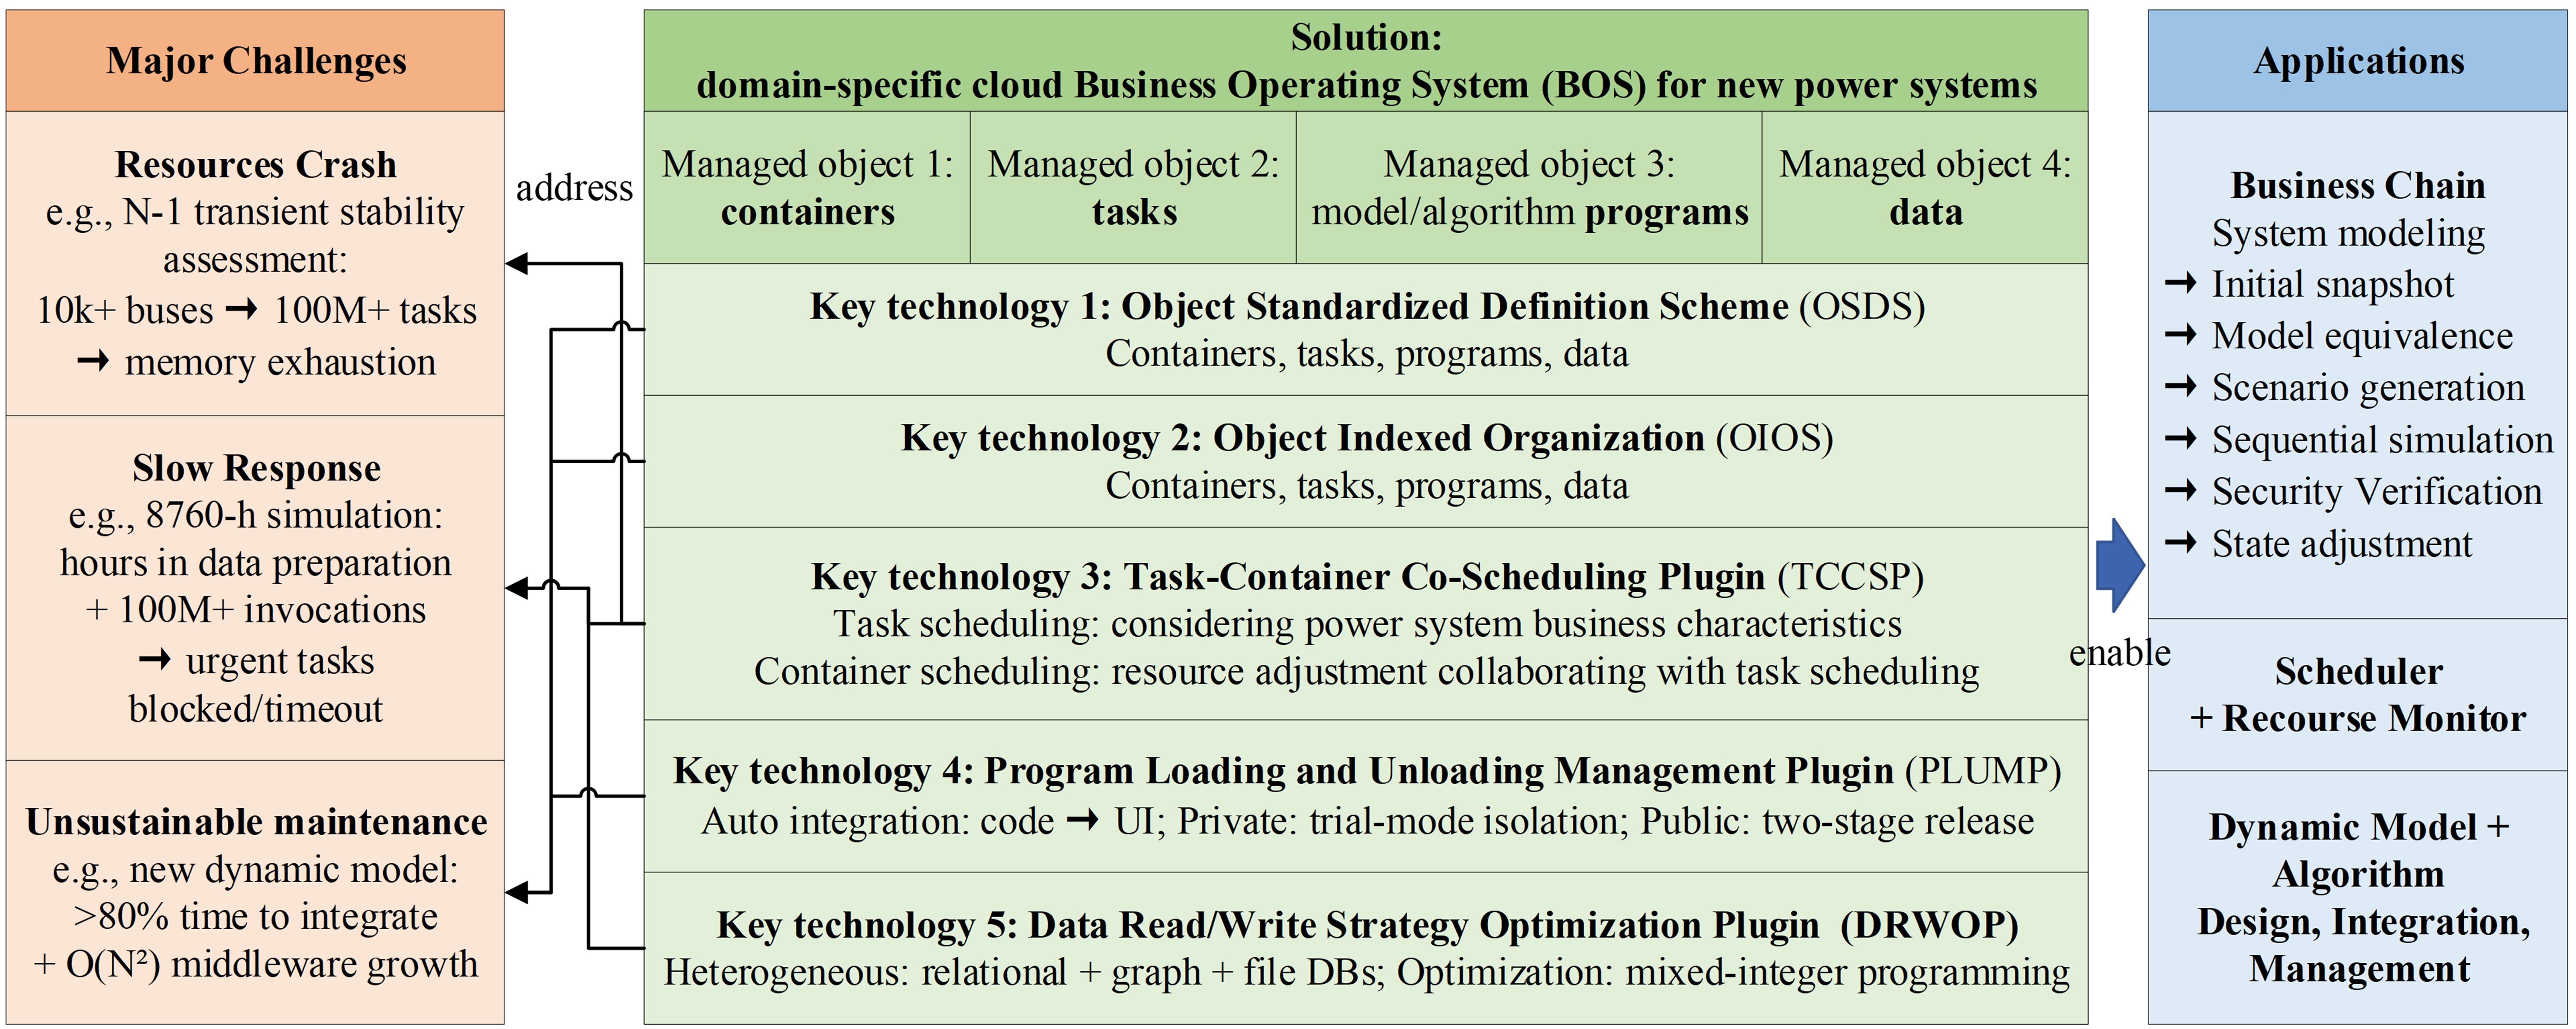
First, the massive scale of business operations lacks global resource coordination, making computational resources prone to crashes and compromising business reliability [5,6]. Both large-scale applications with massive concurrent tasks and long-chain businesses requiring multi-stage sequential execution share a common pitfall: each functional stage manages its own computational resources independently. Without global synergy, each stage then tends to maximize its local performance by initiating as many parallel computations as possible. When all stages operate concurrently under this paradigm, it can lead to physical server memory exhaustion, forced termination of business processes, and ultimately, data loss and computational interruption across the entire business chain [7,8]. For instance, during N-1 transient stability assessment of a power grid with over ten thousand buses, a single scenario snapshot can generate tens of thousands of power flow and stability analysis tasks, leading to hundreds of millions of service invocations across multiple sequential snapshots. Such massive concurrency of memory-intensive tasks can easily overwhelm cluster memory, causing the entire assessment request to crash [9].
Second, the execution of data read/write and computational tasks lacks specialized design, making it difficult to meet production timeliness requirements. Data silos across business stages necessitate an inefficient pre-processing workflow: data must be extracted and integrated from multiple distributed sources via middleware before computation can begin, resulting in a long preparation duration [10,11]. Meanwhile, generic scheduling strategies neither consider the priority and urgency of power system business nor coordinate with computational resource scheduling. This dual neglect fails to ensure that critical tasks are prioritized and completed within required time windows [12,13]. For example, an annual 8760-h sequential power flow simulation for a large grid requires aggregating multi-type data, such as topology, generator parameters, and historical renewable/load profiles, which are managed by disparate business modules. This fragmented data management can cause the preparation phase alone to consume hours. Once the computation begins, it traverses multiple sequential business stages, including scenario generation, unit commitment, power flow-constrained dispatch, stability verification, and security-constrained scenario adjustment, involving hundreds of millions of service invocations. This long-chain and resource-intensive process can monopolize cluster resources for an extended period if not properly scheduled, thus directly blocking the execution of more urgent tasks. Furthermore, the accumulation of such blocked requests can ultimately lead to chronic unresponsiveness or even a complete operational standstill [14].
Third, the escalating complexity of business platforms leads to explosive growth in compatible development and deployment efforts, rendering maintenance processes unsustainable. For program integration, when power system domain experts propose new specialized models or algorithms, they must rely on software developers to simultaneously write the whole front-end and back-end code, forming an operational close-loop. This dependency creates a long and costly path from innovation to production validation [15,16]. For data connectivity, each newly introduced business necessitates the development of dedicated data-bridging middleware with all related existing businesses. As the variety of businesses grows, the number and management complexity of these data middleware components increase exponentially, making platform operation and maintenance exceedingly difficult [17]. For instance, in grid-connection stability analysis, engineers must frequently integrate specialized device models to adapt to the rapid iteration of power electronic devices—a process that alone can consume over 80% of the analysis cycle [18]. Meanwhile, to enable comparison of results across different simulation engines, dedicated one-to-one data-conversion interfaces must be developed for each engine pair. This paradigm results in thousands, or even on the order of (1000 × N2), distinct middleware components. The compounding effect of these two factors creates a massive maintenance burden that is ultimately unsustainable for the platform.
Confronted with these challenges, both industry and academia have made numerous attempts based on mainstream digital solutions, such as microservices architecture [19] and Cloud-Native Operating Systems (OS). For resources, the Cloud-Native OS supports dynamic resource adjustment through autoscaling techniques, but these strategies mainly rely on general metrics, lacking coupling with specific task attributes and business logic [20]. This leads to problems such as under-provisioning, over-provisioning, or inefficient scaling, resulting in underutilized computing power and sacrificed efficiency. For efficiency, existing research has proposed task scheduling algorithms that consider power system business attributes [21,22]. However, these approaches focus solely on task scheduling and do not incorporate computational resources as decision variables in the overall optimization problem, leading to resource idling and slow response times. For maintainability, Continuous Integration/Continuous Delivery (CI/CD) practices provide an automated deployment pipeline, and research on power system ontology data middle platforms has proposed unified ontology data object designs [23,24]. Yet, due to the lack of standardized abstraction and systematic organization for all power system business programs and data, current generic approaches cannot support the independent, agile integration of domain-specific models/algorithms or enable closed-loop data flow across the entire business chain. Consequently, point-based solutions or incremental improvements have failed to fundamentally address the systemic challenge formed by the coupling of resource, efficiency, and maintainability issues. Constructing a systematic architecture for the unified management of power system digital business objects remains a significant bottleneck.
To break through the bottleneck, this paper proposes and develops a domain-specific cloud Business Operating System (BOS) for new power systems. Positioned as a holistic architectural and industrial application article, it focuses on demonstrating the system-level design completeness and functional utility of this new paradigm, rather than on the incremental optimization of any individual component, with the main contributions as follows. First, the concept of BOS is proposed, a novel architectural paradigm designed to achieve unified business resource management for four key objects (containers, tasks, programs, and data) through three systematic approaches. Second, an innovative mechanism for task-container co-scheduling is designed, effectively overcoming the computational efficiency bottlenecks inherent in traditional architectures. Third, standardized pluggable interfaces and a full lifecycle management mechanism for domain-specific programs are established, enabling flexible and agile integration of massive models and algorithms. Forth, a unified business data foundation is constructed, ensuring semantically consistent, high-performance data connectivity across the entire business chain.
The remainder of this paper is organized as follows. Section 2 elaborates on the design philosophy and architectural scheme of BOS, justifying its characterization as an operating system. Section 3 provides an in-depth analysis of BOS’s key technologies in managing containers, tasks, programs, and data. Section 4 demonstrates preliminary application cases built upon BOS. Finally, Section 5 concludes the paper and outlines future research directions.
2. Concept of BOS
2.1. Architecture of BOS
Before proposing the architecture of BOS, we first review the application of the generic microservices architecture and Cloud-Native OS in power system digital platforms. They provide conventional platform design and functional modules, forming a foundational framework. However, when dealing with domain-specific business requirements, significant capability gaps emerge, as summarized in Table 1.
Table 1. Generic Functional Modules/Design Schemes and Their Capability Gaps in Power System Digitization.
|
Module/ Design Scheme |
Generic Capability |
Required Capability Gaps for Power System Digitization |
|---|---|---|
|
User Interface |
Provides human-computer interaction. |
Dynamic update capability: Automatically refresh the front-end options and configuration forms upon integration of new models/algorithms. |
|
API Gateway |
Request authentication and routing. |
Can be reused without modification. |
|
Scheduler |
Simple scheduling and forwarding of requests from the User Interface. |
Extended scheduling scope: Support scheduling tasks generated by inter-service calls. Co-scheduling capability: Enable cooperative scheduling between tasks and computational resources. |
|
Power System Business Services |
Implement specific business logic. |
Dynamic integration capability: Support both dynamic loading of custom models/algorithms and their automated static deployment as embedded modules within business services. |
|
Data Read/Write Services |
Provide unified database access interfaces. |
Intelligent routing capability: Optimize data access paths based on power system business data characteristics. |
|
Database Organization Scheme |
Mature database products exist for various data characteristics. |
Domain-specific data organization scheme: Design a heterogeneous database cluster architecture tailored to the unique characteristics and relationships of power system business data. |
|
Container Management Module |
Manage container lifecycle and resource allocation based on simple strategies. |
Co-scheduling capability: Receive and execute unified commands for container lifecycle management and resource allocation issued by the Scheduler. |
|
Program Repository |
Program storage and version management (e.g., Git). |
Can be reused without modification. |
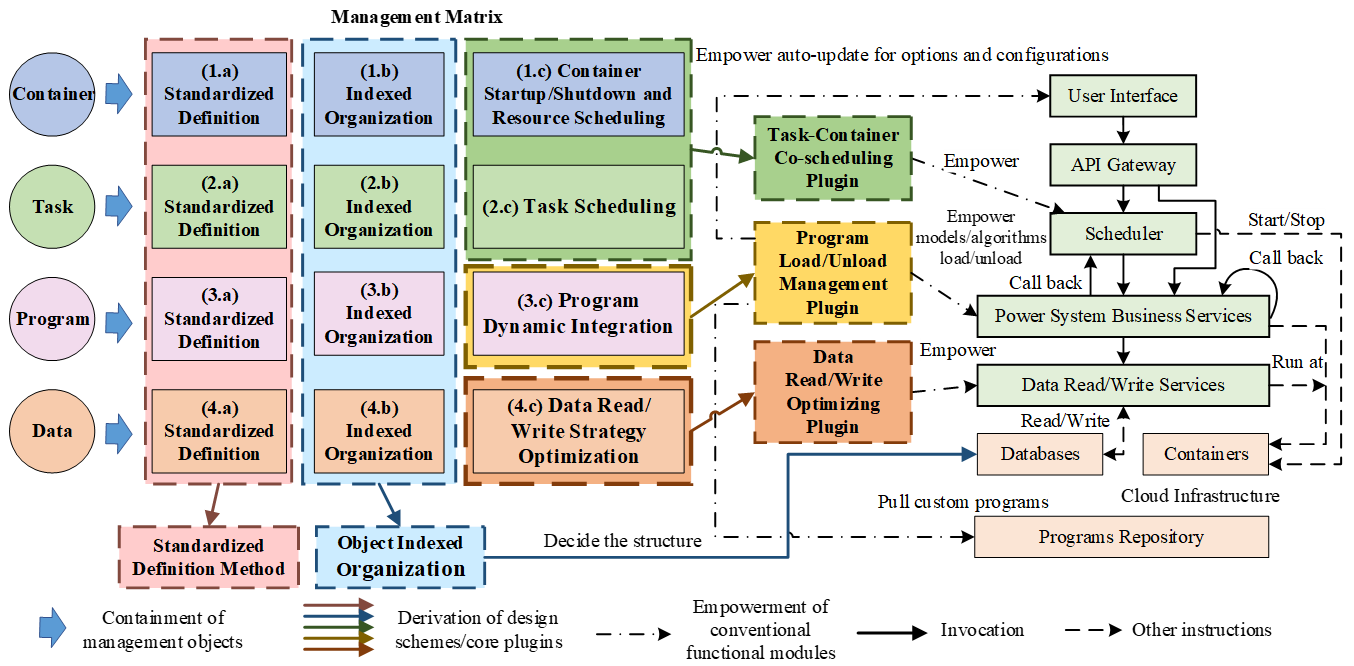
Building upon the generic microservices architecture and Cloud-Native OS, BOS introduces pivotal enhancements tailored to power system business characteristics. As illustrated in Figure 1, we propose a clear management matrix. This matrix defines a systematic approach to managing the four core objects (containers, tasks, programs, and data) through three methodological columns: (a) Standardized Definition, (b) Indexed Organization, and (c) Dynamic Management. The first two columns are instantiated as two domain-specific fundamental design schemes: the Object Standardized Definition Scheme and the Object Indexed Organization Scheme, respectively. To address the dynamic management needs shown in the third column—namely, task-container co-scheduling, program dynamic integration, and data read/write strategy optimization—three dedicated core plugins are developed and integrated into the conventional platform modules.
The details of these two design schemes and three plugins are elaborated as follows, illustrating how they directly address the capability gaps outlined in Table 1.
Scheme 1: Object Standardized Definition Scheme (OSDS). It establishes unified representation contracts for the four object types—Containers, Tasks, Programs, and Data—providing a consistent foundation for their identification, interaction, and scheduling. This scheme is a prerequisite for an indexed organization and dynamic management.
Scheme 2: Object Indexed Organization Scheme (OIOS). Building upon the OSDS, OIOS implements a systematic indexed organization for the four core objects, creating a system-wide metadata catalog and relationship map. This enables precise object localization, efficient association, and rapid retrieval, which constitutes the domain-specific enhancement required for the Database Organization Scheme.
Plugin 1: Task-Container Co-Scheduling Plugin (TCCSP). It establishes the core mechanism for real-time cooperative scheduling between tasks and computational resources, enabling efficient and reliable execution of large-scale concurrent tasks. By integrating the decision logic of the Container Management Module into the Scheduler, it transforms the scheduling paradigm from a passive model with fixed resources to a task-resource cooperative one. This satisfies the co-scheduling requirements for both the Scheduler and the Container Management Module.
Plugin 2: Program Load/Unload Management Plugin (PLUMP). It establishes a full lifecycle management mechanism for programs based on CI/CD principles. This mechanism automates the closed-loop process for custom models and algorithms, including upload, validation, registration, discovery, loading, and unloading. This satisfies the dynamic integration requirements for both the User Interface and Power System Business Services.
Plugin 3: Data Read/Write Optimizing Plugin (DRWOP). It establishes an intelligent planning mechanism for data access. This mechanism optimizes the execution paths for business data read/write requests, ensuring efficient access to the database cluster. This satisfies the intelligent routing requirement for the Data Read/Write Services.
To sum up, BOS is a domain-specific cloud operating system designed to address the three core production challenges outlined in the Introduction. The mapping between these challenges and the key solutions provided by BOS is summarized in Table 2.
Table 2. Mapping of Production Challenges to BOS Solutions.
|
Production Challenge |
BOS Solution |
|---|---|
|
Resources Issue: Computational resources are prone to crash. |
TCCSP |
|
Efficiency Issue: Business response is slow. |
TCCSP, DRWOP |
|
Maintainability Issue: Platform maintenance is unsustainable. |
OSDS, OIOS, PLUMP |
2.2. Why BOS Can Be Regarded as an OS: Comparisions with Two Generic OSs
The name “Business Operating System” originates from its fundamental similarities to generic operating systems in terms of core functionality and management philosophy. Its justification as an OS is demonstrated through the following two complementary comparisons.
The first comparison demonstrates BOS’s functionality extension by contrasting its scope with that of the generic Cloud-Native OS, highlighting its tailored response to power system digitization challenges. The Cloud-Native OS, such as Kubernetes, abstracts fundamental resources (e.g., computation, storage, networking) and supports full lifecycle management of containers. However, the digitization of new power systems demands the abstraction and management of not just containers, but also tasks, programs, and data, as illustrated by the management matrix in Figure 1. Consequently, BOS’s functional scope must extend from the infrastructure to the business layer, surpassing that of the generic Cloud-Native OS. To clearly illustrate this functional leap, Table 3 presents a systematic comparison between the two systems based on the 12 management methodologies defined in Figure 1.
Table 3. Comparison Between Cloud-Native OS and BOS.
|
Comparison Subjects |
(1.a) |
(1.b) |
(1.c) |
(2.a) |
(2.b) |
(2.c) |
(3.a) |
(3.b) |
(3.c) |
(4.a) |
(4.b) |
(4.c) |
|---|---|---|---|---|---|---|---|---|---|---|---|---|
|
Cloud-Native OS |
√ |
√ |
○ |
○ |
○ |
○ |
○ |
○ |
||||
|
BOS |
√ |
√ |
√ |
√ |
√ |
√ |
√ |
√ |
√ |
√ |
√ |
√ |
Legend: √ (Fully Supported), ○ (Partially Supported). The column indices (e.g., 1.a) refer to the management methodologies as defined in Figure 1.
As shown in Table 3, the Cloud-Native OS provides mature support for container standardization and indexing, along with basic mechanisms for task forwarding, container resource provisioning, and database organization. However, this capability is confined to the infrastructure layer. For the program and data objects that encapsulate the core semantics of power system business, the architecture lacks native, systematic management capabilities. Specifically, while it offers generic data definition and organization features through standard database products, it lacks the domain-specific semantic models and indexed organization schemes required to efficiently manage power system business data. Moreover, its task scheduling and resource scheduling mechanisms operate in isolation, designed for different objectives without intrinsic coordination, which prevents global optimization.
In contrast, BOS establishes a new paradigm centered on the unified orchestration of business objects. By applying systematic, standardized definitions and an indexed organization to the four core objects, and empowering them with dedicated intelligent plugins, BOS achieves an evolutionary leap from a generic Cloud-Native OS to a domain-specific business OS. This transformation provides a structured and intelligent foundation for upper-layer power system applications.
The second comparison demonstrates the significant philosophical isomorphism between BOS and the classic Desktop OS (e.g., Windows, Linux) at the architectural level. The Desktop OS manages a computer’s physical hardware resources by abstracting processes, files, memory, and device drivers, thereby providing a unified runtime environment for upper-layer software [25]. Although BOS manages digital business resources of power systems rather than physical hardware, its design philosophy is highly isomorphic to that of the Desktop OS: both abstract underlying heterogeneous resources through standardized interfaces and provide a unified, efficient, and secure runtime environment for upper-layer applications. To systematically demonstrate this architectural isomorphism, Table 4 provides a structural analogy between the two systems across two dimensions: management objects and core modules/schemes.
In summary, BOS successfully applies the core abstraction and management paradigms of the Desktop OS at the architectural level to power system digitization. The analogies detailed above collectively demonstrate that its design is not a superficial metaphor but a genuine structural isomorphism. Therefore, defining BOS as a domain-specific cloud business operating system is an architecturally precise description of its role as a foundational platform for digital business in new power systems. In essence, just as the Desktop OS provides a universal abstraction layer over heterogeneous hardware, BOS provides a universal abstraction layer over heterogeneous digital business resources, forming the strategic infrastructure for their efficient and stable orchestration.
Table 4. Functional Analogy between Desktop OS and BOS.
|
Dimensions |
Desktop OS |
BOS |
Manifestation of Isomorphism |
|---|---|---|---|
|
Management Objects |
Computing Resources (CPU, Memory) |
Container |
The fundamental, allocable execution resource pool |
|
Job |
Task Set |
The macro-level unit for coherent user/application requests |
|
|
Process |
Task |
The micro-level, independently schedulable execution unit |
|
|
Peripheral Devices |
Custom Program |
Extensible functional components integrated via standardized interfaces |
|
|
File System |
Database |
Hierarchically organized, persistent storage for structured data objects |
|
|
Core Modules/ Schemes |
Memory Management |
TCCSP |
Unified, cooperative scheduling of computational demands and resources to optimize efficiency |
|
Job Management |
|||
|
Process Management |
|||
|
Peripheral Devices Management |
PLUMP |
Standardized abstraction and lifecycle management of pluggable components |
|
|
File Management |
Scheme: OIOS; Module: DRWOP |
Unified hierarchical ordering (OIOS) and intelligent access optimization (DRWOP) for data objects. |
3. Key Technologies of BOS
The realization of BOS’s two foundational design schemes and three core plugins relies on five key technologies.
3.1. Object Standardized Definition
Standardized definition must be applied to all four object types. For containers, mature solutions exist, and BOS adopts the definition methodology from established products like Docker.
3.1.1. Task Standardized Definition: A Hierarchical Model Integrating User Request and Execution Perspectives
To bridge the user’s perspective of macro business requests with the system’s perspective of micro computational units, BOS introduces a hierarchical abstraction model—Task Set and Task—with standardized definitions for their structures and associated attributes, as shown in Figure 2. This design ensures clear management visibility and efficient scheduling execution.
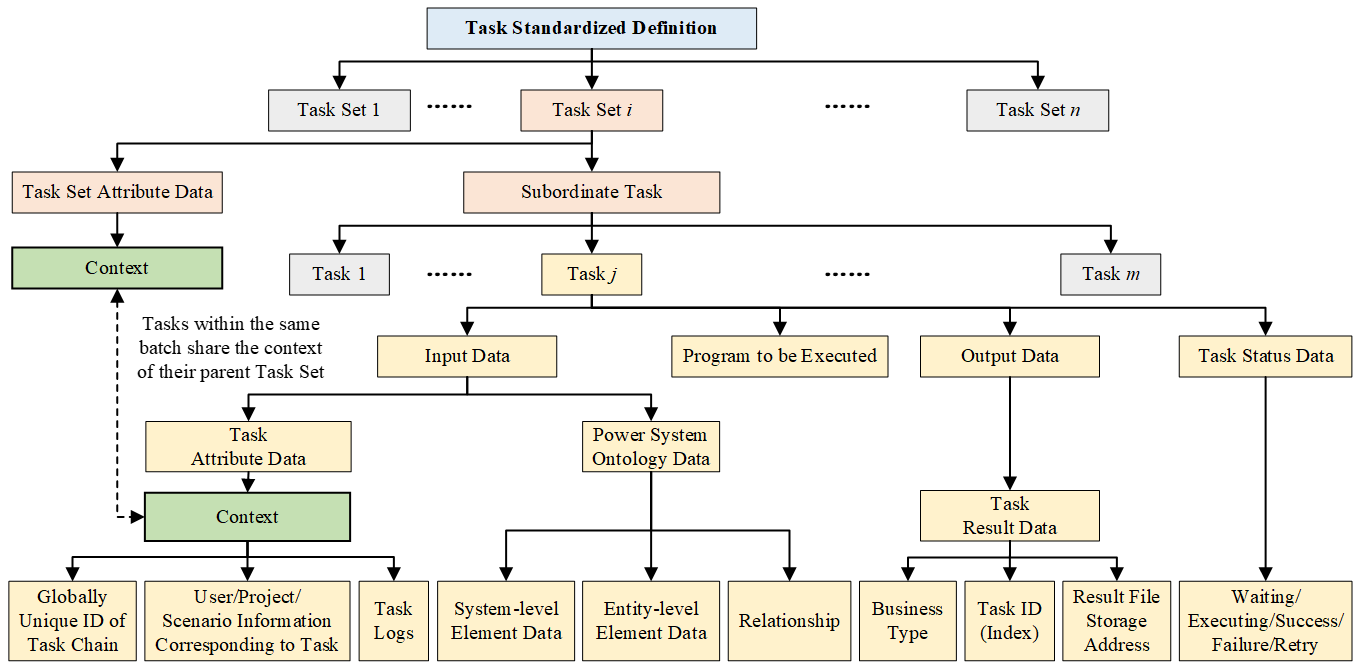
A task set serves as the macro unit for business request management. It corresponds to a complete business request initiated by a user and serves as the macro-level unit for business management. For example, an annual operation mode power flow verification request can be regarded as a task set. Its primary function is to create and maintain a unified context that propagates to all its subordinate tasks. This context includes a globally unique task trace identifier, user/project/scene information, and global task logs, thereby ensuring end-to-end traceability of the entire business chain.
A task represents the micro and minimal schedulable execution unit within a task set. It acts as the basic execution unit for the scheduler. When a business request requires calls to multiple services, the caller service decomposes a task set into several tasks. For instance, the aforementioned annual power flow verification task set can be decomposed into 8760 (365 days × 24 h) independent hourly power flow calculation tasks.
As the execution carrier, a task associates all necessary elements for its execution through the following four standardized interfaces:
-
-
Standardized Input Data: Defined as two parts: (i) task attribute data (inherited from the task set context and supplemented with its own logs), and (ii) power system ontology data (whose standardized definition is provided in Section 3.1.3).
-
-
Standardized Execution Logic: Embodied by a specific program, which adheres to the program standardized definition stipulated in Section 3.1.2.
-
-
Standardized Output Data: Primarily composed of task result data, whose structure conforms to the data standardized definition in Section 3.1.3.
-
-
Standardized Task State: Governed by a standard state machine that defines five canonical states—pending, executing, success, failed, and retrying—along with their transition rules.
3.1.2. Program Standardized Definition: Code Specification and Program Slot Mechanism
To enable automatic integration and full lifecycle management of custom programs, BOS enforces a mandatory code specification for business services. Centered on the domain-specific Program Slot mechanism proposed by BOS, this specification systematically decouples business logic and model/algorithm implementations from the generic service framework, as illustrated in Figure 3.
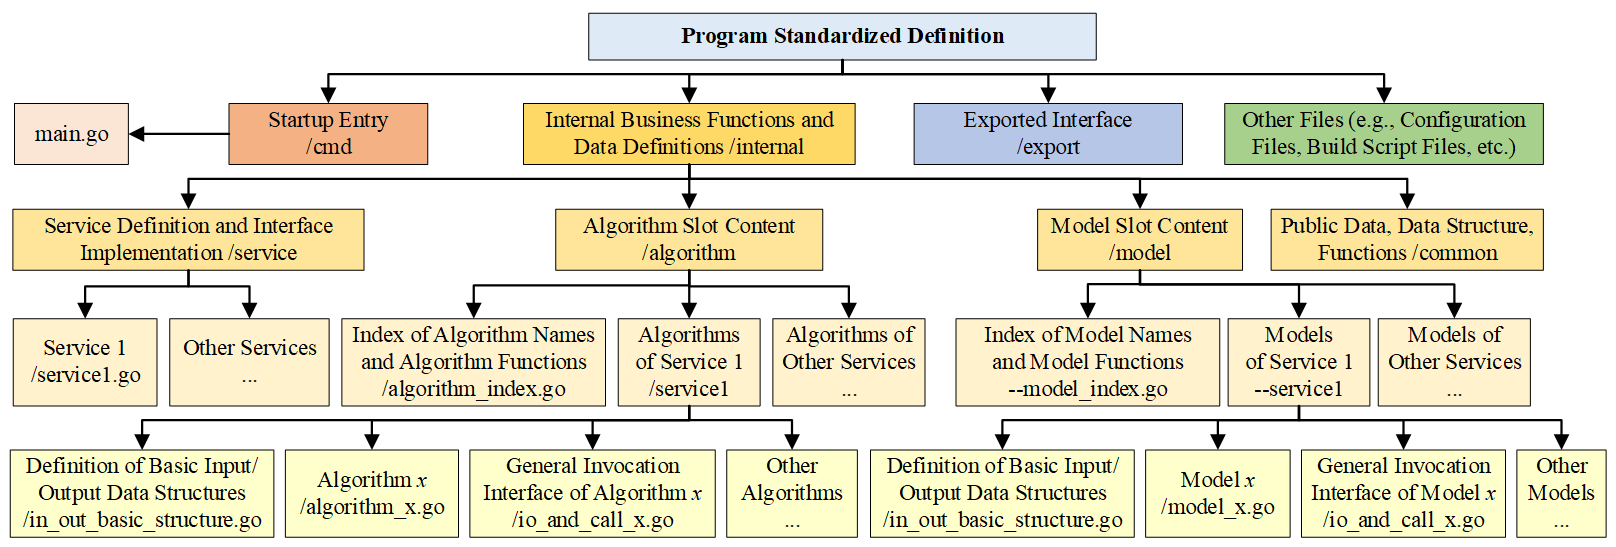
The BOS code specification is hierarchically organized, clearly defining the responsibilities of each directory and physically separating the pluggable program slots from the service. This structure comprises several key elements:
-
-
Service Entry Point (/cmd): Contains the service main program, responsible for service initialization and lifecycle management.
-
-
Business Workflow Layer (/internal/service): Implements the immutable business workflow. This layer defines the business process and specifies where to invoke model or algorithm slots, but it does not contain any concrete model or algorithm implementation.
-
-
Slot Layer (/internal/model, /internal/algorithm): Hosts all pluggable model and algorithm components. Through index files (e.g., *_index.go), this layer provides global registration and discovery capabilities for programs.
-
-
Service Interface Layer (/export): Exposes stable interface definitions to the outside, shielding upstream callers from internal business logic and slot variations, thus ensuring compatibility.
Specifically, the program slot is a pre-defined, standardized integration point. Each slot defines a precise contract for a category of models or algorithms, specifying required input/output parameters, data structures, and the invocation method. Any compliant program can be integrated as a standardized component. A complete pluggable program consists of three elements: (1) Base I/O Structure Definitions, pre-defined by experts and stable long-term; (2) Core Implementation Code, where domain experts implement the specific logic; and (3) Generic Invocation Interface, which adapts actual inputs/outputs to the slot’s standard contract, bridging the core implementation and the standardized slot.
3.1.3. Data Standardized Definition: Unified Data Model Around Task Input, Output, and State
As shown in Figure 2, BOS standardizes all data involved in task execution into three core categories: Input Data, Output Data, and Task State Data. The overall scheme is introduced in Section 3.1.1. This section details the standardization schemes for the power system ontology data (a core part of the input) and the power system business result data (the output).
Power system ontology data is structured as a hierarchical unified model based on ontological principles. As presented in Table 5, this model comprehensively characterizes the spatiotemporal characteristics of power systems through a multi-dimensional classification. The classification is organized first by object level, distinguishing system-level element data, entity-level element data, and their relationships. Second, it considers time-variance, subdividing data at each level into time-varying and non-time-varying attributes. Finally, it is refined by semantic functionality, with data classified according to its precise business meaning.
Power system business result data is standardized into a set of structured descriptive metadata to ensure the results are locatable, interpretable, and traceable. Its key attributes include: (1) Business Type, which identifies the business category of the result; (2) Task Identifier, which provides a precise index to the task that generated this result (detailed in Section 3.2.1); and (3) Result File Storage Address, which points to the physical or logical location of the result data file.
Table 5. Power System Ontology Data Model.
|
Object Level |
Time-Variance |
Data Type |
Data Semantics |
Examples |
|---|---|---|---|---|
|
System-Level Element Data |
Non-Time-Varying |
Basic Parameters ESystem |
The existence of system or regional elements |
System ID, system name, region ID, region name, etc. |
|
Security Constraints and Parameters ESC |
Security requirements imposed on the system, regional, and other elements |
Transmission interface limit, positive/negative reserve capacity, spinning reserves for ramp-up/ramp-down, etc. |
||
|
Wide-Area Security Models and Params EWAS |
Security protection controls based on wide-area control and their setting values |
Models: AGC, AVC, etc. Parameters: target control values, etc. |
||
|
Time-Varying |
System State ESS |
Time-varying indicators at the system level |
System reserve, renewable integration, load shedding, etc. |
|
|
Electricity Market Data EMarket |
Bidding quantity and price data from various market participants |
Bidding data from sellers and buyers, such as quantity and price information |
||
|
Static Verification Models and Parameters ESV |
N-1 contingency analysis, source/load overall adjustment, etc. |
N-1 contingency device sets, regional generation output or load adjustment coefficients, etc. |
||
|
Entity-Level Element Data |
Non-Time-Varying |
Entity Parameters EEntity |
The existence of power system entities |
Entity ID, entity name, etc. |
|
Static Models and Parameters ESM |
Network equations, with their parameters being time-invariant attributes of each device |
Models: π-type transmission lines, T-type transformers, etc. Parameters: rated capacity, impedance, etc. |
||
|
Dynamic Models and Parameters EDM |
DAEs of dynamic devices, with their parameters being the quantities within the equations |
Models: sixth-order synchronous generator equations, etc. Parameters: inertia time constants, transient reactance, etc. |
||
|
Device Security Models and Parameters EDS |
Relay protection, with its parameters being the relevant setting values |
Models: differential protection, etc. Parameters: minimum pickup current, slope settings, etc. |
||
|
Cost Estimation Models and Parameters ECE |
Formulas for calculating the construction and operational costs of stations/devices, with their parameters being the variables in the formulas |
Models: synchronous generator economic dispatch models, etc. Parameters: station/device construction costs, operational cost model coefficients, etc. |
||
|
Time-Varying |
Entity State EES |
Various time-varying parameters at the element level |
Commissioning/decommissioning, maintenance, startup/shutdown, active/reactive power output, synchronous generator control voltage, transformer tap positions, etc. |
|
|
Transient Verification Models and Parameters ETV |
Models primarily include device failure models and transient events, with their parameters being the specific fault information. |
Models: transmission line short circuits, DC blockings, load sudden changes, etc. Parameters: start/end times, occurrence location, event magnitude, etc. |
||
|
Relation-ship |
Non-Time-Varying |
Organizational Relationships |
Representation of the containment relationship among System-Level and Entity-Level elements |
A system contains multiple regions, each region contains multiple stations, and each station contains multiple devices. |
|
Topological Relationships |
Representation of connection relationships among Entity-Level elements |
Stations and devices are interconnected via branch devices such as transmission lines and transformers. |
3.2. Object Indexed Organization
Building upon the standardized definitions, BOS implements a systematic indexed organization for the four core objects. This process forms concrete metadata indexing schemes within the database cluster.
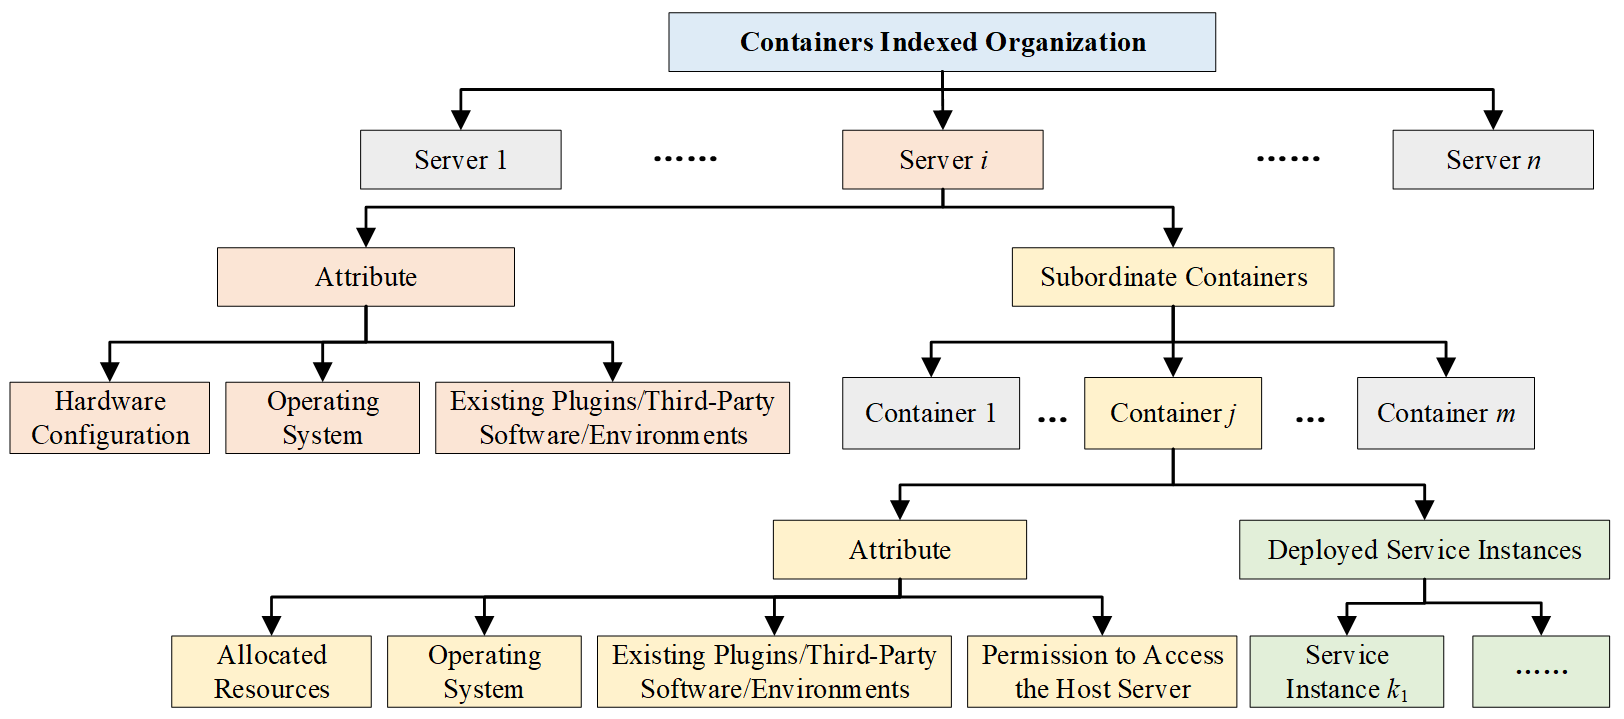
3.2.1. Container Indexed Organization: A Three-Tier Resource Topology
For containers, BOS establishes a three-tier resource relationship index that maps the hierarchy from physical servers to service containers, and finally to the service instances, as shown in Figure 4. This index records the real-time state, resource quotas, and ownership relations of entities at each level, providing a precise topological view for global resource monitoring, scheduling, and fault recovery. The specific indexed organization scheme is as follows:
-
-
Server Tier: Each server record stores its static attributes, including hardware configuration, OS type, and pre-installed software environment.
-
-
Container Tier: Each container record is associated with its host server and stores its runtime environment configuration. Crucially, it also maintains dynamically updated allocated resources (e.g., CPU cores, memory) and permissions for host server access.
-
-
Service Instance Tier: Each service instance record is associated with its host container and the specific business service it provides. This tier represents the ultimate execution endpoints where tasks are scheduled and run.
3.2.2. Task Indexed Organization: Task-Mediated Data Traceability Chain
To ensure full lifecycle observability and traceability, BOS organizes all tasks around a central Task Index Table, constructing a task-mediated data traceability chain. Upon creation, each task is immediately linked to its parent task set based on execution context and simultaneously indexes its designated input data and output results. This design positions the task as the definitive reference points that anchor and link all associated data throughout the computational workflow, with the detailed relationships illustrated in Figure 5.
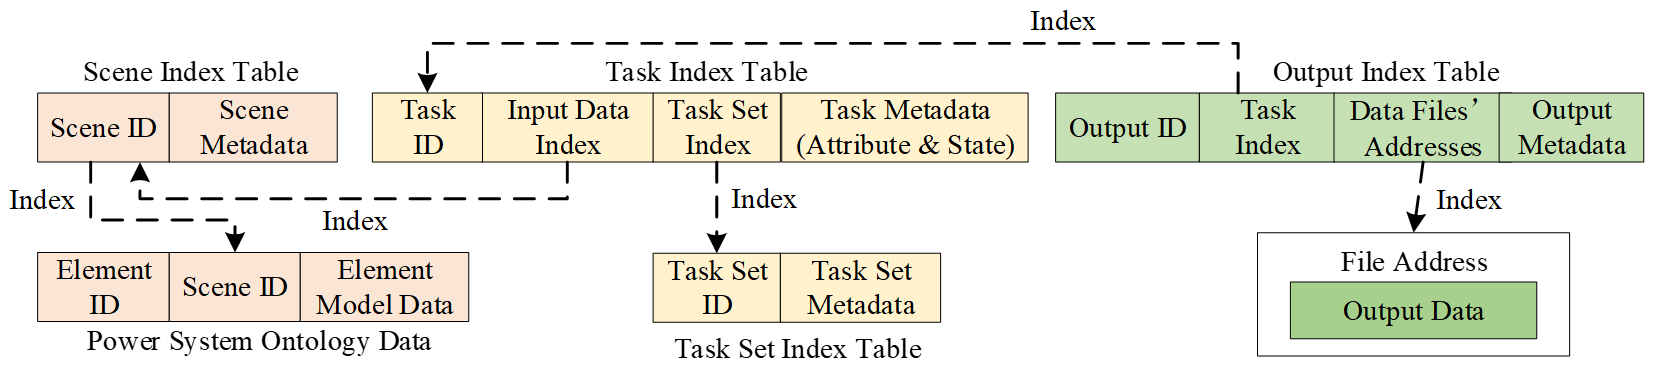
The traceability chain in Figure 5 is an organic whole formed through indexed relationships between six core elements:
-
-
Task Index Table: Serves as the record center for the traceability chain. It records task metadata (including attributes and state), maintains indexes to its parent task set and input data, and is itself indexed by output data through the Task ID.
-
-
Task Set Index Table: Records task set metadata, primarily the unified context that persists across the entire request chain, as defined in Figure 2.
-
-
Scenario Index Table: Manages versions and configurations of the power system ontology data used as task input.
-
-
Power System Ontology Data: The standardized ontology data (defined in Section 3.1.3) is physically stored using the distributed heterogeneous database cluster scheme detailed in Section 3.2.4. Each data element is associated with a scenario index for version control.
-
-
Output Index Table: Records business result metadata (e.g., business type), contains an index pointer back to the originating Task ID, and stores the addresses to result files.
-
-
Output Data Files: Contain the actual business result data, stored in a file database organized by business category, with the specific storage scheme detailed in Section 3.2.4.
Based on the above indexed organization, BOS can achieve three key data traceability capabilities.
First, it enables automated aggregation of task results for a task set. To obtain a consolidated outcome of a macro business request, BOS first queries the Task Set Index Table to retrieve all associated Task IDs. It then checks the task state recorded in each corresponding Task Index Table. For successful tasks, the system follows its output data index to locate and aggregate the complete set of result files. For tasks in other states, their state and relevant logs are also automatically aggregated into the summary report. This process provides a comprehensive execution summary for the entire business request.
Second, it supports lightweight visualization of any task result. When a user needs to view a specific business result, BOS first locates the corresponding output data file in the Output Index Table using the provided Task ID. Simultaneously, it uses the same Task ID to query the Task Index Table, retrieving the scenario index that points to the exact version of power system ontology data used as the task’s input. This indexed retrieval ensures that every result can be visualized with its precise ontology data, while eliminating the need to redundantly store ontology data within the result files themselves, achieving both data consistency and storage efficiency.
Third, it facilitates automated backfilling of validated results into the Power System Ontology Databases. When a validated business result needs to be written back to Power System Ontology Databases to enable the next business step, BOS employs an indexing method similar to that in the second capability, using the Task ID to associate the result data with its exact input ontology records. This enables users to efficiently execute a sequence of business steps within the same scenario, where the output of one step becomes the refined input for the next. For instance, in a scenario sequential simulation, after solving the Unit Commitment problem, BOS can help users to automatically backfill the generator on/off schedules into the corresponding entity state records. This updated state is then directly used as input to the subsequent Active Power Dispatch step, which schedules the precise power output for the committed units.
3.2.3. Program Indexed Organization: Services Index and Custom Programs Index
For programs, BOS constructs a tree-structured organizational index for the microservices cluster of the business platform, using metadata to record each service’s level of integration support for custom algorithms and models. Simultaneously, it establishes a custom program index table to ensure global discoverability and manageability of custom programs. The overall program indexed organization scheme and its relationship with other platform components are illustrated in Figure 6.
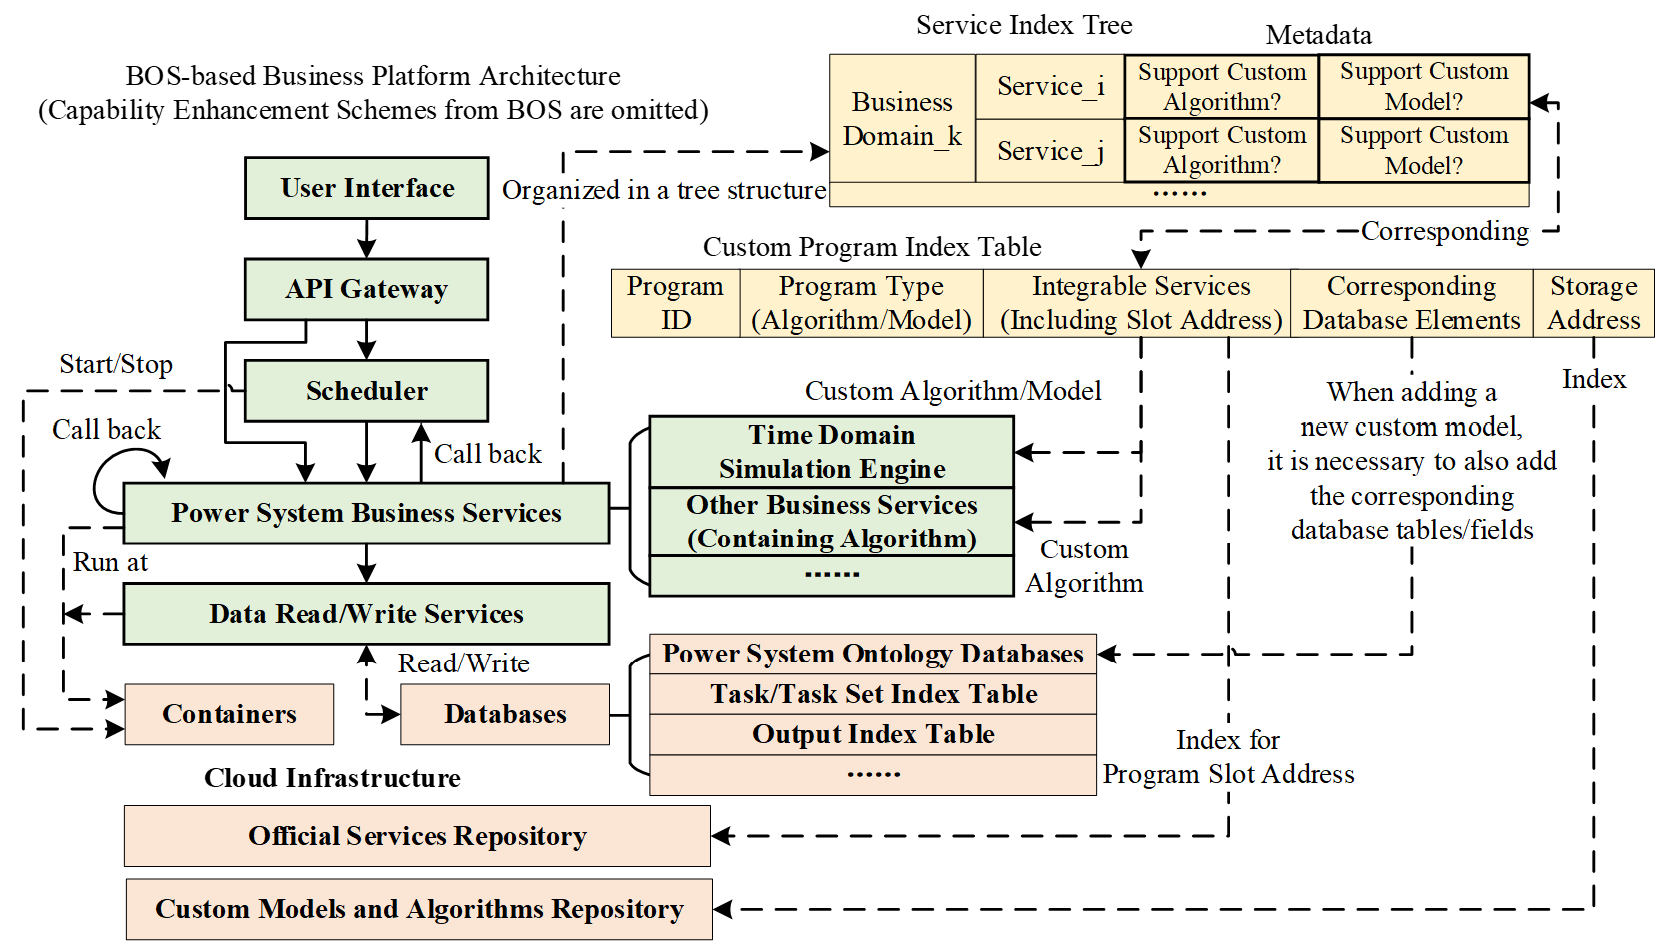
To clarify the service architecture and integration capabilities of the entire platform, BOS maintains a service index tree. This tree hierarchically organizes business domains and their subordinate services, annotating each service with key metadata to explicitly indicate whether it supports the integration of custom algorithms and models via program slots. This metadata provides PLUMP with a whitelist of services capable of integration.
To enable program loading/unloading for PLUMP, BOS builds the Custom Program Index Table. This table records the integration capabilities and core information of each custom program, including:
-
-
Program Type: Classifies the custom program as either a model or an algorithm.
-
-
Integrable Services: Contains a list of service indexes where this program can be plugged in. For example, custom differential equation solver algorithms and dynamic device models may be integrable only with the Time-Domain Simulation Engine service. This field also includes the specific slot address, which points to the exact integration point within the Official Services Repository, thereby providing PLUMP with precise instructions on where to plug in the custom program.
-
-
Corresponding Database Elements: Applicable only to custom models. Unlike algorithms, integrating a custom model requires not only plugging it into the program but also extending the Power System Ontology Databases with corresponding tables or fields to store the model’s parameters during system modeling. To address this requirement, this field records the precise relationship between a custom model and the specific database elements (tables or fields) on which it depends.
-
-
Storage Address: A pointer to the program’s source code or executable files in the Custom Models and Algorithms Repository.
3.2.4. Data Indexed Organization: A Unified Heterogeneous Data Foundation
Based on the standardized data model, BOS constructs a unified data foundation. As illustrated in Figure 7, this foundation encompasses the Platform Databases, the Power System Ontology Databases, the Business Result Databases, the Model/Algorithm Databases, and repositories for programs. Crucially, this foundation is architected with a heterogeneous storage strategy, where each type of data is persisted in the database best suited to its access patterns and structural characteristics, achieving efficient data access. Given that main index relationships have been detailed in Sections 3.2.2 and 3.2.3, this section focuses on the physical storage and its indexed organization schemes for the core business data: the ontology data and the result data.
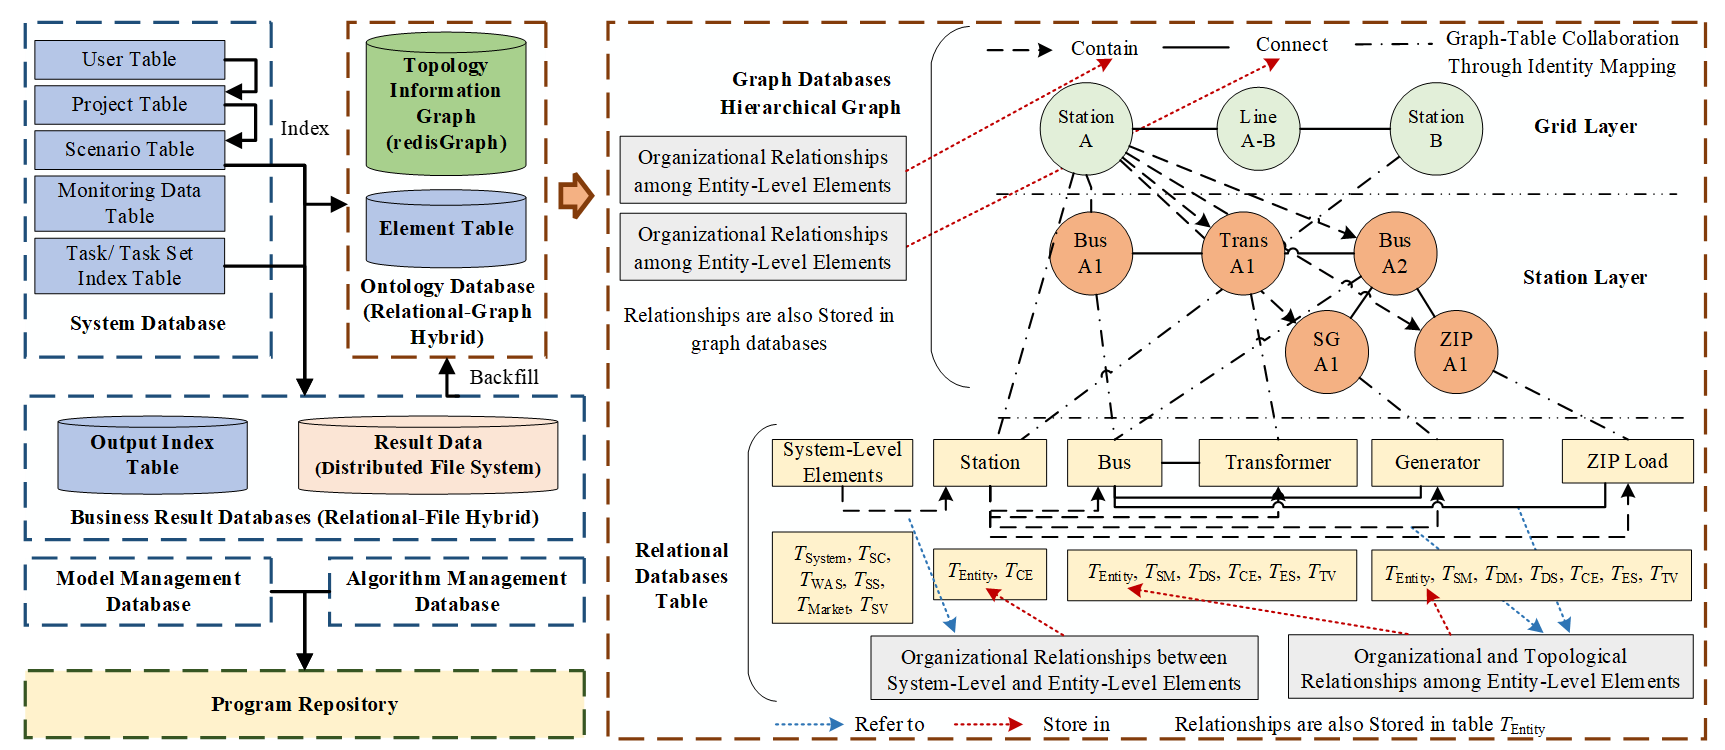
For Power System Ontology Databases, BOS implements a relational-graph hybrid architecture to balance the needs for complex relationship traversal and high-performance multi-attribute queries, as depicted in Figure 7. This hybrid design consists of two complementary components.
First, structured attribute data is stored in relational databases. All categories of system-level and entity-level element data from Table 5 are persistently stored in relational database tables. For example, system data Esystem is stored in table Tsystem. Under this architecture, relational databases excel at multi-attribute, precise queries and efficient retrieval across data relationships with limited hops.
Second, complex relationships are stored in graph databases. The organizational and topological relationships data among entity-level elements from Table 5 are stored in graph databases. As shown in Figure 7, BOS adopts a hierarchical graph model with layers such as Grid and Station to directly represent containment relationships. Within each layer, connectivity between elements is modeled as topological edges. This structure is inherently optimized for relationship-intensive operations that involve multiple hops or recursive traversal, such as topology analysis, connectivity verification, and fault impact analysis. Furthermore, to accelerate specific queries, key descriptive attributes (e.g., name, type) are also stored on the corresponding graph nodes.
Collaboration between the graph and relational databases is achieved through identifier mapping. When handling a complex business request that requires combined relationship and attribute retrievals, BOS executes a two-phase query. It first leverages the graph database for rapid entity positioning and relationship traversal. The resulting set of entities is then used to precisely retrieve their detailed attribute data from the relational database. This collaboration is enabled by a strict one-to-one mapping between entity records in the relational database and corresponding nodes in the graph database, both linked by the same globally unique identifier for each entity.
For the Business Result Databases, BOS adopts a relational-file hybrid architecture to balance management efficiency with read/write performance for typically voluminous and structurally diverse result data. This architecture also involves two coordinated parts.
First, the metadata of business results is managed in a relational database. As shown in the Output Index Table in Figure 5, a relational database table records all business result metadata and uses the file address information to link the physical locations of the corresponding result files.
Second, the actual voluminous result data is stored in a high-performance distributed file system. A flexible file organization strategy is employed to optimize for diverse retrieval needs, which includes partitioning a single logical result into multiple physical files along specific dimensions (e.g., by time step or device type), and generating redundant copies in different formats (e.g., one optimized for time-sequential access, another for querying by device). This strategy ensures efficient retrieval of results tailored to specific business needs.
Collaboration between the relational table and the file system is mediated by the file address. When a business service needs to retrieve a specific result, it first queries the Output Index Table to obtain the available file addresses. Based on the specific retrieval requirement, the service then selects the most appropriate files and uses their addresses to directly access the corresponding files in the distributed file system.
3.3. Task-Container Co-Scheduling
Based on the standardized definitions and indexed organization of both tasks and containers, BOS implements a unified task-container co-scheduling mechanism. Its core function is to dynamically match the execution of tasks with the provisioning of computational resources, closing the loop between workload demand and resource supply. The two interacting components that constitute TCCSP are detailed as follows.
3.3.1. Task Scheduling: Considering Power System Business Characteristics
The primary responsibility of the Task Scheduling Module is to manage the lifecycle of computational tasks, from receiving macro business requests to scheduling the execution of their constituent tasks onto appropriate computational containers, with its technical architecture shown in Figure 8. It operates in coordination with the Container Scheduling Module to form a closed-loop optimization system.
The Task Scheduling Module operates on an event-driven mechanism, cyclically executing the following steps.
Step 1: Event Triggering and Task Registration. When a new task arrives, it is registered in the Task Index Table, its state is initialized to “pending”, and it is placed into the Task Queue. Concurrently, a periodic timer is activated to trigger the scheduling cycle for this queue.
Step 2: Task Scheduling Decision—Container Selection. When triggered by the timer, the Container Selecting submodule initiates a scheduling cycle. Its decision is based on a snapshot of the current container resource state, which is kept consistent during this cycle. The decision process employs three core algorithms: (1) Algorithm A1 (Task Forecast): Predicts a task’s execution duration based on the assigned container’s resources, power system scale, business characteristics and historical performance data; (2) Algorithm A2 (Task Priority Evaluating): Calculates a dynamic priority score for each pending or retrying task, considering its business criticality and urgency; (3) Algorithm A3 (Task Scheduling Optimization Solver): Using the predicted time from A1 and priority weights from A2 as inputs, this algorithm solves the optimization problem for assigning tasks to containers.
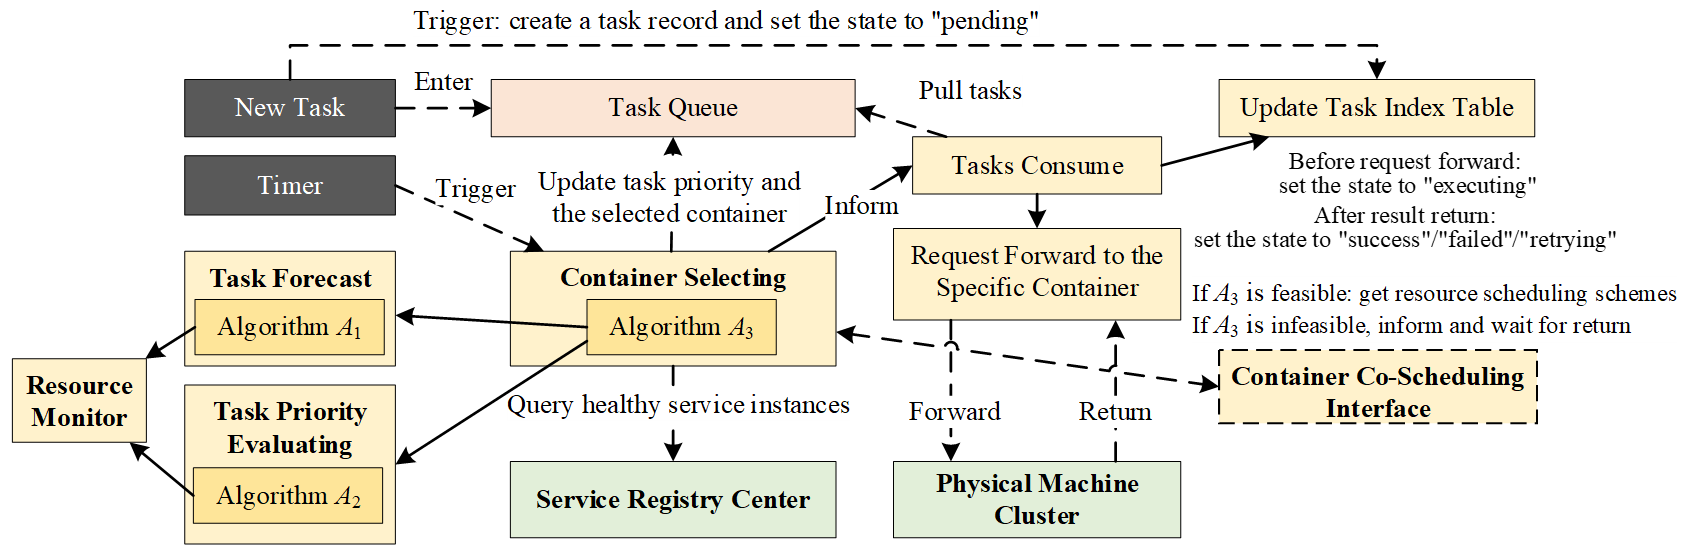
The optimization problem solved by Algorithm A3 is formally defined as: minimizing the global weighted average completion time of tasks under the constraints of task deadlines and available container resources. The decision variable is defined as atp ∈ {0, 1}, indicating whether task t is assigned to service container p. This problem is formulated as:
|
```latex\begin{aligned}&\mathrm{min}&&\frac{1}{\left|\mathbf{T}\right|}\sum_{t\in\mathbf{T}}B\left(t,\boldsymbol{\beta}_{\mathrm{task}}\right)\cdot E_{t}\\&\mathrm{s.t.}&&D\left(\mathbf{a}_{t},\mathbf{u},\mathbf{r}\right)\leq D_{\mathrm{limit},t}\quad\forall t\in\mathbf{T}\\&&&\sum_{t\in\mathbf{T}}a_{tp}\leq1\quad\forall p\in\mathbf{P}\\&&&\sum_{p\in\mathbf{P}}a_{tp}\leq1\quad\forall t\in\mathbf{T}\\ &&& a_{tp} \le {u}_p \quad \forall t \in \boldsymbol{\mathbf{T}}, \forall p \in \boldsymbol{\mathbf{P}}\end{aligned}``` |
(1) |
where:
-
-
T represents the sets of tasks to be scheduled.
-
-
P represents the sets of containers.
-
-
up ∈ {0, 1} indicates whether the container p is in a running state. $${r}_{p}\in {\mathbb{R}}^{+}$$represents the amount of computational resources allocated to container $$p$$. Their values are provided in real time by the Container Scheduling Module via the Container Co-Scheduling Interface.
-
-
The function B(·) is the task priority evaluation function, implemented by Algorithm A2. This function calculates the priority weight for a given task t, where a higher value indicates higher priority. Its parameter set βtask includes parameters considering the business criticality of the task’s originating service and its urgency.
-
-
The function D(·) is the task time prediction function, implemented by Algorithm A1. This function predicts the execution duration of task t. Here, at = (at1, …, at|P|) is the assignment vector for task t, u and r are vectors of all containers’ states (up) and resources (rp). If at is not a zero vector, the function predicts the execution duration on the given containers; otherwise, it means task t is not assigned to any container in the current cycle and the function returns a large penalty value (e.g., the maximum of the prediction execution duration plus a buffer), motivating the optimizer to assign the task in the current or a near-future cycle.
-
-
Dlimit,t is the time limit for the task t.
-
-
Constraint 1 requires that all tasks be completed within their time limits.
-
-
Constraint 2 requires that a container process at most one task at a time. This ensures precise resource control for each task.
-
-
Constraint 3 requires that all tasks be assigned to one of the containers or deferred in the current cycle.
-
-
Constraint 4 requires that all tasks be assigned only to running containers.
If the optimization problem determines that current resources are insufficient to meet task deadlines, it does not output an infeasible assignment. Instead, it immediately sends a resource adjustment request through the Container Co-Scheduling Interface to the Container Scheduling Module. After dynamic resource scaling, the Task Scheduling Module re-runs the optimization in Algorithm A3 with the updated resource state.
Step 3: Task Dispatch and Execution. Once a feasible assignment scheme is determined, the Tasks Consume submodule is notified. It pulls the scheduled tasks from the Task Queue, updates their state in the Task Index Table to “executing”, and forwards the execution requests to the assigned containers.
Step 4: Task State Update Based on Result. Upon receiving the execution result from a container, the Task Scheduling Module updates the task’s final state in the Task Index Table to “success”, “failed”, or “retrying”.
3.3.2. Container Scheduling: Resource Adjustment Collaborating with Task Scheduling
The primary responsibility of the Container Scheduling Module is to dynamically adjust container resources, through actions including startup, shutdown, and resource quota modification. This module operates in two complementary modes: (1) the normal mode, where it optimizes resource allocation to reduce costs based on a feasible task schedule; and (2) the guarantee mode, where it urgently provides additional resources when the Task Scheduling Module cannot find a feasible schedule, ensuring that a solution becomes possible. Its technical architecture is shown in Figure 9.
The Container Scheduling Module also operates on an event-driven mechanism. Its workflow, which differs slightly between the two operating modes, cyclically executes the following steps.
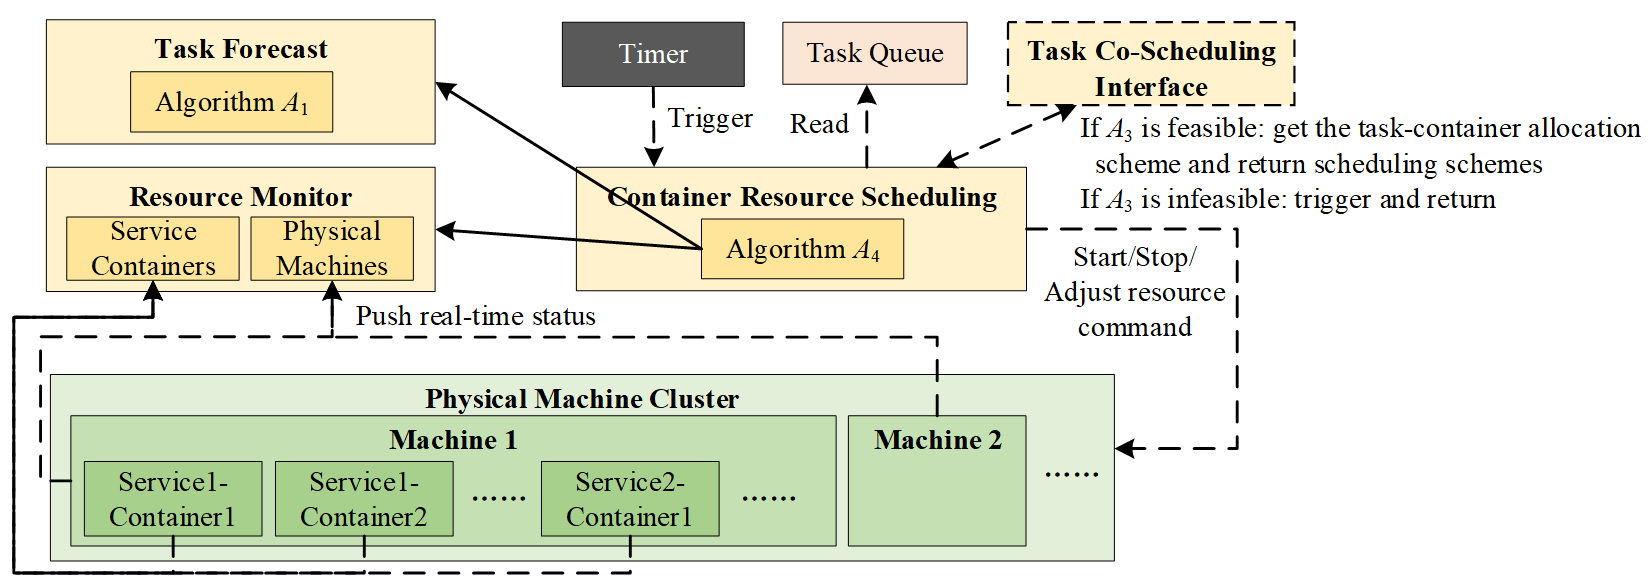
Step 1: Event Triggering and Input Preparation. A new resource scheduling cycle is initiated by one of two events: (1) In normal mode, the cycle is triggered by a periodic timer signal. The input is a feasible task-container assignment scheme obtained from the Task Queue. (2) In guarantee mode, the cycle is triggered by a resource adjustment request from the Task Scheduling Module. Since no feasible assignment scheme exists, the Container Scheduling Module prepares a relaxed virtual assignment scheme by associating each pending or retrying task with multiple candidate containers randomly, thereby formulating a resolvable optimization problem.
Step 2: Resource Scheduling Decision. When triggered, the Container Resource Scheduling submodule initiates a decision cycle. Based on the prepared input, it formulates and solves a resource optimization problem. The decision variables are the state variable up and resource allocation variable rp for each container p, consistent with their definitions in Formula (1). If multiple types of resources are considered, the scalar rp can be generalized to a vector rp = (rp1, rp2, …). This problem is mathematically formulated as:
|
```latex\begin{aligned}&\mathrm{min}&&\sum_{p\in\mathbf{P}}C_{\mathrm{cal}}\left(p,r_{p}\right)\cdot u_{p}\\&\mathrm{s.t.}&&D\left(\mathbf{a}_t,\mathbf{u},\mathbf{r}\right)\leq D_{\mathrm{limit},t}\quad\forall t\in\mathbf{T}\\&&&\sum_{p\in\mathbf{P}}\left(r_p\cdot u_p\right)\leq R_{\mathrm{limit}}\\&&&r_{p,\mathrm{min}}\cdot u_{p}\leq r_{p}\leq r_{p,\mathrm{max}}\cdot u_{p}\quad\forall p\in\mathbf{P}\end{aligned}``` |
(2) |
where:
-
-
The function Ccal(·) is the container cost evaluation function.
-
-
Rlimit is the upper limit of the total allocatable computational resources, determined by the physical capacity of the server cluster.
-
-
rp,min and rp,max are the minimum and maximum resource requirements for the business services hosted by container p. These bounds are derived from the service’s performance characteristics.
-
-
Constraint 2 requires that all containers can only use computational resources with a fixed upper limit.
-
-
Constraint 3 indicates the computational resource requirements for containers.
Step 3: Instruction Execution. The Container Resource Scheduling submodule translates optimization results into commands such as starting up, shutting down, or adjusting the resource quota of specific containers. These commands are dispatched to the Cloud-Native OS for reliable execution.
Step 4: Iteration and Convergence Towards Global Co-Scheduling Optimum. After command execution, the Resource Monitor captures the updated global resource state. This new state closes the control loop through two concurrent feedback mechanisms. First, it updates the local state, which becomes the initial condition for the Container Scheduling Module’s next decision cycle. Second, it provides real-time feedback to the Task Scheduling Module by sending the updated container parameters (up, rp) through the Task Co-Scheduling Interface. This updated resource snapshot directly enables the next round of Container Selecting decisions.
Through this iterative feedback, the two modules co-evolve: the Task Scheduling Module makes its assignment decisions using the up-to-date container resource parameters (up, rp) fed back from container scheduling, while the Container Scheduling Module adjusts resources based on the demand from task scheduling. This closed-loop interaction allows TCCSP to progressively converge towards a globally efficient state that jointly optimizes task completion timeliness and resource utilization.
3.4. Program Loading and Unloading Management
Based on the standardized definition and indexed organization of programs, BOS constructs the PLUMP for the lifecycle automatization of domain-specific model and algorithm programs, decoupling their integration from the traditional software development and deployment pipeline. Its technical architecture is illustrated in Figure 10, and its core functionalities are realized through three interconnected workflows.
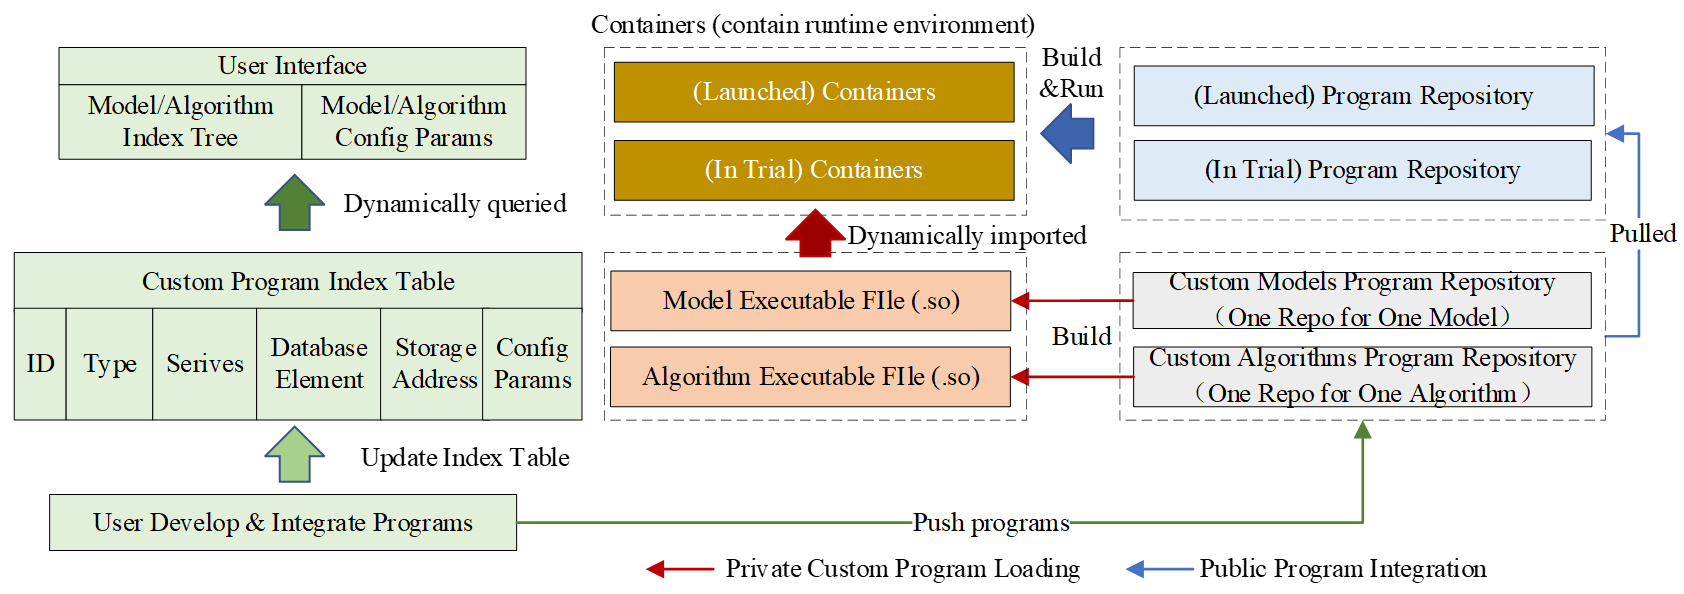
The first workflow automates program integration from development to the user interface. This process ensures that a submitted program becomes immediately available for use. Specifically, after a user submits custom programs, PLUMP pushes them to the Custom Programs Repository and compiles it into an OS-specific dynamic link library (e.g., a .so file). It then parses the program’s interface, validates its compliance with the target slot’s standardized contract, and records its metadata in the Custom Program Index Table. Consequently, the user interface dynamically fetches the updated list of all available models/algorithms and their configuration parameters from this index table, rendering corresponding selectors and form elements without manual intervention. This end-to-end automation allows domain experts to integrate new capabilities independently and see them reflected in the application immediately.
The second workflow enables the dynamic plug-and-play integration of private programs with safe isolation. Designed for agile testing and evaluation, this workflow adheres to a security-first principle to isolate unvetted code from the stable production environment. It implements two coordinated mechanisms. First, when a business service needs to invoke a private program, PLUMP locates the program’s storage address through the Custom Program Index Table. The service can then load the corresponding precompiled library files into the target program slot within a running service container, enabling immediate execution without restart. Second, a safety isolation mechanism is enforced in coordination with TCCSP. Requests for private programs are routed exclusively to service containers running in trial mode, which run with reduced system privileges to mitigate risks.
Third, Public Program Integration: Two-Stage Release. This workflow governs the secure promotion of a validated custom program to an official platform component. First, the program undergoes a formal review to grant its public state. Upon approval, PLUMP merges it into the Official Program Repository and triggers an automated pipeline to rebuild and redeploy the affected service containers in the trial mode. After confirming correctness and stability during this trial phase, the service containers are switched to the launched mode, completing the two-stage integration process.
3.5. Data Read/Write Strategy Optimization
Based on the standardized definition and indexed organization of data, DRWOP determines how to plan the most efficient access path for specific data read/write operations. Specifically, DRWOP abstracts the entire data space as a data relationship network and models the read/write execution process as an optimal path search problem.
First, DRWOP models all data and their read/write dependencies as a directed graph network G = (V, E), where the vertex set V represents all data, and the edge set E represents read/write operation paths. The edges are divided into two categories: (1) Read Edges Eread: A directed edge (u, v) ∈ Eread indicates that data v can be retrieved starting from data u. These edges are annotated with attributes that define the retrieval path (e.g., via relational or graph databases) and any required additional conditions. (2) Write Edges Ewrite: A directed edge (u, v) ∈ Ewrite indicates that data u must be written before data v, representing transactional dependencies in data writing. These edges are similarly annotated with attributes characterizing the retrieval path.
Based on the above abstraction, the search for an optimal execution path for a given read/write request can be defined as a mixed-integer programming problem. For a read request querying target data T under given data condition S, the optimization problem can be formally defined as minimizing the time consumption of the data read request, subject to the constraints that both the start and end vertices are reachable, and the path is continuous. The decision variables are defined as binary variables yuv ∈ {0, 1}, indicating whether the edge (u, v) is selected as the execution path for data reading. This problem is formulated as:
|
```latex\begin{aligned}&\mathrm{min}&&\sum_{\begin{pmatrix}u,v\end{pmatrix}\in\mathbf{E}_{\mathrm{read}}}T_{\mathrm{read}}\begin{pmatrix}u,v\end{pmatrix}\cdot y_{uv}\\&\mathrm{s.t.}&&\sum_{v:\left(s,v\right)\in\mathbf{E}_{\mathrm{read}}}y_{sv}\geq1\quad\forall s\in\mathbf{S}\\&&&\sum_{u:\left(u,t\right)\in\mathbf{E}_{\mathrm{read}}}y_{ut}\geq1\quad\forall t\in\mathbf{T}\\&&&\sum_{v:(u,v)\in\mathbf{E}_{\mathrm{read}}} y_{uv}=\sum_{v:(v,u)\in\mathbf{E}_{\mathrm{read}}}y_{vu}\quad\forall u\in\mathbf{V}\setminus\begin{Bmatrix}s,t\end{Bmatrix}\end{aligned}``` |
(3) |
For a write request targeting data T, the optimization problem can be formally defined as: minimizing the time consumption of the data write request under the constraints that the endpoint is reachable and transactional dependencies of data writing are satisfied. The decision variables are defined as binary variables zuv ∈ {0, 1}, indicating whether the edge (u, v) is selected as the execution path for data writing. This problem is formulated as:
|
```latex\begin{aligned}&\min\quad \sum_{(u,\nu)\in\mathbf{E}_{\mathrm{write}}} T_{\mathrm{write}}(u,\nu)\cdot z_{u\nu} \\&\text{s.t.}\quad \sum_{u:(u,t)\in\mathbf{E}_{\mathrm{write}}} z_{ut} \geq 1 \quad \forall t\in\mathbf{T} \\&\quad\quad\ \sum_{\nu:(u,\nu)\in\mathbf{E}_{\mathrm{write}}} z_{u\nu} \geq z_{\nu w} \quad \forall (u,\nu),(\nu,w)\in\mathbf{E}_{\mathrm{write}}\end{aligned}``` |
(4) |
where:
-
-
Tread(·) and Twrite(·) are the time consumption evaluation functions for the read/write operations corresponding to edge (u, v), with their values determined by the storage forms specified in Section 3.2.4.
-
-
Constraint 1 in Formula (3) requires that all start vertices in set S be reachable.
-
-
Constraint 2 in Formula (3) and Constraint 1 in Formula (4) require that all end vertices in set T be reachable.
-
-
Constraint 3 in Formula (3) and Constraint 2 in Formula (4) enforce path continuity in the selected route.
By solving the above model, DRWOP is able to plan an access path with the shortest time consumption for each read/write request. This path clarifies the sequence and method of data retrieval or the transaction execution sequence for data writing, thereby further optimizing runtime access efficiency on the basis of the existing data foundation.
4. Case Studies
To validate the practical efficacy of BOS, several applications have been developed around power system planning and operation business based on BOS, forming the BOS-based Power System Business Platform. The following case studies, conducted on a real-world regional power grid in China, demonstrate how this platform systematically resolves the three core challenges of traditional architectures:
-
-
Data Connectivity: Can the business chain achieve seamless data flow throughout?
-
-
Computational Efficiency: Can massive computational tasks be scheduled and executed efficiently?
-
-
Program Integration: Can domain-specific models and algorithms be integrated in an agile manner?
4.1. Demonstration of Data Connectivity in a Steady-State Planning Business Chain
Based on the unified data foundation constructed with BOS, this case study demonstrates seamless data flow by executing a complete steady-state planning and security validation workflow. The steps are as follows.
Step 1: System Modeling. Prepare the Non-Time-Varying Element data categories from Table 5, including ESystem, ESC, EEntity, ESM, EDM, ECE, and Relationship, to construct a basic system model without state data.
Step 2: Initial Scenario Snapshot Establishment and Validation. Configure the Entity State data EES to form an initial scenario snapshot. Perform power flow calculation and steady-state security assessment for this snapshot, iteratively adjusting EES until all criteria are met, thereby establishing a valid and stable initial scenario snapshot.
Step 3: System Model Equivalence. To manage the computational complexity for the subsequent annual simulation, a static network equivalence is performed on the validated snapshot from Step 2. The equivalence criterion retains only elements at 500 kV and above. This reduces the full system model with over 16,000 buses to a computationally tractable equivalent model comprising 619 buses, 7 UHVDC lines, 74 synchronous generators, and 2 photovoltaic units.
Step 4: Annual Scenario-Sequential Data Generation. Based on historical or typical data, generate scenario-sequential data for renewable sources and load for a full year. Update the data EES and form a sequence of 8760 (365 days × 24 h) hourly snapshots.
Step 5: Annual Scenario-Sequential Simulation. This step involves solving a three-level sequential optimization problem for each of the 8760 hourly snapshots: first Unit Commitment (UC), then Active Power Dispatch (APD) based on UC results, and finally Reactive Power Dispatch (RPD) based on APD results. The process generates an economically optimal annual schedule that satisfies basic operational constraints, and the resulting schedules are written back to update the data EES.
Step 6: Annual Static N-1 Security Verification. Perform a steady-state N-1 security assessment on all 8760 snapshots using the updated data EES. This verifies the system’s stability against the contingency of any single branch outage.
Step 7: Scenarios State Adjustment under N-1 Constraints. For any hourly snapshots that fail the N-1 security verification, an automated state adjustment is triggered. This process constructs and solves an optimization problem that incorporates the N-1 security constraints, using the existing RPD results as an initial point. The resulting adjusted schedules are then written back to update the corresponding data in EES. Finally, the adjusted snapshots undergo a renewed N-1 security verification to ensure compliance, completing the corrective loop.
Figure 11 visualizes the final annual schedule, the output of the Scenario-Sequential Simulation and Scenarios State Adjustment, showing the 8760 sequential device states (e.g., active power and voltage setpoints for generators, reactive power from SVG devices, and bus voltages) that satisfy security constraints.
Figure 12 presents a specific N-1 contingency analysis case from the final N-1 security verification step. It demonstrates that for this contingency, all corresponding power flow solutions across the 8760 snapshots remain stable, with voltages within 0.9–1.1 p.u. and line loading rates within acceptable limits, thereby validating the static security of the final plan.
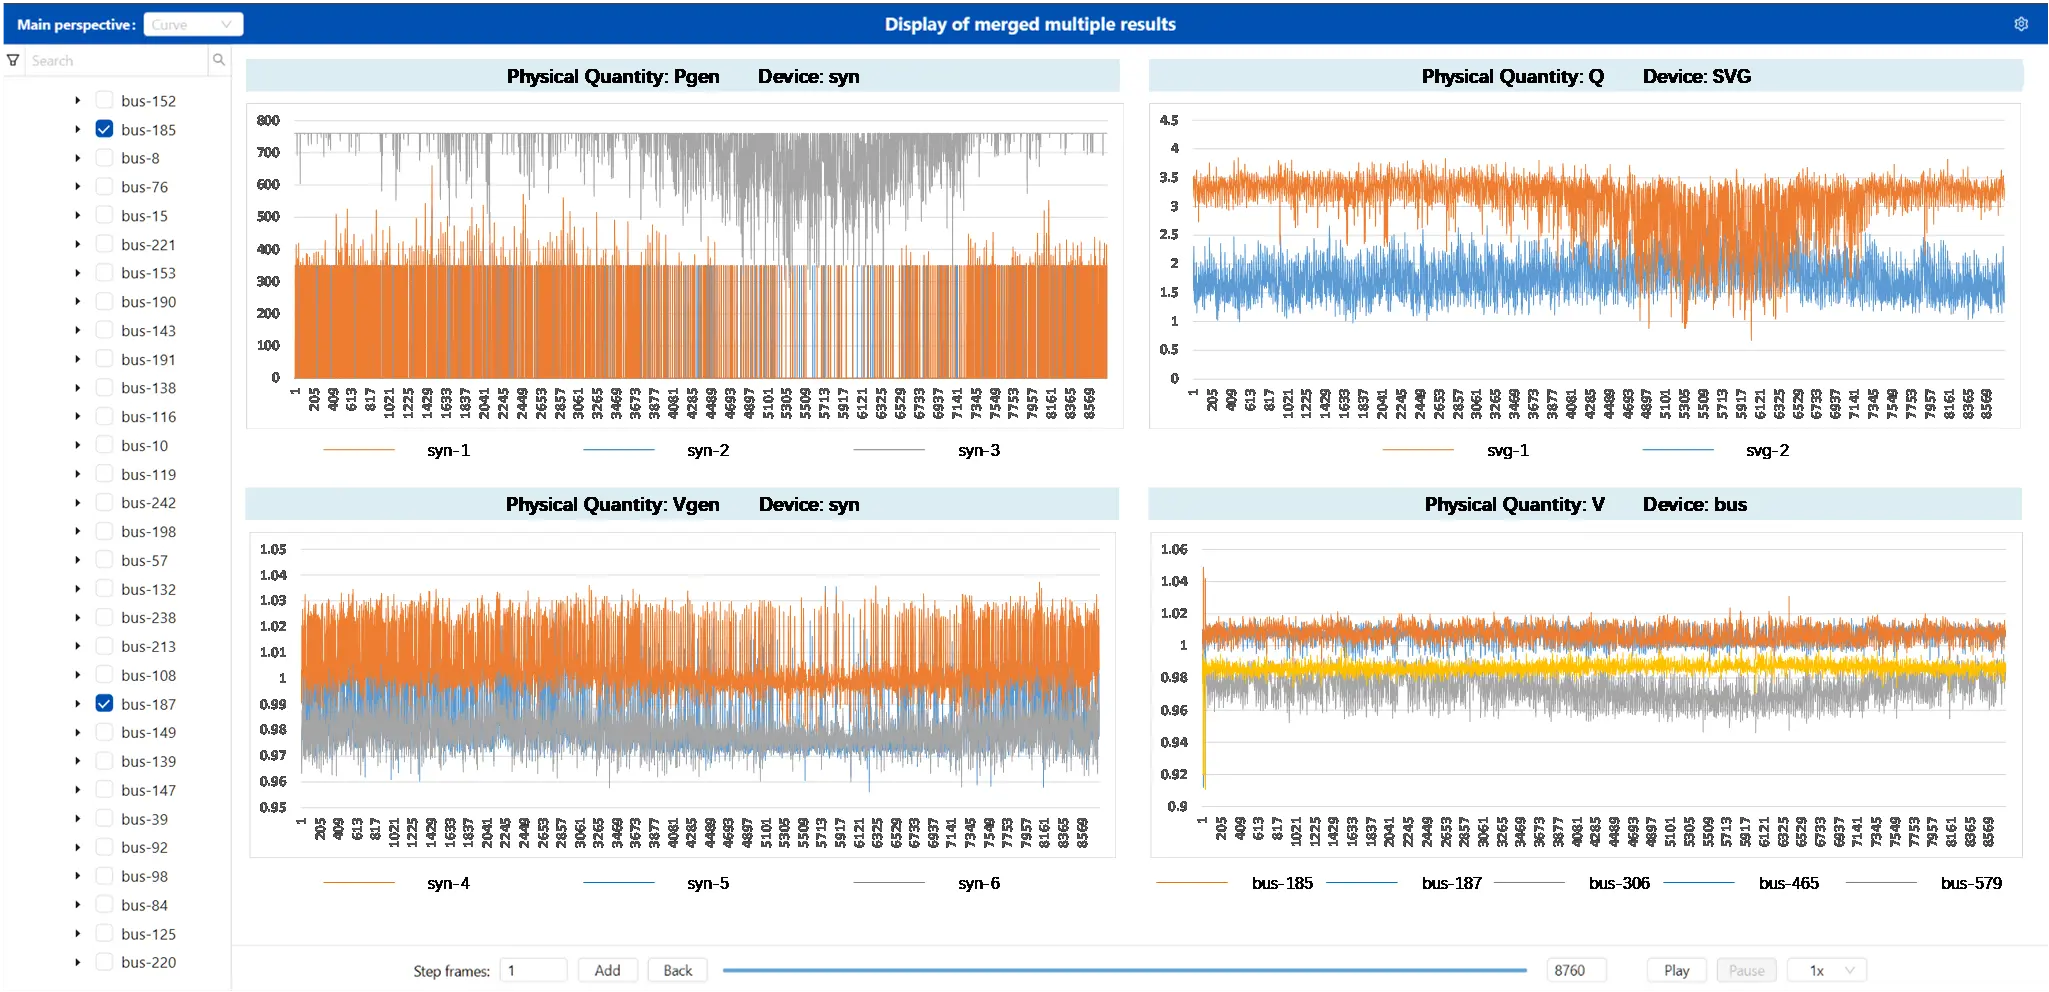
Figure 12. Annual Scenario-Sequential Power Flow Results under a Specific N-1 Contingency Analysis Case.
4.2. Efficiency of Task-Container Co-Scheduling
To evaluate the computational efficiency of BOS, we executed the steady-state planning and security validation workflow from Section 4.1 on a server cluster and recorded its time consumption. The cluster consists of two physical servers: (1) Server 1: CentOS 7, featuring two AMD EPYC 7763 CPUs (256 logical cores), 756 GB of DDR4 memory; (2) Server 2: CentOS 7, featuring two Intel Xeon Gold 5118 CPUs (24 logical cores), 256 GB of DDR4 memory.
The workflow’s primary computational load comes from the scenario-sequential simulation, the static N-1 security verification, and scenario state adjustment. The corresponding services decompose these requests into multiple tasks as follows:
-
-
Unit Commitment: This service employs a two-level decomposition strategy. First, the annual request is divided into 12 monthly optimization tasks. Each monthly task is further decomposed into a set of daily optimization tasks, yielding a total of 365. Consequently, the UC stage generates 377 tasks in total.
-
-
Active Power Dispatch: This service also follows a two-level decomposition. First, it decomposes the annual request into 365 daily optimization tasks. Subsequently, to ensure the satisfaction of inter-day constraints, an additional boundary verification task is created to coordinate across all daily solutions. Consequently, the APD stage generates a total of 366 tasks.
-
-
Reactive Power Dispatch: Given that the active power schedule is already determined, the power system is less prone to violating inter-temporal constraints. This allows the reactive power dispatch problem to be decomposed into 8760 hourly optimization tasks and one additional task for boundary condition verification.
-
-
Static N-1 Security Verification: This service generates a task for every conceivable contingency-scenario pair. This results in a total of 6,175,800 subtasks, calculated by analyzing 705 distinct transmission-line N-1 contingencies across the 8760 scenarios.
-
-
Scenarios State Adjustment under N-1 Constraints: This service treats each required hourly state adjustment as an independent task, generating 8760 tasks. For a scenario that fails N-1 verification, the corresponding task first identifies the violated constraints, incorporates them into the optimization model as additional constraints, and solves the model to produce an adjusted system state. An additional boundary verification task is also generated to ensure global consistency after all adjustments.
The performance results are summarized in Table 6. These data represent the average of ten independent runs, with the total execution time varying within a ±5% margin. The Mean Measured Task Time is the average execution time recorded for each task.
To substantiate the utility of TCCSP, two critical comparisons are made. First, as a baseline comparison, a conventional implementation without TCCSP was attempted. This implementation failed to complete the workflow, as the system ran out of memory shortly after entering the stage of Scenarios State Adjustment under N-1 Constraints. Second, to quantify the efficiency gain of parallel scheduling, we estimate the serial execution time by multiplying the Mean Measured Task Time by the Number of Tasks for each stage. Compared to this estimated serial execution time, the TCCSP-managed workflow achieves an overall speedup ratio of nearly 100, completing the entire complex workflow in approximately 15.2 h. A detailed breakdown shows that the cumulative time spent on data read/write operations throughout the workflow was only about 1 h, accounting for less than 10% of the total runtime. This low overhead directly validates the efficacy of DRWOP in minimizing data access latency.
Table 6. Large-scale Computational Task Time Consumption Statistics.
|
Task |
Number of Tasks |
Mean Measured Task Time (s) |
Estimated Serial Time (s) |
Actual Total Time (s) |
Speedup Ratio |
|---|---|---|---|---|---|
|
Unit Commitment |
377 |
10.56 |
3981.12 |
206 |
19.33 |
|
Active Power Dispatch |
366 |
6.12 |
2239.92 |
130 |
17.23 |
|
Reactive Power Dispatch |
8761 |
1.35 |
11,827.35 |
126 |
93.87 |
|
Static N-1 Security Verification |
6,175,800 |
0.85 |
5,249,430 |
52,548 |
99.90 |
|
Scenarios State Adjustment under N-1 Constraints |
8761 |
18.47 |
161,815.67 |
1785 |
90.65 |
|
Total |
/ |
/ |
5,429,294.06 |
54,795 |
99.08 |
Furthermore, the high resource utilization during execution provides direct evidence of scheduling efficiency. As shown in Figure 13, CPU and memory utilization on both servers were sustained above 90% throughout the execution, demonstrating effective resource exploitation. Collectively, these results prove that BOS’s unified scheduling mechanism can efficiently manage and execute large-scale power system analysis, even when faced with millions of tasks, thereby meeting the demanding computational timeliness requirements of production practice.
4.3. Implementation of Program Integration
The PLUMP provides the business platform with robust capabilities for integrating custom programs. This section mainly illustrates the process, via the user interface, through which users define and integrate custom models and algorithms.
Figure 14 shows the dynamic model design interface. This interface provides a LaTeX-based equation editor, allowing users to define dynamic mathematical models for devices. Then, the platform automatically parses all variables from the equations. Users can further specify the type of each variable (parameter, input, output, or internal) and generate standardized programs for a specific time-domain simulation engine (e.g., a self-developed engine such as PSAGo (short for Power System Analysis in Golang) or commercial tools like DSP [26] or PSCAD). For integration with the self-developed engine, each model programs must provide functions that support the iterative solution of its Differential-Algebraic Equations (DAEs). Taking the implicit trapezoidal integration rule coupled with the Newton-Raphson method as a concrete example, a compliant model is required to implement the following four standardized function interfaces:
-
-
Model Initialization Function: Initializes the model’s internal and output variables based on the steady-state grid operational condition and other relevant information, such as control reference setpoints.
-
-
Residual Calculation Function: Computes the residual vector of the model’s DAEs discretized through the implicit trapezoidal rule, for given trial values of the state variables.
-
-
Jacobian Matrix Element Calculation Function: Provides the partial derivatives of the residual function with respect to the state variables.
-
-
Current Injection Calculation Function: Computes the current injection from the device into the grid using the solved variables.
For third-party engines that support user-defined models, the platform automatically converts the standardized model into code compliant with the target engine’s proprietary syntax. For engines lacking native user-defined model functionality, BOS generates a specific data adapter that maps the custom model and its parameters to the engine’s closest built-in model based on user-configured mapping rules. After code generation, users can directly navigate to an online testing environment to validate the correctness of the model’s dynamic characteristics within relevant projects and scenarios, forming a closed loop from design to verification.
Figure 15 shows the model’s overview interface. This interface visually displays all models managed by BOS through program indexed organization, including both official and custom models. As of the case study implementation, the platform has successfully integrated 64 custom models through this approach, covering synchronous generator sets (including the generator, excitation system, and automatic voltage regulator (AVR), prime mover and governor, power system stabilizer (PSS)), photovoltaic systems, wind power systems, battery storage systems, static var generators (SVG), and other types of devices. This fully demonstrates the effectiveness and universality of BOS in supporting agile model expansion.
Figure 16 shows the interface for algorithm development. Similar to model design, users can customize algorithm programs for business service slots and configure their parameter definitions through this interface. BOS automatically encapsulates them into callable components compliant with standardized program definitions and integrates them into the custom program repository.
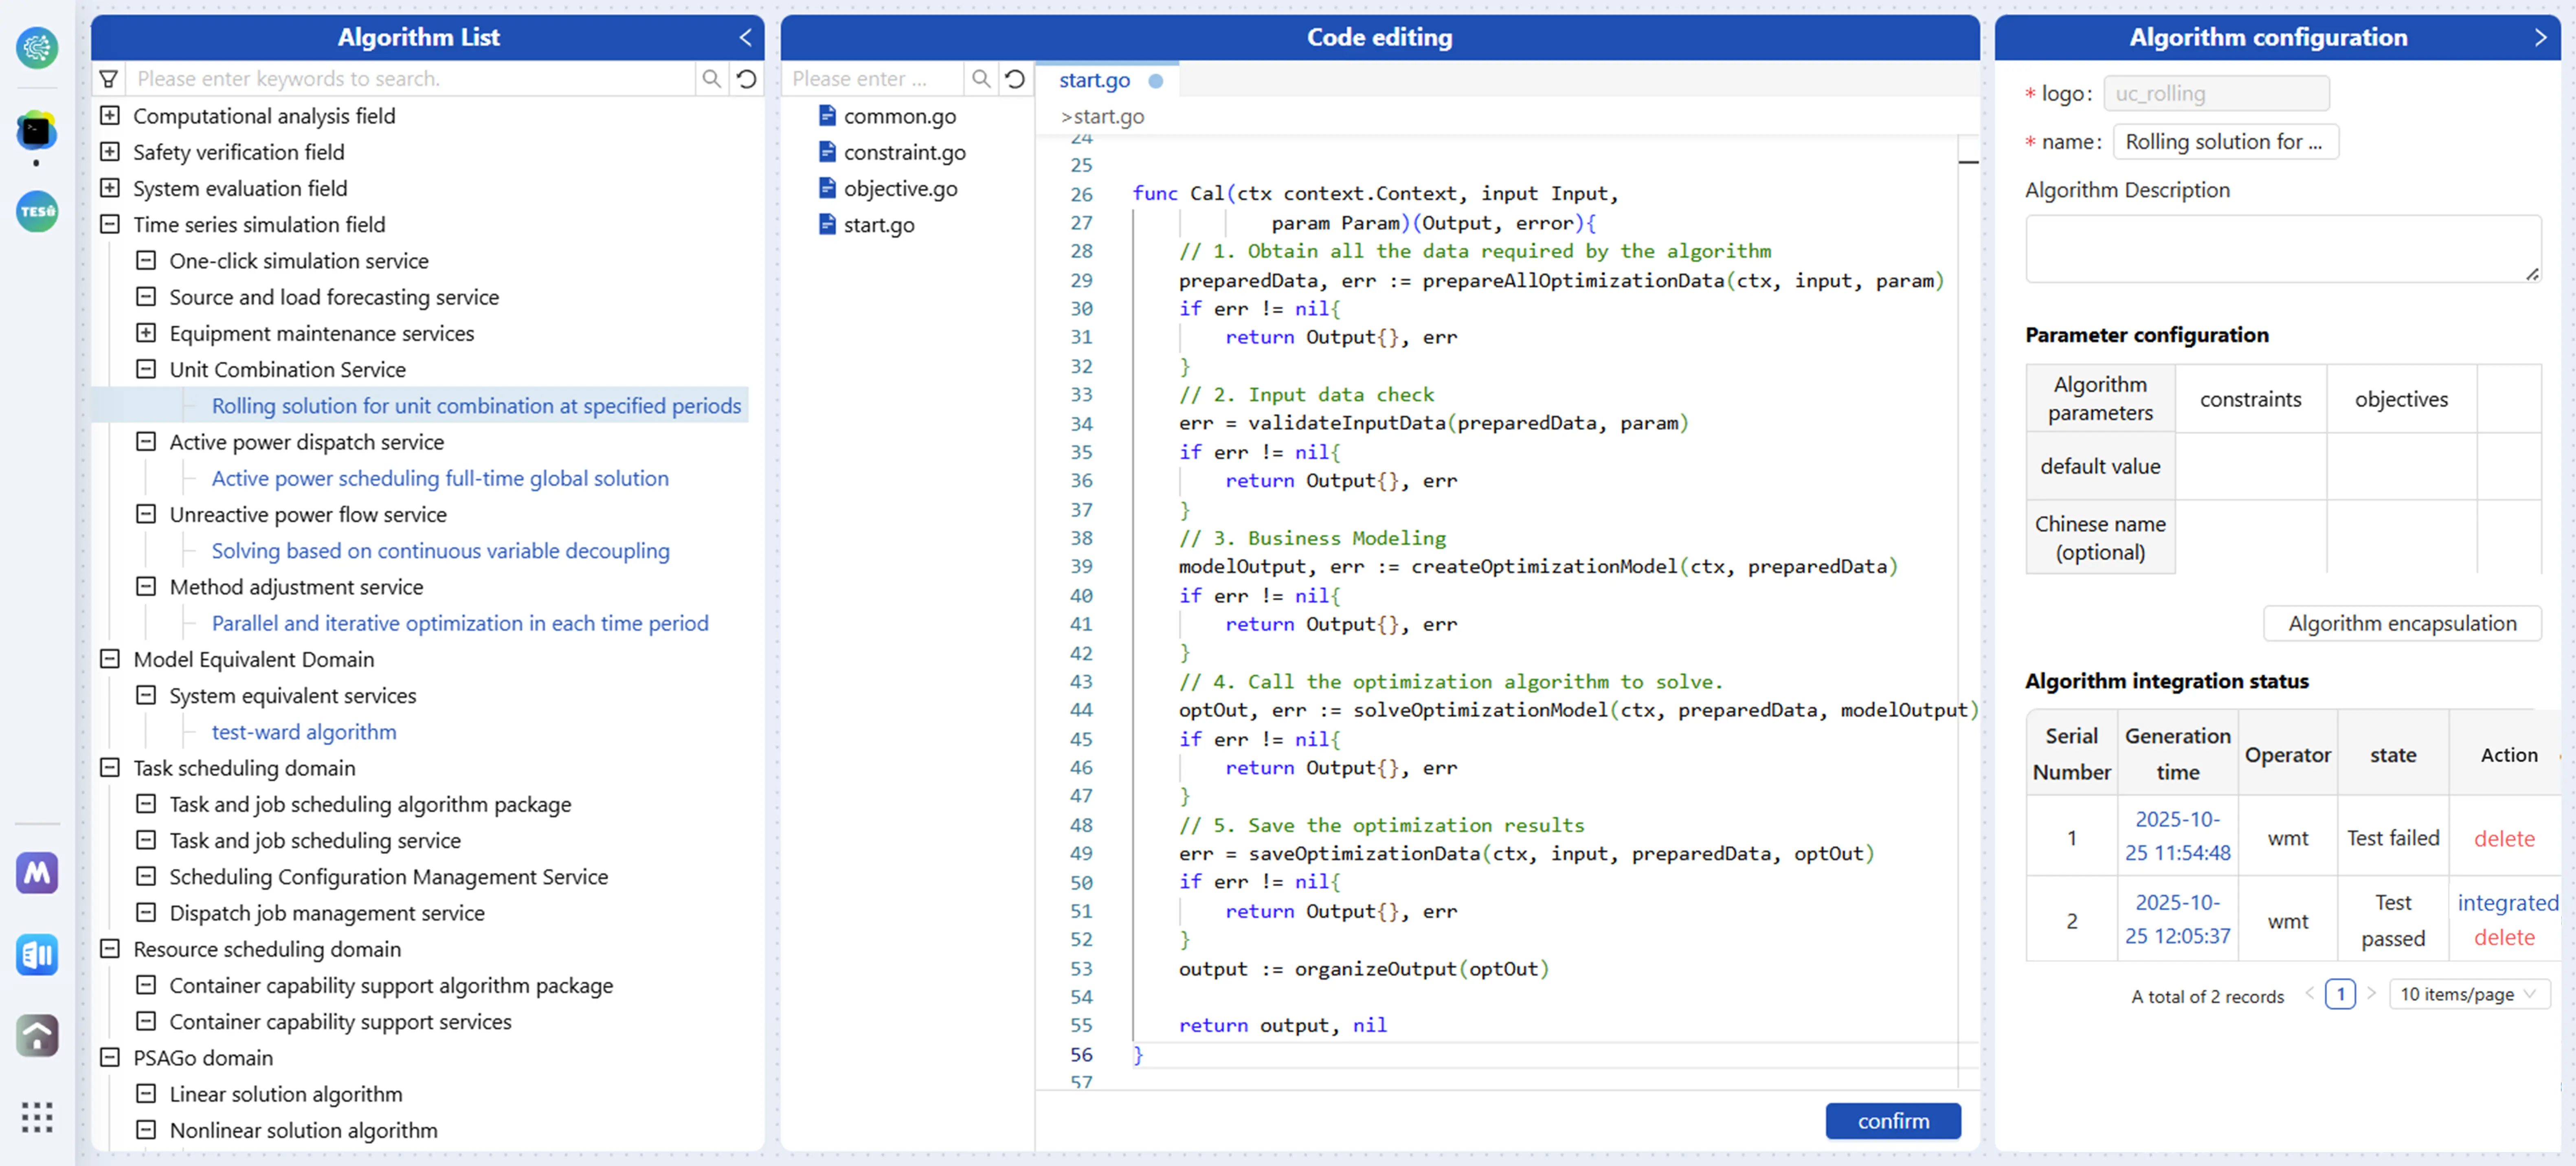
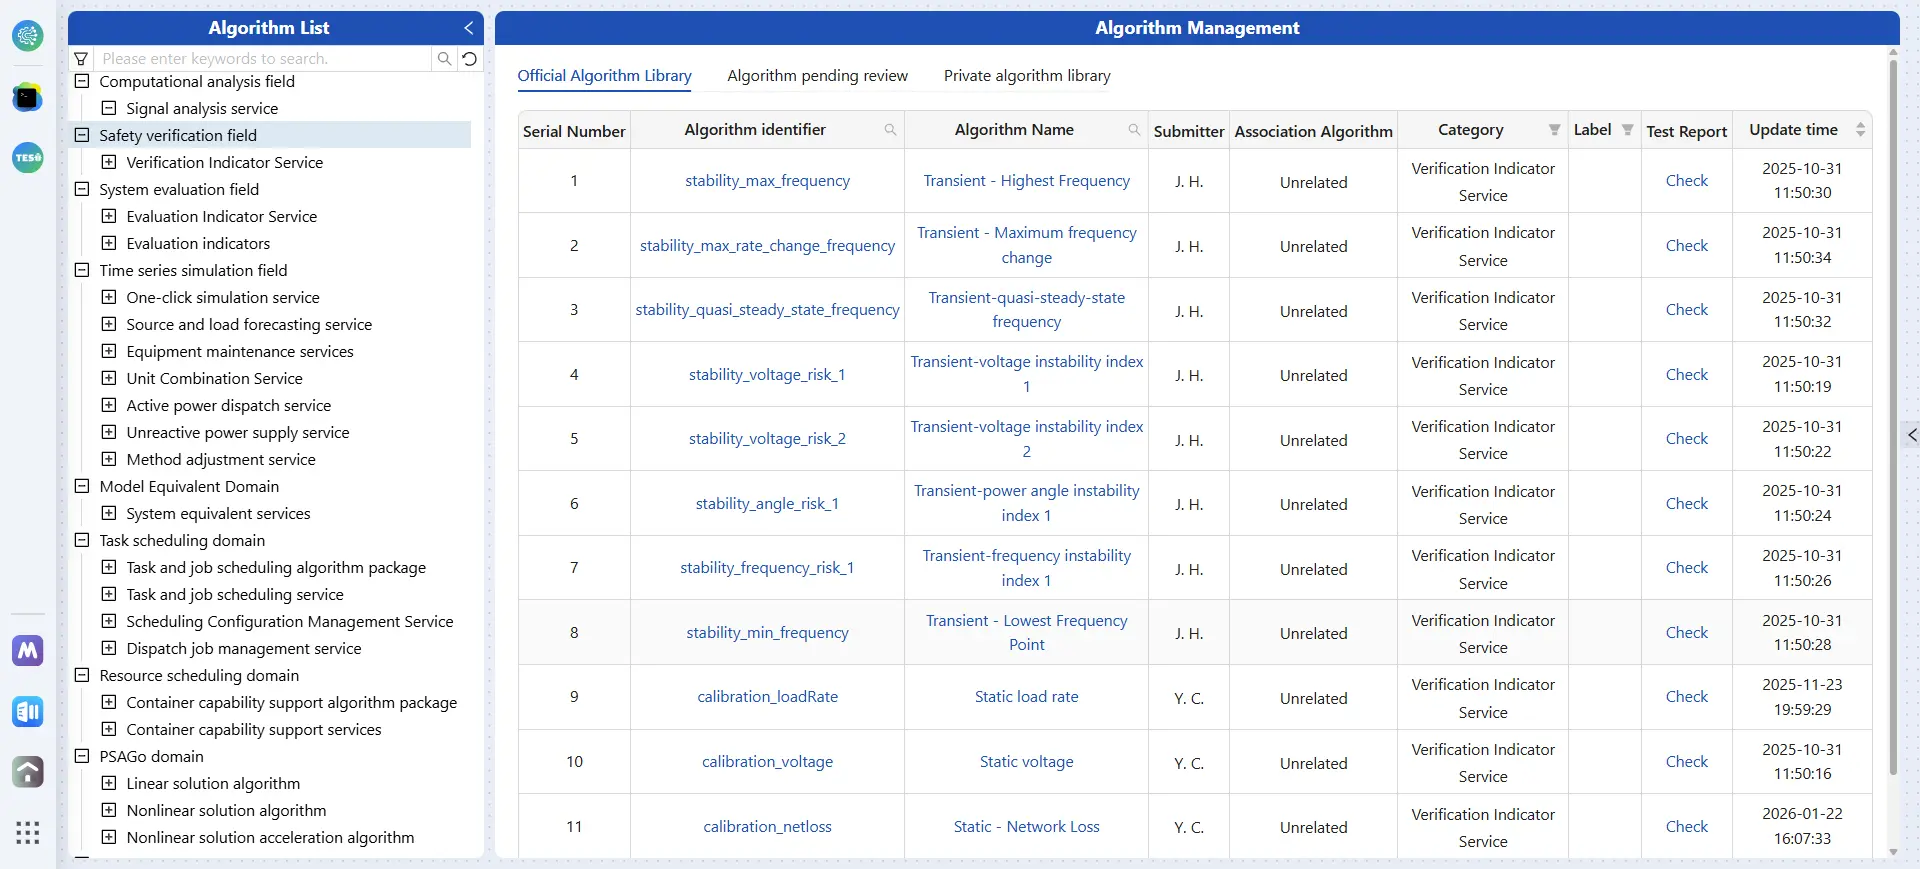
Figure 17 shows the algorithm overview interface. It centrally manages all available algorithms, demonstrating seamless integration from algorithm development to deployment and invocation. As of the case study implementation, the platform has successfully integrated 61 custom algorithms through this approach, covering business such as power flow calculation, time-domain simulation, unit maintenance scheduling, unit commitment, active power flow generation, reactive power flow generation, indicator-based system assessment, system equivalence, etc.
The above workflow demonstrates that BOS has successfully decoupled program integration from traditional software development processes, transforming it into a standardized business activity led by domain experts. This not only significantly accelerates the iteration speed of business innovation but also endows the platform with endogenous momentum for continuous evolution.
5. Conclusions and Future Works
This paper addresses the core challenges of business digitization in the new power system by proposing the domain-specific cloud Business Operating System with three systematic approaches—standardized definition, indexed organization, and dynamic management—applied to four core objects, Containers, Tasks, Programs, and Data. These approaches are materialized through five key technologies:
-
-
Object Standardized Definition, which solves the problem of inconsistent representation;
-
-
Object Indexed Organization, which resolves the issue of chaotic object retrieval;
-
-
Task-Container Co-Scheduling, which overcomes inefficient task execution and prevents resource crashes;
-
-
Program Loading and Unloading Management, which addresses the difficulty of integrating models and algorithms;
-
-
Data Read/Write Strategy Optimization, which tackles inefficient data access.
Case studies conducted on a real-world regional power grid validate the feasibility and effectiveness of BOS. Empirical results demonstrate that the BOS-based platform can effectively achieve seamless data connectivity across multiple business services, efficiently complete complex computational tasks, and support the integration of massive specialized models and algorithms. To advance BOS towards broader production adoption, future work will focus on:
-
-
Ecosystem Expansion: Integrate more domain-specific models and algorithms to support more complex scenarios such as large-scale power grid planning.
-
-
Enhanced Task/Container Scheduling Resilience: Strengthen the coordinated scheduling capability of tasks and containers for extreme scenarios, ensuring the continuity and reliability of critical business computations.
-
-
Deepening of Data Read/Write Performance: Investigate more refined data read/write optimization strategies tailored to the characteristics of power system business data, addressing extreme performance challenges under massive concurrent access.
-
-
Application Promotion and Validation: Deploy BOS in broader production environments, expand its coverage across business chains, and continuously validate its practical value through additional case studies.
Statement of the Use of Generative AI and AI-Assisted Technologies in the Writing Process
DeepSeek V3.1 and V3.2 were used only for language refinement and not for content generation.
Acknowledgments
The authors would like to thank all those who provided support and constructive feedback during the preparation of this work.
Author Contributions
Conceptualization, J.Z.; Methodology, J.Z. and J.H.; Software, J.Z., Y.L. (Yijian Luo), S.T. and J.H.; Validation, J.H., W.Y., Y.L. (Yang Liu), Z.L., Y.P. and Z.H.; Formal Analysis, J.H.; Investigation, J.H.; Resources, J.Z.; Data Curation, Y.L. (Yijian Luo) and S.T.; Writing—Original Draft Preparation, J.Z. and J.H.; Writing—Review & Editing, J.Z. and J.H.; Visualization, Y.L. (Yijian Luo); Supervision, J.Z.; Project Administration, J.Z.; Funding Acquisition, J.Z.
Ethics Statement
Not applicable.
Informed Consent Statement
Not applicable.
Data Availability Statement
Due to BOS is not open-source, the study’s supporting data are only accessible to authorized South China University of Technology users via the platform through internal network access.
Funding
This work was supported in part by the National Natural Science Foundation of China (No. 52277101) and in part by the Fundamental Research Funds for the Central Universities (No. 2024ZYGXZR109).
Declaration of Competing Interest
The authors declare that they have no known competing financial interests or personal relationships that could have appeared to influence the work reported in this paper.
References
- Zhao Y, Xia S, Zhang J, Hu Y, Wu M. Effect of the digital transformation of power system on renewable energy utilization in China. IEEE Access 2021, 9, 96201–96209. DOI:10.1109/ACCESS.2021.3094317 [Google Scholar]
- Thwe MM, Ştefanov A, Rajkumar VS, Palensky P. Digital twins for power systems: Review of current practices, requirements, enabling technologies, data federation, and challenges. IEEE Access. 2025, 13, 105517–105540. DOI:10.1109/ACCESS.2025.3580055 [Google Scholar]
- Sifat MMH, Das SK, Choudhury SM. Design, development, and optimization of a conceptual framework of digital twin electric grid using systems engineering approach. Electr. Power Syst. Res. 2024, 226, 109958. DOI:10.1016/j.epsr.2023.109958 [Google Scholar]
- Yu M, Zhou C, Lin X, Lin T. Reactive power planning contributed by energy storage under uncertainty of renewables and load. In Proceedings of the 2023 IEEE 7th Conference on Energy Internet and Energy System Integration, Hangzhou, China, 15–18 December 2023; pp. 81–84. DOI:10.1109/EI259745.2023.10513203 [Google Scholar]
- Wang X, Li X, Xia X, Yang M. Efficient Multi-Cluster scheduling for heterogeneous workloads. IEEE Access 2025, 13, 186856–186871. DOI:10.1109/ACCESS.2025.3626730 [Google Scholar]
- Ali A, Iqbal MM. A Cost and energy efficient task scheduling technique to offload microservices based applications in mobile cloud computing. IEEE Access 2022, 10, 46633–46651. DOI:10.1109/ACCESS.2022.3170918 [Google Scholar]
- Amro H, Fakhri B, Mouawad AE, Hajj IE. Faster vertex cover algorithms on GPUs with component-aware parallel branching. IEEE Trans. Parallel Distrib. Syst. 2026, 37, 504–517. DOI:10.1109/TPDS.2025.3641049 [Google Scholar]
- Lee HD, Park J, Lee Y, Im J, Jung J, So J, et al. Pangaea v2: CXL-based disaggregated memory system architecture for cloud-native orchestration. IEEE Trans. Comput. 2026. DOI:10.1109/TC.2026.3654926 [Google Scholar]
- Zhou G, Feng Y, Bo R, Chien L, Zhang X, Lang Y, et al. GPU-accelerated batch-ACPF solution for N-1 static security analysis. IEEE Trans. Smart Grid 2017, 8, 1406–1416. DOI:10.1109/TSG.2016.2600587 [Google Scholar]
- Bi J, Wu R, Yuan H, Wang Z, Zhang J, Zhou M. Ontology-based semantic reasoning for multisource heterogeneous industrial devices using OPC UA. IEEE Internet Things J. 2025, 12, 25020–25032. DOI:10.1109/JIOT.2025.3556934 [Google Scholar]
- Li Z, Sun W, Zhan D, Kang Y, Chen L, Bozzon A, et al. Amalur: The convergence of data integration and machine learning. IEEE Trans. Knowl. Data Eng. 2024, 36, 7353–7367. DOI:10.1109/TKDE.2024.3357389 [Google Scholar]
- Tian D, Chen W, Han Y. Energy-efficient and QoS-Guaranteed distributed scheduling for computing power networks powered by smart grids. IEEE Trans. Green Commun. Netw. 2026, 10, 933–948. DOI:10.1109/TGCN.2025.3604857 [Google Scholar]
- Zhang Y, Ye Y, Hu J, Hu H, Zhang X, Xu D. Constrained semi-MDP formulation and perception-enhanced safe policy learning for efficient dynamic task scheduling of data centers. IEEE Trans. Smart Grid 2026, 17, 1209–1224. DOI:10.1109/TSG.2025.3630667 [Google Scholar]
- Qian T, Wu Q, Hu Q. Efficient power system year-round hourly operation simulation based on multi-stage Stochastic Dual Dynamic Integer Programming. Int. J. Electr. Power Energy Syst. 2024, 161, 110158. DOI:10.1016/j.ijepes.2024.110158 [Google Scholar]
- Li Z, Shen L, Di X, Du X. Research on the construction technique of power grid digital twin model based on multi-source heterogeneous data. In Proceedings of the 2024 4th International Conference on New Energy and Power Engineering, Guangzhou, China, 8–10 November 2024; pp. 1026–1030. DOI:10.1109/ICNEPE64067.2024.10860554 [Google Scholar]
- Li Z, Gao S, Zhao S, Zhao J, Di X. Digital twins generating method of power distribution networks based on multidimensional data integration. In Proceedings of the 2024 7th International Conference on Mechatronics and Computer Technology Engineering, Guangzhou, China, 23–25 August 2024; pp. 1066–1069. DOI:10.1109/MCTE62870.2024.11117790 [Google Scholar]
- Li Z, Saldías-Vallejos N, Seco D, Rodríguez MA, Ranjan R. Long Live the Image: On enabling resilient production database containers for microservice applications. IEEE Trans. Softw. Eng. 2024, 50, 2363–2378. DOI:10.1109/TSE.2024.3436623 [Google Scholar]
- Pandey R, Kumar N. A digital twin-based stability monitoring and parameter estimation framework for three-phase grid-connected photovoltaic inverters. IEEE Trans. Power Electron. 2026, 41, 6304–6313. DOI:10.1109/TPEL.2025.3628752 [Google Scholar]
- Richardson C. Microservices Patterns: With Examples in Java; Manning: Shelter Island, NY, USA, 2018. [Google Scholar]
- Jeong B, Jeong Y. Autoscaling techniques in cloud-native computing: A comprehensive survey. Comput. Sci. Rev. 2025, 58, 100791. DOI:10.1016/j.cosrev.2025.100791 [Google Scholar]
- Xu J, Gautam N. Peak age of information in priority queuing systems. IEEE Trans. Inform. Theory 2021, 67, 373–390. DOI:10.1109/TIT.2020.3033501 [Google Scholar]
- Chen G, Zhang J, Ning M, Cui W, Ma M. Task scheduling in real-time industrial scenarios. Comput. Ind. Eng. 2023, 182, 109372. DOI:10.1016/j.cie.2023.109372 [Google Scholar]
- Tang Y, Zhao L, Su Y, Zhou B, Xu Y, Huang G, et al. Ontology-based optimization method for multi-source heterogeneous data organization in large power grid planning and operation platforms. In Proceedings of the 2024 3rd International Conference on Energy and Electrical Power Systems, Guangzhou, China, 14–16 July 2024; pp. 853–858. DOI:10.1109/ICEEPS62542.2024.10693177 [Google Scholar]
- Xu Y, Su Y, Zhao L, Zhou B, Tang Y, Huang G, et al. Distributed data storage architecture model and data platform design for power grid dispatching. In Proceedings of the 2024 3rd International Conference on Energy and Electrical Power Systems, Guangzhou, China, 14–16 July 2024; pp. 859–863. DOI:10.1109/ICEEPS62542.2024.10693170. [Google Scholar]
- Silberschatz A, Galvin PB, Gagne G. Operating System Concepts, 10th ed.; John Wiley & Sons: Hoboken, NJ, USA, 2018; pp. 105–617. [Google Scholar]
- Wang Y, Zhao L, Tu S, Yi Y, Lin J, Zhen H, et al. Electro-mechanical transient modeling and simulating of MMC- HVDC for offshore wind farms. In Proceedings of the 2024 6th International Conference on Energy, Power and Grid (ICEPG), Guangzhou, China, 27–29 September 2024; pp. 684–690. DOI:10.1109/ICEPG63230.2024.10775798 [Google Scholar]