Aerial Remote Sensing for Precision Archaeology Using RGB–Multispectral Image Fusion of UAS Data

Aerial Remote Sensing for Precision Archaeology Using RGB–Multispectral Image Fusion of UAS Data

Received: 31 January 2026 Revised: 26 February 2026 Accepted: 28 February 2026 Published: 11 March 2026

© 2026 The authors. This is an open access article under the Creative Commons Attribution 4.0 International License (https://creativecommons.org/licenses/by/4.0/).
1. Introduction
The metric and thematic documentation of an archaeological site is a fundamental component of cultural management, as it is directly linked to the preservation, understanding, and promotion of our Cultural Heritage. Although the definition of Precision Archaeology was introduced only recently [1], its concept has existed for decades within the context of archaeological surveying. It refers to the use of modern, innovative technologies for the acquisition, processing, and analysis of ultra-high spatial resolution data (up to 5 cm [2,3,4]) aimed at decision-making for the conservation, restoration, and protection of our Cultural Heritage.
Despite the rapid adoption of unmanned aircraft systems (UAS) in Precision Archaeology, a persistent methodological gap remains: RGB imagery provides ultra-high spatial detail but limited spectral discrimination, whereas multispectral (MS) imagery improves material separability but at substantially lower spatial resolution at comparable flight heights. This spatial–spectral trade-off constrains both metric documentation and thematic mapping (e.g., material classification and pathology detection) at the scales required for conservation. To address this gap, this paper evaluates a PPK-enabled RGB–MS fusion workflow and quantifies spectral preservation in fused products across two more archaeological sites. Precision Archaeology relies on the use of a total station, a Global Navigation Satellite System (GNSS) receiver, a Terrestrial Laser Scanner, as well as terrestrial and aerial photogrammetry and remote sensing for producing high-resolution spatial products. Aerial remote sensing archaeology using unmanned aircraft systems (UAS) provides procedures for observation and analysis that play a leading role in the study, protection, and promotion of Cultural Heritage [5,6,7,8,9,10,11]. The rapid acquisition of high–spatial resolution data, combined with the possibility of repeated monitoring without physical contact, renders UAS particularly valuable for archaeological documentation. The rapid development of UAS sensors has introduced additional remote sensing capabilities. Visible, multispectral, and thermal sensors allow the recording of complementary information, including morphological characteristics, temperature variability, and subsurface proxies [6,8,12,13,14]. Today, emphasis is placed on the integrated processing of these datasets, as each sensor type contributes distinct thematic content. Furthermore, UAS platforms offer operational advantages including relatively low cost, flexible deployment, and automated flight planning [10,15]. High-accuracy photogrammetric outputs generated through Structure from Motion (SfM) algorithms have further facilitated their rapid adoption in archaeology [11,14]. SfM enables 3D reconstruction through feature matching, camera orientation, and dense point cloud generation, supporting the production of orthophotomosaics and surface models [16]. Beyond documenting standing monuments, aerial remote sensing archaeology, particularly through the use of multispectral (MS) and thermal images, plays a crucial role in detecting covered by the ground archaeological remains. This is achieved through variations in vegetation (height, color, temperature, caused, for example, by buried remains) and/or variations in bare soil (color, temperature, due to changes in soil moisture related to, for example, buried remains), all of which are recorded by sensors [6,17,18,19]. Additionally, studies combining aerial and geophysical data result in excellent maps of archaeological remains covered by the ground [19]. Thus, aerial remote sensing archaeology is a powerful tool for archaeological prospection, as it enables the discovery of new archaeological remains hidden beneath the surface that remain invisible during traditional surface survey [12,20,21]. It also demonstrates high applicability in coastal or underwater contexts, where the integration of UAS data with underwater documentation results in complete 3D visualizations, connecting terrestrial and marine spaces within a unified reference system [14]. Finally, its use has significantly strengthened interdisciplinary collaboration among archaeologists, surveyors, architects, and other specialists [8,19].
The quality and completeness of the thematic information extracted from UAS-images depend on the type and characteristics of the sensor used. An RGB sensor captures objects in the visible spectrum, achieving extremely high spatial resolution, even down to a few millimeters when the acquisition is carried out from low flight heights. In contrast, an MS sensor records information in additional spectral bands beyond the visible range, although at lower spatial resolution, typically several centimeters from the same flight heights. This inverse relationship between spatial and spectral resolution creates limitations, especially in archaeological applications requiring orthophotomosaics at scales from 1:25 to 1:250. To address this issue, image fusion has been used in academic research efforts beginning in 2020 [22,23,24,25]. This process utilizes simultaneous RGB and MS image acquisition from a UAS to create a new image that combines the advantages of both sensors: the spectral information of the MS image and the ultra-high spatial resolution of the RGB image.
The aim of this paper is to employ and validate UAS image fusion as an innovative technique to improve the spatial resolution of MS data acquired via aerial remote sensing within the framework of Precision Archaeology. To the already successful experimental applications, this research adds the study of two additional archaeological sites, the Sanctuary of Eukleia at Aigai (Vergina, Greece) and the funerary ensemble in the Philippi plain (Drama, Greece). In both cases, RGB and MS images acquired with UAS are fused to produce new MS orthophotomosaics of enhanced spatial resolution. Thus, these fused images can improve the quality and reliability of archaeological documentation by enabling optimal material classification and more accurate detection of the pathology of archaeological remains.
In summary, the present study practically addresses the limitation that, within the context of Precision Archaeology, RGB data provide very high spatial detail with lower spectral information, whereas MS data provide more spectral information but with lower spatial resolution. Specifically, the workflow for improving the spatial resolution of MS orthophotomosaics through image fusion, using a PPAN image derived from the RGB data, is presented and evaluated in two new application areas, together with a quantitative assessment of spectral information preservation in the fused products, and with practical observations on the factors that affect their performance (e.g., the time gap between acquisitions and shadowing).
Beyond applying RGB–MS fusion in two additional archaeological contexts, the main contributions of this work are the following: (i) the integration of PPK-refined camera positioning within the fusion-oriented workflow to ensure centimeter-level geometric consistency without relying on ground control points during processing; (ii) the systematic quantitative evaluation of spectral preservation using band-wise correlation, complemented by SAM and RMSE metrics, under different acquisition conditions; (iii) the explicit analysis of illumination and temporal-offset effects on fusion robustness; and (iv) the validation of the fused products through an archaeological classification test demonstrating improved thematic separability at monument scale. Collectively, these elements extend existing RGB–MS UAS fusion studies by linking spatial accuracy control, spectral-consistency assessment, and archaeological interpretive applicability within a single reproducible protocol.
2. Study Areas
The first site examined is the Sanctuary of Eukleia, located within the archaeological area of Aigai (Vergina, Greece, Figure 1). Aigai, the capital of the Macedonian kingdom, has been designated a UNESCO World Heritage Site. The Sanctuary of Eukleia lies north of the Palace and the Theatre of Aigai, near the western fortification walls of the ancient city. Preserved remains include the foundations of the temple, an adjacent stoa, the bases of three marble votive offerings, and the remnants of a monumental altar (all archaeological remains dated to the 4th century BC). From the same period originates a marble statue dedicated by Queen Eurydice, mother of Philip II, to the goddess Eukleia [26].
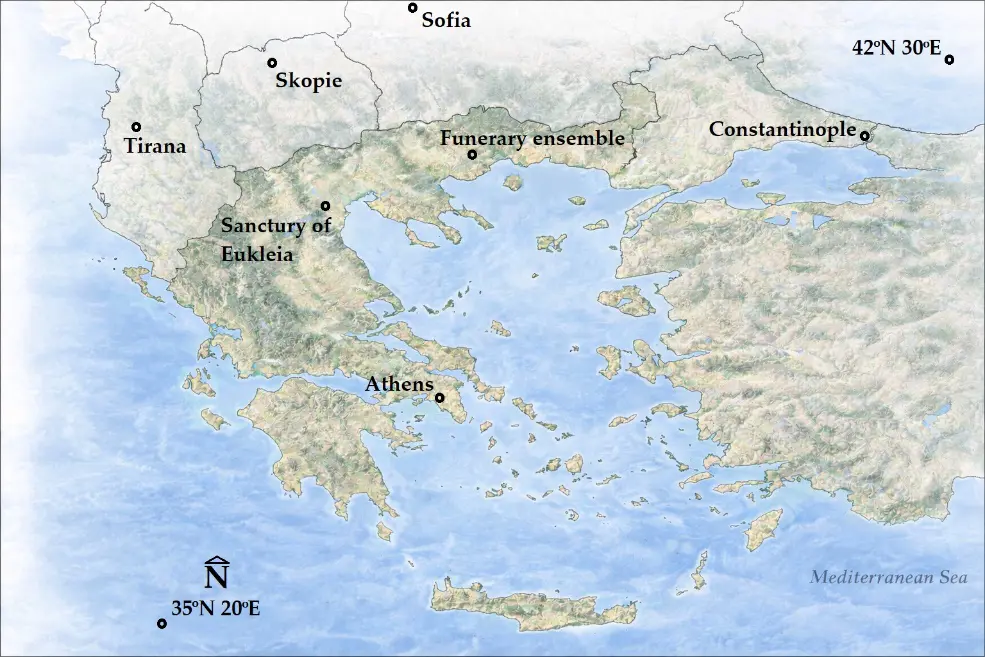
The second site examined is a funerary ensemble in the Philippi plain (Drama, Greece, Figure 1). It consists of two cist graves and a Macedonian tomb. These were located and excavated by the 18th Ephorate of Prehistoric and Classical Antiquities in the early 1980s, following extensive looting activity. Since then, research had come to a halt, and only recently did the Ephorate of Antiquities of Drama conduct rescue survey aimed at re-examining the site for its protection and future presentation.
From a methodological perspective, the two areas were selected so that the proposed RGB–MS fusion workflow could be evaluated across different archaeological settings. The Sanctuary of Eukleia is a systematically investigated and clearly delimited site, with visible architectural remains and complex geometry/morphology at the monument scale, conditions that facilitate assessing the spatial detail and geometric consistency of the produced outputs. By contrast, the funerary ensemble in the Philippi plain represents a case of identification/re-examination in an agricultural landscape, where the background (soil/crops) and the lower visibility of the features create different documentation requirements. The combination of the two cases allows the functionality and repeatability of the workflow to be assessed across different field contexts.
3. Data and Methods
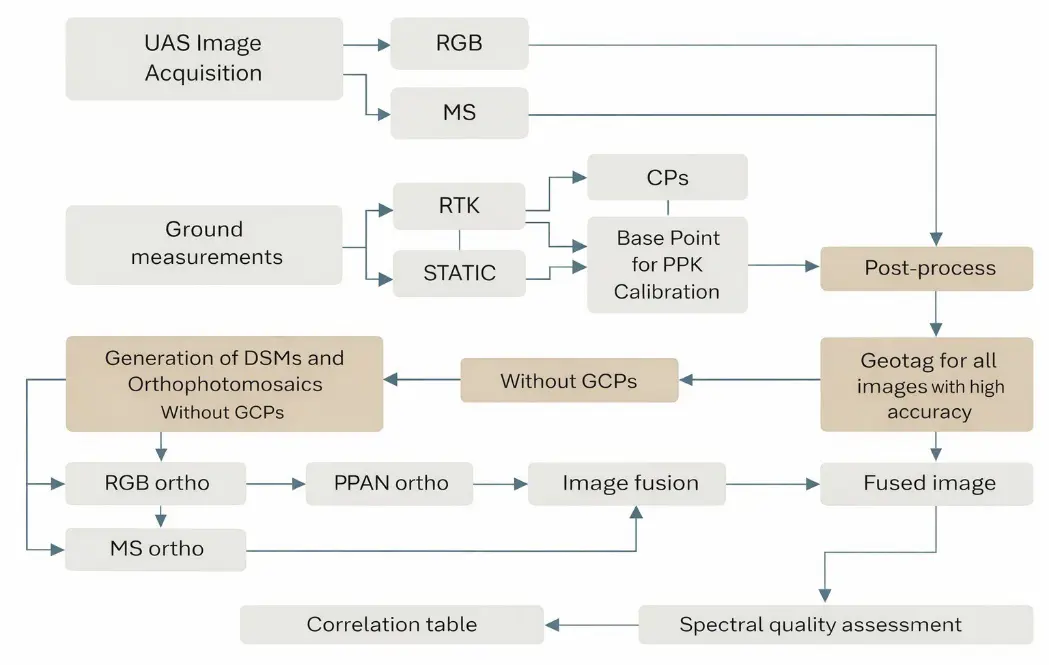
The methodology of this study consists of six main stages (Figure 2). The first stage involves the acquisition of RGB and MS images using a UAS over the two archaeological sites. The second stage includes ground control measurements and PPK processing. The third stage concerns photogrammetric processing for the production of DSMs and orthophotomosaics. The fourth stage involves dense cloud generation and surface modeling. The fifth stage consists of PPAN generation and PCA-based image fusion. Finally, spectral preservation and product accuracy are evaluated.
3.1. UAS, GNSS, and Processing Software
The following equipment description emphasizes parameters directly relevant to the workflow and accuracy (PPK configuration, sensor characteristics affecting GSD/spectral bands), while additional manufacturer specifications are provided for completeness.
Key technical specifications of the UAS platform, onboard sensors, and GNSS instrumentation (e.g., focal length, spatial resolution, spectral bands, flight endurance, and PPK capability) are reported in the text to support transparency in acquisition and methodological reproducibility.
Within the proposed RGB–MS fusion framework, equipment selection was driven by three operational requirements: (i) centimeter-level georeferencing accuracy to ensure geometric compatibility between RGB and MS products; (ii) availability of both high-resolution RGB and calibrated multispectral sensors deployable on the same aerial platform; and (iii) stable integration with PPK processing workflows to support reproducible spatial referencing without reliance on dense ground control networks.
For the collection of images, the fixed-wing UAS WingtraOne GEN II (Wingtra AG, Zurich, Switzerland) (Figure 3) with vertical take-off and landing (VTOL) capability was used. It measures 125 × 68 × 12 cm, weighs 3.7 kg, and can carry a payload of up to 800 g. Its operation is based on two 99 Wh batteries, providing a maximum flight time of up to 59 min at a nominal cruising speed of 16 m/s. The UAS is designed to operate in steady winds up to 12 m/s, ambient temperatures ranging from −10 °C to +40 °C, and it can conduct flights at altitudes up to 2500 m, or up to 4800 m when equipped with special propellers. It is equipped with an integrated GNSS antenna supporting Post-Processed Kinematic (PPK) and is compatible with the GPS (L1, L2), GLONASS (L1, L2), Galileo (L1), and BeiDou (L1) satellite systems. Flight planning is carried out using the WingtraPilot© v.2.18.1 software (Wingtra AG, Zurich, Switzerland). The WingtraOne GEN II platform was selected because its integrated multi-frequency PPK GNSS module enables direct georeferencing of image centers with centimeter-level accuracy, reducing the need for extensive ground control deployment while ensuring geometric consistency between independently acquired RGB and MS datasets. This capability is particularly important in fusion workflows where sub-pixel co-registration is required prior to component substitution. The UAS can be fitted with either an RGB or an MS sensor. For capturing RGB images, the Sony RX1R II sensor (Sony Group Corporation, Tokyo, Japan) is used, with a 35 mm focal length and a resolution of 42.4 megapixels. At a flight height of 120 m, this sensor achieves a spatial resolution of approximately 1.6 cm per pixel. For capturing MS images, the UAS is equipped with the MicaSense RedEdge-MX sensor (MicaSense Inc., Seattle, WA, USA), which has a focal length of 5.5 mm and a resolution of 1.2 Mp. This sensor records data in five spectral bands, Blue, Green, Red, Red Edge, and Near-Infrared (NIR), providing a resolution of 8.2 cm per pixel at the same flight height [27,28].
The specific sensor combination was chosen to represent a typical yet operationally robust UAS configuration used in archaeological documentation: a full-frame RGB sensor for ultra-high spatial detail and a five-band multispectral sensor for material and vegetation discrimination. Their complementary spatial–spectral characteristics make them suitable for evaluating fusion performance under realistic field conditions.
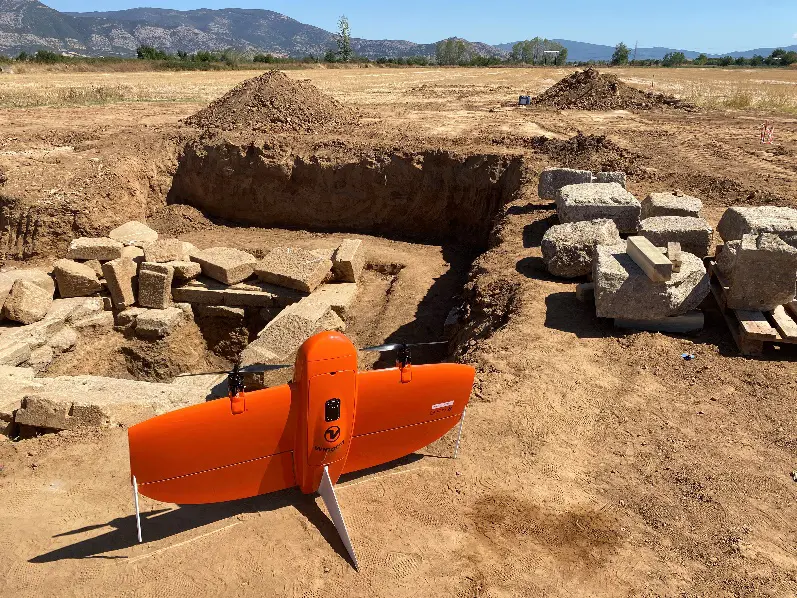
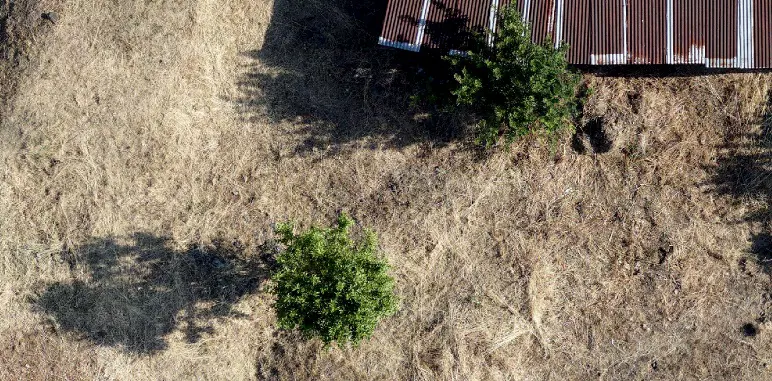
Figure 3. The UAS WingtraOne GEN II at the archaeological site of the funerary ensemble (Philippi plain, Greece). The figure shows the Macedonian tomb, while the flat terrain of the plain is visible.
The GNSS receiver Topcon HiPer SR (Topcon Positioning Systems, Tokyo, Japan) [29] was used for measuring the control points (CPs) and the base point via the Real-Time Kinematic (RTK) method prior to the flights. It was also used to collect static measurements of the base point during the flights, enabling accurate calculation of the images center coordinates during the processing stage. The receiver is compatible with a wide range of satellite systems, including GPS (L1, L2, L2C), GLONASS (L1, L2, L2C), and SBAS-QZSS (L1, L2C). When used in real time, the receiver connects to a GNSS permanent reference station network via mobile telephony, receiving RTK corrections in real time to improve measurement accuracy.
The use of an independent survey-grade GNSS receiver allowed accurate base-point establishment and static logging, ensuring reliable rover–base differential corrections during PPK processing. This configuration strengthened the positional reliability of the photogrammetric products and supported the accuracy-aware evaluation of the fusion outputs.
For processing the flight data and generating the digital surface models (DSMs) and orthophotomosaics, the software Agisoft Metashape Professional© v2.0.3 (Agisoft LLC, Saint Petersburg, Russia) was used, while the production of the fused images was carried out using Erdas Imagine Professional 2023© v.16.8.1 (Hexagon AB, Stockholm, Sweden).
3.2. Ground Control and PPK Georeferencing
The second stage includes ground measurements of CPs at each site using a Topcon HiPer SR GNSS receiver operating in RTK mode, static GNSS logging of the base point and PPK data processing were performed to refine image center coordinates. For each flight (RGB and MS), a base point was established near the take-off location, and its coordinates were computed using RTK in GGRS87/Greek Grid (EPSG:2100). Static GNSS logging was performed at the same point for ~30 min before take-off, throughout the flight, and for ~30 min after landing. The rover (UAS) and base data were processed in WingtraHub© v2.18.1 (Wingtra AG, Zurich, Switzerland) to generate PPK-corrected coordinates for the image acquisition centers (image center coordinates), which were then used as reference camera positions during processing in Agisoft Metashape Professional© v2.0.3 (Agisoft LLC, Saint Petersburg, Russia). The specific settings/parameters of the PPK solution are reported in Table 1, while the final accuracy achieved is summarized in Section 4.3.
Table 1. Configuration and key PPK (rover–base) parameters for computing image acquisition centers.
|
Parameter |
Value/Description |
|---|---|
|
Rover GNSS |
WingtraOne GEN II integrated PPK GNSS (multi-frequency) |
|
Base GNSS |
Topcon HiPer SR |
|
Base point coordinates |
RTK, EPSG:2100 |
|
Static logging duration |
30 min before take-off/throughout the flight/30 min after landing |
|
Sampling rate/logging interval |
Default device setting (not user-defined) |
|
Base point selection criterion |
Near take-off, open-sky/stable location |
|
Constellations/frequencies |
Rover: GPS (L1, L2), GLONASS (L1, L2), Galileo (L1), BeiDou (L1) Base: GPS (L1, L2, L2C), GLONASS (L1, L2, L2C), SBAS/QZSS (L1, L2C) |
|
Processing software |
WingtraHub v2.18.1 |
|
RINEX export |
Yes |
|
PPK correction protocol |
Rover–base differential PPK (WingtraHub default workflow) |
|
Quality indicators |
Reported horizontal accuracy: ~±2 cm; reported vertical accuracy: ~±3 cm; other indicators not reported |
3.3. Photogrammetric Processing for DSMs and Orthophotomosaics
The following steps of the workflow were identical for both RGB and multispectral imagery. The images were first aligned based on their pre-calculated their centers coordinates, under a configuration emphasizing high positional accuracy (Table 2). Throughout this orientation stage, the projection centers were weighed using high-precision PPK-corrected coordinates. No additional manual corrections were applied. The software generated estimates of the root mean square error (RMSExyz) for the image positions along each axis, which provides a theoretical estimate of the internal consistency and spatial accuracy of the reconstructed image positions and derived products. Although the MS images have lower ground resolution than the RGB images, the MS dataset contained fewer key points and tie points due to its lower detail, which can lead to slightly lower RMSExyz values. In contrast, the RGB images, with higher detail and more tie points, produce a more constrained solution, resulting in slightly higher theoretical RMSExyz, even though their actual ground accuracy remains excellent.
Table 2. Processing settings used for RGB and multispectral (MS) datasets to generate DSMs and orthophotomosaics.
|
Parameter |
RGB |
MS |
RGB |
MS |
|---|---|---|---|---|
|
Archaeological site |
Sanctuary of Eukleia [1] |
Funerary ensemble |
||
|
Accuracy |
High |
|||
|
Key point limit |
40,000 |
|||
|
Tie point limit |
4000 |
|||
|
Adaptive camera model fitting |
Yes |
|||
|
Guided image matching |
Enabled |
|||
|
Camera location accuracy |
σx = σy = 0.02 m; σz = 0.03 m |
|||
|
Depth maps quality |
High |
|||
|
Depth filtering |
Aggressive |
|||
|
Reuse depth maps |
Yes |
|||
|
Surface type |
Arbitrary (3D) |
|||
|
Face count (high-quality setting) |
15,000,000 |
440,000 |
72,000,000 |
1,400,000 |
|
Mapping mode |
Generic |
|||
|
Blending mode |
Mosaic |
|||
|
Texture size |
16,284 pixels |
|||
|
Texture type |
Diffuse map |
|||
|
DSM source |
Dense cloud |
|||
|
Orthophotomosaic surface |
DSM |
|||
|
Blending mode |
Mosaic |
|||
|
Pixel size |
Native GSD |
|||
The image datasets captured by UAS were processed using Agisoft Metashape Professional© v2.0.3 (Agisoft LLC, Saint Petersburg, Russia). The workflow that follows was independently carried out for both the Sanctuary of Eukleia and the funerary ensemble, following the same parameters and processing logic. At the beginning of each project, all images containing precise their centers coordinates, were imported into the software environment, where the coordinate reference system was set to GGRS87 (Greek Grid, EPSG:2100). For MS datasets, spectral calibration was performed immediately after import. This procedure involved using calibration panels, photographed before and after each flight. These panels were automatically detected by the software, which then calculated reflectance values for all spectral bands.
For radiometric calibration, panel images acquired immediately before and after each flight were used to convert raw digital numbers to reflectance per band. Metashape’s calibration workflow detects the panel target automatically and applies band-wise reflectance normalization to the MS imagery, reducing acquisition-to-acquisition radiometric variability due to illumination changes. The calibrated reflectance products were then used to generate the orthophotomosaic and for subsequent fusion.
In the third stage, RGB and MS images were processed in Agisoft Metashape Professional© v2.0.3 (Agisoft LLC, Saint Petersburg, Russia) using PPK-corrected camera positions as references and without GCPs to generate DSMs and orthophotomosaics. For reproducibility, the key processing settings are reported in Table 3. Product accuracy was then assessed by comparing the field-measured coordinates of the seven CPs with their corresponding locations on the DSMs and orthophotomosaics.
Table 3. Processing Parameters and Output Metrics for UAS Datasets.
|
Parameter |
RGB |
MS |
RGB |
MS |
|---|---|---|---|---|
|
Archaeological site |
Sanctuary of Eukleia [1] |
Funerary ensemble |
||
|
Spectral calibration |
— |
Yes (before and after each flight, automatic target recognition) |
— |
Yes (before and after each flight, automatic target recognition) |
|
Average flight height |
60 m |
100 m |
60 m |
100 m |
|
Point cloud depth filtering |
Aggressive |
|||
|
Point cloud source data |
Depth maps |
|||
|
Point cloud quality |
High |
|||
|
Dense point cloud |
55,388,121 |
1,678,461 |
273,531,489 |
5,289,644 |
|
Dense cloud source |
images |
|||
|
Mesh source data |
Point cloud |
|||
|
Surface type (mesh) |
Arbitrary 3D |
|||
|
Face count (high-quality setting) |
15,000,000 |
440,000 |
72,000,000 |
1,400,000 |
|
3D mesh faces (triangular mesh) |
42,811,371 |
1,101,396 |
154,575,871 |
1,582,402 |
|
Texture type |
Diffuse map |
|||
|
Mapping mode |
Generic |
|||
|
Blending mode |
Mosaic |
|||
|
Texture size |
16,284 pixels |
|||
|
Final outputs |
DSM, Orthophotomosaic |
|||
|
DSM pixel size |
Based on dense cloud density |
|||
|
Οrthophotomosaic pixel size |
Native GSD of images |
|||
|
Projection center accuracy (RMSExyz) |
1.6 cm |
0.7 cm |
1.8 cm |
0.9 cm |
|
DSM ground resolution |
1.5 cm/pixel |
13.5 cm/pixel |
1.8 cm/pixel |
13.5 cm/pixel |
|
Orthophotomosaic resolution |
0.8 cm/pixel |
7 cm/pixel |
0.9 cm/pixel |
7 cm/pixel |
3.4. Dense Point Clouds, Mesh Models and Surface Products
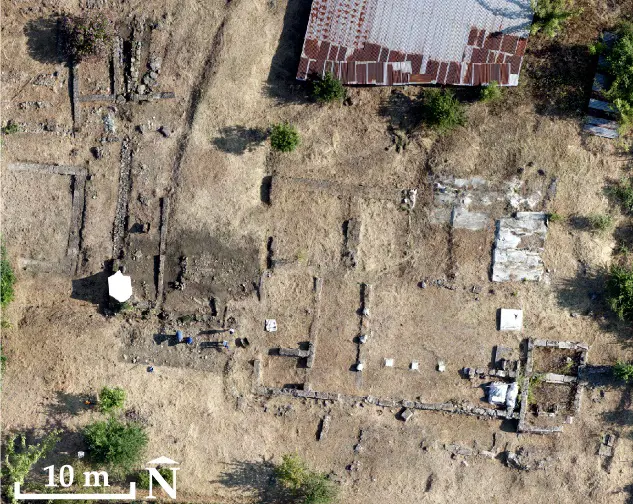
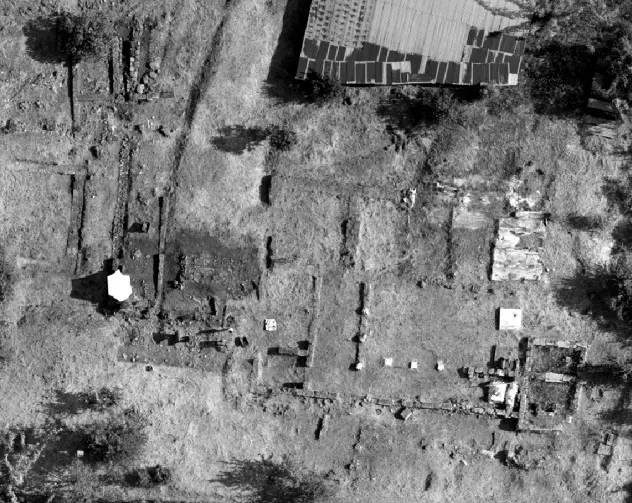
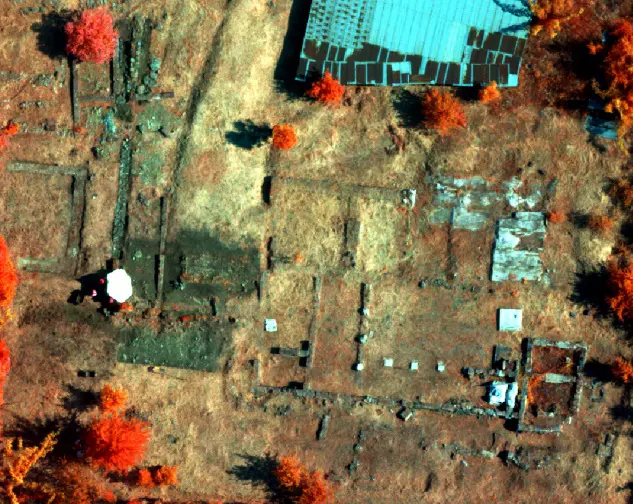
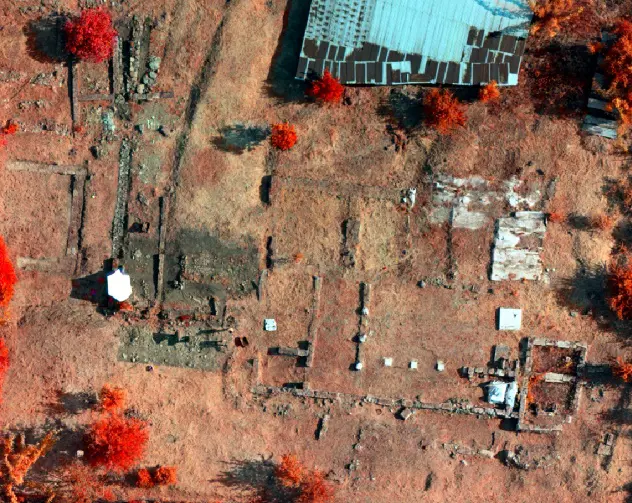
After image alignment, dense point clouds were created for both RGB and MS datasets using high-quality reconstruction settings. These settings included resampling of the original imagery prior to feature matching and the use of an aggressive depth-filtering approach. The resulting dense clouds served as the foundation for the creation of triangular mesh models, with each mesh generated directly from its corresponding point cloud. The surface type was defined as arbitrary 3D, while texturing was performed using the original imagery. Texture generation followed a generic mapping mode and mosaic blending method to ensure a smooth and visually coherent surface appearance. The completed texture meshes served as the basis for producing Digital Surface Models (DSMs) and orthophotomosaics (Figure 4 and Figure 5). The pixel size of the DSMs was determined by the density of the corresponding dense point clouds, while the orthophotomosaics were produced at a pixel size equivalent to the imagery’s native ground sampling distance.
 |
 |
|
(a) |
|
 |
 |
|
(b) |
|
Figure 4. (a) The RGB orthophotomocaic of the Sanctuary of Eukleia (left), and the DSM (right) is shown in grayscale white tones for higher elevations, 154 m, dark tones for lower elevations, 149 m; (b) The MS orthophotomocaic (bands Blue, Green, NIR) (left), and the DSM (right) is shown in grayscale white tones for higher elevations, 154 m, dark tones for lower elevations, 149 m. Center of images 40°28′47.61″ N, 22°19′16.87″ E.
 |
 |
|
(a) |
|
 |
 |
|
(b) |
|
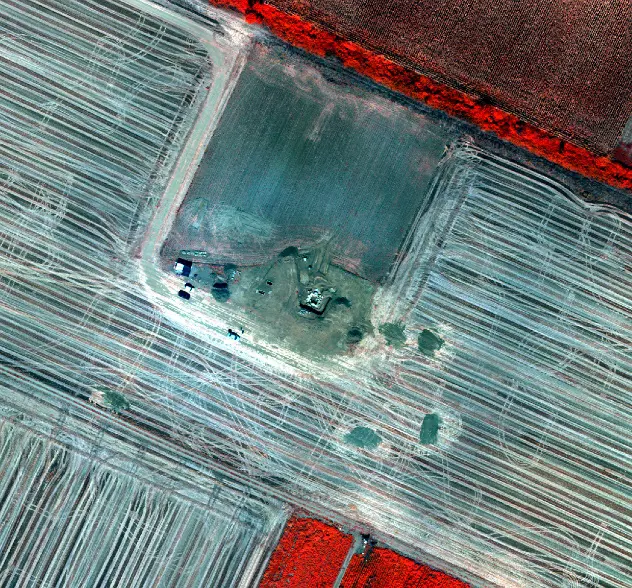
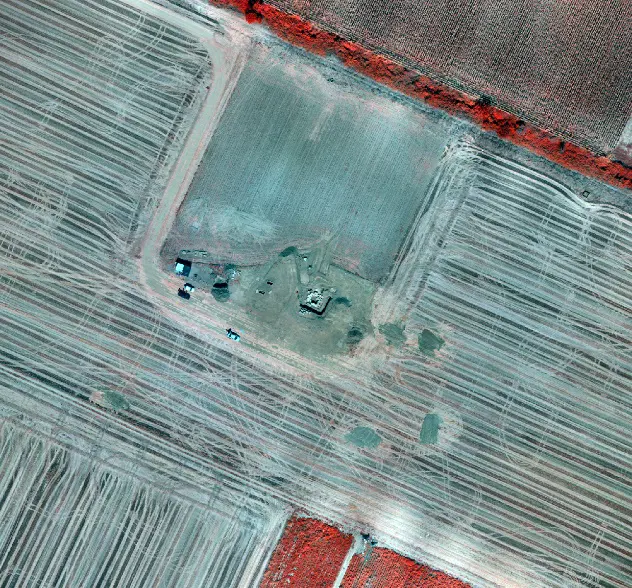
Figure 5. (a) The RGB orthophotomocaic (left) of the funerary ensemble, and the DSM (right) is shown in grayscale white tones for higher elevations, 71 m, dark tones for lower elevations, 62 m; (b) The MS orthophotomocaic (bands Blue, Green, NIR) (left), and the DSM (right) is shown in grayscale white tones for higher elevations, 71 m, dark tones for lower elevations, 62 m. Center of images 41°2′4.58″ N, 24°12′51.37″ E.
3.5. Image Fusion Workflow
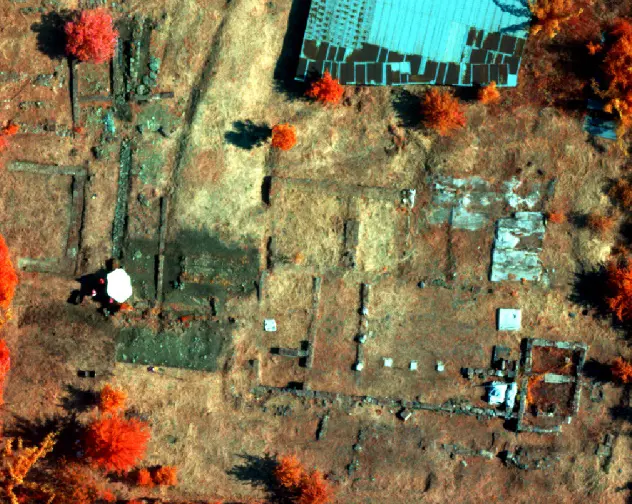
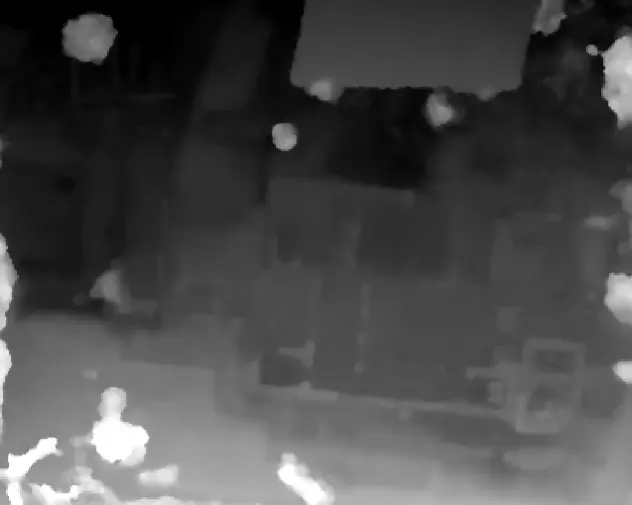
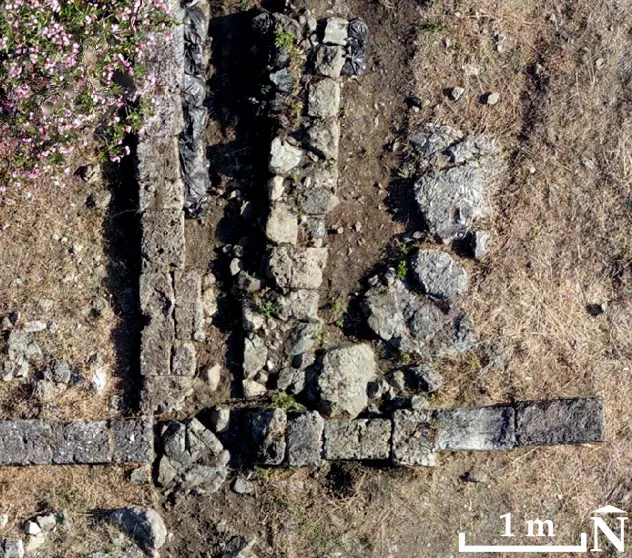
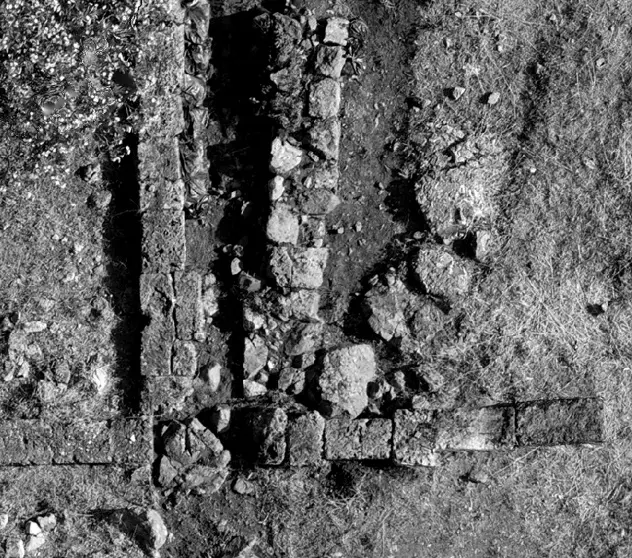
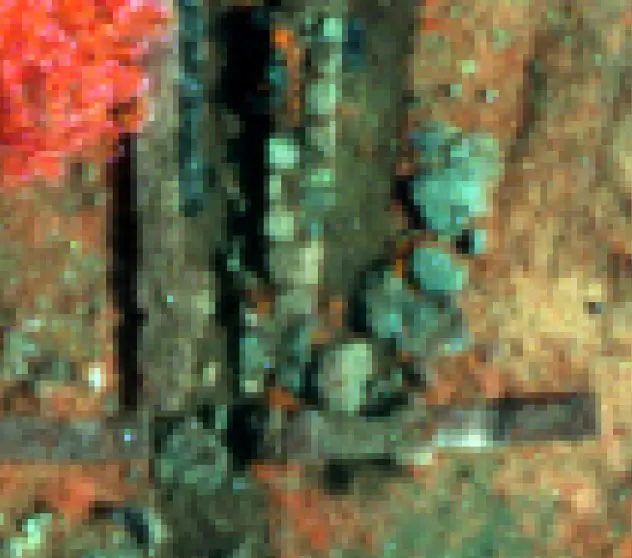
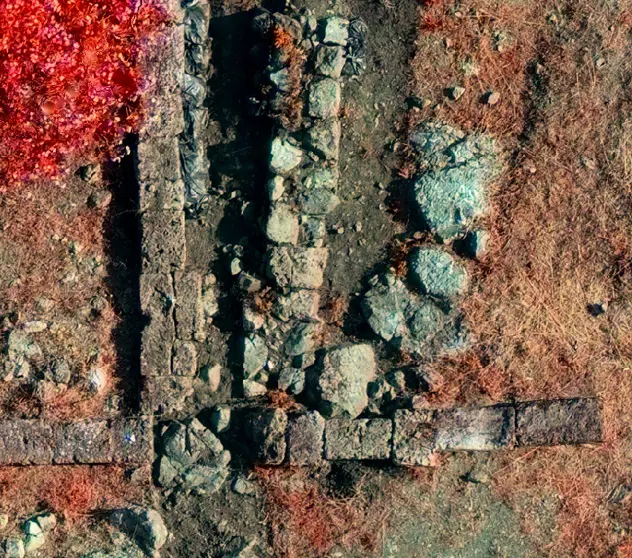
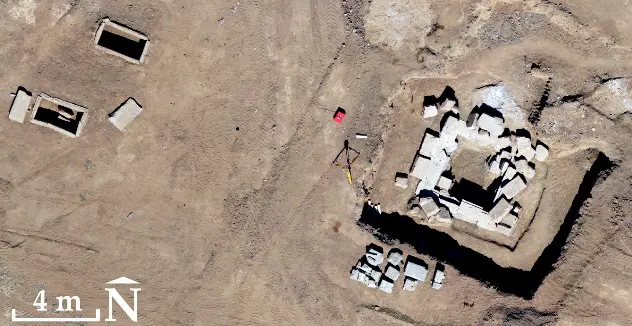
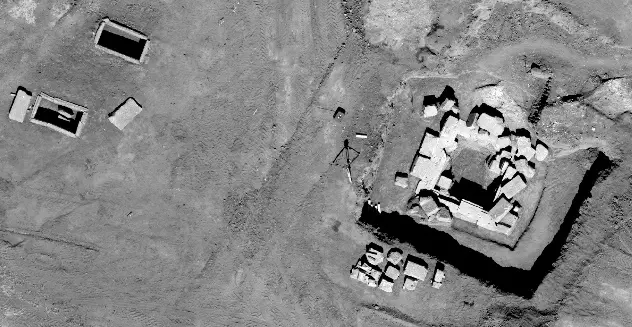
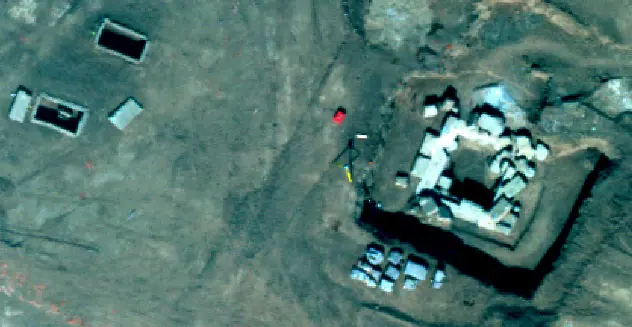
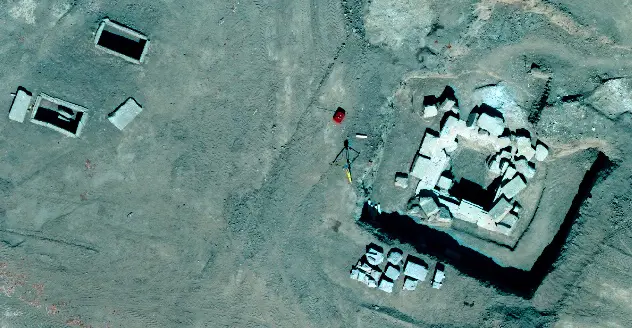
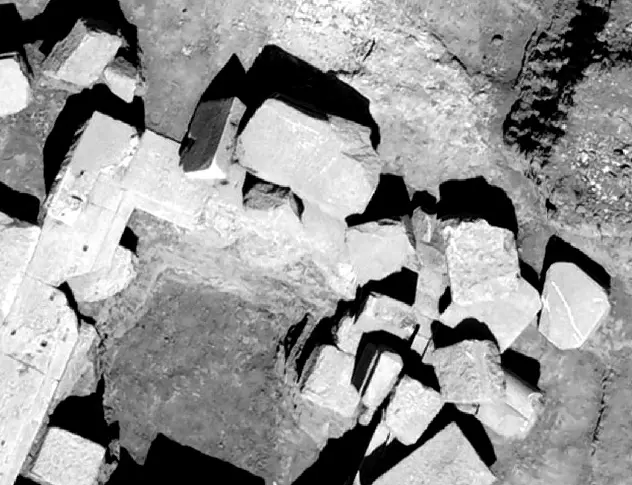
Following satellite image fusion workflows [30,31,32,33,34], the panchromatic (PAN) and MS images should be available. Since the UAS used in these archaeological sites lacks a panchromatic (PAN) sensor, an alternative procedure was implemented to produce pseudo-panchromatic (PPAN) images (Figure 6 and Figure 7) using Adobe Photoshop© CS6 v.13.0 (Adobe Inc., San Jose, CA, USA). Each high-resolution RGB orthophotomosaic was converted to grayscale using the Image/Mode/Grayscale command. This operation is not a fixed linear combination of the RGB channels; instead, it performs a color-managed conversion to the active Gray working space (i.e., a color-profile conversion). Consequently, the output depends on the color-management settings. In this paper, the orthophotomosaic RGB profile was sRGB IEC61966-2.1, and the Gray working space was Gray Gamma 2.2. Photoshop’s Color Settings were otherwise left unchanged during processing (i.e., no additional modifications to color-management policies beyond the stated working spaces). The resulting PPAN images visually resemble true PAN data, but they obviously differ spectrally, as PPAN is synthesized from separate RGB bands rather than being captured by a single broadband panchromatic sensor covering the entire visible spectrum. Subsequently, histogram matching was applied between PPAN and MS orthophotomosaics to minimize radiometric differences.
 |
 |
|
(a) |
(b) |
 |
 |
|
(c) |
(d) |
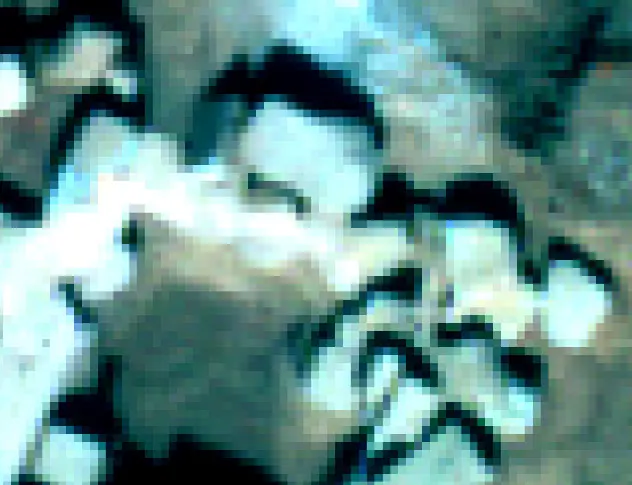
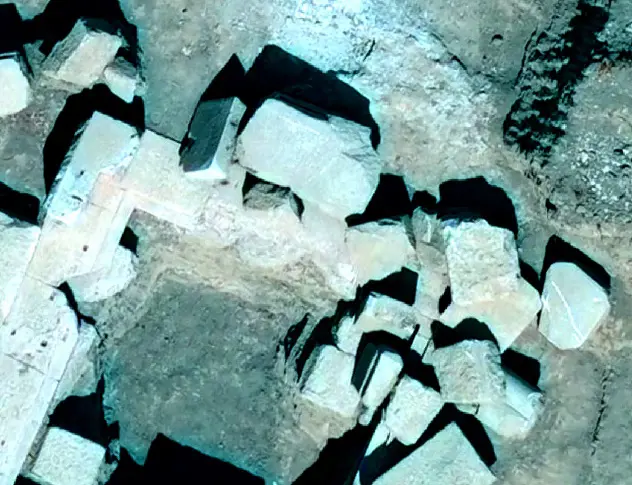
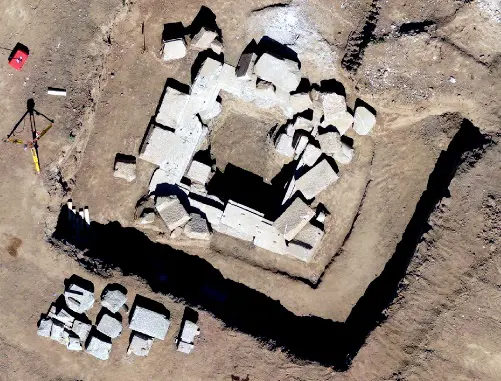
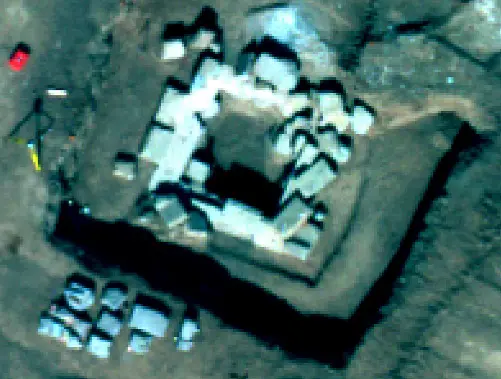
Figure 6. The orthophotomosaics of the Sanctuary of Eukleia; (a) RGB; (b) PPAN; (c) MS (bands Blue, Green, NIR); and (d) fused image (bands Blue, Green, NIR). Center of images 40°28′47.61″ N, 22°19′16.87″ E.
 |
 |
|
(a) |
(b) |
 |
 |
|
(c) |
(d) |
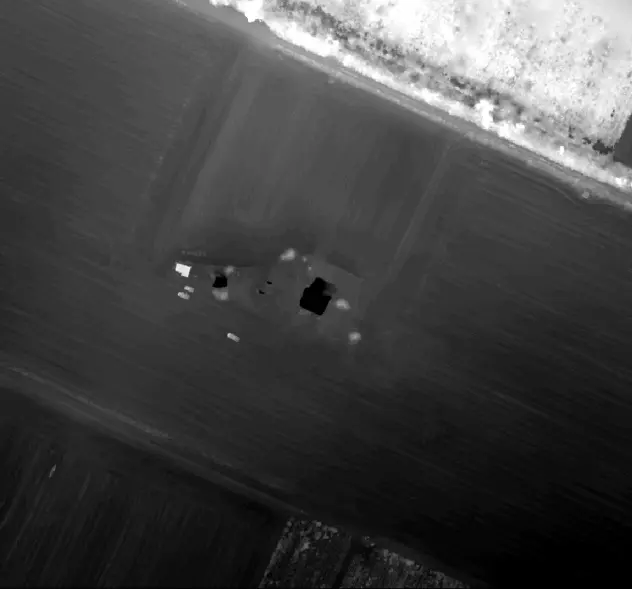
Figure 7. The orthophotomosaics of the funerary ensemble; (a) RGB; (b) PPAN; (c) MS (bands Blue, Green, NIR); and (d) fused image (bands Blue, Green, NIR). Center of images 41°2′4.58″ N, 24°12′51.37″ E. Compared to a true PAN band (acquired as a single broadband measurement with a known spectral response), PPAN synthesis may introduce radiometric biases because it is derived from the RGB channels and depends on the grayscale conversion/color-management settings. Consequently, PPAN is not guaranteed to be fully spectrally compatible with all MS bands, and component substitution (CS) fusion methods can be more sensitive to local radiometric inconsistencies between PPAN and MS data.
Image fusion methods are generally categorized into three groups, component substitution (CS), multiresolution analysis (MRA), and degradation model (DM) based approaches. CS techniques such as IHS, PCA, and the Gram–Schmidt transform [35,36] replace selected components of the transformed MS images with a histogram-matched PAN image before applying an inverse transform to produce the fused image. MRA methods [36,37,38] derive missing spatial information from the PAN image’s high-frequency details, following the ARSIS concept [39], using transforms such as wavelets or contourlets to inject spatial features. DM approaches [32,33,34] interpret MS and PAN data as degraded versions of an ideal high-resolution fused image and apply priors such as similarity, sparsity, and non-negativity to ensure stable and realistic fusion outcomes.
In addition, fusion quality is sensitive to temporal offsets between the RGB and MS acquisitions. Even short delays may introduce illumination and shadow differences between PPAN (derived from RGB) and the MS orthophotomosaics, which are not always fully compensated by histogram matching and may reduce spectral consistency in the fused product. This effect is consistent with our results, in which the dataset acquired with a minimal time gap exhibits higher MS–fused correlation than the dataset acquired with an approximately 45 min delay.
In this study, PCA was selected as the CS method for the following reasons. The primary aim is to enhance the spatial detail of the MS orthophotomosaics using the high-resolution PPAN, within a framework that requires a practical and repeatable implementation with a limited number of settings and stable behavior. In addition, PCA is computationally efficient and particularly suitable when the spectral bands are highly correlated (as is often the case in UAS MS data), because it concentrates most of the variance in the first principal component(s) and thereby facilitates the transfer of spatial information via the PPAN. Moreover, unlike more complex degradation-model (DM) approaches (which require extensive parameterization and strong assumptions about the degradation mechanism), PCA provides a transparent and straightforward procedure that can be readily replicated. PCA was also chosen because it enables clear and direct control of spectral consistency through band-wise correlations (correlation matrices) between the fused product and the original MS orthophotomosaic (in the same reference system and at the same scale), as a key quantitative criterion for spectral preservation. Finally, pilot tests were also conducted using alternative CS methods (IHS and Gram–Schmidt) as a consistency check, however, PCA showed the best balance between spatial-detail enhancement and spectral-information preservation for the two applications. At the same time, it is acknowledged that alternative approaches, such as MRA (e.g., wavelet-based) or DM/variational methods, can in some cases reduce spectral distortions or produce smoother spectral results, particularly when there is strong spectral incompatibility between PPAN and MS. Nevertheless, a systematic comparative evaluation of multiple fusion methods using common quality criteria/metrics is not an objective of the present work. It is planned as a subsequent step, especially under different illumination/shadow conditions and different time gaps between RGB and MS acquisitions.
In this paper, the PCA method (Table 4) was implemented using Erdas Imagine Professional 2023© v.16.8.1 (Hexagon AB, Stockholm, Sweden) to produce the final fused images (Figure 6 and Figure 7). PCA serves as a powerful statistical tool that isolates and combines the most significant components of the input datasets, effectively merging the spatial precision of the PPAN image with the spectral richness of the MS data.
Table 4. Fusion parameters and production of the fused MS image at PPAN spatial resolution.
|
Parameter |
Value/Description |
|---|---|
|
MS bands used |
5 (Blue, Green, Red, Red Edge, NIR) |
|
Components retained |
5 (all) |
|
Substitution strategy |
PC1 replaced by histogram-matched PPAN |
|
Histogram matching |
Yes (PPAN to MS) |
|
Normalization/centering |
Mean-centering: Yes |
|
Matrix used |
Covariance |
|
Scaling |
None |
|
Resampling (MS to PPAN grid) |
Bilinear |
|
Output bit-depth |
16-bit |
|
Masking |
None |
The fusion procedure was implemented as a structured component-substitution workflow applied to orthophotomosaics already co-registered in a common geodetic reference system (GGRS87/Greek Grid, EPSG:2100). The multispectral orthophotomosaic, consisting of five calibrated reflectance bands, was first resampled to the spatial grid of the PPAN image to ensure identical pixel alignment prior to transformation. Resampling was performed using bilinear interpolation as a compromise between radiometric preservation and spatial smoothness.
Principal Component Analysis was then computed from the multispectral dataset using a covariance-based transformation with mean centering enabled. This transformation concentrates the majority of spectral variance in the first principal component (PC1), which primarily represents scene brightness and large-scale spatial structure. Prior to substitution, histogram matching was applied between the PPAN image and the original PC1 component in order to minimize radiometric discontinuities that could otherwise propagate spectral distortions into the inverse transformation.
Following normalization, the histogram-matched PPAN image replaced PC1, while the remaining principal components (PC2–PC5) were retained unchanged. An inverse PCA transform was subsequently applied to reconstruct a fused five-band multispectral dataset at the spatial resolution of the PPAN image.
Because spatial misalignment between PPAN and multispectral data can introduce edge artifacts during component substitution, geometric consistency was verified prior to fusion. Both orthophotomosaics were derived from PPK-refined photogrammetric solutions within the same coordinate system, ensuring sub-pixel co-registration. Additional visual inspection of high-contrast linear features and monument edges confirmed the absence of systematic offsets before executing the substitution process. This step ensured that spatial detail injection originated from radiometrically compatible information rather than geometric discrepancies.
4. Results
4.1. Flight Planning and Acquisition of Images
The image acquisitions at the two archaeological sites were conducted at different times. The flights at the Sanctuary of Eukleia took place on 1 July 2025, from 9:00 to 10:00 in the morning [1], while those at the funerary ensemble were conducted on 16 September 2025, from 12:30 to 13:00 in the afternoon. At both sites, the RGB and MS sensors were used to collect images. With the RGB sensor, flights were conducted at an altitude of 60 m above ground, capturing images with a spatial resolution of 0.8 cm per pixel, whereas with the MS sensor, flights were conducted at an altitude of 100 m, yielding a spatial resolution of 6.8 cm per pixel. Flight planning for both sites was carried out with 70% forward and 80% side overlap. At the Sanctuary of Eukleia, the RGB sensor recorded 77 images, while at the funerary ensemble it recorded 390. Correspondingly, the MS sensor captured 20 and 121 images.
4.2. Georeferencing Accuracy
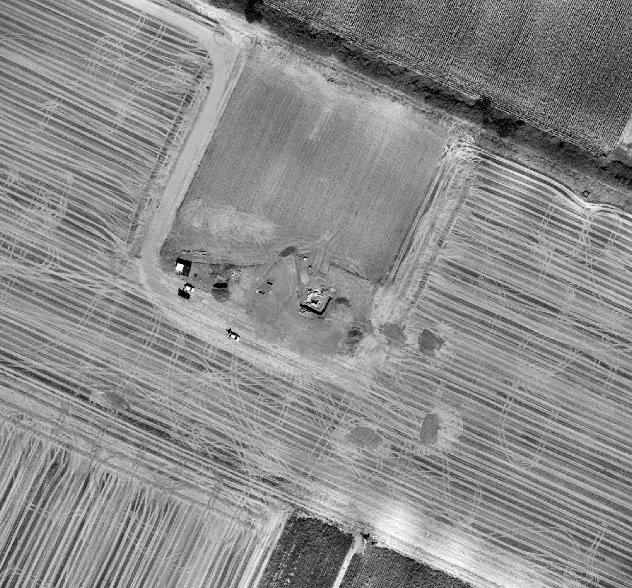
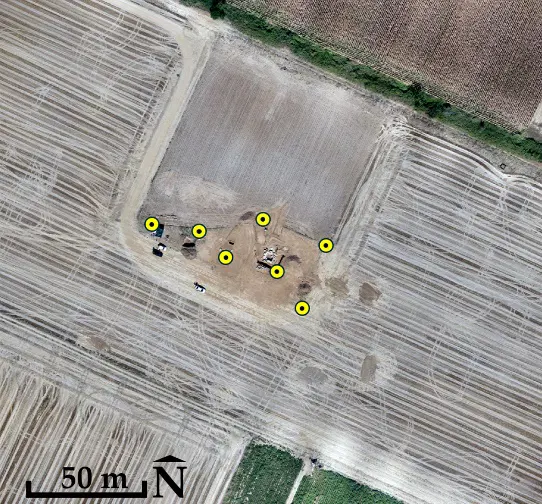
At each archaeological site, seven CPs (Figure 8) were measured using the GNSS receiver Topcon HiPer SR (Topcon Positioning Systems, Tokyo, Japan), within the Greek Geodetic Reference System 1987 (GGRS87/Greek Grid, EPSG:2100). The RTK method ensured a horizontal accuracy of approximately ±1.5 cm and a vertical accuracy of ±2 cm.
 |
 |
|
(a) |
(b) |
Figure 8. Locations of the check points (CPs) in yellow: (a) at the Sanctuary of Eukleia (center image 40°28′47.61″ N, 22°19′16.87″ E) and (b) at the funerary ensemble (center image 41°2′4.58″ N, 24°12′51.37″ E). The backgrounds consist of the generated orthophotomosaics from the UAS RGB images.
Before each flight, at both sites and for both sensors (RGB and MS), a base point (randomly selected) was established near the UAS take-off location. The X, Y, and Z coordinates of the base point were calculated via RTK with the same accuracy (±1.5 cm horizontally and ±2 cm vertically). Subsequently, static GNSS recording was carried out at the same base point for 30 min before take-off, throughout the entire flight, and for an additional 30 min after landing. By combining the high-precision coordinates of the base point, the static measurements, and the in-flight data from the UAS’s integrated multi-frequency PPK GNSS antenna, it was possible to refine the X, Y, and Z coordinates of the centers of each RGB and MS image. This processing was performed using the WingtraHub© v2.18.1 software (Wingtra AG, Zurich, Switzerland), resulting in a final accuracy of approximately ±2 cm horizontally and ±3 cm vertically for each image.
4.3. DSMs and Orthophotomosaics
The following figures and table present the final DSM and orthophotomosaic products together with their verified positional accuracy.
In both archaeological sites, the RGB-based DSMs and orthophotomosaics were evaluated using seven CPs per site (Table 5), even though the manufacturer recommends using only three CPs [27] for accuracy verification. It should be noted that the results in Table 5 are consistent with those obtained from extensive checks of planimetric and vertical accuracy conducted at other archaeological sites, where twenty CPs were used [24,25].
Table 5. Verification of DSMs and orthophotomosaics accuracy across both archaeological sites by comparing the field-measured coordinates of the seven CPs with their corresponding values in the products.
|
Sensor |
Mean Value (cm) |
Standard Deviation σ (cm) |
||||
|---|---|---|---|---|---|---|
|
X |
Y |
Z |
X |
Y |
Z |
|
|
RGB |
~1.5 |
~1.0 |
~2.5 |
±1 |
±1 |
±2 |
|
MS |
~3.0 |
~2.0 |
~8.0 |
±2 |
±1 |
±3 |
For ease of interpretation, the key output metrics are summarized here (Table 4 and Table 5). RGB products achieved orthophotomosaic resolution of ~0.8–0.9 cm/pixel and DSM resolution of ~1.5–1.8 cm/pixel, whereas MS products achieved ~7 cm/pixel orthophotomosaics and ~13.5 cm/pixel DSMs (Table 2). Accuracy verification against seven CPs per site indicates mean planimetric offsets of ~1–1.5 cm (RGB) and ~2–3 cm (MS), with vertical offsets of ~2.5 cm (RGB) and ~8 cm (MS) (Table 5).
4.4. Image Fusion and Spectral Preservation
The corresponding spectral correlation assessments are presented below (Table 6 and Table 7) and fused orthophotomosaics at the Figure 6 and Figure 7. To evaluate the quality of the fusion, correlation matrices were constructed to compare the original MS orthophotomosaics spectrally with the fused images (Table 6 and Table 7). The correlation coefficients should be 0.9 or higher, indicating that at least 90% of the spectral information in the MS images must be preserved [40,41].
Table 6. Correlation table for Sanctuary of Eukleia (italicized numbers indicate the elements of interest).
|
MS Orthophotomosaic |
Fused Image (FI) |
||||||||||
|---|---|---|---|---|---|---|---|---|---|---|---|
|
Bands |
|||||||||||
|
1 |
2 |
3 |
4 |
5 |
1 |
2 |
3 |
4 |
5 |
||
|
MS |
1 |
1 |
0.939 |
0.799 |
0.679 |
0.419 |
0.879 |
0.838 |
0.749 |
0.644 |
0.440 |
|
2 |
0.939 |
1 |
0.911 |
0.864 |
0.648 |
0.776 |
0.818 |
0.778 |
0.730 |
0.586 |
|
|
3 |
0.799 |
0.911 |
1 |
0.917 |
0.674 |
0.623 |
0.710 |
0.803 |
0.743 |
0.581 |
|
|
4 |
0.679 |
0.864 |
0.917 |
1 |
0.892 |
0.488 |
0.623 |
0.695 |
0.857 |
0.734 |
|
|
5 |
0.419 |
0.648 |
0.674 |
0.892 |
1 |
0.229 |
0.388 |
0.442 |
0.596 |
0.870 |
|
|
FI |
1 |
0.879 |
0.776 |
0.623 |
0.488 |
0.229 |
1 |
0.963 |
0.868 |
0.775 |
0.554 |
|
2 |
0.838 |
0.818 |
0.710 |
0.623 |
0.388 |
0.963 |
1 |
0.945 |
0.899 |
0.713 |
|
|
3 |
0.749 |
0.778 |
0.803 |
0.695 |
0.442 |
0.868 |
0.945 |
1 |
0.951 |
0.756 |
|
|
4 |
0.644 |
0.730 |
0.743 |
0.857 |
0.596 |
0.775 |
0.899 |
0.951 |
1 |
0.902 |
|
|
5 |
0.440 |
0.586 |
0.581 |
0.734 |
0.870 |
0.554 |
0.713 |
0.756 |
0.902 |
1 |
|
Table 7. Correlation table for funerary ensemble (italicized numbers indicate the elements of interest).
|
MS Orthophotomosaic |
Fused Image (FI) |
||||||||||
|---|---|---|---|---|---|---|---|---|---|---|---|
|
Bands |
|||||||||||
|
1 |
2 |
3 |
4 |
5 |
1 |
2 |
3 |
4 |
5 |
||
|
MS |
1 |
1 |
0.982 |
0.953 |
0.929 |
0.667 |
0.987 |
0.966 |
0.938 |
0.915 |
0.669 |
|
2 |
0.982 |
1 |
0.968 |
0.963 |
0.728 |
0.974 |
0.988 |
0.953 |
0.951 |
0.730 |
|
|
3 |
0.953 |
0.968 |
1 |
0.956 |
0.655 |
0.961 |
0.968 |
0.994 |
0.953 |
0.661 |
|
|
4 |
0.929 |
0.963 |
0.956 |
1 |
0.820 |
0.924 |
0.953 |
0.940 |
0.989 |
0.822 |
|
|
5 |
0.667 |
0.728 |
0.655 |
0.820 |
1 |
0.635 |
0.699 |
0.616 |
0.793 |
0.994 |
|
|
FI |
1 |
0.987 |
0.974 |
0.961 |
0.924 |
0.635 |
1 |
0.982 |
0.959 |
0.930 |
0.646 |
|
2 |
0.966 |
0.988 |
0.968 |
0.953 |
0.699 |
0.982 |
1 |
0.965 |
0.962 |
0.711 |
|
|
3 |
0.938 |
0.953 |
0.994 |
0.940 |
0.616 |
0.959 |
0.965 |
1 |
0.949 |
0.627 |
|
|
4 |
0.915 |
0.951 |
0.953 |
0.989 |
0.793 |
0.930 |
0.962 |
0.949 |
1 |
0.807 |
|
|
5 |
0.669 |
0.730 |
0.661 |
0.822 |
0.994 |
0.646 |
0.711 |
0.627 |
0.807 |
1 |
|
To complement correlation-based assessment, additional spectral similarity metrics were computed, including Spectral Angle Mapper (SAM) and Root Mean Square Error (RMSE). These metrics were selected to evaluate both spectral angular consistency (SAM) and absolute radiometric deviation (RMSE) between the original MS orthophotomosaics and the fused products. Mean SAM values remained below 3° for the funerary ensemble dataset and below 6° for the Sanctuary of Eukleia, while RMSE values were consistently low across all spectral bands. These complementary indicators confirm that spectral distortions introduced by fusion remain limited and validate the reliability of the fused products. Although additional indices such as ERGAS or spatial sharpness metrics can provide further insight, the present evaluation prioritizes metrics directly interpretable at the band level and consistent with reflectance-preservation objectives in archaeological documentation.
4.5. Archaeological Classification Test
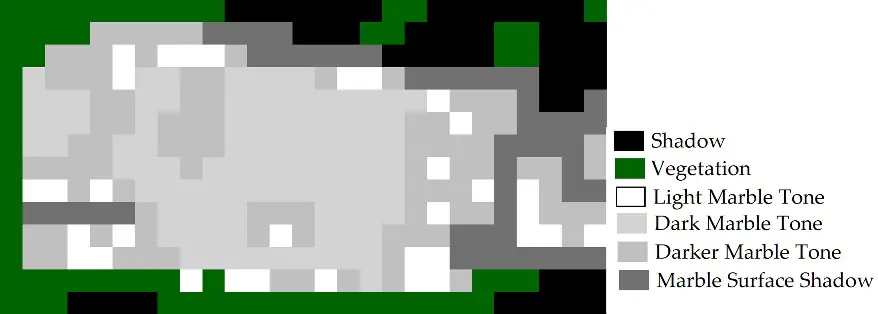
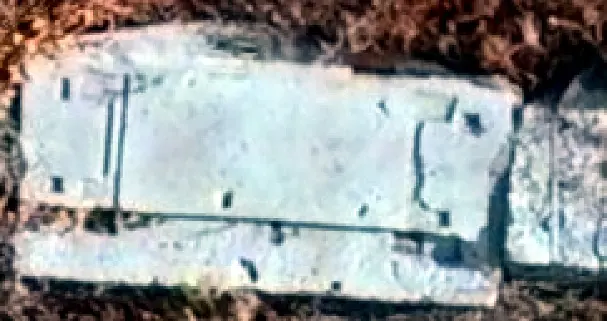
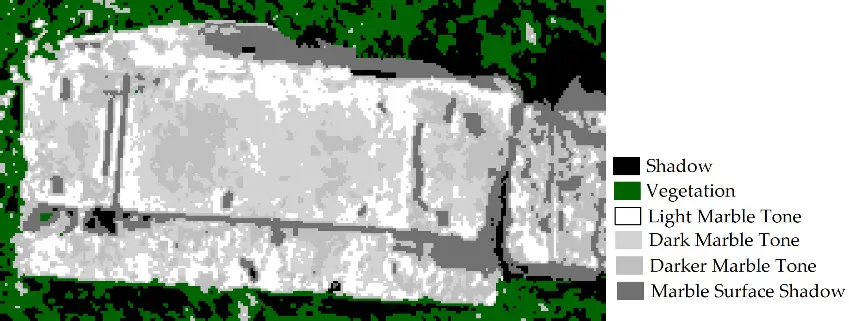
To provide more direct evidence that fusion improves archaeological interpretation beyond qualitative visual inspection and spectral preservation metrics, a classification test was performed in a small area at the Sanctuary of Eukleia. One representative region of interest was selected where marble and vegetation coexist and shows localized surface alteration consistent with pathology-related variability (e.g., moisture-related discoloration or micro-wear) (Figure 9). Identical class definitions and training samples were used to classify both the MS orthophotomosaic (7 cm) and the fused image (~1 cm) using a supervised Maximum Likelihood classifier. The overall classification accuracy was 90% (overall kappa statistics 0.886) for fused image and 56% (overall kappa statistics 0.542) for MS orthophotomosaic. The results show consistently higher classification performance for the fused product, indicating improved thematic separability when MS spectral information is combined with the finer spatial detail introduced by PPAN-based fusion. The interpretive value of the fused imagery extends beyond statistical classification performance. Visual inspection of the fused orthophotomosaics revealed improved delineation of construction materials, clearer separation between architectural elements and surrounding soil matrices, and enhanced visibility of small-scale surface modifications. Features such as clamp holes, tool marks, and localized discoloration patterns became more distinguishable after fusion due to the integration of high spatial detail with retained spectral variability. These improvements support more reliable archaeological reading of monument surfaces and facilitate the identification of material transitions and deterioration zones relevant to conservation assessment.
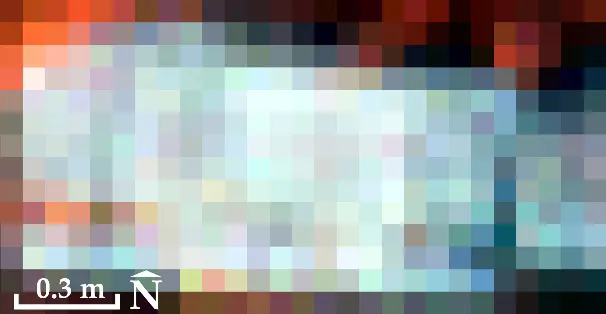 |
 |
|
(a) |
(b) |
 |
 |
|
(c) |
(d) |
Figure 9. (a) MS (bands Blue, Green, NIR), excerpt from the orthophotomosaic of the Sanctuary of Eukleia; (b) Classified image (from MS); (c) Fused image (bands Blue, Green, NIR); (d) Classified image (from fused image). Center of images 40°28′47.29″ N, 22°19′17.77″ E.
5. Discussion
5.1. Technical and Methodological Discussion
From the analysis of the results, it emerges that the UAS products of exceptional spatial accuracy are sufficient for applications within the field of Precision Archaeology. The flights with the RGB sensor produced orthophotomosaics and DSMs with planimetric accuracy of approximately 1.5 cm (with Standard Deviation σ ± 1 cm) along the x-axis, about 1 cm (with σ ± 1 cm) along the y-axis, and vertical accuracy of 2.5 cm (with σ ± 2 cm), values that are consistent with documentation scales required for high-detail archaeological sites. These findings are consistent with earlier research [24,25] and align closely with the accuracy standards reported by the UAS’s manufacturer [27]. The MS products, despite acceptable planimetric accuracy, approximately 3 cm (with σ ± 2 cm) along the x-axis and about 2 cm (with σ ± 1 cm) along the y-axis, exhibit larger vertical offsets, approximately 8 cm (with σ ± 3 cm), exceeding the expected vertical accuracy for ultra-high-precision documentation. However, the spectral information provided by the MS images, combined with the acceptable planimetric accuracy, can be decisive for the determining spectral differentiation of materials, the detection of morphological variations, moisture differences, and other details.
The application of PCA for image fusion significantly improved the spatial resolution of the MS data while simultaneously preserving the original spectral information in the fused images (Figure 10 and Figure 11). A remarkably high correlation, 99% on average, was observed between the MS orthophotomosaic and the fused image in the case of the funerary ensemble. In the case of the Sanctuary of Eukleia, the correlation is 85% on average, very close to the 90% threshold of spectral information that should be transferred to the fused image. This difference is likely due to the fact that the RGB and MS flights were conducted without any time gap in the funerary ensemble case, whereas in the Sanctuary of Eukleia case, they were conducted with a delay of approximately 45 min. The temporal offset between the flights in the latter case resulted in the recording of noticeable differences in object shadows in the RGB (and consequently PPAN) and MS images (Figure 12), which must have influenced, even slightly, the percentages of the original spectral information transferred to the fused image. The observed reduction in spectral correlation provides insight into the sensitivity of the fusion workflow to illumination variability and acquisition timing. While the fusion process remained operationally stable, radiometric inconsistencies introduced by shadow displacement and illumination changes propagated into the component substitution stage, slightly reducing spectral coherence. Nevertheless, even under a ~45 min acquisition offset, the fused products retained substantial spectral consistency (≈0.85 average correlation) while still benefiting from significant spatial-detail enhancement. These findings suggest that the workflow is moderately sensitive to illumination differences but remains functionally robust within typical field-acquisition intervals. In terms of comparative performance, the accuracy achieved by the proposed workflow is consistent with, and in some cases comparable to, results reported for UAS-based RGB–MS fusion using alternative component-substitution techniques. The high spectral correlation observed in the funerary ensemble dataset (≈0.99), together with the strong classification improvement obtained from the fused imagery, indicates that the PCA-based approach effectively preserves spectral relationships while enhancing spatial detail. Compared to other component-substitution methods such as IHS or Gram–Schmidt transforms, PCA concentrates multispectral variance into orthogonal components, enabling controlled spatial-detail injection with limited parameterization. Multiresolution approaches, including wavelet-based fusion, may reduce certain spectral distortions by injecting spatial frequencies rather than substituting components; however, they typically require more complex parameter tuning and may introduce spatial smoothing that is less suitable for centimeter-scale archaeological documentation. From a robustness perspective, the present results indicate that performance variability is driven primarily by acquisition conditions—particularly illumination consistency and temporal offsets—rather than by inherent instability of the PCA algorithm. Even under non-simultaneous acquisition conditions, substantial spectral preservation was maintained alongside significant spatial-resolution enhancement. This balance between accuracy, reproducibility, and operational stability supports the suitability of the proposed method for precision-scale archaeological applications. From an operational standpoint, minimizing RGB–MS acquisition gaps—ideally to near-simultaneous flights—improves spectral transfer performance, particularly in high-relief or shadow-prone archaeological environments.
A distinctive feature of the process is the use of the PPAN image derived from the RGB orthophotomosaic. This approach proved functional and efficient, as it provides PPAN information without the need for a dedicated PAN sensor. Although this choice lacks the spectral fidelity of a true PAN band, it enables the practical application of image fusion across a wide range of UAS equipped with similar sensors. From the perspective of Precision Archaeology, the consistency and repeatability of the experiments render the proposed approach part of an integrated documentation workflow and a means of bridging the gap between metric accuracy and the thematic information provided by UAS datasets.
Since 2020 [22,23,24,25], UAS–based RGB–MS fusion has been increasingly explored as a practical way to mitigate the spatial–spectral trade-off in archaeological remote sensing. However, establishing robust scientific evidence for such workflows requires multiple experimental applications across different contexts, because fusion performance can vary with acquisition conditions and scene characteristics. In this regard, beyond the site-specific findings, the main contribution of this study is to strengthen the empirical validation of a reproducible, accurately aware UAS workflow by adding two further archaeological applications. The workflow integrates PPK-based camera geotag refinement using a local base and static logging, standardized processing in a common reference system to produce metrically consistent DSMs and orthophotomosaics, PPAN generation and PCA-based fusion to transfer RGB spatial detail to MS products, and quantitative verification of fusion outcomes via spectral-consistency metrics (band-wise correlations). Importantly, applying the same settings and logic across these two additional sites reinforces repeatability and clarifies practical factors affecting fusion quality (e.g., illumination/shadow differences driven by temporal offsets between RGB and MS acquisitions).
By examining datasets acquired both with minimal temporal offset and with a measurable delay (~45 min), the study demonstrates how illumination variability and shadow displacement propagate through the fusion process and affect spectral transfer. This comparative experimental framing enables a more realistic assessment of robustness, reflecting operational field constraints rather than controlled acquisition scenarios. The results indicate that while spectral correlation is moderately reduced under delayed acquisition, the workflow maintains substantial spectral preservation and spatial enhancement, thereby confirming functional robustness. In this respect, the proposed approach advances beyond purely methodological fusion implementations by integrating accuracy control, acquisition-condition sensitivity analysis, and application-scale validation within a unified operational framework.
 |
 |
|
(a) |
(b) |
 |
 |
|
(c) |
(d) |
Figure 10. Excerpts from the orthophotomosaics of the Sanctuary of Eukleia: (a) RGB; (b) PPAN; (c) MS (bands Blue, Green, NIR); and (d) fused image (bands Blue, Green, NIR). Center of images 40°28′48.11″ N, 22°19′16.20″ E.
 |
 |
|
(a) |
(b) |
 |
 |
|
(c) |
(d) |
 |
 |
|
(e) |
(f) |
 |
 |
|
(g) |
(h) |
Figure 11. Excerpts from the orthophotomosaics of the funerary ensemble; (a,e) RGB; (b,f) PPAN; (c,g) MS (bands Blue, Green, NIR); (d,h) fused image (bands Blue, Green, NIR). Center of images (a–d) 41°2′4.59″ N, 24°12′50.95″ E and (e–h) 41°2′4.46″ N, 24°12′51.50″ E. In (a) through (d), the two cist graves are shown on the left side, located a few centimeters below the ground surface, while on the right side, the Macedonian tomb is depicted, situated at a depth of 1.8 m below the ground surface. In (e) through (h), a section of the Macedonian tomb is shown to illustrate the spatial improvement of the MS information.
 |
 |
|
(a) |
(b) |
 |
 |
|
(c) |
(d) |
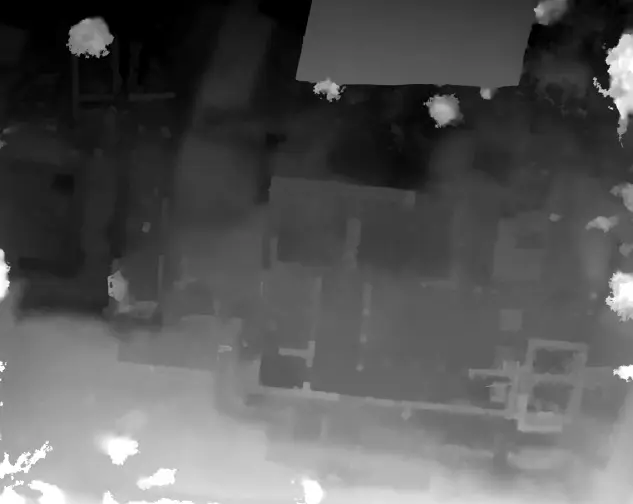
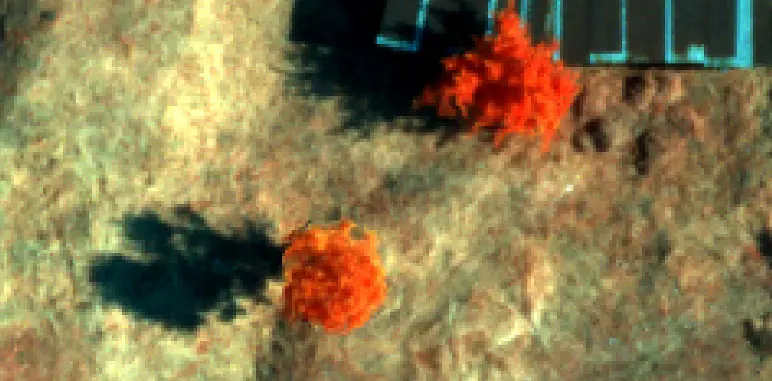
Figure 12. (a,b) RGB; (c,d) MS (bands Blue, Green, NIR); (a,c) Excerpts from the orthophotomosaics of the Sanctuary of Eukleia. The differences in the shadows in the RGB and MS images are clearly visible; (b,d) Excerpts from the orthophotomosaics of the funerary ensemble. The differences in the shadows in the corresponding images are minimal.
5.2. Satellite Remote Sensing Contextual Analysis
Satellite remote sensing archaeology is discussed here primarily to contextualize the broader methodological applicability of multi-scale remote sensing integration, rather than to reiterate site-specific descriptive results.
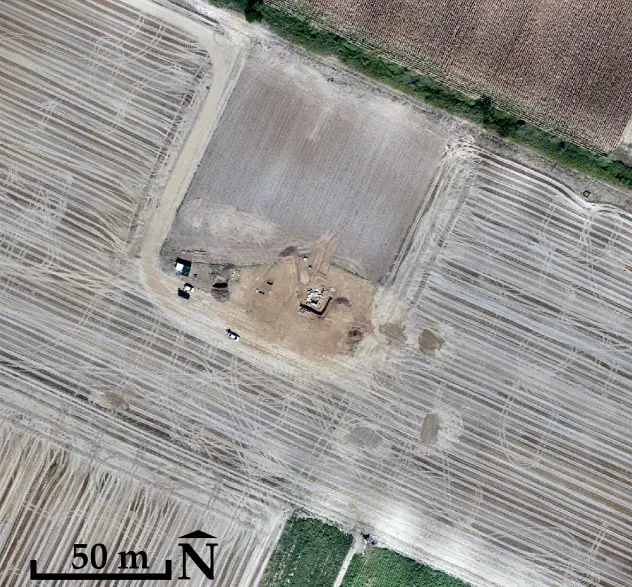
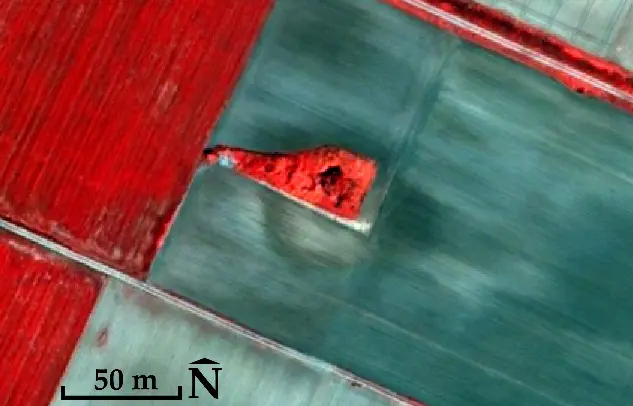
While satellite remote sensing archaeology [5] is widely used in archaeological applications, the limited spatial resolution of satellite data is insufficient for the needs of Precision Archaeology, which requires ultra-high spatial resolution capable of capturing variations at the scale of a few centimeters. Even very-high spatial resolution satellites such as WorldView-3 or Pléiades-1A/1B (with spatial resolution from 0.3 to 0.5 m) are unable to record with the necessary accuracy the detailed morphological characteristics, cracks, surface texture, geometry, and minor alterations of archaeological remains. Nevertheless, at this point a reference is made to satellite remote sensing archaeology not as a tool of Precision Archaeology, but for the detection of the lost boundaries of the artificial hill that once covered the funerary ensemble in the Philippi plain. This is valuable for the Ephorate of Antiquities of Drama, as the final proposal for the presentation of the funerary ensemble will also include an approximate reconstruction of the hill’s height and volume, using a lightweight structure made of natural materials, allowing visitors to recognize its original form.
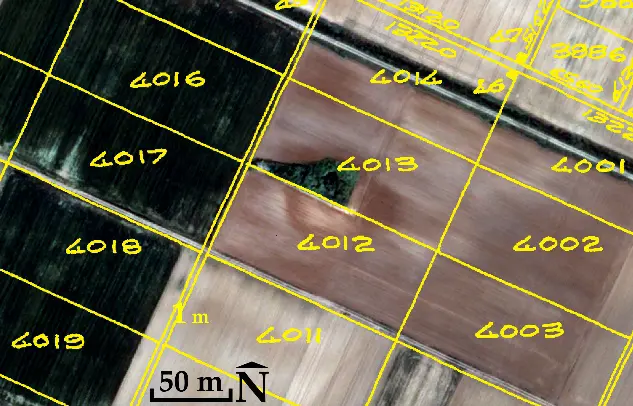
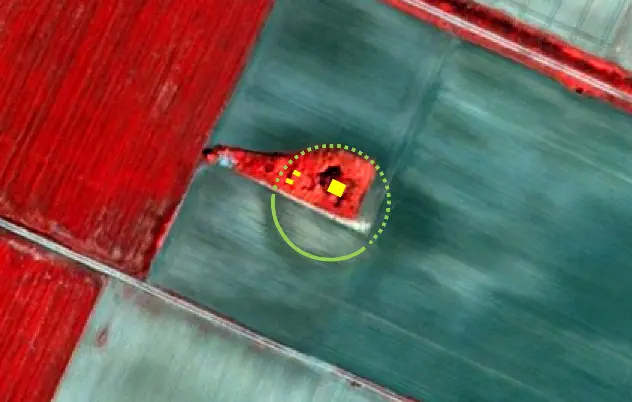
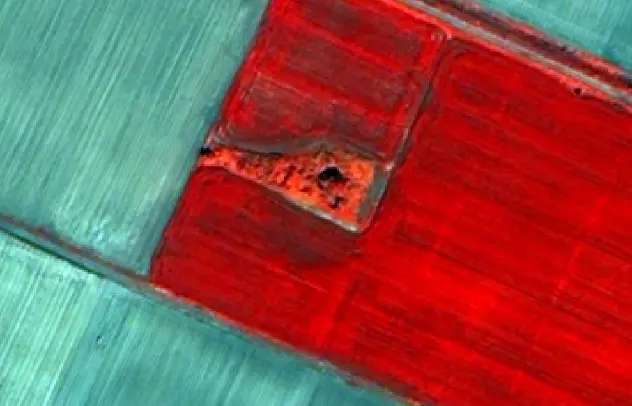
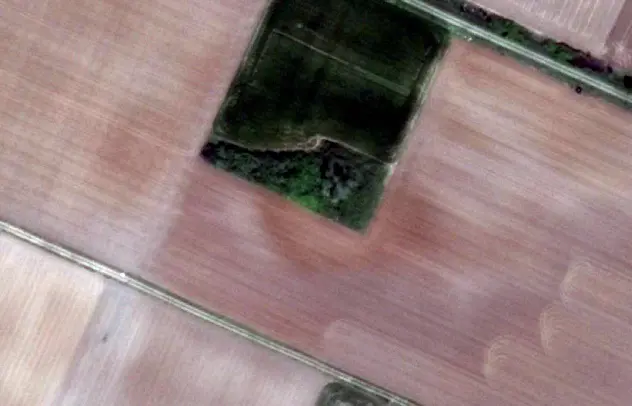
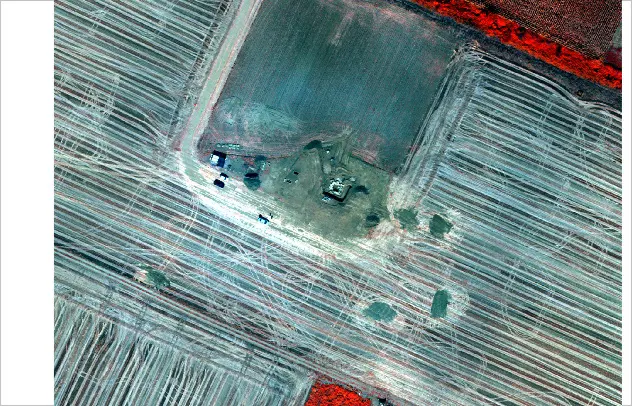
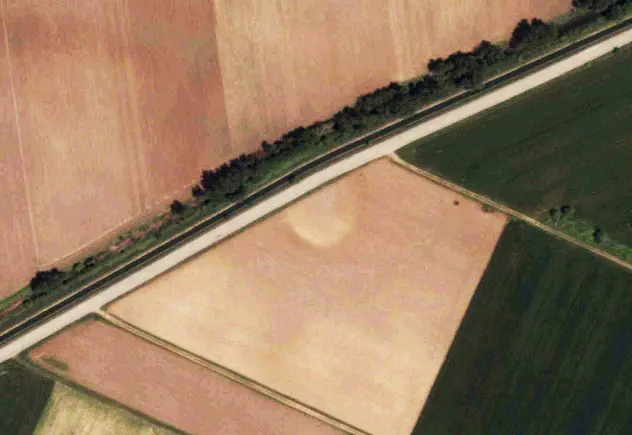
In antiquity, the funerary ensemble was constructed within an artificial hill, which covered and protected it. Today, the location and the wider area of the funerary ensemble are cultivated, and the ground is levelled, without any topographic variations (Figure 3). In the 1930s, the Philippi plain was reshaped to become fully arable. According to the 1929 land-parcel distribution map of the Greek Ministry of Agriculture [42] (Figure 13), the delimitation of the parcels and the levelling works, which continued until the 1990s with subsequent land-parcel distributions, eliminated all natural and artificial surface irregularities, including the artificial hills that concealed unknown cultural monuments within them. In the QuickBird-2 satellite images of 2003 and 2004 [42], as well as in a Google Earth Pro© v.7.3.6.10441 (Google LLC, Mountain View, CA, USA) image from 2011 (Figure 13), the mark of the hill boundary can be identified. It appears as a light-toned mark surrounded by a darker-toned mark. This suggests the presence of compact material (the base of the artificial hill), which retains moisture along its perimeter. The diameter of the mark, part of which corresponds to the circle, is approximately 50 m.
 |
 |
|
(a) |
(b) |
 |
 |
|
(c) |
(d) |
 |
 |
|
(e) |
(f) |
Figure 13. (a) The 1929 land-parcel distribution is shown in yellow (background: the 2003 QuickBird-2 satellite image [42], bands Blue, Green, Red). Property 4013 includes the funerary ensemble; (b) 2003 QuickBird-2 satellite image [42], bands Blue, Green, NIR. Observation of a portion of the circular mark in the image; (c) Delineation of the possible boundaries of the circular mark, approximately 50 m in diameter, shown in green, and the locations of the two cist graves and the Macedonian tomb shown in yellow; (d) 2004 QuickBird-2 satellite image [42], bands Blue, Green, NIR. The mark appears with lower visual intensity; (e) Google Earth Pro image from 2011 (Map Data: Google Earth, image Landsat/Copernicus, image ©2025, Maxar Technologies) in which the portion of the circular mark reappears; (f) The MS orthophotomosaic from UAS (bands Blue, Green, NIR). Center of images 41°2′4.16″ N, 24°12′51.00″ E.
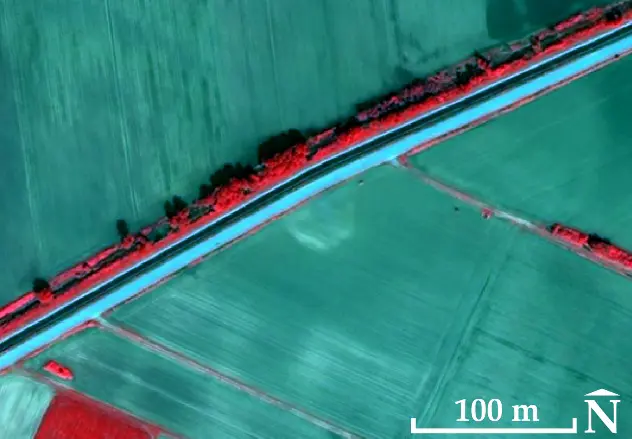
At a short distance (approximately 1200 m) northeast of the funerary ensemble, a similar observation of a circular mark with a diameter of approximately 40 m was made in the 2004 QuickBird-2 satellite image [42] and in the Google Earth Pro© v.7.3.6.10441 (Google LLC, Mountain View, CA, USA) 2011 image (Figure 14). At this location, the exploratory excavation trenches carried out by the Ephorate of Antiquities of Drama in February 2024 revealed the leveling of the hill, with traces of diachronic habitation from various periods (from the Neolithic up to the Roman period, Figure 15).
 |
 |
|
(a) |
(b) |
Figure 14. (a) Light-toned circular mark with a diameter of approximately 40 m in the 2004 QuickBird-2 satellite image [42], bands Blue, Green, NIR; (b) Appearance of the mark also in Google Earth Pro from 2011 (Map Data: Google Earth, image Landsat/Copernicus, image ©2025, Maxar Technologies). Center of images 41°2′25.22″ N, 24°13′38.56″ E.
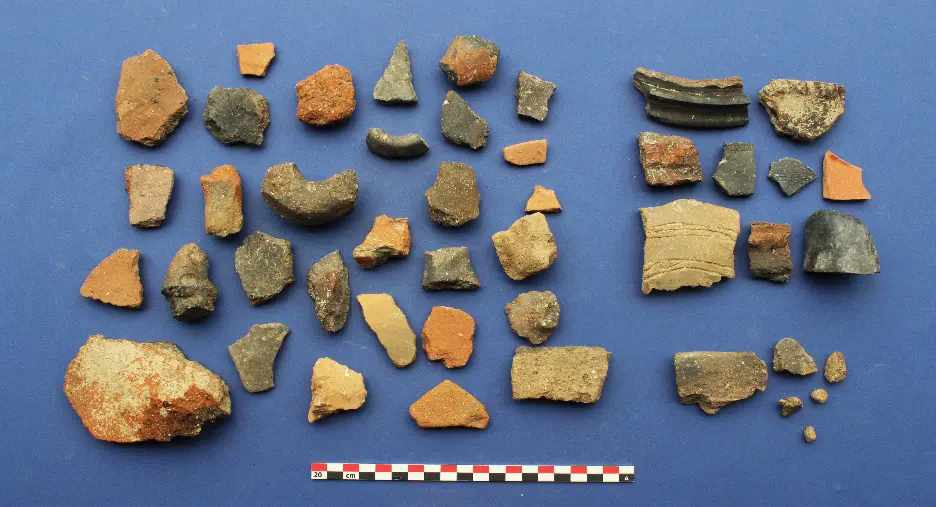
Figure 15. The pottery collected during the exploration trenches of the circular mark, approximately 1200 m northeast of the funerary ensemble (Ephorate of Antiquities of Drama©).
Overall, this case illustrates how UAS-based high-resolution fusion products can be strategically integrated with satellite-scale observations to support multi-scale archaeological interpretation and landscape reconstruction.
5.3. Archaeological Interpretation of the Fused Imagery
The interpretation of the fused images extends beyond their technological functionality and highlights the contribution of UAS-based image fusion to the understanding, documentation, and management of archaeological remains within the framework of cultural heritage. This subsection interprets the quantitative results presented in Section 4 (spectral preservation metrics and classification accuracy), while the methodological implementation of the workflow is fully described in Section 3. The improved spatial resolution and valuable spectral information allow for a more detailed and reliable reading of monument surfaces, both in terms of material composition and in the form and extent of their deterioration.
Specifically, in the monuments examined in this paper, the fused images compared with the MS images, demonstrate a clearer distinction between different construction materials, such as marble, rough or hewn stone, as well as a more pronounced separation between architectural elements and the ground (Figure 10c,d and Figure 11g,h). The boundaries of each construction material are distinctly visible in the fused images. Alterations also appear more clearly, such as engravings on the construction material (e.g., marble or hewn stone) and small functional interventions, such as for example clamp holes (Figure 11g,h). These variations are not evident in the original MS images. In practical terms, this improvement supports more reliable delineation of material boundaries and better localization of small-scale surface changes relevant to pathology mapping. In the case of fused images, the aforementioned observations can be automatically derived through classification [22,23]. A major advantage of classification is the automated detection of similar characteristics across the entire monument, including those not initially observed in the images. In this way, enhanced imaging can support the automated identification of micromorphological anomalies, such as cracks, surface wear, moisture, etc. Moisture in particular, which is difficult to discern in RGB images, becomes more perceptible in fused images due to their spectral information, providing valuable insights into the conservation state of the monuments and the dynamic progression of their deterioration.
This pilot experiment is not intended as a comprehensive benchmark of classifiers or fusion methods. Rather, it provides targeted evidence, at representative location, that the fused orthophotomosaic enhances the interpretive and mapping potential of UAS multispectral data at the scale relevant to monument documentation and conservation.
Moreover, the use of fused orthophotomosaics will facilitate the mapping of pathology and the delineation of areas at increased risk of deterioration, strengthening decision-making processes for prioritizing conservation interventions. In this respect, fused images function as a support tool for preventive conservation strategies and long-term cultural heritage management planning.
Finally, the interpretation of fused images adds value by contributing to archaeological documentation by identifying characteristic differences, such as construction materials or the boundaries of built features, that relate to earlier phases of site use. Thus, digital methods are not limited to metric documentation alone but actively support the understanding and interpretation of archaeological remains.
Beyond the specific monuments examined, these findings suggest that RGB–MS fusion can systematically enhance material discrimination and pathology mapping in comparable archaeological contexts requiring centimeter-scale documentation.
5.4. Limitations and Practical Recommendations
While the results from the two new applications indicate that the proposed workflow is functional and useful for Precision Archaeology, there are specific limitations that should be taken into account. The discussion below refers exclusively to performance limitations observed in the experimental results and does not introduce new methodological procedures, which are presented in Section 3.
First, the preservation of spectral information in the fused products is affected by illumination and shadow inconsistencies when the RGB and MS acquisitions are not temporally simultaneous. This effect is particularly evident when the time difference between the two flights leads to changes in shadowing, introducing local radiometric differences that are not fully compensated for by histogram matching. In the case of the Sanctuary of Eukleia, the mean band-wise correlation between the original MS orthophotomosaic and the fused product is lower (≈85%) than the 0.90 reference threshold, which is consistent with the time gap (~45 min) between the RGB and MS flights and the corresponding shadow/illumination differences between PPAN and the MS orthophotomosaics. Given that CS methods such as PCA are sensitive to such radiometric inconsistencies and that shadowed areas disproportionately influence correlations, minimizing the time gap between RGB–MS acquisitions is recommended. At the same time, a broader evaluation using additional quality metrics (e.g., ERGAS and spatial indicators) under different illumination conditions is planned for future work.
Second, the PPAN image is a surrogate for a true PAN band and may therefore introduce biases for surfaces/materials with different spectral behavior in the visible range. In addition, PPAN is produced via Mode/Grayscale and is the outcome of a color-managed conversion, not an independent measurement from a PAN sensor. This introduces two main limitations, the result depends on the active RGB/Gray profiles and colour-management settings (therefore explicit documentation is required to ensure reproducibility), and PPAN does not have a single, known spectral response like a true PAN band, consequently, it may create spectral incompatibility in the fusion process, particularly when illumination/shadow conditions differ between the RGB and MS acquisitions.
The use of PPAN generated through RGB grayscale conversion may introduce band-dependent weighting effects, as the grayscale transformation does not replicate the spectral response of a true broadband PAN sensor. This can lead to localized spectral distortions, particularly in surfaces exhibiting strong reflectance variation within the visible range. However, the low SAM and RMSE values observed in the present study indicate that such distortions remain limited under the tested acquisition conditions. Alternative PPAN generation strategies (e.g., weighted RGB combinations optimized to approximate multispectral responses) could reduce radiometric bias, though their effectiveness would depend on scene-specific spectral characteristics. Similarly, non–component substitution (CS) fusion approaches, such as multiresolution analysis (MRA) or degradation-model (DM) methods, may mitigate certain spectral distortions by injecting spatial frequencies rather than replacing principal components. These approaches can improve spectral fidelity when PPAN–MS incompatibility is strong, but they introduce additional parameterization and computational complexity. Within the scope of this study, the PCA-based CS implementation provided a transparent and reproducible balance between spatial enhancement and spectral preservation, while maintaining robustness under moderate illumination variability. A systematic cross-method benchmarking remains a subject for future investigation
Third, PCA, as a CS method, can introduce spectral distortions when the PPAN information is not spectrally compatible with the MS bands.
Finally, the MS-derived DSMs exhibited lower vertical accuracy compared with the RGB products, which limits their use in applications where high-accuracy elevation documentation is a priority.
From a practical perspective, the reliability of the fused products can be evaluated using quantitative thresholds derived from the present experiments. When the mean band-wise correlation between the original MS orthophotomosaic and the fused image remains ≥0.90, spectral transfer can be considered highly reliable for material discrimination and classification purposes. Values between 0.85 and 0.90, as observed in the Sanctuary of Eukleia dataset under a ~45 min acquisition delay, indicate moderate radiometric sensitivity but remain suitable for interpretive and classification tasks, provided illumination differences are limited and complementary metrics (e.g., SAM, RMSE) confirm low angular and radiometric deviation. However, correlation values significantly below ~0.85, especially when accompanied by elevated SAM or visible shadow-induced inconsistencies, should be treated with caution, as they may indicate PPAN–MS incompatibility or strong illumination bias. Under such conditions, near-simultaneous acquisition or alternative fusion strategies are recommended. When RGB–MS acquisitions are conducted under comparable illumination conditions and with minimal temporal offset, the workflow demonstrates stable and reproducible performance across different archaeological contexts.
Regarding generalizability, the proposed RGB–MS fusion workflow can be transferred to other archaeological contexts provided that three minimum acquisition constraints are satisfied (i) consistent radiometric calibration of multispectral data (e.g., use of reflectance panels); (ii) centimeter-level geometric co-registration between RGB and MS orthophotomosaics (preferably via PPK or equivalent direct georeferencing); and (iii) limited illumination variation between acquisitions. Based on the present experiments, near-simultaneous RGB–MS acquisition (ideally within 10–15 min under stable solar elevation) is recommended to minimize shadow displacement. Time gaps approaching ~45 min remain operationally acceptable but may reduce spectral correlation to approximately 0.85 in areas with pronounced relief or sharp architectural edges. Larger temporal offsets, rapidly changing cloud cover, or strong anisotropic shadow effects may introduce radiometric inconsistencies that exceed the tolerance of component-substitution methods [43]. With respect to sensor configurations, the workflow is applicable to other UAS platforms provided that (i) RGB imagery achieves substantially higher spatial resolution than MS imagery; (ii) spectral bands are radiometrically calibrated; and (iii) acquisition geometry ensures sub-pixel co-registration. Differences in spectral response functions between sensors may influence PPAN–MS compatibility, therefore, threshold validation using correlation and angular metrics is recommended for each new configuration.
6. Conclusions
This study further validates a reproducible RGB–MS fusion workflow for Precision Archaeology by applying it to two additional archaeological contexts. The integration of PPK-based direct georeferencing, PPAN-assisted PCA fusion, and quantitative spectral-consistency assessment provides a coherent and accuracy-aware protocol for combining centimeter-level spatial detail with multispectral thematic information.
The results confirm that when RGB and MS acquisitions are geometrically consistent and radiometrically comparable, PCA-based fusion effectively enhances spatial resolution while preserving spectral relationships at levels suitable for classification and material discrimination. Spectral transfer remains highly reliable (≥0.90 mean correlation) under near-simultaneous acquisition, while moderate temporal offsets may reduce correlation without compromising interpretive usability when complementary metrics confirm limited angular and radiometric deviation.
The workflow demonstrates operational robustness across monument-scale archaeological settings, provided that three conditions are respected: radiometric calibration of MS data, sub-pixel RGB–MS co-registration, and controlled illumination variability between acquisitions. Under these constraints, the method offers a practical balance between spatial enhancement, spectral fidelity, reproducibility, and field applicability.
Beyond the specific case studies, the proposed approach contributes a transferable methodological framework for integrating high-resolution RGB mapping with multispectral analysis in heritage documentation. By defining quantitative reliability thresholds and acquisition constraints, the study advances RGB–MS fusion from experimental application toward a controlled and generalizable protocol for conservation-oriented archaeological remote sensing.
Acknowledgments
Sincere thanks are extended to A. Kyriakou, Director of the University Excavation of the Aristotle University of Thessaloniki in Aigai, Greece, for granting permission to collect data at the archaeological site of the Sanctuary of Eukleia. Warm thanks are also extended to V. Poulioudi, Head of the Ephorate of Antiquities of Drama, and to M. Sofronidou, archaeologist of the Ephorate of Antiquities of Drama, for granting permission to collect data at the funerary ensemble.
Ethics Statement
Not applicable.
Informed Consent Statement
Not applicable.
Data Availability Statement
No original images or raw data will be made available on the locations, as they concern archaeological sites.
Funding
This research received no external funding.
Declaration of Competing Interest
The author declares no conflicts of interest.
References
- Kaimaris D. Assessment of the Planimetric and Vertical Accuracy of UAS-LiDAR DSM in Archaeological Site. Geomatics 2025, 5, 61. DOI:10.3390/geomatics5040061 [Google Scholar]
- Aasen H, Honkavaara E, Lucieer A, Zarco-Tejada PJ. Quantitative Remote Sensing at Ultra-High Resolution with UAV Spectroscopy: A Review of Sensor Technology, Measurement Procedures, and Data Correction Workflows. Remote Sens. 2018, 10, 1091. DOI:10.3390/rs10071091 [Google Scholar]
- Sun Z, Wang X, Wang Z, Yang L, Xie Y, Huang Y. UAVs as remote sensing platforms in plant ecology: Review of applications and challenges. J. Plant Ecol. 2021, 14, 1003–1023. DOI:10.1093/jpe/rtab089 [Google Scholar]
- Lu B, He Y. Optimal spatial resolution of Unmanned Aerial Vehicle (UAV)-acquired imagery for species classification in a heterogeneous grassland ecosystem. GIScience Remote Sens. 2017, 55, 205–220. DOI:10.1080/15481603.2017.1408930 [Google Scholar]
- Kaimaris D. Aerial Remote Sensing Archaeology—A Short Review and Applications. Land 2024, 13, 997. DOI:10.3390/land13070997 [Google Scholar]
- Klehm C, Williamson DM, Bement CL, Bethke B. Remote, Rugged Field Scenarios for Archaeology and the Field Sciences: Object Avoidance and 3D Flight Planning with sUAS Photogrammetry. Remote Sens. 2024, 16, 1418. DOI:10.3390/rs16081418 [Google Scholar]
- Lee J, Sanjmyatav B, Kang IU, Go A, Diimaajav E, Baatar G, et al. UAV-Based Remote Sensing, GIS, and Its Application in Archaeology: A Case Study of the Xiongnu Elite Burial Complex at Gol Mod-II, Mongolia. In Proceedings of the ISPRS Annals of the Photogrammetry, Remote Sensing and Spatial Information Sciences, Volume X-M-2-2025, 30th CIPA Symposium Heritage Conservation from Bits: From Digital Documentation to Data-driven Heritage Conservation, Seoul, Republic of Korea, 25–29 August 2025. [Google Scholar]
- Adamopoulos E, Rinaudo F. UAS-Based Archaeological Remote Sensing: Review, Meta-Analysis and State-of-the-Art. Drones 2020, 4, 46. DOI:10.3390/drones4030046 [Google Scholar]
- Macchiarella ND, Adkins KA. Application of UAS Remote Sensing for Cultural Heritage Preservation and Archaeology. In Proceedings of the 2022 Tularosa Basin Conference Considering 10,000 years of Human Presence within Southern New Mexico from Late Paleo to Late Historic, Ruidoso, NM, USA, 7–9 July 2022. [Google Scholar]
- Fallavollita P, Balsi M, Esposito S, Melis MG, Milanese M, Zappino L. UAS for Archaeology—New Perspectives on Aerial Documentation. In Proceedings of the International Archives of the Photogrammetry, Remote Sensing and Spatial Information Sciences, Volume XL-1/W2, 2013 UAV-g2013, Rostock, Germany, 4–6 September 2013. [Google Scholar]
- Costantino D, Rossi G, Pepe M, Leserri M. Experiences of TLS, terrestrial and UAV photogrammetry in Cultural Heritage environment for restoration and maintenance purposes of Royal Racconigi castle, Italy. In Proceedings of the 2022 IMEKO TC-4 Metrology for Archaeology and Cultural Heritage, Rende, Italy, 19–21 October 2022. [Google Scholar]
- Bakirman T, Bayram B, Akpinar B, Karabulut MF, Bayrak OC, Yigitoglu A, et al. Implementation of ultra-light UAV systems for cultural heritage documentation. In Proceedings of the International Archives of the Photogrammetry, Remote Sensing and Spatial Information Sciences, Volume XLVI-2/W1-2022, 9th Workshop 3D-ARCH 3D Virtual Reconstruction and Visualization of Complex Architectures, Mantua, Italy, 2–4 March 2022. [Google Scholar]
- Vacatello F, Roccella S, Vannini A. UAVIMALS: The “Open” Remote Sensing System for Surface Archaeological Investigations. In Proceedings of the International Archives of the Photogrammetry, Remote Sensing and Spatial Information Sciences, Volume XLVIII-4/W7-2023, FOSS4G (Free and Open Source Software for Geospatial) 2023–Academic Track, Prizren, Kosovo, 26 June–2 July 2023. [Google Scholar]
- Calantropio A, Chiabrando F, Auriemma R. Photogrammetric underwater and UAS surveys of archaeological sites: The case study of the Roman shipwreck of Torre Santa Sabina. In Proceedings of the XXIV ISPRS Congress, Nice, France, 6–11 June 2021. [Google Scholar]
- Mouget A, Lucet G. Photogrammetric Archaeological Survey with UAV. In Proceedings of the ISPRS Annals of the Photogrammetry, Remote Sensing and Spatial Information Sciences, Volume II-5, 2014, ISPRS Technical Commission V Symposium, Riva del Garda, Italy, 23–25 June 2014. [Google Scholar]
- Özyesil O, Voroninski V, Basri R, Singer A. A Survey of Structure from Motion. Acta Numer. 2017, 26, 305–364. DOI:10.1017/S096249291700006X [Google Scholar]
- Abate N, Roubis D, Aggeli A, Sileo M, Amodio MA, Vitale V, et al. An Open-Source Machine Learning–Based Methodological Approach for Processing High-Resolution UAS LiDAR Data in Archaeological Contexts: A Case Study from Epirus, Greece. J. Archaeol. Method Theory 2025, 32, 38. DOI:10.1007/s10816-025-09706-8 [Google Scholar]
- Rodríguez-Bulnes J, Benavides López AJ, Pellitero RP, Martín Civantos MJ, Collazo RJ. The documentation of archaeological heritage through aerial photogrammetry and UAS-based LiDAR: The case study of the Espique valley (La Peza, Granada, Spain). Disegnarecon 2022, 15, 121–130. DOI:10.20365/disegnarecon.29.2022.12 [Google Scholar]
- Linck R, Stele A, Gericke T. Comparison of GPR results with UAV photogrammetry at a Roman villa rustica in Noricum. In Proceedings of the 15th International Conference on Archaeological Prospection, Kiel, Germany, 28 March–1 April 2023. [Google Scholar]
- Abate N, Frisetti A, Marazzi F, Masini N, Lasaponara R. Multitemporal–Multispectral UAS Surveys for Archaeological Research: The Case Study of San Vincenzo Al Volturno (Molise, Italy). Remote Sens. 2021, 13, 2719. DOI:10.3390/rs13142719 [Google Scholar]
- Czajlik Z, Árvai M, Mészáros J, Nagy B, Rupnik L, Pásztor L. Cropmarks in Aerial Archaeology: New Lessons from an Old Story. Remote Sens. 2021, 13, 1126. DOI:10.3390/rs13061126 [Google Scholar]
- Kaimaris D, Kandylas A. Small Multispectral UAV Sensor and Its Image Fusion Capability in Cultural Heritage Applications. Heritage 2020, 3, 1046–1062. DOI:10.3390/heritage3040057 [Google Scholar]
- Kaimaris D. Image Fusion Capability from Different Cameras for UAV in Cultural Heritage Applications. Drones Auton. Veh. 2024, 1, 10002. DOI:10.35534/dav.2023.10002 [Google Scholar]
- Kaimaris D. Measurement Accuracy and Improvement of Thematic Information from Unmanned Aerial System Sensor Products in Cultural Heritage Applications. J. Imaging 2024, 10, 34. DOI:10.3390/jimaging10020034 [Google Scholar]
- Kaimaris D, Kalyva D. Aerial Remote Sensing and Urban Planning Study of Ancient Hippodamian System. Urban Sci. 2025, 9, 183. DOI:10.3390/urbansci9060183 [Google Scholar]
- Kyriakou A. The sanctuary of Eukleia at Vergina-Aegae: Aspects of the development of a cult place in the heart of the Mace-donian Kingdom. In Proceedings of the Ancient Macedonia: The Birth of Hellenism at the Origins of Europe, Università La Sapienza, Facoltà di Lettere e Filosofia Aula Odeion (Museo dell’Arte Classica), Roma, Italy, 14–15 December 2017. [Google Scholar]
- WingtraOne GEN II, Technical Specifications. Available online: https://wingtra.com/wp-content/uploads/Wingtra-Technical-Specifications.pdf (accessed on 19 November 2025).
- RedEdge-MX Integration Guide. Available online: https://support.micasense.com/hc/en-us/articles/360011389334-RedEdge-MX-Integration-Guide (accessed on 19 November 2025).
- HiPer SR. Available online: https://mytopcon.topconpositioning.com/support/products/hiper-sr (accessed on 19 November 2025).
- González-Audícana M, Saleta JL, Catalán GR, García R. Fusion of multispectral and panchromatic images using improved IHS and PCA mergers based on wavelet decomposition. IEEE Trans. Geosci. Remote Sens. 2004, 42, 1291–1299. DOI:10.1109/TGRS.2004.825593 [Google Scholar]
- Choi J, Yu K, Kim Y. A new adaptive component-substitution-based satellite image fusion by using partial replacement. IEEE Trans. Geosci. Remote Sens. 2011, 49, 295–309. DOI:10.1109/TGRS.2010.2051674 [Google Scholar]
- Yin H. A joint sparse and low-rank decomposition for pansharpening of multispectral images. IEEE Trans. Geosci. Remote Sens. 2017, 55, 3545–3557. DOI:10.1109/TGRS.2017.2675961 [Google Scholar]
- Yang S, Zhang K, Wang M. Learning low-rank decomposition for pan-sharpening with spatial-spectral offsets. IEEE Trans. Neural Netw. Learn. Syst. 2018, 29, 3647–3657. DOI:10.1109/TNNLS.2017.2736011 [Google Scholar]
- Xue J, Zhao Y, Liao W, Chan J-W. Nonlocal tensor sparse representation and low-rank regularization for hyperspectral image compressive sensing reconstruction. Remote Sens. 2019, 11, 193. DOI:10.3390/rs11020193 [Google Scholar]
- Chavez PS, Sides SC, Anderson JA. Comparison of three different methods to merge multiresolution and multispectral data: Landsat TM and SPOT Panchromatic. Photogramm. Eng. Remote Sens. 1991, 57, 265–303. Available online: https://home.cis.rit.edu/~cnspci/references/dip/fusion/chavez1991.pdf?utm_source=chatgpt.com (accessed on 19 November 2025).
- Tu TM, Su SC, Shyu HC, Huang PS. A new look at IHS-like image fusion methods. Inf. Fusion 2001, 2, 177–186. DOI:10.1016/S1566-2535(01)00036-7 [Google Scholar]
- Zheng S, Shi WZ, Liu J, Tian J. Remote sensing image fusion using multiscale mapped LS-SVM. IEEE Trans. Geosci. Remote Sens. 2008, 46, 1313–1322. DOI:10.1109/TGRS.2007.912737 [Google Scholar]
- Kahaki SMM, Jan Nordin M, Ashtari AH, Zahra SJ. Deformation invariant image matching based on dissimilarity of spatial features. Neurocomputing 2016, 175, 1009–1018. DOI:10.1016/j.neucom.2015.09.106 [Google Scholar]
- Ranchin T, Aiazzi B, Alparone L, Baronti S, Wald L. Image fusion—The ARSIS concept and some successful implementation schemes. ISPRS J. Photogramm. Remote Sens. 2003, 58, 4–18. DOI:10.1016/S0924-2716(03)00013-3 [Google Scholar]
- Wald L, Ranchin TM, Mangolini M. Fusion of satellite images of different spatial resolutions-Assessing the quality of resulting images. Photogramm. Eng. Remote Sens. 1997, 63, 691–699. [Google Scholar]
- Wang Z, Ziou D, Armenakis C, Li D, Li Q. A comparative analysis of image fusion methods. IEEE Trans. Geosci. Remote Sens. 2005, 43, 1391–1402. DOI:10.1109/TGRS.2005.846874 [Google Scholar]
- Kaimaris D. Photogrammetric Processing of Digital Images in the Service of Archaeological Research: The Localization of Ancient Via Egnatia from Amphipolis to Philippi. Ph.D. Thesis, Aristotle University of Thessaloniki, Thessaloniki, Greece, 2006. [Google Scholar]
- Moghimi A, Celik T, Mohammadzadeh A, Pirasteh S, Li J. Optimizing relative radiometric normalization: Minimizing residual distortions in multispectral bitemporal images using trust-region reflective and Laplacian pyramid fusion. IEEE Geosci. Remote Sens. Lett. 2025, 22, 5001305. DOI:10.1109/LGRS.2025.3562276 [Google Scholar]