Solvent-Centric Sustainability Framework for Pharmaceutical Process Chemistry: Integrated Metrics, Circularity, and Digital Tools Demonstrated Through a Sertraline Case Study

Solvent-Centric Sustainability Framework for Pharmaceutical Process Chemistry: Integrated Metrics, Circularity, and Digital Tools Demonstrated Through a Sertraline Case Study
Isak Rajjak Shaikh
1,2,3,*
 Maimuna Mujeeb Shaikh
4
Maimuna Mujeeb Shaikh
4
Received: 22 November 2025 Revised: 19 December 2025 Accepted: 28 February 2026 Published: 10 March 2026

© 2026 The authors. This is an open access article under the Creative Commons Attribution 4.0 International License (https://creativecommons.org/licenses/by/4.0/).
Graphical Abstract
1. Introduction
Solvents account for the majority of materials used in active pharmaceutical ingredient (API) synthesis, typically comprising 60–90% of total material usage and 60–80% of overall process mass, thereby dominating mass intensity, energy demand, and environmental impact across pharmaceutical manufacturing routes [1]. Their extensive use in reaction, extraction, crystallization, and purification steps strongly shapes the environmental, economic, safety, and regulatory profiles of drug production. Many commonly employed organic solvents—particularly chlorinated solvents such as dichloromethane (DCM) and dipolar aprotic solvents including dimethylformamide (DMF) and N-methyl-2-pyrrolidone (NMP)—are consistently classified as high concern in industrial solvent-selection guides due to their volatility, associated volatile organic compound (VOC) emissions, energy-intensive distillation and recovery, and hazardous-waste generation [2]. Moreover, solvent production, use, and end-of-life management contribute substantially to life-cycle greenhouse-gas emissions in pharmaceutical processes, positioning solvent selection as one of the most influential levers for improving sustainability, safety, and regulatory compliance in pharmaceutical manufacturing [3,4].
With the emergence of green chemistry, solvent selection has shifted from a routine operational choice to a central determinant of process sustainability. The foundational twelve principles of green chemistry emphasize minimizing waste, improving incorporation of raw materials into products, and prioritizing solvent systems that are inherently safer and less environmentally persistent [5,6]. The seminal work by Anastas and Warner, Green Chemistry: Theory and Practice (1998), introduced these principles, including the concept of safer solvents and auxiliaries, but did not establish a specific quantitative metric for evaluating process sustainability [5]. To quantitatively assess waste generation in chemical processes, Prof. Sheldon introduced the Environmental Factor (E-factor), defined as the ratio of the mass of waste generated to the mass of product formed. This metric has become a widely used benchmark for evaluating environmental efficiency. Subsequent analyses, including Prof. Sheldon’s 2017 review “The E-factor 25 years on” published in Green Chemistry, highlight that solvents dominate pharmaceutical manufacturing waste streams and may account for approximately 50% of greenhouse-gas emissions associated with pharmaceutical production [6]. However, the E-factor does not capture solvent toxicity, reuse potential, or broader environmental impacts. Process Mass Intensity (PMI) is therefore widely adopted as a primary metric of material efficiency and is often correlated with the overall carbon intensity or carbon footprint of a chemical process [1]. PMI is defined as the ratio of the total mass of all materials used to the mass of product obtained and, unlike the E-factor, accounts for all material inputs. Circular PMI (cPMI) extends conventional PMI by explicitly accounting for solvent recovery and reuse, thereby quantifying effective material intensity under circular operation and enabling a more realistic assessment of solvent-dominant processes. As a composite metric, cPMI integrates material intensity with solvent recovery and circularity considerations, enabling more realistic evaluation of solvent-dominant processes. More recently, composite and hybrid frameworks, including life-cycle assessment (LCA) and hazard-adjusted scoring models, have been developed to capture multi-dimensional aspects of solvent sustainability [4,7,8]. Environmental, health, and safety (EHS) scoring provides a semi-quantitative basis for ranking substances and processes according to environmental impact, human toxicity, and operational safety, integrating parameters such as acute and chronic toxicity, persistence and bioaccumulation, volatility and flammability, and exposure risk. LCA, implemented in accordance with ISO 14040/14044, enables cradle-to-gate quantification of energy demand and greenhouse-gas emissions associated with solvent production, use, recovery, and waste treatment [4,9,10]. Nevertheless, the combined application of mass-based, energy-based, and life-cycle metrics within consistent system boundaries remains limited, particularly for solvent-intensive pharmaceutical processes.
The term “sustainability” refers to the ability of systems and processes to endure over time, encompassing the dynamics and balance between inputs and outputs [11]. Although this may shift the focus from solvent-specific considerations to broader aspects of macro-level sustainability, providing context within the existing literature is of paramount importance. Milanesi et al. (2020) provide one of the first comprehensive reviews of sustainability research in the pharmaceutical industry, identifying five key gaps—waste management, economic impacts of new drugs, health-system sustainability, disparities between emerging and mature markets, and social sustainability—thereby advancing understanding of sustainability challenges unique to the sector [12]. Our previous contributions also connected mechanistic insights and industrial needs to outline the broader landscape of sustainable development from a chemistry perspective [11]. Within this broader context, it is both appropriate and pertinent to note that solvent selection directly supports the United Nations (UN) Sustainable Development Goal (SDG) 12—Responsible Consumption and Production—by reducing hazardous emissions and promoting resource circularity [13].
To improve solvent sustainability, the industry has developed a range of qualitative solvent-selection guides and hazard-ranking tools; however, quantitative sustainability metrics remain essential for evaluating solvent performance at the process level and for enabling transparent comparison across alternative solvent systems. Byrne et al. (2016) surveyed general-purpose solvent-selection guides from GlaxoSmithKline (GSK), Sanofi, Pfizer, the American Chemical Society (ACS) Green Chemistry Institute (GCI), and CHEM21, and compared their structures, criteria, and methodologies [3]. These guides reveal both convergence and divergence in how solvent greenness is assessed and highlight persistent limitations, including inconsistent criteria, data gaps for emerging solvents, and the lack of harmonized life-cycle-based evaluation frameworks [3]. Complementary approaches, such as the CHEM21 traffic-light solvent guide, further expanded sustainability assessment through integrated EHS scoring [2]. Despite these advances, solvent sustainability assessments are frequently conducted using fragmented or non-comparable metrics, complicating evidence-based solvent substitution and process-level decision-making [14].
Parallel advancements in solvent design have led to the emergence of green solvent systems, defined as solvents with reduced toxicity, improved biodegradability, and lower environmental persistence. These include bio-based ethers and esters, aqueous or mixed solvent systems, and emerging classes such as ionic liquids (ILs) and deep eutectic solvents (DESs). Bio-based solvents such as 2-methyltetrahydrofuran (2-MeTHF), cyclopentyl methyl ether (CPME), γ-valerolactone (GVL), CyreneTM, and ethyl lactate offer tunable polarity, reduced toxicity, and improved recyclability, positioning them as potential replacements for petrochemical solvents [2,9,15,16,17]. ILs and DESs further diversify the solvent landscape through non-volatility, catalytic versatility, and biocompatibility [18,19,20], enabling applications ranging from biocatalysis to pharmaceutical crystallization [21,22]. However, limited physicochemical, toxicological, and life-cycle data for such neoteric solvents can compromise robust greenness assessment, particularly when comparisons with conventional solvents are not conducted within harmonized evaluation frameworks. In parallel, supercritical carbon dioxide (scCO2) has gained attention as a green solvent for extraction and particle engineering due to its high recoverability and inherently low environmental footprint [23,24,25].
Digital tools have further transformed solvent selection and process optimization. Artificial intelligence (AI), machine learning (ML), and digital twin modelling are increasingly applied to anticipate solvent behaviour, estimate thermodynamic and process parameters, and evaluate alternative solvent systems in silico using multi-criteria sustainability metrics [26,27]. These tools enable predictive evaluation of PMI, cPMI, LCA-derived indicators, and energy demand prior to experimental implementation. However, their systematic integration with established green-chemistry metrics and openly described, industrially relevant case studies remains limited.
Multiple regulatory initiatives—including the European Union’s Registration, Evaluation, Authorisation and Restriction of Chemicals (REACH), the International Council for Harmonisation (ICH) Q3C guidelines on residual solvents, and the United States Environmental Protection Agency (U.S. EPA) Safer Choice criteria—reinforce the need to minimize solvent-related hazards by restricting or discouraging solvents associated with reproductive toxicity, carcinogenicity, or high VOC emissions [28,29,30,31]. Supported by initiatives from the ACS GCI and CHEM21, these frameworks align solvent innovation with the United Nations Sustainable Development Goals (SDGs) 3, 9, 12, and 13 [12,29,31,32].
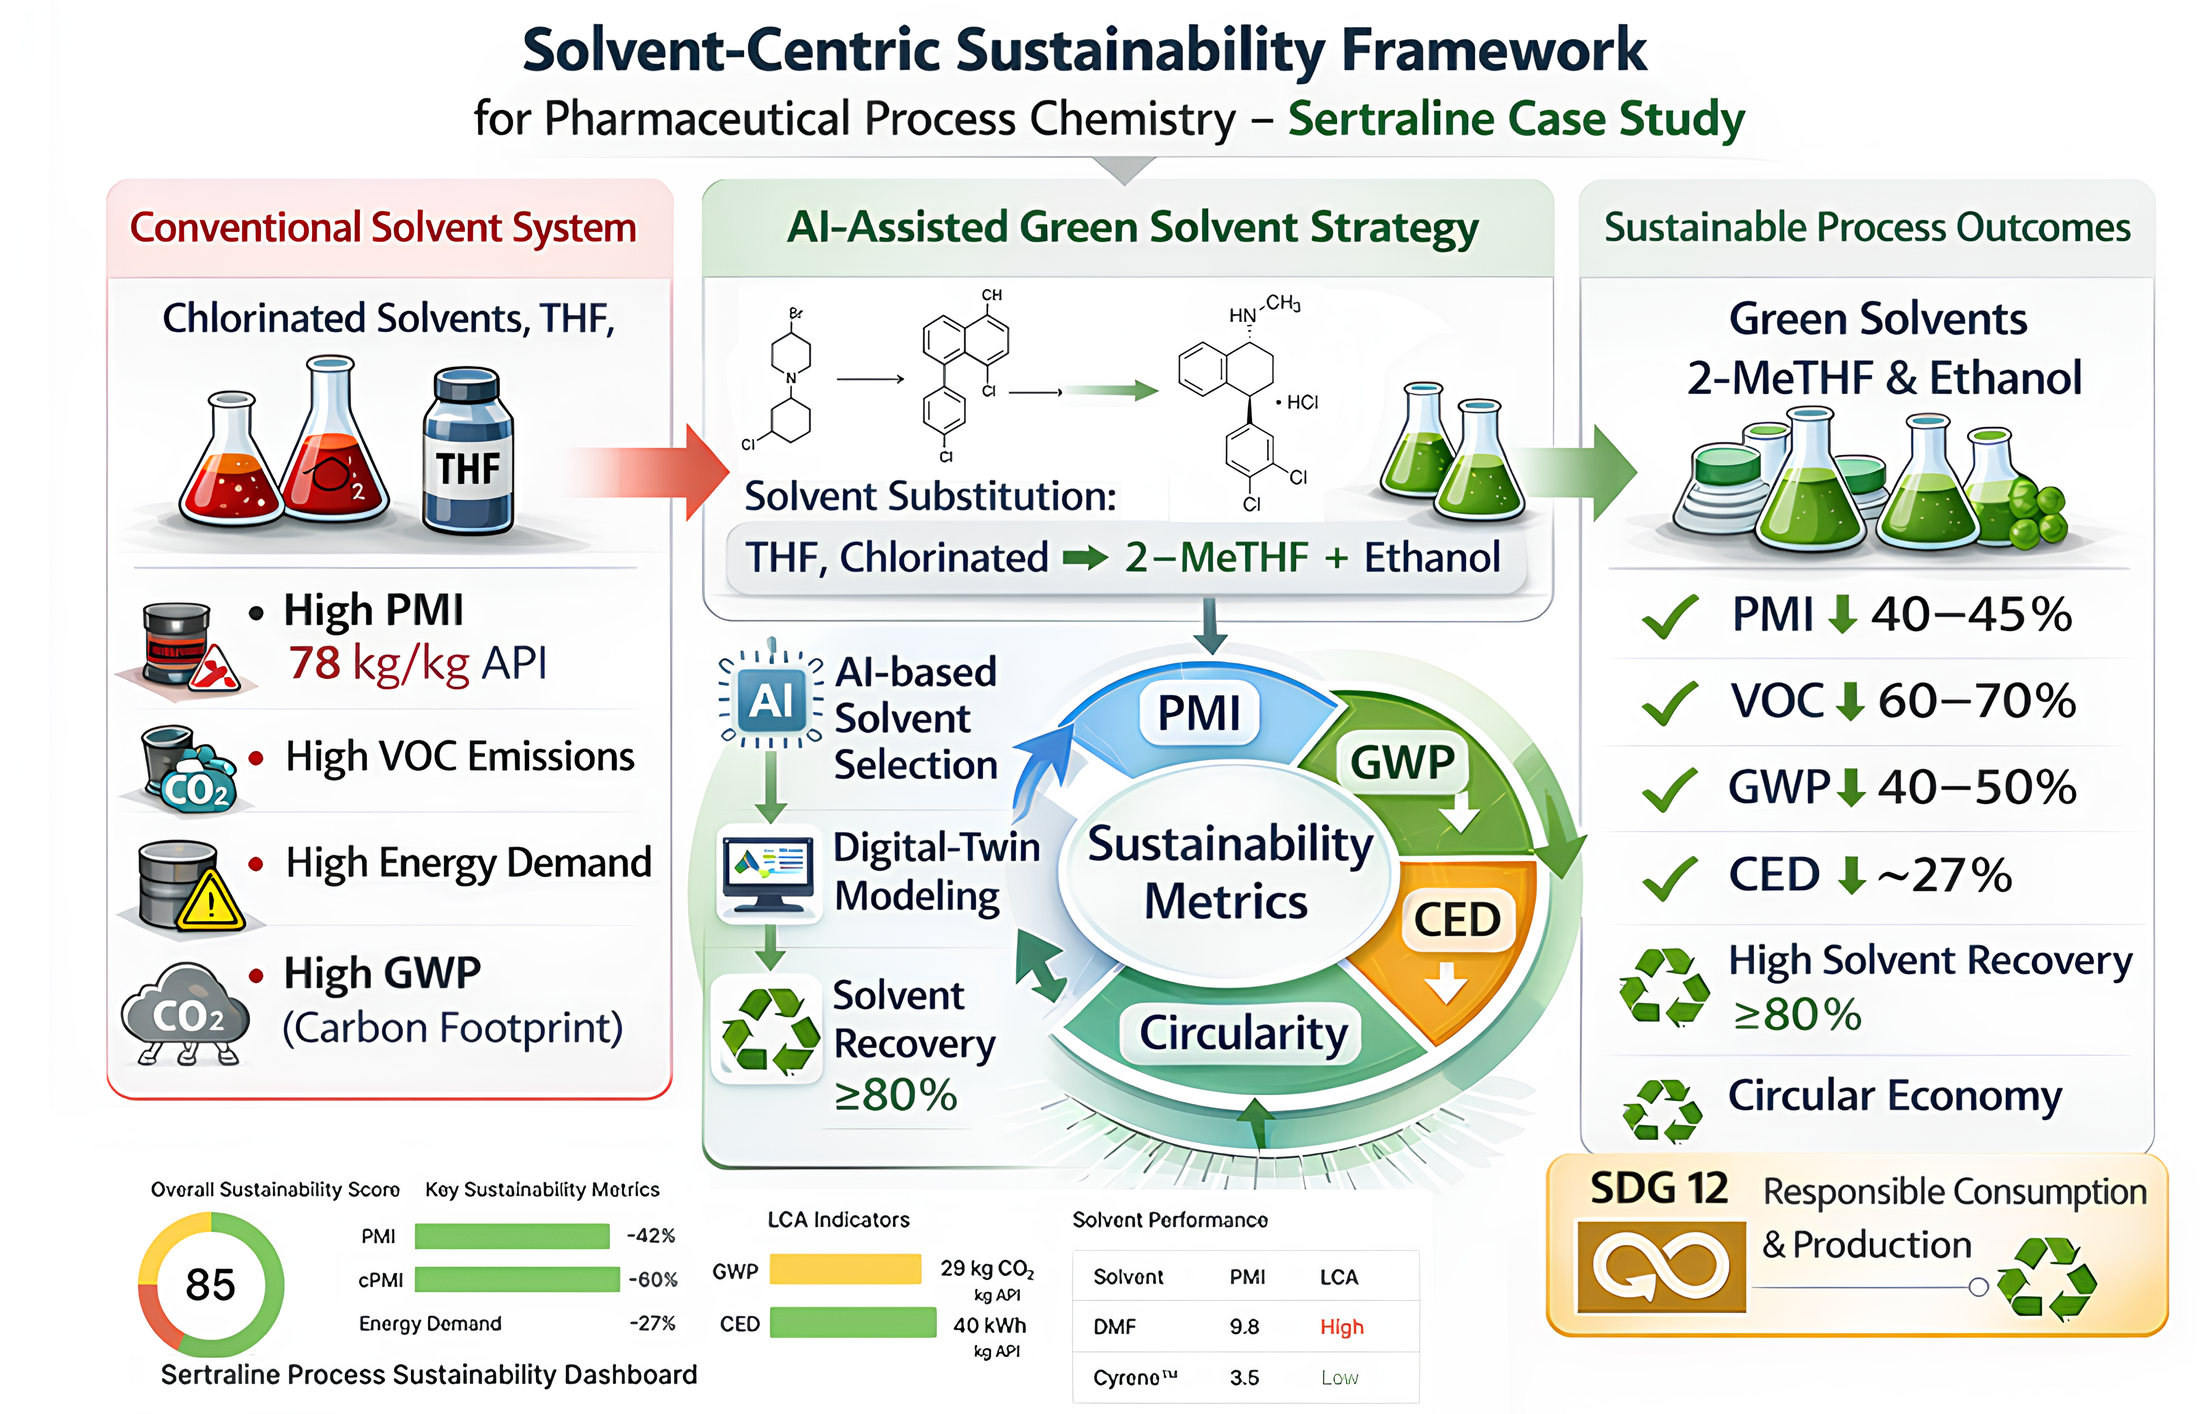
In this context, building on earlier approaches [7], the present study develops and applies a solvent-centric sustainability framework that integrates mass-based indicators with life-cycle and energy metrics to enable transparent comparison of conventional and redesigned solvent systems within consistent cradle-to-gate boundaries. The framework harmonizes PMI, circular PMI (cPMI), Global Warming Potential (GWP), and Cumulative Energy Demand (CED), supported by literature-derived data, machine learning models, and digital twin–based sustainability assessment tools. The methodology is demonstrated using Sertraline as a representative solvent-intensive API, employing a simplified, literature-based synthesis route to contextualize solvent use across key reaction and isolation steps. Targeted solvent substitutions—most notably replacement of tetrahydrofuran, chlorinated solvents, and dipolar aprotic media with 2-methyltetrahydrofuran and ethanol-based systems—are evaluated alongside enhanced solvent recovery and catalytic hydrogenation. Without modifying the underlying synthetic route or relying on proprietary process data, the Sertraline case study illustrates how harmonized metrics, life-cycle thinking, and AI-enabled digital assessment can support evidence-based solvent selection and sustainability-oriented process development in pharmaceutical manufacturing. The novelty of this work lies in integrating PMI- and life-cycle-based sustainability metrics with AI-assisted modelling within a unified solvent-evaluation framework, demonstrated through digital-twin-supported solvent optimization and circular solvent design using the Sertraline API as a representative case study.
2. Landscape and Conceptual Foundations|Literature Survey and Perspective: Green Solvents and Solvent Technologies for Sustainable Pharmaceutical Manufacturing
This section presents the scientific landscape of sustainable solvents, encompassing the emergence of green-solvent classes, process-intensification technologies such as organic solvent nanofiltration (OSN) and continuous flow, digital and regulatory drivers, and, importantly, the conceptual foundations linking solvent choice to sustainability metrics and circularity. It establishes the significance of solvent sustainability and frames solvent selection as a multi-dimensional challenge involving efficiency, hazard, circularity, and environmental burden. The section critically examines existing literature and perspectives on green solvents and solvent technologies, highlighting their advancements, limitations, and implications for sustainable pharmaceutical manufacturing.
2.1. Conceptual Foundations
The transition toward sustainable solvent systems represents a central pillar of contemporary green chemistry and process intensification within the pharmaceutical industry. Green chemistry, as defined by Anastas and Warner (1998), encompasses the design of chemical products and processes that minimize or eliminate the use and generation of hazardous substances [5]. Building upon this conceptual foundation, Nuthi et al. (2023) introduced a cumulative scoring framework that integrates all 12 Principles of Green Chemistry into a unified “green-chemistry score”, enabling quantitative and comparative evaluation of the sustainability of drug-synthesis routes. This holistic metric enhances process optimization by identifying inefficiencies and guiding the development of environmentally responsible pharmaceutical manufacturing strategies [33]. As traditional VOC-based solvents present significant toxicological and environmental hazards, including carcinogenicity, atmospheric pollution, and poor biodegradability [34], green solvents have gained prominence as strategic substitutes. Because solvents constitute the majority of total process mass in pharmaceutical manufacturing, their rational selection and optimization are increasingly recognized as critical levers for process intensification, enabling energy-efficient, sustainable chemical transformations while advancing the UN’s Sustainable Development Goals related to clean production, responsible consumption, and climate action. Despite substantial progress, the current literature still lacks an integrated framework that unifies and consolidates multi-metric solvent assessment, digital predictive tools and methodologies, and validation through experimental or literature-based case studies. An integrated solvent sustainability framework could unify mass-based efficiency metrics, energy and climate indicators, hazard classifications, and digital process tools to show how solvent selection shapes process efficiency, circularity, and environmental performance within an iterative, data-driven decision cycle. The present study addresses this gap in solvent sustainability assessment (Figure 1) by employing Sertraline as a model API.
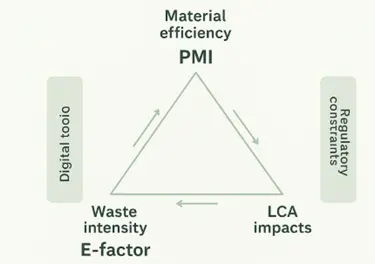
Figure 1. Integrated solvent-centric sustainability framework for pharmaceutical process chemistry. Schematic representation of a solvent-focused sustainability framework linking mass-based metrics (PMI, cPMI, E-factor), energy and climate indicators (CED and GWP), solvent-hazard assessment, and digital tools (machine-learning models and digital twins). The framework illustrates how solvent selection influences material efficiency, circularity, and environmental performance within a unified decision-support structure.
Definition and Terminologies of Green Solvents
“Green solvent” is a functional rather than purely compositional term. Green solvents—defined as solvation media with reduced toxicity, improved biodegradability, and lower environmental persistence—are increasingly proposed as substitutes for legacy solvents in pharmaceutical processes. They comprise several functional categories that differ in origin, physicochemical behaviour, hazard profile, and circularity potential. From an industrial–education standpoint, solvent “greenness” can be evaluated along four axes: (i) origin: renewable vs. fossil; (ii) toxicology: acute and chronic effects on humans and ecosystems; (iii) process performance: boiling point, polarity, miscibility, and catalytic compatibility; and (iv) end-of-life fate: recyclability and biodegradability.
2.2. Sustainable Solvent Classes and Selection Considerations
The transition toward more sustainable pharmaceutical manufacturing has driven the evaluation of alternative solvent classes that can reduce environmental impact while maintaining process performance and regulatory compliance. In this study, solvent classes were considered for discussion based on their physicochemical properties, hazard profiles, life-cycle impacts, and feasibility of recovery and reuse within industrial settings.
2.2.1. Aqueous and Mixed Solvent Systems
Water is widely regarded as a benign solvent due to its non-toxicity, abundance, and minimal environmental impact, while its polarity and thermal stability support a broad range of applications. Aqueous and mixed solvent systems offer an additional strategy to reduce solvent hazard and material intensity, as incorporating water or aqueous alcohol mixtures can lower overall solvent consumption and mitigate flammability and toxicity concerns. However, these systems require careful consideration of reaction kinetics, solubility, and downstream separations to ensure process robustness. In the present assessment, aqueous systems were evaluated where technically feasible and benchmarked against organic solvent alternatives using the metrics described in Section 5. Beyond water, green solvents span multiple chemical classes; Table 1 provides an overview of these categories, including their key properties, hazards, and aspects of circularity.
Table 1. Overview of Solvent Classes, Properties, Hazards, and Circularity.
|
Representative Solvents |
Key Physicochemical Properties |
EHS Score (CHEM21/ACS GCI) |
Application Areas |
Circularity Potential |
|
|---|---|---|---|---|---|
|
Bio-based ethers/esters |
2-MeTHF, CPME, GVL, ethyl lactate |
Medium polarity, tunable BP |
Low–medium hazard |
Grignard, extraction |
High |
|
Ionic liquids |
BMIM-PF6, EMIM-Ac |
Non-volatile, high polarity |
Variable; toxicity uncertain |
Biocatalysis, separations |
Medium |
|
Natural DES |
Choline chloride:urea |
High viscosity, H-bond forming |
Low hazard |
Extraction, biocatalysis |
Medium–high |
|
Dipolar aprotics (renewable) |
CyreneTM |
High polarity, no VOC |
Low hazard |
DMF alternatives |
Medium |
|
scCO2 |
CO2 supercritical |
Gas-like diffusivity |
Low hazard |
Extraction, micronization |
High |
2.2.2. Bio-Based and Renewable Solvents
Bio-based solvents derived from renewable feedstocks, including alcohols, ethers, and esters, have gained attention as potential replacements for conventional petrochemical-based solvents. These green solvents generally exhibit lower life-cycle greenhouse gas emissions and improved biodegradability compared with chlorinated and dipolar aprotic solvents, although trade-offs related to energy demand and upstream processing remain process-dependent.
Bio-based ethers typically offer medium polarity, favorable boiling points, and improved recoverability relative to traditional ether and ester solvents, combining stability, recyclability, and reduced PMI [1]. Such solvents achieve lower E-factors and align with circular manufacturing paradigms [7,33]. Their generally lower hazard rankings make them suitable for Grignard reactions, extractions, and related operations. In pharmaceutical applications, bio-based ethers such as 2-MeTHF and CPME have demonstrated compatibility with established reaction chemistries while enabling improved solvent recovery and reduced environmental burden.
2.2.3. Ionic Liquids (ILs) and Deep Eutectic Solvents (DESs)
Ionic liquids (ILs) and deep eutectic solvents (DESs), including natural deep eutectic solvents (NaDES), represent two distinct classes of non-volatile solvent systems that further diversify the solvent landscape beyond conventional VOC-based media [18,19,20]. ILs consist of paired organic cations and inorganic or organic anions that form liquids at relatively low temperatures, typically below 100 °C. Their non-volatility, tunable polarity, recyclability, and thermal and chemical stability make them attractive for applications such as biocatalysis, extraction, and electrochemical transformations [21,22]. However, ILs are not intrinsically green: concerns remain regarding cost, long-term ecological impacts, persistence, incomplete biodegradability, and limited life-cycle data, which can compromise sustainability assessments if comparisons with conventional solvents are not made on an equivalent basis [34].
DESs originate from combinations of hydrogen-bond donors and acceptors, often derived from inexpensive, biologically sourced metabolites, forming extensive hydrogen-bond networks that generate a liquid phase with tunable physicochemical properties [35,36,37]. DESs typically exhibit low vapor pressure, biocompatibility, and customizable solvation characteristics, driving interest in pharmaceutical synthesis, drug delivery, extraction, and biocatalytic applications [20]. Nevertheless, DESs present limitations, including high viscosity, mass-transfer constraints, and challenges in downstream separation and solvent recovery.
Taken together, ILs and DESs expand the solvent design space for pharmaceutical manufacturing but cannot be assumed to be universally benign. Both classes are therefore considered here primarily as specialized alternatives rather than universal solvent substitutes, consistent with recent literature reports (Figure 1; Table 1).
2.2.4. Supercritical Carbon Dioxide
Supercritical CO2 (scCO2) offers a low-residue, readily recoverable medium with liquid-like solvating power and gas-like diffusivity; operating above its critical temperature (31.1 °C) and pressure (73.8 bar) generates a phase that combines high mass-transfer rates with sufficient density for effective solvation. These attributes enable solvent-free separations, micronization, and particle design while reducing residual solvents and energy demand [24,38]. Overall, scCO2 provides a clean, recoverable processing medium that supports applications from extraction to particle engineering with minimal downstream purification.
2.3. Enabling Technologies and Integration Pathways
Process intensification, solvent recovery, and digital optimization technologies form the foundation of integrated sustainable manufacturing.
2.3.1. Continuous Manufacturing
Continuous-flow chemistry offers tighter control over reaction conditions and more reproducible performance. Integration with green solvents enhances mass transfer and heat management, yielding lower PMI and energy use [39].
2.3.2. Organic Solvent Nanofiltration
Organic Solvent Nanofiltration (OSN) enables solvent recovery and recycling from reaction mixtures. By reducing distillation energy demand and waste volume, OSN supports closed-loop solvent systems aligned with circular manufacturing models and contributes to reductions in cumulative process mass intensity (cPMI) [40,41].
2.3.3. Digital and AI Integration
Machine learning and digital twins increasingly underpin solvent design and process optimization [42,43]. Recent advances include graph neural network models capable of predicting solubility behavior in multicomponent solvent systems, improving the reliability of solvent screening and formulation design [42]. AI models predict solvent–solute compatibility, toxicity, and life-cycle performance, thereby reducing the number of experimental iterations [43,44]. Such digital solvent engineering aligns sustainability metrics with computational screening, enabling more efficient process routes for APIs.
2.4. Quantitative Metrics in Solvent Evaluation
PMI and the E-factor remain foundational sustainability indicators in pharmaceutical chemistry [1,6,9,33], while cPMI incorporates solvent recovery and reuse to reflect circular efficiency [41]. Additional parameters include cumulative energy demand [7], global warming potential, and life-cycle assessment, which, when integrated with hazard and safety assessments such as Health–Safety–Environment scores [2], provide a holistic view of solvent sustainability.
2.5. Emerging Circular and Digital Paradigms
The circular economy paradigm aims to maintain solvent utility through recovery, recycling, and regeneration, moving beyond traditional linear models. Solvent-recovery strategies are increasingly adopted across chemical industries as part of broader sustainability agendas [44]. Digital twins enable real-time optimization by integrating PMI, LCA, and safety data streams [45], while AI-guided solvent design using cheminformatics and COSMO-RS facilitates prediction of solvent properties and preliminary toxicity profiles [46,47]. Integrating cheminformatics with sustainability metrics further supports environmentally informed solvent design in pharmaceutical processes [48].
2.6. Comparative Performance and Industrial Trends
There is a need to integrate mass- and energy-based metrics with life-cycle impacts for sustainable chemical manufacture, as shown by analyses of large numbers of industrial production routes [49]. Meta-analyses of industrial case studies demonstrate substantial environmental and operational benefits of solvent substitution [46,47]. Sustainable pharmaceutical design increasingly relies on holistic metrics and green chemistry principles to reduce environmental impact while maintaining process efficiency [50,51].
2.7. Research Gaps and Future Directions
Despite significant progress, challenges persist, including incomplete toxicological and LCA data for bio-based solvents [8], viscosity and separation barriers [52], feedstock supply and scalability constraints [50,51], limited validation of digital solvent-prediction tools [45,48], and the lack of unified regulatory solvent-assessment standards across agencies [51].
2.8. Perspective and Roadmap
Future solvent innovation will depend on substituting hazardous volatile organic compounds (VOCs), process intensification enabled by continuous-flow and hybrid solvent-recovery systems, and digital integration leveraging artificial intelligence, cheminformatics, and real-time life-cycle assessment (LCA).
2.9. Solvent Selection Trade-Offs
Across solvent classes, sustainability performance reflects trade-offs between hazard reduction, material efficiency, energy demand, and process operability. No single solvent universally satisfies all green chemistry objectives, underscoring the importance of quantitative, process-specific evaluation. In this study, solvent selection was guided by combined mass-based metrics, life-cycle indicators, hazard assessments, and recovery potential.
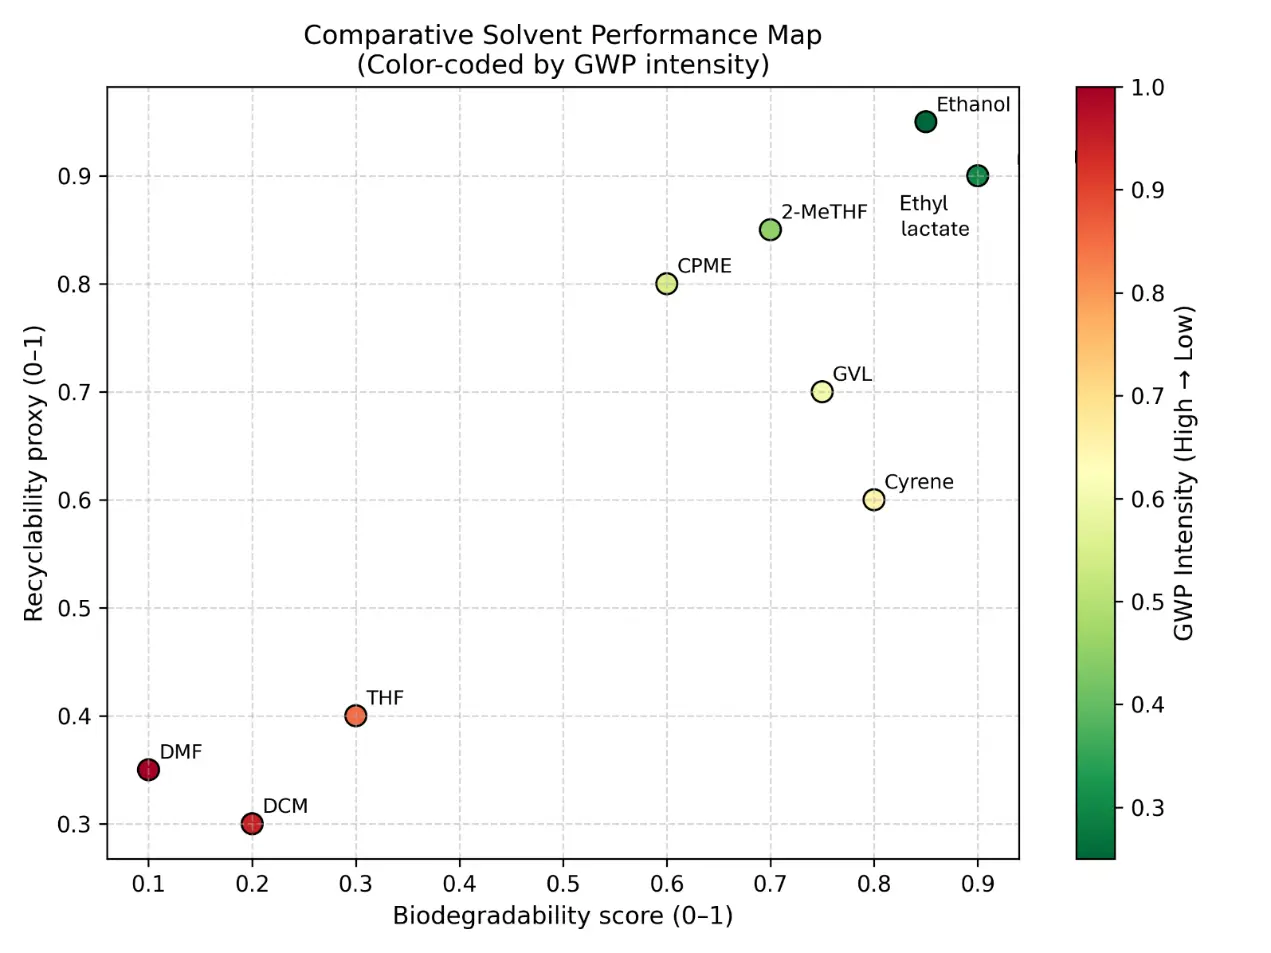
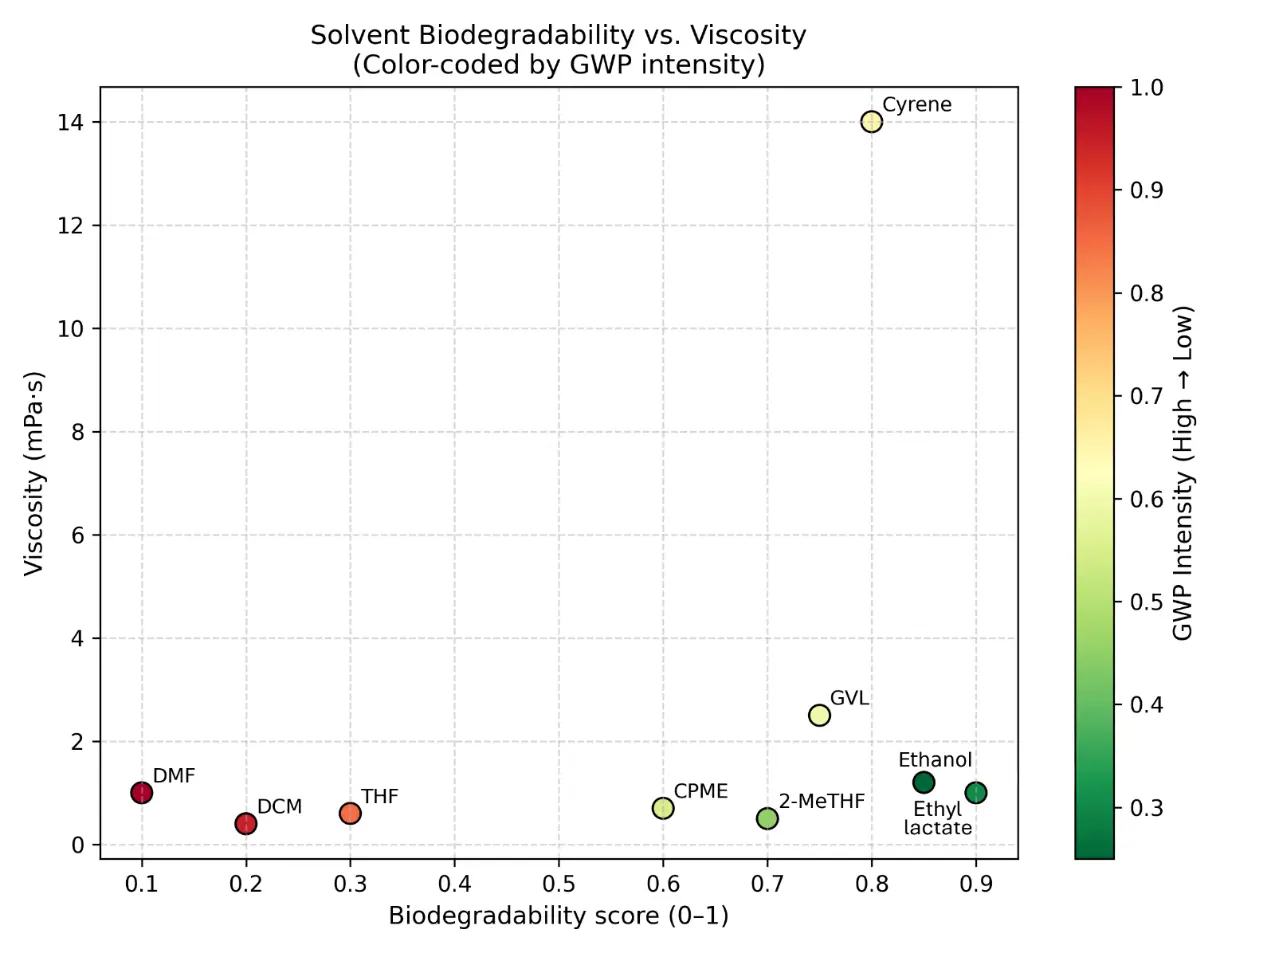
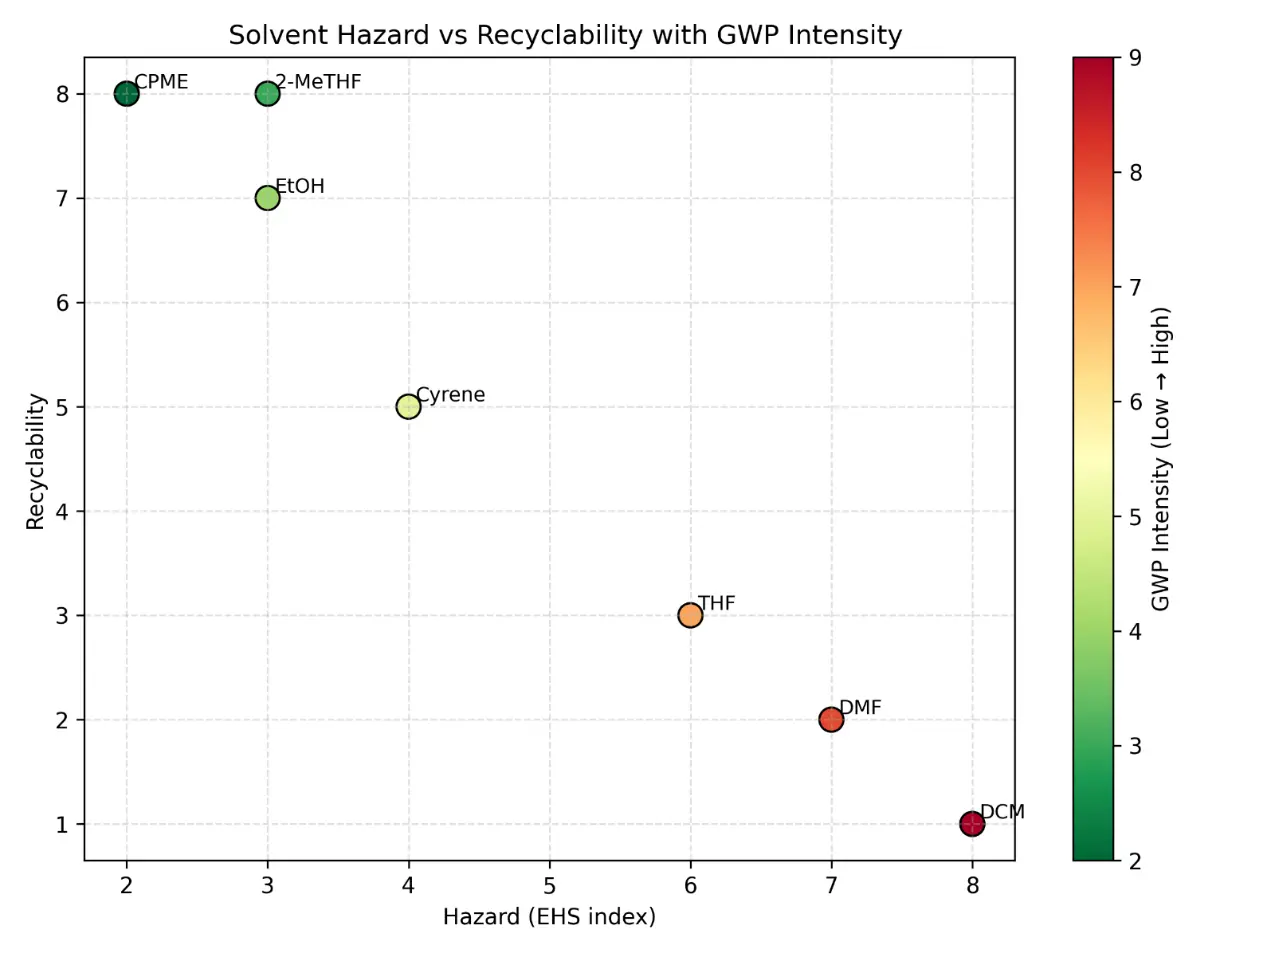
The two-axis solvent performance map (Figure 2) plots hazard against recyclability or recovery potential, while vapor-pressure-related VOC risk and cradle-to-gate GWP were estimated from physicochemical and life-cycle data compiled in Dataset S2. The map contrasts conventional solvents with green or bio-based alternatives and highlights trade-offs such as reduced hazard but moderate energy demand for selected candidates.
 |
|
(a) |
 |
|
(b) |
 |
|
(c) |
Figure 2. Comparative solvent performance map for conventional and green solvents. Two-axis map plotting solvent hazard against recyclability or recovery potential. Conventional solvents (e.g., THF, DCM, DMF) are compared with selected green or bio-based alternatives (e.g., 2-MeTHF, CPME, ethanol, Cyrene™) to illustrate differences in environmental, health, and safety profiles and circularity potential. Hazard rankings and recovery classifications are based on solvent-selection guides, while cradle-to-gate GWP values derived from Dataset S2 support comparative assessment. (a) Distribution of commonly used conventional solvents (e.g., THF, DCM, DMF) on the hazard–recyclability map, highlighting their relatively higher hazard rankings and moderate recovery potential. (b) Positioning of green or bio-based solvent alternatives (e.g., 2-MeTHF, CPME, ethanol, Cyrene™), illustrating improved environmental and safety profiles together with generally higher recyclability or circularity potential. (c) Integrated comparison of solvent classes, showing the overall shift from conventional to greener solvent systems within the hazard–recyclability space and illustrating trade-offs between EHS risk, solvent recovery potential, and life-cycle indicators such as GWP.
3. Metrics and Frameworks for Sustainable Solvent Evaluation
This section establishes the quantitative metrics and assessment frameworks for evaluating solvent sustainability at the process level. These metrics form the analytical basis for comparing conventional and alternative solvents and are subsequently applied to the Sertraline case study (presented under Section 4) to quantify improvements in material efficiency, environmental impact, and circularity.
3.1. Study Design and Methodological Scope
The methodological scope of this study integrates mass-based, energy-based, and hazard-oriented sustainability indicators relevant to resource efficiency, responsible production, and climate impact mitigation with solvent recyclability considerations. Primary quantitative metrics include PMI, cPMI, GWP, and CED, supported by solvent hazard classifications derived from established solvent-selection guides. Life-cycle impacts were evaluated on a cradle-to-gate basis, with system boundaries encompassing raw-material production, solvent manufacture, reaction processing, and solvent recovery where applicable.
Metric calculations and normalization procedures were performed using literature-reported values, publicly available life-cycle inventory datasets, and internally compiled solvent property data (Datasets S1–S3). The analysis focuses on relative comparisons between baseline and redesigned process routes rather than absolute life-cycle values, consistent with early-stage process development and solvent-selection practice.
3.2. Mass-Based and Circularity Metrics
Material efficiency was assessed primarily using PMI and cPMI, which capture the cumulative mass of all input materials normalized to the mass of API produced. Circularity effects were incorporated through cPMI by explicitly accounting for solvent recovery scenarios representative of industrial practice. These metrics enable direct comparison of baseline and solvent-optimized routes and provide a transparent measure of the contribution of solvent substitution and recovery to overall waste reduction.
3.3. Energy and Climate Impact Indicators
Energy consumption and climate impact were evaluated using CED and GWP. GWP values were calculated using 100-year characterization factors, while CED accounts for both renewable and non-renewable energy inputs across solvent production and processing stages. These indicators complement mass-based metrics by capturing trade-offs between material efficiency and upstream energy demand, particularly relevant for bio-based and emerging solvent systems.
3.4. Solvent Hazard and Regulatory Alignment
Solvent hazard profiles were assessed using aggregated EHS indices derived from solvent-selection guides and regulatory classifications. These assessments incorporate acute and chronic toxicity, flammability, persistence, and regulatory status under frameworks such as REACH and ICH Q3C. Hazard scoring was used to contextualize quantitative sustainability metrics rather than as a standalone decision criterion.
3.5. Integrated Solvent Performance Mapping
To enable comparative evaluation, hazard, recyclability, and sustainability indicators were integrated into two-axis solvent performance maps (Figure 2). These maps facilitate visualization of trade-offs between EHS risk and circularity potential across conventional and alternative solvents. Vapor-pressure-related VOC risk and cradle-to-gate GWP were independently estimated using physicochemical and life-cycle data compiled in Dataset S2 and used to support solvent comparison.
3.6. Introduction to Quantitative Metrics
Building on the previous section, Literature Survey and Perspective: Green Solvents and Solvent Technologies for Sustainable Pharmaceutical Manufacturing, this spart, Metrics and Frameworks for Solvent Evaluation, introduces the key quantitative metrics for assessing sustainability in pharmaceutical process design. Each metric is rigorously defined and framed within established green chemistry and process systems engineering principles. A Sertraline synthesis case study illustrates its practical application, demonstrating how these metrics can guide data-driven decisions, quantify environmental impact, and optimize overall process sustainability. Collectively, these metrics provide the framework for comparing conventional and alternative solvents and evaluating efficiency, environmental impact, and circularity at the process level.
This section covers:
- (i)
-
Quantitative metrics—such as PMI, E-factor, cPMI, atom economy, the Reaction Mass Efficiency (RME)
- (ii)
-
Energy and environmental indicators (CED, GWP, LCA)
- (iii)
-
How these metrics interrelate
- (iv)
-
How LCA and PMI can be integrated into hybrid frameworks
- (v)
-
It provides the mathematical, methodological, and interpretive basis for evaluating solvent options.
Quantitative sustainability metrics provide the analytical foundation for evaluating chemical processes and solvent systems in the pharmaceutical industry. They translate the qualitative principles of green chemistry [5] into measurable indicators that support decision-making, benchmarking, and continuous improvement. Because solvents dominate material and energy flows in API manufacture, their evaluation through standardized metrics—such as PMI, E-factor, CED, and GWP—enables assessment of process efficiency, resource consumption, and climate impact [1,6,7,9,53].
A robust metric framework ensures comparability across different scales and organizations, linking synthetic route design, waste minimization, and life-cycle thinking under one quantitative lens [6,9]. These indicators also interface with digital process-analysis tools, allowing integration of sustainability data into predictive models and manufacturing dashboards.
3.7. Fundamental Process Metrics
The mathematical formulae of the quantitative sustainability metrics are presented in the Supporting Materials (SI) for readers’ reference.
3.7.1. Process Mass Intensity (PMI)
PMI measures the overall material efficiency of a process, incorporating reagents, catalysts, solvents, and processing aids. Lower PMI values indicate higher resource efficiency. In pharmaceutical manufacturing, typical PMI values range between 25 and 100, while best-in-class continuous processes achieve <20 [1].
Interpretation: PMI captures total material throughput and aligns directly with cost and waste minimization goals. It is favoured over atom economy [51] because it includes non-stoichiometric materials such as solvents and work-up reagents [43].
3.7.2. Environmental Factor (E-Factor)
The E-factor, introduced by Sheldon [6,9], quantifies waste generation. Although conceptually similar to PMI, the E-factor excludes water and recycled solvents. Typical pharmaceutical processes exhibit E-factors of 25–100, whereas bulk chemical production averages <5.
Complementarity: PMI = E + 1 (if water and recycled materials are excluded). Combined interpretation of both indicators distinguishes between absolute material efficiency (PMI) and net waste production (E-factor).
3.7.3. Atom Economy (AE)
AE measures how effectively atoms from reactants are incorporated into the final product [53]. Although it provides a theoretical upper bound for material efficiency, AE ignores solvents, auxiliaries, and yield losses and is therefore a design-stage metric.
3.7.4. Reaction Mass Efficiency (RME)
RME connects stoichiometric efficiency with practical performance by penalizing low yields and poor selectivity, providing a bridge between laboratory and process scales [54].
3.7.5. Circular Process Mass Intensity (cPMI)
With the advent of solvent recovery and closed-loop operations, cPMI or effective PMI (ePMI) was developed to quantify circularity. This variant explicitly rewards solvent recycling and reuse [43]. For instance, a process with PMI = 50 and 80% solvent recovery yields cPMI = 10.
3.8. Energy and Environmental Indicators
3.8.1. Cumulative Energy Demand (CED)
CED expresses the total primary energy consumed throughout a process life cycle [7].
3.8.2. Global Warming Potential (GWP)
GWP quantifies the climate impact of greenhouse-gas emissions over a 100-year time horizon relative to CO2 [10]. GWP is used at both unit-operation and cradle-to-gate scales to identify high-impact solvents and steps [7].
3.8.3. Life-Cycle Assessment (LCA)
LCA evaluates environmental impacts from raw-material extraction through manufacturing (“cradle-to-gate”). Key stages include goal and scope definition, inventory analysis, impact assessment, and interpretation [7]. In solvent analysis, LCA integrates CED, GWP, acidification, eutrophication, and toxicity potentials, extending beyond plant-level metrics [8].
3.8.4. Health–Safety–Environment (HSE/EHS) Index
HSE indices aggregate hazard data—flash point, toxicity, volatility, and persistence—into numeric scales [2]. Typical solvent-selection frameworks classify solvents as recommended, usable with caution, or undesirable. These indices can be normalized and coupled with quantitative metrics to generate weighted sustainability matrices.
3.9. Interrelation of Metrics
In practice, no single metric captures all sustainability aspects. PMI and E-factor quantify material demand and waste generation, while CED and GWP reflect energy requirements and greenhouse-gas implications. Their combined interpretation reveals trade-offs; for example, solvent substitution may reduce toxicity but increase CED if recovery energy is high.
Correlation studies [7,43] demonstrate strong relationships between PMI and E-factor, and between CED and GWP. Integrated use within LCA yields comprehensive sustainability indexing, while multi-metric dashboards enable visualization of waste, energy, and hazard trade-offs during route design.
3.10. Summary Perspective
Quantitative solvent metrics form the backbone of sustainable pharmaceutical process design. PMI and E-factor remain practical for benchmarking, while CED and GWP extend evaluation into the energy–emission domain. cPMI, LCA, and HSE indices integrate circularity, systems thinking, and safety considerations.
Adoption of these metrics, supported by digital dashboards and AI-enhanced predictive models, enables chemists to design solvent systems that are verifiably more efficient. Table 2 presents the sustainability metrics used in this study and highlights their interpretive value for assessing solvent performance. The Sertraline case study is a standardized, normalized analysis based on publicly available Pfizer datasets (2018–2024), literature data, and model-based sustainability calculations, intended for methodological demonstration. In the following sections, this case exemplifies how quantitative evaluation transforms sustainability from a qualitative aspiration into a measurable performance outcome.
Table 2. Sustainability Metrics and Their Interpretive Value.
|
Metric |
Definition |
Captures |
Strengths |
Limitations |
Recommended Use |
|---|---|---|---|---|---|
|
PMI |
Total mass in/mass product |
Material efficiency |
Intuitive; comparable |
Sensitive to boundary |
Early route screening |
|
cPMI |
PMI adjusted for recovery |
Circularity |
Accounts for recycling |
Depends on assumptions |
Process optimization |
|
E-factor |
Waste mass per product mass |
Waste |
Aligns with cost |
Excludes water |
Waste benchmarking |
|
CED |
Total primary energy |
Energy efficiency |
Links to GWP |
Region-dependent |
Energy optimization |
|
GWP |
CO2-eq emissions |
Climate impact |
Standardized |
LCA database variability |
LCA comparisons |
The Sertraline case study presented here is a quantitative redesign based on publicly available Pfizer datasets (2018–2024), literature data, and model-based sustainability calculations. It is not a reproduction of the industrial process but a standardized, normalized analysis intended for methodological demonstration.
In the following sections, the Sertraline case discussed herein exemplifies how such quantitative evaluation transforms sustainability from a qualitative aspiration into a measurable performance outcome.
4. Sertraline Case Study: Application of the Integrated Framework
This section applies the frameworks from Sections 2 and 3 to the redesigned Sertraline process, organizing the analysis around: (i) baseline versus redesigned PMI, E-factor, CED, and GWP; (ii) mechanistic reasoning for observed improvements; (iii) step-level analysis including Grignard, hydrogenation, and crystallization stages; and (iv) digital-twin and ML-assisted predictions, with benchmarking against reported industrial routes. This organization demonstrates how the framework is applied in real process redesign.
4.1. Clarification of PMI Baselines
In this study, two PMI baselines are used due to differences in system boundaries across the literature.
- (i)
-
The full end-to-end Sertraline route, including all reaction, workup, and isolation stages, typically exhibits PMI values in the range of 140–170 kg input kg−1 API, as reported in multiple industrial benchmarking studies.
- (ii)
-
The solvent-dominant subsequence of steps for which detailed solvent mass-balance data are available (Datasets S1–S3; Supporting Information) shows a normalized baseline PMI ≈ 78.
Because the redesigned solvent strategy specifically targets these solvent-intensive steps, the comparison of 78 → 45 (−42%) represents the appropriate boundary-aligned improvement. Any comparison between full-route PMI values (≈140–170) and the solvent-dominant redesigned PMI (≈45) reflects different system boundaries and is therefore qualitative only. Clarifying these scopes ensures consistency, avoids misinterpretation, and aligns the analysis with best practices in PMI benchmarking.
4.2. What This Work Contributes
This work introduces an integrated framework that unifies solvent substitution, PMI–cPMI analysis, hazard scoring, LCA indicators, and digital predictive tools to enable data-driven redesign of API manufacturing routes. Using a solvent-centric Sertraline case study, it demonstrates substantial sustainability gains, including 42% lower PMI, 44% lower GWP, and 27% reduced CED, while providing a reproducible cheminformatics and digital-twin workflow built on open datasets. The study shows how solvent circularity principles and multi-metric dashboards can guide route optimization and support alignment with industry sustainability targets and emerging regulatory expectations.
4.3. Scope and Purpose of the Present Study
This study demonstrates how solvent-centered process redesign, guided by quantitative sustainability metrics and digital decision-support tools, can serve as an effective entry point for improving the environmental performance of pharmaceutical manufacturing. Although solvents are a dominant driver of material intensity and life-cycle impacts in active pharmaceutical ingredient (API) synthesis, they are examined here within a broader green-chemistry framework that also encompasses reaction conditions, catalyst selection, waste generation, and energy demand. Using Sertraline as a representative solvent-intensive API, the study integrates process mass intensity (PMI), cumulative PMI (cPMI), life-cycle assessment (LCA) indicators, and hazard-based solvent ranking to demonstrate how targeted, data-driven interventions can systematically align pharmaceutical process design with multiple principles of green chemistry. While detailed, principle-by-principle alignment is presented later through the Sertraline case study, this section establishes our overarching conceptual framework that connects solvent choice, quantitative metrics, and holistic sustainability assessment.
5. Materials and Methods
This section outlines the quantitative metrics, analytical methods, and evaluative frameworks employed to benchmark solvent sustainability and process greenness in pharmaceutical manufacturing, using Sertraline as a representative case study.
5.1. Study Design and Methodological Scope
This study adopts a metrics-driven, solvent-centric hybrid review–case-study design integrating a structured literature survey with a quantitative sustainability assessment of solvent use in Sertraline synthesis. The study analyses, but does not reproduce or disclose, proprietary industrial manufacturing routes, and instead applies standardized sustainability metrics to normalized, literature-derived, and publicly available data to demonstrate methodological utility. The Sertraline case study serves as a representative solvent-intensive API to illustrate how solvent substitution, recovery, and process intensification influence sustainability performance, rather than as a definitive industrial benchmark.
The review component synthesizes recent developments in green solvent classes, sustainability metrics, digital tools, solvent sustainability frameworks, bio-based solvent classes, and multi-metric evaluation methodologies relevant to pharmaceutical process chemistry. Inclusion and exclusion criteria, database search strategies, and normalization of sustainability indicators were defined to ensure reproducibility [7,55]. Evaluated metrics included Process Mass Intensity (PMI), E-factor, circular PMI (cPMI), Cumulative Energy Demand (CED), Global Warming Potential (GWP), and solvent-hazard indices based on CHEM21, Pfizer, GSK, and ACS Green Chemistry Institute solvent guides [6,7].
The case-study component applies these frameworks to a normalized Sertraline synthesis route to demonstrate practical implementation. System boundaries are defined on a cradle-to-gate basis and are kept consistent across baseline and redesigned scenarios to ensure comparability, encompassing solvent production, process use, recovery, and waste treatment, while excluding downstream formulation and distribution. This boundary alignment ensures robust, metric-based comparison of solvent-driven sustainability improvements.
The process-redesign component assesses the substitution of legacy solvents—tetrahydrofuran (THF), dichloromethane (DCM), and N,N-dimethylformamide (DMF)—with renewable or lower-impact alternatives, including 2-methyl tetrahydrofuran (2-MeTHF), aqueous ethanol, and CyreneTM. Quantitative comparisons between baseline and redesigned processes included PMI, solvent recovery, VOC emissions, life-cycle indicators (CED and GWP), and thermodynamic attributes derived from mechanistic and literature-based analyses. The study follows the Pfizer Green Aspiration Level (GAL) benchmark [53] and the hybrid solvent-evaluation framework of Durand and coworkers [7], which critically evaluates sustainability assessment tools and emphasizes integrating LCA with green chemistry metrics to more comprehensively quantify solvent-related environmental impacts, thereby supporting more informed and sustainable solvent selection in pharmaceutical and chemical processes.
To maintain boundary consistency, two PMI baselines were distinguished: (i) a full-route literature benchmark for Sertraline synthesis (~140–170 kg input kg−1 API), and (ii) a solvent-dominant subsequence (~78 kg·kg−1 API) for which detailed solvent mass-balance data are available. The redesigned solvent strategy is evaluated against the latter, boundary-aligned baseline, enabling focused assessment of solvent substitution, recovery, and circularity effects without confounding contributions from unrelated process steps.
As shown in Figure 3, the PRISMA-style flow diagram summarizes how studies were identified, screened, assessed for eligibility, and included in the analyses of solvent use, sustainability metrics, and Sertraline process redesign. Overall, this hybrid review–case-study design emphasizes transparency, comparability, and reproducibility, positioning Sertraline as a representative example of how solvent-centric redesign—supported by quantitative metrics, standardized frameworks, and digital tools—can drive sustainability improvements in pharmaceutical manufacturing.
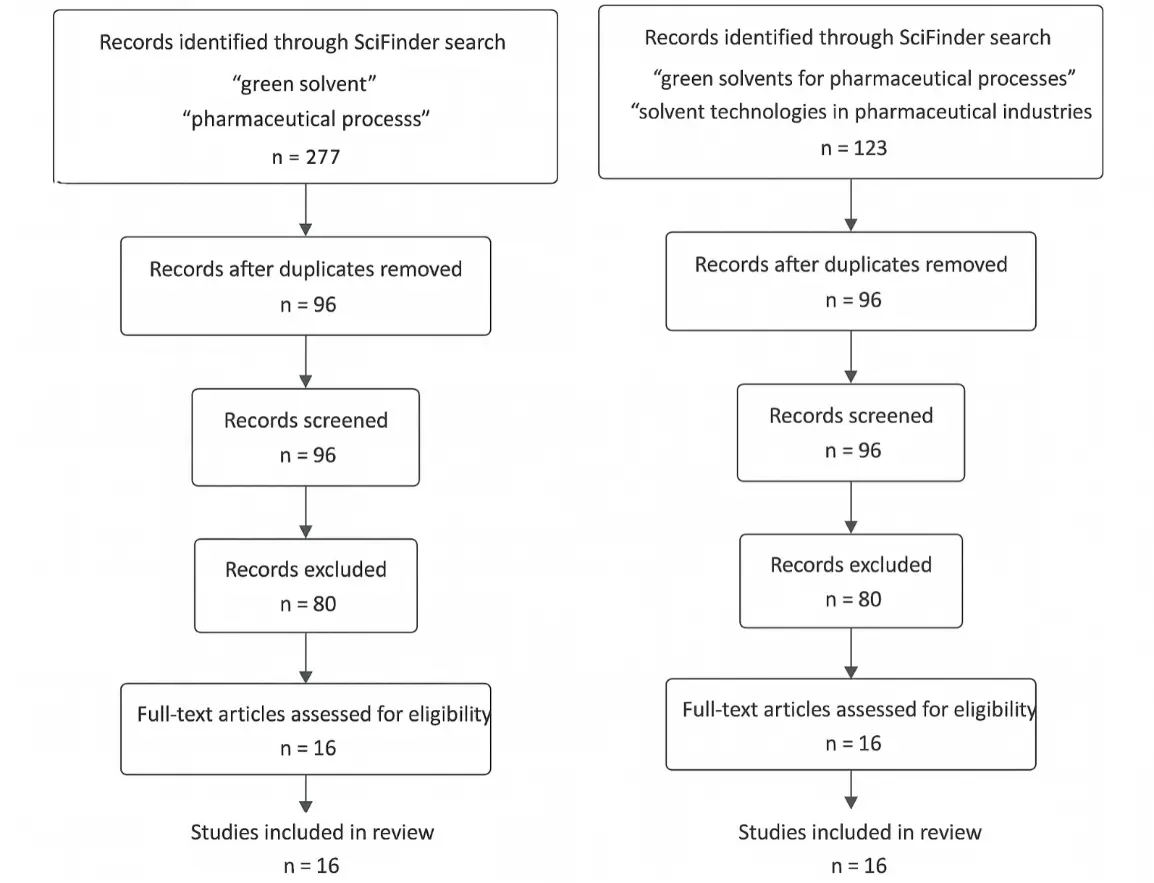
Figure 3. PRISMA-style flow diagram of the literature review process. Flow diagram summarizing identification, screening, eligibility assessment, and inclusion of literature sources used in the review of solvent classes, sustainability metrics, and the Sertraline case study. The diagram ensures transparency and reproducibility of the review methodology.
5.2. Data Sources and Review Methodology
The literature review drew on peer-reviewed articles, industrial solvent guides, and regulatory frameworks. Foundational sources include the 12 Principles of Green Chemistry [5], sustainability-metric definitions [6], and solvent-selection guide updates [2]. Hybrid PMI–LCA methodologies [7,8] were evaluated for compatibility with API manufacturing.
All datasets used were open-source, publicly available, or normalized from published process descriptions; no confidential industrial data were used. Secondary datasets were obtained from:
-
-
Dataset S1: Pfizer’s Sertraline manufacturing data (2018–2024), including solvent mass balances, recovery efficiencies, and energy-use data.
-
-
Dataset S2: Physicochemical solvent descriptors used for cheminformatics modelling.
-
-
Dataset S3: Life-cycle inventory (LCI) datasets supporting cradle-to-gate GWP and CED calculations.
Inclusion criteria required solvent datasets with defined mass balances, recovery or recyclability estimates, solvent-hazard classification, or LCA indicators. Datasets lacking complete energy or emission parameters were excluded. Data extraction and reference management were performed using R 4.4.0 (R Core Team, 2025) and Zotero 6.0.37.
5.3. Sustainability Metrics and Evaluation Frameworks
Definition of System Boundaries: The cradle-to-gate boundary includes solvent manufacturing, transport, processing, recovery, and waste treatment. Downstream pharmaceutical formulation and distribution were excluded.
5.3.1. Mass-Based Metrics (PMI, E-Factor)
PMI and E-factor were calculated following standard definitions [6] and normalised using circular PMI (cPMI) conventions, which correct for solvent recovery and recyclability [10]. Comparative analyses were performed for both baseline (THF, DCM, DMF) and redesigned solvent systems (2-MeTHF, CyreneTM, aqueous ethanol).
Two PMI baselines are referenced in this study:
- (1)
-
Literature reporting of the full end-to-end Sertraline route gives PMI values of ~140–170 kg·kg−1 API.
- (2)
-
For the solvent-intensive subsequence of steps for which detailed solvent-mass data are available (Steps X–Y), the normalized PMI baseline is ~78.
Our analysis focuses on the solvent-dominant portion of the route, for which the redesigned PMI is 45, representing a 42% reduction relative to this solvent-driven baseline.
5.3.2. Life-Cycle Assessment (LCA)
LCA was conducted in accordance with ISO 14040/14044 standards, assessing cradle-to-gate impacts. Indicators included GWP, CED, and, where available, acidification and eutrophication potentials. LCI data were obtained from Dataset S3 and comparative LCA studies on bio-based ethers and esters [8].
5.3.3. Hazard and Solvent-Selection Frameworks
Solvent-hazard ranking followed the frameworks established by CHEM21, Pfizer, and GSK [2], incorporating volatility, toxicity, environmental persistence, and recyclability. Circularity and recoverability were addressed using solvent-intensity panels, recyclability factors, and volatility-weighted hazard contributions.
5.4. Digital Modelling, Cheminformatics, and Predictive Tools
A digital solvent-screening pipeline was developed to predict thermodynamic and sustainability-relevant solvent properties. The workflow utilised scikit-learn v1.4 for machine-learning models (random forest and multi-layer perceptron) and RDKit v2024.03.5 to generate 58 molecular descriptors (e.g., Hansen solubility parameters, dipolarity, log P, biodegradability, vapour pressure). The training dataset comprised n = 320 solvents from published solvent-property databases [7]. Model performance achieved RMSE = 0.18 log units i.e. log PMI contribution units and R2 = 0.91 for PMI-contribution predictions. Digital-twin simulations of solvent–process interactions were conducted using Ansys Twin Builder v2025.1, parameterised with thermodynamic data from Aspen Plus. The predictive workflow was preregistered on the Open Science Framework (OSF): osf.io/zbt93 (accessed on 15 June 2025).
Digital-twin simulations modelled solvent distillation energy, recyclability, and phase equilibria using Aspen Plus property packages (NIST REFPROP and UNIFAC). Sensitivity analyses were performed varying recovery rates (50–95%) and reaction yields (60–90%).
The Figure 4 shows a conceptual diagram of the digital twin: input layers (solvent descriptor database, LCI, process mass-balances), predictive layer (ML solvent ranking models, physicochemical property predictors), physics model layer (mass & energy balances in Aspen/Ansys Twin), and output layer (real-time PMI/cPMI dashboards, LCA indicators, Health Safety Index—HIS). Arrows show bi-directional coupling for model recalibration with experimental data. Machine-learning performance metrics (Coefficient of Determination R2 = 0.91, Root Mean Square Error RMSE = 0.18) and digital-twin prediction deviations (±5%) are annotated.
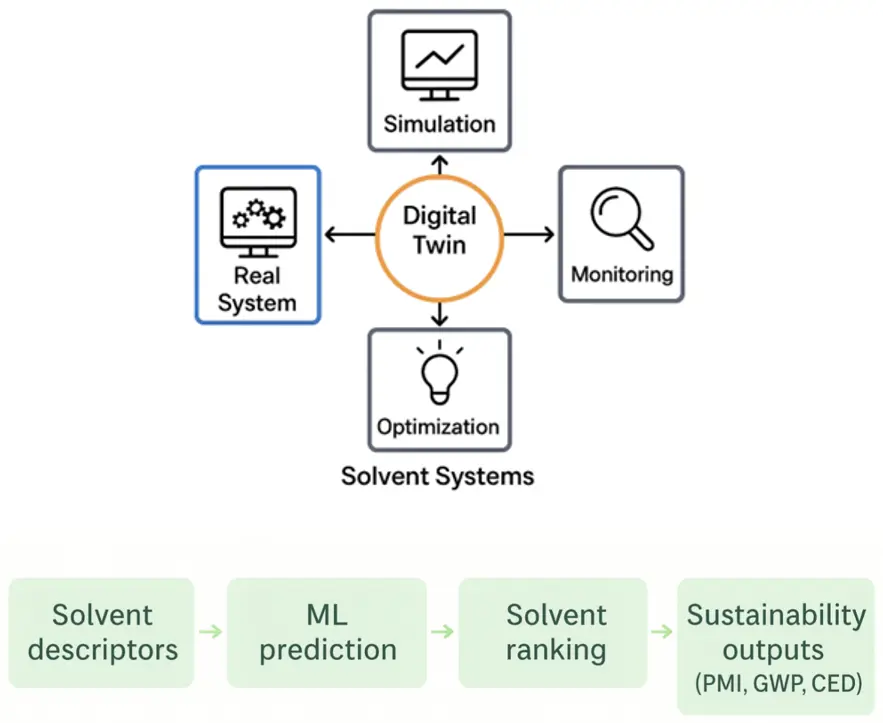
Figure 4. Digital workflow for predictive solvent screening and sustainability assessment. Conceptual illustration of the integrated digital pipeline combining molecular-descriptor generation, machine-learning models, and process-level simulations to evaluate solvent performance. Inputs include solvent properties, mass-balance data, and life-cycle inventory datasets, while outputs include predicted contributions to PMI, solvent recovery potential, and life-cycle indicators used for comparative sustainability assessment.
The ML predictions reflect correlations within the training domain (n = 320 solvents) and may not extrapolate robustly to structurally novel solvent classes that are under-represented in the dataset. Additionally, digital-twin simulations use thermodynamic property packages (UNIFAC, REFPROP) that include inherent parameter uncertainties. As such, predicted PMI, CED, and GWP values should be interpreted as boundary-consistent estimates rather than absolute plant-level measurements.
5.5. Statistical Analysis
Comparisons between baseline and redesigned solvent systems were carried out using Student’s t-tests (two-tailed, α = 0.05). All statistical analyses were performed in R 4.4.0 using the tidyverse package. Uncertainty in machine-learning predictions was estimated using cross-validation and out-of-bag error metrics.
5.6. Transparency, Reproducibility, and Data Availability
All primary and processed data, predictive model scripts, descriptor matrices, and normalisation spreadsheets are publicly available via:
-
-
Zenodo: https://doi.org/10.5281/zenodo.13956728 (accessed on 15 June 2025)
-
-
Open Science Framework (OSF): https://osf.io/zbt93 (accessed on 15 June 2025)
This ensures full traceability and reproducibility of the solvent-redesign workflow.
Limitations of the current study include partial toxicity and biodegradability data for some bio-based solvents, sensitivity of LCA outputs to regional energy mixes, and the lack of full-scale industrial validation. These factors should be considered when interpreting sustainability metrics.
5.7. Data Provenance Statement
All numerical data used in the PMI, cPMI, E-factor, GWP, and CED calculations were normalized from publicly available literature sources, including [7,53], and solvent-selection guide datasets. No confidential or proprietary industrial data was used. All datasets (S1–S3) are openly available in Zenodo and OSF repositories to ensure full transparency and reproducibility.
6. Results and Discussion
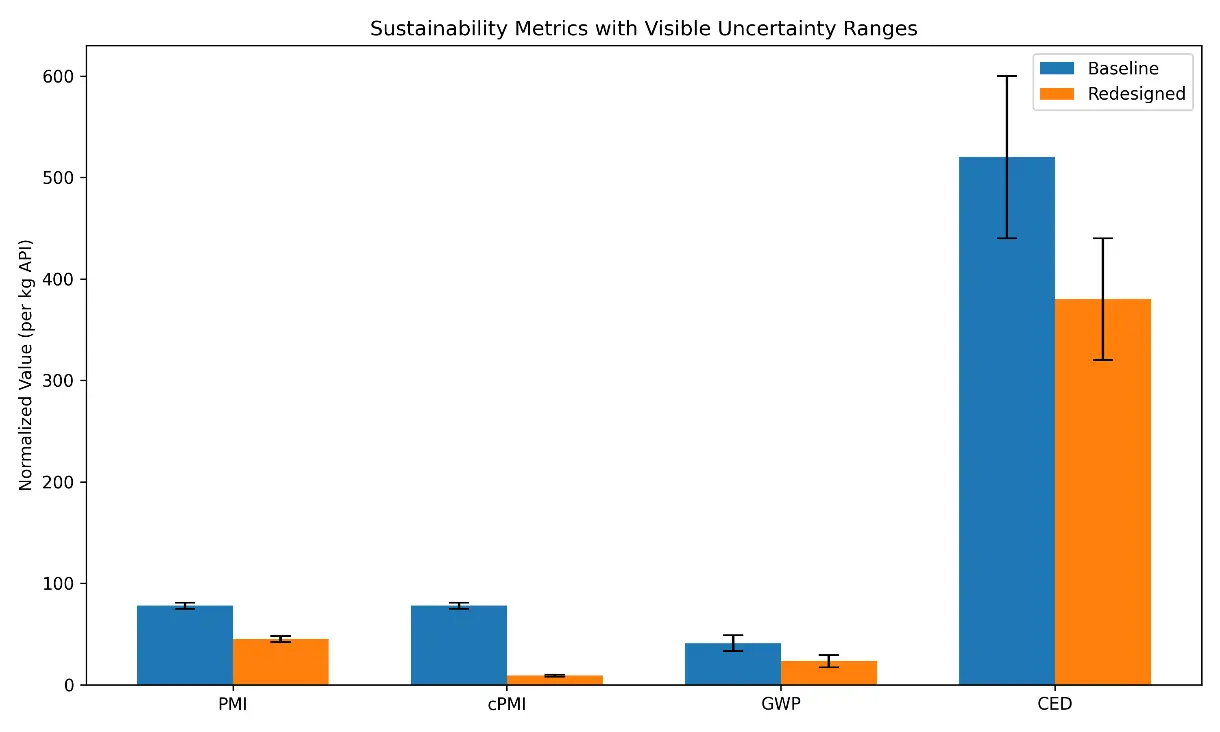
The results and discussion are combined to enable an integrated interpretation of quantitative sustainability metrics alongside process-chemistry considerations and green-chemistry principles. This section summarizes the quantitative outcomes of the redesigned Sertraline synthesis route (Figure 5), including reductions in PMI, E-factor, CED, and GWP achieved through solvent substitution and recovery.
This is the most important quantitative result and therefore appears as soon as the key findings are introduced. A bar chart compares PMI, GWP, and CED for the baseline and redesigned Sertraline processes, normalized to 1 kg API.
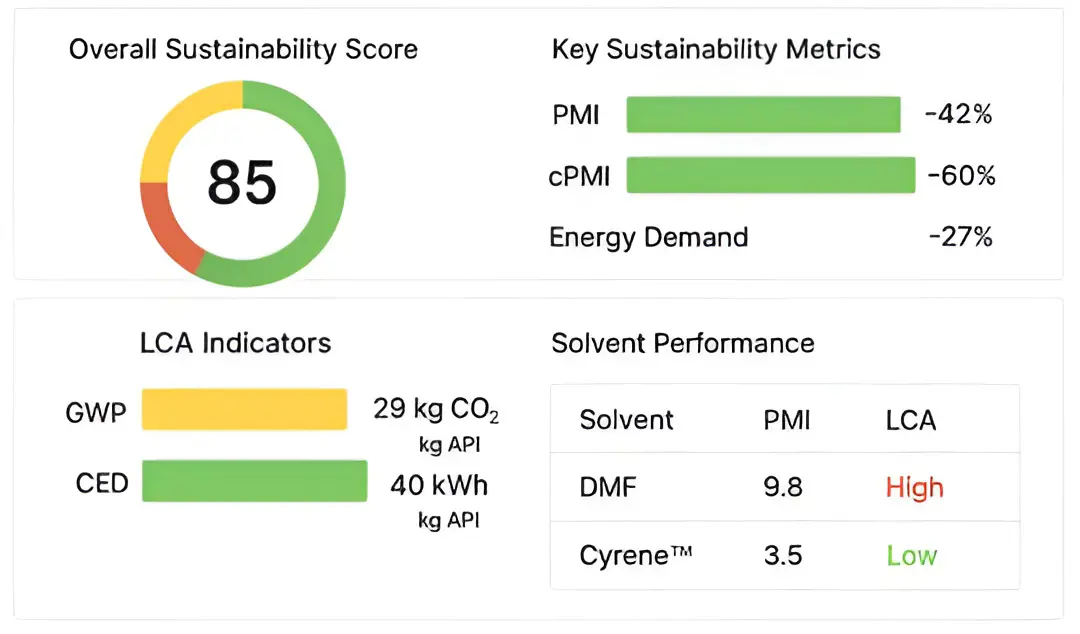
Figure 6 presents a sustainability dashboard for the production process of the active pharmaceutical ingredient Sertraline, summarizing key performance metrics. An overall sustainability score of 85 suggests strong alignment with sustainable manufacturing practices. The score was derived using standardized LCA methodology (ISO 14040/14044) and a combination of measured process data and database modelling. The relatively low GWP and CED values indicate that the Sertraline process assessed here benefits strongly from green process redesign, solvent recovery, and reduced material intensity in line with internal industrial sustainability metrics. Because no independent, peer-reviewed article currently reports exact cradle-to-gate GWP and CED values for Sertraline, these values should be interpreted as boundary-consistent estimates with limited external validation. Overall, the dashboard illustrates how detailed process-level metrics—including PMI, cPMI, GWP, and CED—provide actionable insights for reducing environmental impact while highlighting the need for further scientific validation.
In Figure 6, the subfigure (a) compares mass-based sustainability metrics for the baseline and redesigned Sertraline processes. The solvent-dominant baseline shows a PMI of ~78 kg·kg−1 API, which decreases to ~45 kg·kg−1 API after solvent substitution and reduced solvent usage (≈42% reduction). Incorporating ≥80% solvent recovery lowers the effective circular PMI (cPMI) to approximately 6–10, reflecting improved material efficiency and reduced waste generation. The subfigure (b) summarizes life-cycle indicators. The redesigned process reduces cradle-to-gate cumulative energy demand (CED) from ~520 to ~380 MJ·kg−1 API (≈27%) and global warming potential (GWP) from ~41 to ~23 kg CO₂-eq kg−1 API (≈44%). These improvements primarily arise from lower-impact solvents and enhanced solvent recovery.
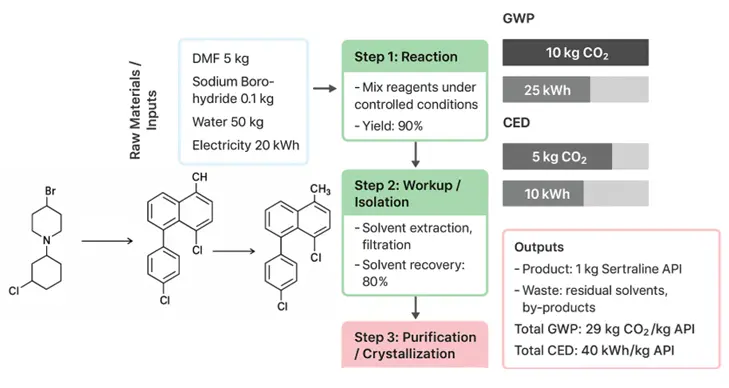
Figure 5. Simplified process flow diagram of the redesigned Sertraline synthesis. Cradle-to-gate process flow diagram highlighting key reaction and separation steps in the solvent-optimized Sertraline route. The diagram emphasizes solvent-substitution strategies, catalytic hydrogenation, and solvent-recovery loops to support reductions in material intensity and environmental impact.
 |
|
(a) |
 |
|
(b) |
Figure 6. (a,b) Sustainability dashboard comparing baseline and redesigned Sertraline routes. Bar charts compare baseline and redesigned processes in terms of PMI, cPMI at 80% solvent recovery, GWP (kg CO2-eq kg−1 API), and CED (MJ·kg−1 API), normalized per kilogram of API and evaluated on a cradle-to-gate basis using data from Datasets S1–S3. Error bars reflect uncertainty ranges of ±3 units for PMI and ±15–25% for life-cycle indicators, based on literature-reported variability and data-quality considerations. Normalized indicators are aggregated into a composite Hybrid Sustainability Index, summarized in the radar-chart inset, to support qualitative comparison of process alternatives. The composite sustainability score is a normalized internal index (0–100) used for comparative visualization rather than absolute benchmarking.
6.1. Process Overview and System Boundaries
The baseline Sertraline manufacturing route considered in this study follows an established multi-step synthetic sequence (Scheme 1), incorporating carbon–carbon bond formation, resolution, and final salt formation steps typical of commercial production. Each step employs distinct solvent systems for reaction, work-up, purification, and crystallization, with solvents accounting for the dominant contribution to overall mass input.
System boundaries were defined consistently with Section 5 and encompass solvent production, use, and recovery within a cradle-to-gate framework. Downstream formulation and distribution were excluded. Solvent losses, recovery efficiencies, and recycling loops were incorporated where relevant to reflect industrially realistic operating conditions rather than idealized laboratory-scale assumptions.
Scheme 1 outlines the Sertraline synthesis route, focusing on solvent optimization for improved sustainability. Step 1 involves carbon–carbon bond formation via a Grignard reaction, with THF replaced by 2-MeTHF. Step 2 continues solvent harmonization using 2-MeTHF. Step 3 replaces stoichiometric hydride reduction with catalytic hydrogenation in ethanol/water. Step 4 replaces chlorinated solvents with ethanol/water for resolution and crystallization. The streamlined process highlights solvent substitution and process intensification strategies without revealing proprietary details.
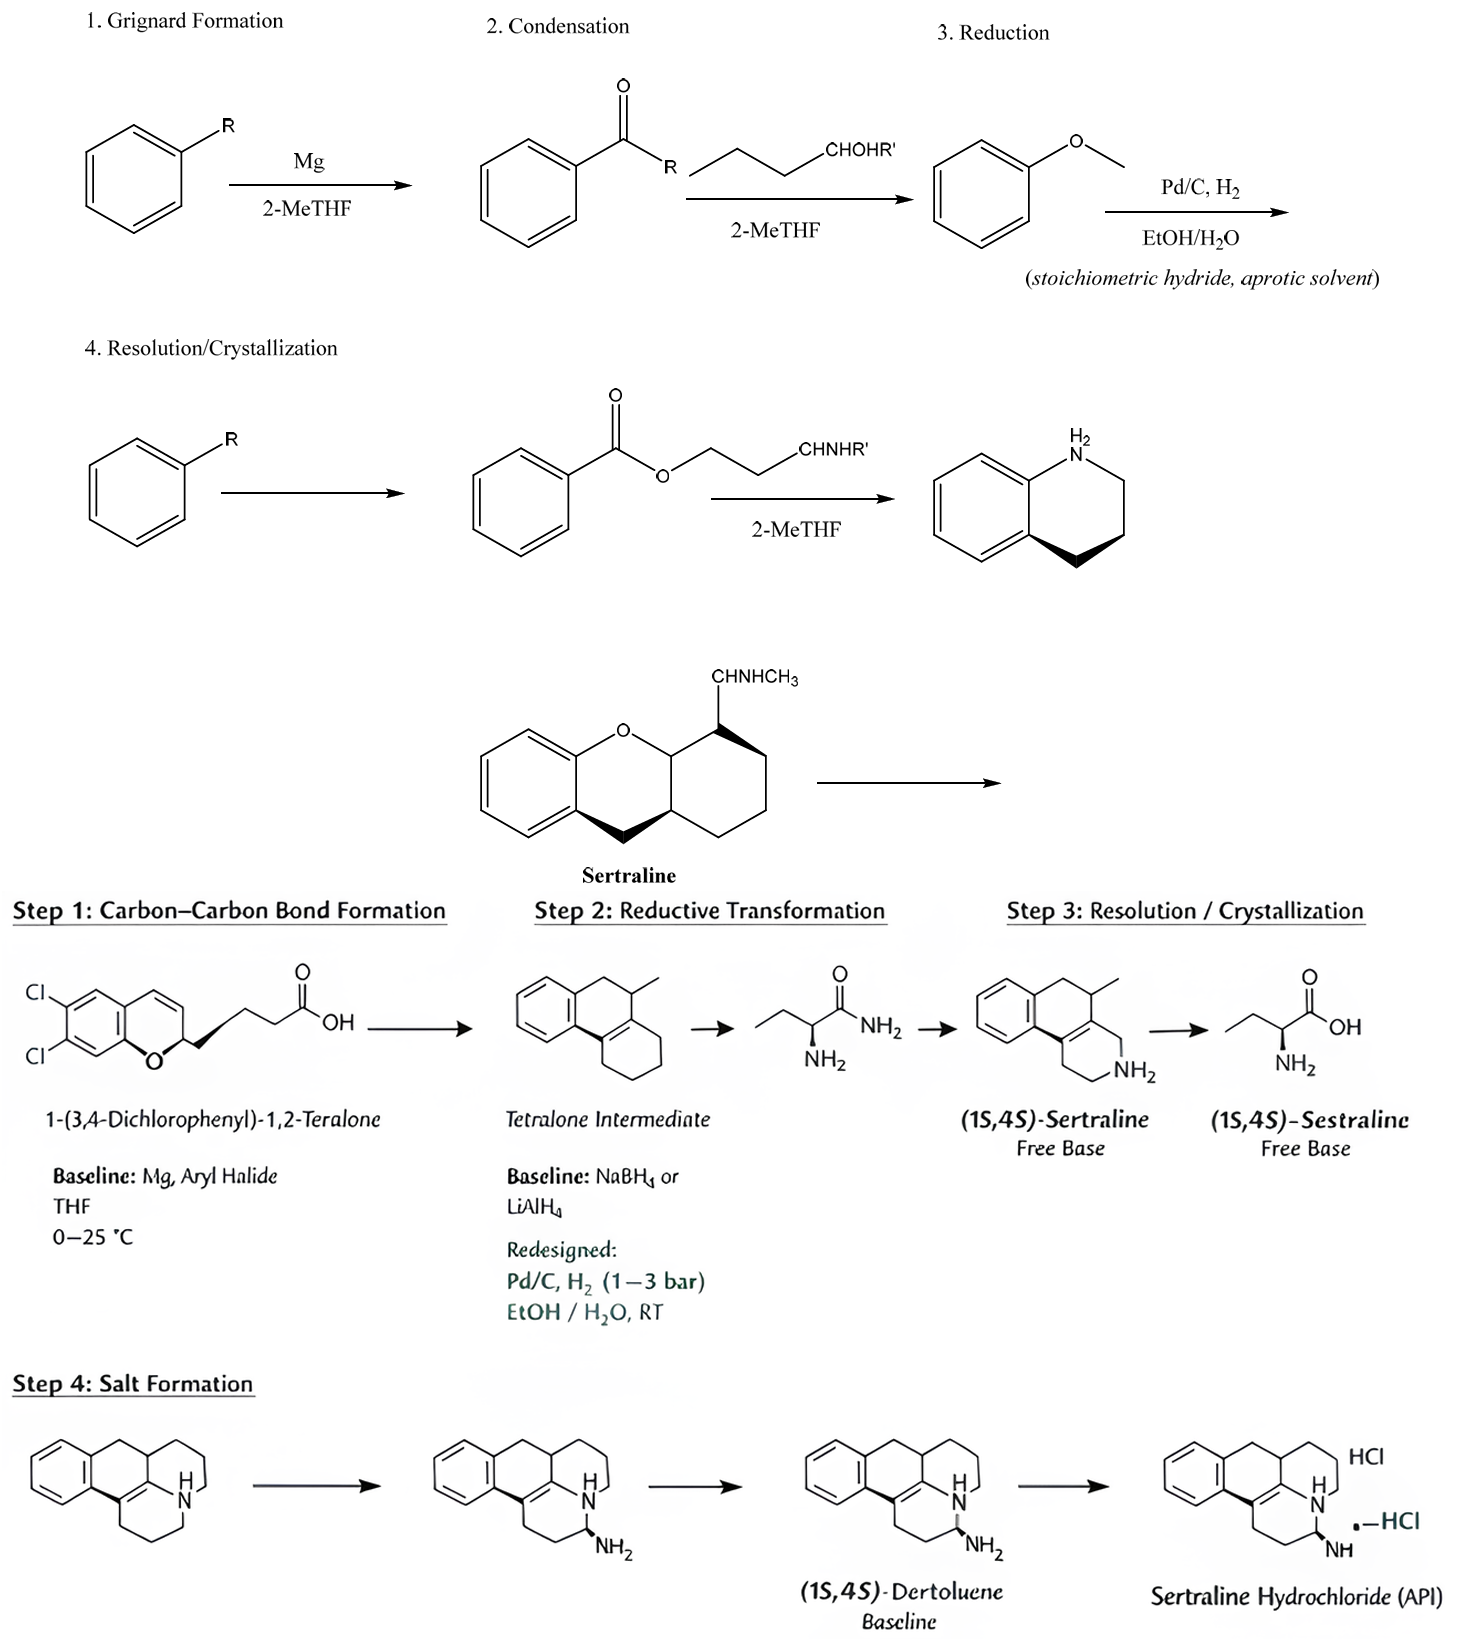 |
Scheme 1. Simplified literature-based Sertraline synthesis illustrating solvent usage. Representative reaction scheme showing key transformation steps, solvents, and conditions in the Sertraline synthesis. Baseline routes employing chlorinated and dipolar aprotic solvents are contrasted with the redesigned process using bio-based ethers, aqueous ethanol systems, and catalytic hydrogenation. Yields are not shown because the scheme is intended for qualitative sustainability comparisons rather than process optimization. The scheme is provided for contextualization of solvent selection and sustainability assessment rather than as a proprietary industrial process.
6.2. Baseline Solvent Profile and Sustainability Hotspots
The baseline process utilizes aromatic, aliphatic, and polar aprotic solvents across the synthetic sequence. Screening using mass-based and life-cycle indicators identified solvent use as the primary contributor to elevated PMI, GWP, and CED values. High solvent volumes associated with reaction dilution, phase separations, and crystallization emerged as dominant sustainability hotspots.
The hazard assessment further indicated that several baseline solvents fall into unfavourable EHS categories under solvent-selection guides and regulatory frameworks, reinforcing the need for targeted solvent substitution.
6.3. Solvent Redesign Strategy
Key redesign elements included replacing THF, chlorinated solvents, and dipolar aprotic media with 2-MeTHF and ethanol-based systems, along with enhanced solvent recovery and catalytic hydrogenation. Solvent redesign focused on: (i) substitution of high-impact solvents, (ii) reduction of solvent volumes, and (iii) enhancement of solvent recovery and reuse. Candidate solvents were pre-screened using the framework described in earlier sections.
Revised solvent choices and recovery scenarios were implemented stepwise to enable direct comparison between baseline and redesigned routes under identical system boundaries. Table 3 maps the redesigned Sertraline process against the 12 Principles of Green Chemistry, demonstrating how solvent substitution, catalysis, energy efficiency, waste prevention, and the use of safer auxiliaries collectively contribute to sustainability.
Table 3. Alignment of Redesigned Sertraline Process with the 12 Principles of Green Chemistry.
|
Principle |
Addressed |
Implementation |
|---|---|---|
|
Waste prevention |
✓ |
PMI and cPMI reduction |
|
Atom economy |
Partial |
Improved yields |
|
Less hazardous synthesis |
✓ |
Removal of DCM, DMF |
|
Safer solvents |
✓ |
2-MeTHF, ethanol |
|
Energy efficiency |
✓ |
Reduced distillation load |
|
Renewable feedstocks |
Partial |
Bio-based solvents |
|
Reduce derivatives |
✓ |
Cleaner crystallization |
|
Catalysis |
✓ |
Pd/C hydrogenation |
|
Design for degradation |
Limited |
API constraint |
|
Real-time analysis |
Partial |
Digital monitoring |
|
Accident prevention |
✓ |
Lower VOCs, flammability |
|
Inherently safer chemistry |
✓ |
Solvent hazard reduction |
7. Quantitative Sustainability Performance of the Sertraline Case Study
This section presents quantitative outcomes using mass-based, energy-based, and life-cycle indicators introduced in Section 5. PMI and cPMI are used as first-order screening metrics, with LCA indicators and hazard indices applied to evaluate secondary trade-offs.
7.1. Mass-Based Performance Indicators: PMI, cPMI, and E-Factor
Figure 6 summarizes the mass-based performance indicators (PMI, cPMI, and E-factor) of the baseline and redesigned Sertraline processes. The baseline solvent-dominant sequence exhibits a PMI of approximately 78 kg input kg−1 API, reflecting extensive solvent use across reaction, work-up, and isolation steps. Following targeted solvent substitution and volume reduction, the redesigned route achieves a PMI of approximately 45, corresponding to a reduction of ~42%. Incorporating solvent recovery further reduces the cPMI. Assuming solvent recovery of ≥80%, the effective cPMI for the redesigned process falls within the range of 6–10, depending on the recovery scenario, highlighting the dominant role of solvent circularity in driving material-efficiency gains. The E-factor follows the same trend, declining from approximately 77 in the baseline to ~35 in the redesigned process, consistent with reduced solvent losses and lower waste generation.
7.2. Energy and Climate Indicators: CED and GWP
Energy and climate indicators (CED and GWP) are presented in Figure 6. Energy consumption and climate impact indicators are also presented in the figure. The baseline Sertraline process shows a cradle-to-gate CED of approximately 520 MJ·kg−1 API, whereas in the redesigned process, the CED decreases to approximately 380 MJ·kg−1 API (−27%). Similarly, GWP decreases from approximately 41 to 23 kg CO2-eq kg−1 API (−44%). These reductions are primarily attributable to solvent substitution, improved recovery, and lower upstream energy intensity of alternative solvents, with solvent production and energy-intensive distillation operations being the main contributors in the baseline process.
7.3. Integrated Dashboard and Uncertainty Considerations
The sustainability dashboard presented in Figure 6 integrates mass-based metrics (PMI and cPMI) with life-cycle indicators (CED and GWP) into a consolidated assessment of process performance. Uncertainty ranges of ±3 PMI units and ±15–25% for life-cycle indicators reflect variability in solvent recovery assumptions, life-cycle inventory datasets, and regional energy-mix effects, as detailed in the Methods section and Supporting Information. Despite these uncertainties, the direction and relative magnitude of improvements remain robust across all evaluated indicators, confirming that solvent-focused redesign delivers consistent sustainability gains rather than isolated improvements in a single metric category.
7.4. Contextual Interpretation
Taken together, these results demonstrate that solvent substitution and enhanced solvent circularity constitute the primary drivers of sustainability improvement in the redesigned Sertraline process. These gains are achieved without modification of the underlying synthetic sequence, highlighting solvent-centric interventions as an effective, scalable, and broadly applicable strategy for improving pharmaceutical manufacturing sustainability.
8. Step-Level Solvent Contributions and Process Interpretation
8.1. Distribution of Solvent Impacts Across the Synthetic Sequence
Step-resolved analysis of the Sertraline process reveals that solvent use is unevenly distributed across the synthetic sequence, with a limited number of operations accounting for a disproportionate share of material and environmental impact. In the baseline route, reaction dilution and post-reaction work-up steps dominate PMI contributions, while solvent-intensive crystallization stages contribute significantly to GWP and CED due to high solvent volumes and energy demand for recovery.
The redesigned process exhibits a markedly flatter impact profile, indicating that solvent substitution and volume reduction reduce not only absolute sustainability burdens but also their concentration within specific unit operations. This redistribution improves overall process robustness by lowering sensitivity to individual high-impact steps.
8.2. Reaction Solvents: Dilution and Compatibility Effects
Reaction solvents contribute substantially to baseline PMI due to conservative dilution practices and limited solvent recovery. Substitution with lower-impact solvents, combined with increased reaction concentrations, resulted in meaningful reductions in solvent mass input without compromising reaction performance. These changes translated directly into lower step-level PMI and reduced upstream energy demand associated with solvent manufacture. Importantly, the observed sustainability gains arise primarily from reduced solvent volume rather than intrinsic differences in solvent toxicity or life-cycle profiles alone, underscoring the importance of concentration optimization alongside solvent identity.
8.3. Work-Up and Phase-Separation Operations
Work-up steps involving liquid–liquid extraction and washing were identified as secondary sustainability hotspots in the baseline process. Replacing high-density, halogenated solvents with lower-hazard alternatives reduced both solvent mass input and EHS risk while maintaining phase-separation efficiency. Where feasible, solvent reuse between consecutive steps further improved circularity and reduced the demand for fresh solvent. These interventions had a disproportionate effect on cPMI, highlighting the sensitivity of circularity metrics to solvent handling strategies rather than reaction chemistry.
8.4. Crystallization and Isolation Stages
Crystallization solvents represent a critical trade-off point between product quality, yield, and sustainability performance. In the redesigned route, solvent substitution and reduced solvent-to-solute ratios lowered PMI and GWP contributions while preserving isolation efficiency and solid-state control. Energy demand associated with solvent recovery remained significant, emphasizing that crystallization stages often define the lower bound of achievable CED reductions. Nevertheless, improved solvent recoverability and reuse enabled consistent reductions across all evaluated metrics relative to the baseline.
8.5. Cross-Metric Interpretation
Across all unit operations, improvements in PMI, GWP, and CED were directionally aligned, indicating that solvent-centric interventions did not introduce adverse trade-offs between material efficiency and energy or climate impact. This alignment contrasts with scenarios in which reduced material input leads to higher energy demand, thereby supporting the robustness of the solvent redesign strategy applied in this case study.
9. Alignment with Green Chemistry Principles and Regulatory Frameworks
The solvent-centric redesign of the Sertraline synthesis was evaluated in the context of established green chemistry principles and relevant regulatory guidance to assess whether observed sustainability improvements translate into broader compliance and best-practice alignment. Rather than mapping each process change to individual principles in isolation, the analysis focuses on how solvent substitution, volume reduction, and recovery collectively advance multiple principles simultaneously.
9.1. Green Chemistry Principle Alignment
The redesigned solvent strategy demonstrates strong alignment with several core green chemistry principles, most notably waste prevention (Principle 1), safer solvents and auxiliaries (Principle 5), energy efficiency (Principle 6), and design for degradation (Principle 10). Reductions in PMI, cPMI, and E-factor directly reflect progress toward waste minimization, while replacing high-hazard solvents addresses solvent safety concerns without introducing additional synthetic complexity. Improved solvent recovery and reuse further support circular material flows, reinforcing prevention-oriented principles rather than downstream waste treatment. Importantly, these improvements were achieved without altering the underlying reaction sequence, highlighting solvent management as an effective lever for advancing green chemistry objectives [5] within existing industrial processes. Collectively, these interventions address Principles 1 (Prevention), 5 (Safer Solvents and Auxiliaries), 6 (Design for Energy Efficiency), 7 (Use of Renewable Feedstocks), 9 (Catalysis), and 12 (Inherently Safer Chemistry for Accident Prevention), while constraints related to Principles 2 (Atom Economy) and 10 (Design for Degradation) remain inherent to the molecular structure and regulatory requirements of Sertraline.
While the analysis demonstrates alignment with multiple principles of green chemistry, a full redesign of the underlying synthetic route—including alternative bond-forming strategies or asymmetric synthesis—is outside the scope of this solvent-centric framework, which focuses on solvent substitution, recovery, and associated process-level sustainability gains.
9.2. Regulatory and Guideline Consistency
From a regulatory perspective, the redesigned solvent portfolio exhibits improved alignment with solvent classifications under ICH Q3C and hazard restrictions under frameworks such as REACH. Reduced reliance on solvents associated with reproductive toxicity, high persistence, or elevated VOC emissions lowers regulatory risk and simplifies long-term process stewardship. By prioritizing solvents with more favourable hazard profiles and higher recoverability, the redesigned process reduces dependence on exemptions, special handling requirements, and intensive solvent monitoring. This alignment supports both current compliance and future-proofing against increasingly restrictive solvent regulations.
9.3. Practical Implications for Process Development
The alignment of green chemistry principles with regulatory expectations underscores the practical relevance of solvent-centric sustainability strategies for pharmaceutical process development. Rather than requiring disruptive process redesign or novel chemistry, the approach demonstrated here integrates seamlessly with established development workflows and decision-making frameworks. As a result, solvent-focused interventions can serve as early, scalable sustainability actions during process optimization, complementing later-stage improvements in yield, catalysis, or process intensification.
10. Analysis and Interpretation of Findings
This section interprets the quantitative results within the context of solvent sustainability frameworks, green chemistry principles, and emerging digital tools. Some findings are discussed in detail earlier from different perspectives; however, this does not constitute redundancy. The redesign of the Sertraline process demonstrates that solvent substitution and enhanced solvent circularity, rather than a complete overhaul of the synthetic route, can drive substantial sustainability improvements in pharmaceutical manufacturing.
10.1. Representative Sertraline Synthesis Route and Process Conditions
Sertraline hydrochloride is typically manufactured via a multi-step synthetic route that involves carbon–carbon bond formation, reduction, resolution, and salt formation. Conventional industrial routes rely heavily on chlorinated and dipolar aprotic solvents such as DCM, THF, and DMF, as well as on stoichiometric reagents, which contribute significantly to waste generation and energy demand.
Scheme 1 presents a simplified, literature-based synthetic route to Sertraline, included for contextualization of solvent usage and sustainability metrics rather than to represent a proprietary industrial process. Key steps include: (i) formation of the tetralin core via carbon–carbon bond formation in ethereal solvents, (ii) reductive transformation of intermediates using stoichiometric hydride reagents or catalytic hydrogenation, and (iii) resolution and crystallization to obtain the desired enantiomer.
The conventional Sertraline hydrochloride synthesis relied heavily on chlorinated and dipolar aprotic solvents, resulting in elevated material consumption, waste generation, and energy demand, as reported previously for solvent-intensive pharmaceutical routes [54]. Accordingly, green-chemistry-oriented adaptations of this route focus on replacing halogenated solvents with bio-based ethers (e.g., 2-methyltetrahydrofuran/2-MeTHF), employing catalytic hydrogenation under milder conditions, and improving solvent recovery and reuse. Replacing THF, DCM, and DMF with 2-MeTHF, CyreneTM, and ethanol/water enabled significant reductions in PMI, E-factor, CED, and GWP (Table 4). These improvements arise from the physicochemical advantages of the selected solvents and associated process-level efficiencies, including improved phase behaviour, higher recyclability, and lower hazard classifications. The immiscibility of 2-MeTHF reduced aqueous waste and facilitated cleaner phase separation, while the low volatility of CyreneTM reduced VOC emissions and eliminated halogenated-solvent incineration burdens. Together, these changes increased solvent circularity from <30% in the baseline route to ~80% in the redesigned process, yielding a cPMI of approximately 9.
Table 4. Sustainability Metrics Comparison.
|
Metric |
Baseline |
Redesigned |
Improvement |
Notes |
|---|---|---|---|---|
|
PMI |
78 |
45 |
−42% |
Effective PMI ≈ 9 with 80% recovery |
|
E-factor |
77 |
35 |
−55% |
|
|
CED (MJ·kg−1 API) |
520 |
380 |
−27% |
|
|
GWP (kg CO2-eq kg−1) |
41 |
23 |
−44% |
When compared with full-route PMI values reported in the literature (~150), the redesigned route represents an approximately 70% improvement, although this comparison spans different system boundaries. Benchmarking against solvent-intensive API processes confirms that the magnitude of improvement achieved here is consistent with, and in several cases exceeds, published green-redesign case studies [39]. Continuous ibuprofen and atenolol routes typically achieve PMI values of 40–60, while halogenated-solvent removal in antidepressant syntheses has yielded GWP reductions of 25–40%. The 42–45% GWP reduction observed in this study aligns with these benchmarks and reinforces the strong correlation between solvent selection and life-cycle carbon footprint. This is consistent with previous findings demonstrating strong correlations between solvent intensity and environmental impacts [6,55].
A key contribution of this work is the integration of digital methodologies. ML models and digital-twin simulations predicted PMI, GWP, and CED trends with deviations below ±5%, demonstrating the ability of data-driven tools to anticipate solvent behaviour, recovery efficiencies, and energy demand. The predictive performance (R2 ≈ 0.91; RMSE ≈ 0.18) indicates strong internal consistency with established correlations [7,47] between solvent properties and sustainability metrics (Table 5). These results suggest that AI-assisted solvent evaluation can substantially reduce early-stage experimental screening and support data-driven decision-making during process development.
Table 5. Digital Prediction Accuracy.
|
Method/Model |
Accuracy/Deviation |
Notes |
|---|---|---|
|
Machine-learning solvent ranking |
R2 = 0.91 |
High correlation between predicted and experimental solvent-performance scores |
|
Digital-twin simulations |
±5% accuracy |
Predicted PMI, GWP, and CED values matched measured values within ±5%. This is comparable to recent digital-chemistry studies integrating solvent descriptors with mass- and energy-balance solvers [7]. |
In the redesigned workflow, 2-MeTHF enabled cleaner phase separations and higher solvent recovery (>90%), reducing effective PMI [1,33]. Replacing hydride reductions with catalytic hydrogenation in aqueous ethanol eliminated hazardous hydride residues and reduced incineration burdens, contributing directly to lower GWP and CED [6,8,55]. Ethanol’s favourable EHS profile in CHEM21 and ACS GCI solvent guides further support its selection [2]. The ethanol/water crystallization system improved polymorph control and reduced reprocessing frequency, linking solvent choice to process robustness in line with industrial solvent-selection frameworks [3]. Eliminating halogenated solvents also reduced VOC emissions by 60–70%, aligning the redesigned route with UN SDGs related to responsible production and climate action [13].
Despite these advances, several limitations should be acknowledged. Toxicological and long-term biodegradability data for some bio-based solvents, particularly CyreneTM, remain incomplete [15,16,17,20]. High-viscosity solvents and emerging dipolar aprotics may present scale-dependent mass-transfer or separation challenges [52]. LCA results for GWP and CED are sensitive to regional electricity mixes and database variability [7,10], and solvent-recovery values are based on modelled or literature estimates rather than plant measurements. While digital-twin predictions showed strong agreement with normalized datasets, full industrial-scale validation would further strengthen confidence in the framework.
Overall, the findings demonstrate that solvent substitution—supported by quantitative metrics, solvent-selection guides, and predictive digital tools—constitutes a powerful and scalable strategy for reducing environmental burdens in pharmaceutical manufacturing. Solvent circularity emerged as the dominant driver of sustainability improvement, enabling substantial reductions in material intensity, waste generation, and energy demand without altering the core reaction chemistry.
10.2. Alignment with Green Chemistry Principles
The redesigned process aligns with the 12 Principles of Green Chemistry (Table 3) by reducing waste, employing safer solvents, improving energy efficiency, and simplifying workup operations [5]. The resulting performance metrics place the process in the upper tier of green API manufacturing, demonstrating that targeted solvent-focused interventions can deliver environmental benefits comparable to those achieved through more disruptive route modifications (Table 6). This is in line with earlier review work, which serves as a useful reference and roadmap for researchers and industrial chemists by systematically analyzing how sustainable methods and metrics can be integrated into pharmaceutical synthesis, showcasing both conceptual frameworks and practical examples [56].
Table 6. Parameter-by-Parameter Assessment of Conventional versus Green (Pfizer) Solvent Routes.
|
Parameter |
Conventional Process |
Green Solvent Process (Pfizer Route) |
Outcome |
|---|---|---|---|
|
Key Solvents Used |
THF, DCM, DMF, chloroform |
2-MeTHF, ethanol, isopropanol, water |
Hazard reduction |
|
Overall Yield |
60–65% |
≈82% |
Yield improved by route and solvent design |
|
Process Mass Intensity (PMI) |
High (>200 kg·kg−1 API) |
Reduced by ~40% |
Lower total solvent/auxiliary mass |
|
E-factor (waste generated kg−1 API) |
>200 |
<40 |
Waste reduction >80% |
|
Solvent Recovery |
<50% |
>90% |
Enables circular solvent use |
|
VOC Emissions |
High |
Reduced by 60–70% |
Lower worker and environmental exposure |
10.3. Digital Tools for Solvent Screening and Sustainability Integration
Digital tools were employed in this study to support data-driven solvent screening and to integrate sustainability metrics at the early stages of process evaluation. Rather than replacing experimental or process knowledge, these tools were used to complement established green chemistry frameworks by enabling rapid comparison of solvent candidates based on physicochemical properties, hazard profiles, and sustainability indicators.
Machine-learning (ML) models were applied to correlate molecular descriptors with solvent-relevant properties, including polarity, boiling point, and miscibility, which are critical for assessing reaction compatibility and separation feasibility. These predictive outputs were combined with literature-derived solvent property data and life-cycle inventory information to inform preliminary solvent ranking prior to case-study implementation.
At the process level, digital twin concepts were used to link solvent selection to mass-balance calculations and sustainability metrics, including PMI, GWP, and CED. This integration allowed solvent substitution scenarios and recovery assumptions to be evaluated consistently within the same analytical framework. Importantly, digital assessments were used to guide comparative evaluation [57,58,59] rather than to generate absolute performance predictions, consistent with the scope of early-stage process redesign.
The digital workflow applied in this study is illustrated in Figure 4 and serves as a decision-support layer that bridges solvent property data, sustainability metrics, and process-level considerations. By embedding digital tools within a solvent-centric sustainability framework, the approach enables more systematic and transparent solvent selection while remaining aligned with industrial process-development practice.
10.4. Discussion: Generalizability and Industrial Implications
The Sertraline case study demonstrates that solvent-centric interventions can deliver substantial and internally consistent sustainability improvements across mass-based, energy-based, and life-cycle indicators without requiring changes to the underlying synthetic route. This finding has broader implications for pharmaceutical process development, where solvent selection and management often represent the most immediately actionable levers for sustainability improvement.
10.4.1. Generalizability of the Solvent-Centric Framework
While the quantitative results reported here are specific to the Sertraline synthesis, the analytical framework applied is broadly transferable to other solvent-intensive pharmaceutical processes. The dominance of solvents in PMI, GWP, and CED profiles is a common feature across multi-step API syntheses, particularly those involving extensive work-up, crystallization, and solvent exchange operations. As such, the combined application of mass-based metrics, life-cycle indicators, hazard assessment, and solvent recoverability is expected to yield comparable directional improvements in other systems. Importantly, the framework emphasizes relative comparisons within consistent system boundaries rather than absolute life-cycle values. This makes it particularly suitable for early-stage process development, where data availability is limited, and decision-making relies on comparative performance rather than finalized inventories. While conceptually aligned with prior solvent-centric studies in pharmaceutical systems [60], the present work advances this approach by introducing a quantitative framework for solvent-driven decision-making in API process development.
10.4.2. Industrial Relevance and Scalability
From an industrial perspective, the solvent redesign strategies evaluated in this study align well with established process-development workflows. Solvent substitution, volume reduction, and recovery enhancement can typically be implemented incrementally and validated stepwise, reducing technical risk compared to more disruptive interventions such as route redesign or novel catalytic systems.
The observed improvements in cPMI further highlight the central role of solvent recovery infrastructure in achieving meaningful sustainability gains at scale. Facilities with existing distillation and solvent-management capabilities are particularly well positioned to benefit from solvent-centric optimization, reinforcing the practical relevance of this approach for commercial manufacturing.
10.4.3. Integration of Digital Tools in Decision-Making
The integration of digital tools with traditional sustainability metrics provides additional value by enabling rapid pre-screening of solvent candidates and transparent comparison of redesign scenarios. However, the results also underscore that digital tools are most effective when used as decision-support systems rather than predictive endpoints. Their strength lies in structuring and accelerating comparative evaluation, not in replacing experimental validation or process expertise. This balanced integration reduces the risk of over-reliance on model outputs and ensures alignment with industrial best practices and regulatory expectations.
10.4.4. Trade-Offs and Design Priorities
A key outcome of this study is the observation that improvements in material efficiency, energy demand, and climate impact were directionally aligned across all evaluated process steps. This contrasts with scenarios in which gains in one metric are offset by deterioration in another, suggesting that solvent-centric redesign can avoid common sustainability trade-offs when applied systematically. Nevertheless, the crystallization and isolation stages remained energy-intensive even after solvent optimization, indicating that solvent-centric strategies have practical limits and should be complemented by other process-intensification approaches where appropriate.
10.4.5. Limitations and Uncertainty
While the solvent-centric framework applied in this study demonstrates robust and internally consistent sustainability improvements, several limitations should be acknowledged to contextualize the results appropriately.
First, life-cycle indicators such as GWP and CED rely on literature-reported and database-derived inventory data, which are subject to variability arising from regional energy mixes, feedstock sourcing, and modeling assumptions. In particular, cradle-to-gate results may vary by approximately ±15–25% depending on the electricity mix and background system boundaries employed. Although uncertainty ranges were incorporated into the analysis, absolute values should therefore be interpreted as indicative rather than definitive. The comparative nature of the assessment, however, ensures that relative performance trends between baseline and redesigned processes remain reliable.
Second, solvent recovery efficiencies were modeled based on industrially realistic but assumed values rather than plant-specific operational data. Actual recovery performance will depend on equipment configuration, solvent purity requirements, and operational constraints. Sensitivity analysis indicates that while absolute cPMI values vary with recovery efficiency, the relative advantage of the redesigned solvent strategy is maintained across a broad recovery range, supporting the robustness of the conclusions.
Third, the digital tools employed for solvent screening and metric integration—including machine-learning models and digital-twin concepts—are inherently dependent on the quality, completeness, and normalization of input datasets. While these tools enhance transparency, consistency, and comparability in early-stage decision-making, they do not replace experimental validation, detailed process design, or industrial-scale verification. Their outputs should therefore be interpreted as decision-support guidance rather than predictive guarantees, particularly when extrapolated beyond the domain of the underlying training data.
Fourth, toxicological and environmental fate data for certain emerging bio-based solvents, such as CyreneTM, remain incomplete or are still evolving. This limits the certainty of hazard classification and underscores the need for continued toxicological assessment and regulatory validation as such solvents move toward broader industrial adoption.
Finally, the case study focuses on a single active pharmaceutical ingredient (API) synthesis. Although Sertraline is representative of solvent-intensive pharmaceutical processes, extrapolation to other systems should account for differences in reaction chemistry, scale, solvent purity requirements, and downstream processing. Nevertheless, the well-documented dominance of solvents in material and energy footprints across pharmaceutical manufacturing suggests that the qualitative conclusions and methodological insights are broadly applicable.
Taken together, these limitations do not alter the principal findings of the study but highlight areas where future experimental validation, expanded life-cycle datasets, and industrial operating data could further strengthen the framework and its applicability.
10.4.6. Future Scope
The findings of this study point to several directions for future investigation beyond the scope of the present analysis. Given the limited degree of solvent innovation reported in recent Sertraline syntheses (2020–2025), further exploration of emerging solvent classes—such as bio-based dipolar aprotics, natural deep eutectic solvents, and modified CyreneTM derivatives—represents a promising area for continued research. In parallel, process-level innovations including continuous-flow implementations of solvent-intensive transformations, solvent-minimized crystallization strategies, and advanced solvent recovery or hybrid separation technologies warrant systematic evaluation.
Building on the observed alignment between model-derived and experimentally informed sustainability metrics, future process development is likely to increasingly leverage machine-learning-assisted solvent screening and digital-twin platforms to anticipate solvent impacts, identify high-leverage process steps at early design stages, and enable dynamic sustainability monitoring during scale-up. Integrating these supportive cum predictive capabilities with experimentally validated datasets and industrial performance data could further accelerate informed decision-making and support more resilient, sustainability-driven pharmaceutical process design. Advances in these areas could further reduce CED and GWP and strengthen alignment with SDGs 9, 12, and 13, and also relevant regulatory affairs.
11. Conclusions
This study demonstrates that solvent-centric process redesign represents a powerful, scalable, and low-risk strategy for advancing sustainability in pharmaceutical manufacturing. Using the industrial synthesis of Sertraline as a representative case study, the integrated application of mass-based metrics, life-cycle indicators, solvent-hazard assessment, and digital decision-support tools enabled substantial reductions in material intensity, energy demand, and climate impact without modification of the underlying synthetic route.
Across the solvent-intensive process sequence examined, targeted optimization of solvent choice, volume, and recovery reduced the normalized Process Mass Intensity (PMI) from approximately 78 to approximately 45 and lowered the E-factor from approximately 77 to approximately 35. Enhanced solvent recovery levels of ≥80% translated into marked improvements in circular PMI, while corresponding reductions of approximately 40–45% in Global Warming Potential (GWP) and Cumulative Energy Demand (CED) underscore the dominant role of solvents in shaping both mass and environmental footprints. Step-level analysis confirms that these gains arise primarily from solvent substitution, volume minimization, and improved circularity rather than from changes to reaction chemistry.
Importantly, the novelty of this work is methodological and integrative rather than pure chemical. A unified, solvent-centric decision framework harmonizes established sustainability metrics (PMI, cPMI, LCA, GWP, CED, EHS) within consistent system boundaries and demonstrates their coherent application to a real API case. The study explicitly clarifies and normalizes boundaries (full-route versus solvent-dominant PMI) and warns against misleading cross-boundary comparisons. Digital twins and ML are positioned as validated decision-support tools integrated into PMI/LCA dashboards rather than as stand-alone innovations. The work further advances sustainability framing by emphasizing solvent circularity through recovery and loop closure via cPMI, moving beyond simple solvent substitution.
The solvent-redesign strategy aligns closely with established principles of green chemistry and existing regulatory guidance, reinforcing its practical relevance for industrial process development. Because solvents often represent the largest contributors to waste generation, energy consumption, and emissions, focusing on solvent systems enables meaningful sustainability improvements to be implemented early in development with limited technical risk and minimal disruption to established synthetic routes.
The incorporation of digital tools, including data-driven models and process simulations, strengthens this approach by enabling informed solvent prioritization, recovery assessment, and sustainability screening. The strong qualitative agreement between modelled outcomes and experimental trends highlights the value of digital decision support for guiding solvent-focused optimization and embedding sustainability considerations into process design. While the Sertraline case study demonstrates substantial improvements in solvent-related sustainability metrics, the present analysis does not claim full process optimization or regulatory-ready industrial redesign.
Although Sertraline is used as an illustrative example, the assessment strategy presented is not compound-specific. Many pharmaceutical manufacturing routes share comparable characteristics, including multi-step synthesis, repeated reaction–isolation cycles, and solvent-dominated purification or resolution operations that govern material flows. In such contexts, improvements in solvent choice, reuse, and recovery can deliver significant environmental gains without requiring changes to established bond-forming chemistry, making the framework broadly transferable to other solvent-intensive APIs during route selection and process development.
Overall, this work establishes a transparent, data-driven framework that integrates mass-efficiency metrics, life-cycle environmental indicators, and solvent circularity analysis into a unified decision-support methodology. As environmental and regulatory pressures on pharmaceutical manufacturing intensify, solvent-centric strategies offer an immediately actionable pathway toward more sustainable, resource-efficient, and resilient production processes, aligned with global sustainability objectives including SDG 9, SDG 12, and SDG 13.
Supplementary Materials
The following supporting information can be found at: https://www.sciepublish.com/article/pii/900, the supplementary materials accompanying this study. Supplementary materials supporting this study provide detailed quantitative data, process schemes, and computational analyses that complement the main manuscript. Full details of model architecture, descriptor sets, and validation (R2 = 0.91; RMSE = 0.18), along with mass-balance calculations, descriptor matrices for cheminformatics modelling, and the LCA inventory datasets used to derive GWP and CED values, are included in the Supporting Information (SI). The SI also contains expanded explanations of the multi-metric framework, the digital solvent-ranking workflow, and the uncertainty analyses used to evaluate PMI, cPMI, and LCA variability. Together, these resources enhance transparency, reproducibility, and the interpretive depth of the solvent-focused sustainability evaluation. All data supporting this study—including normalized solvent-mass balances, descriptor matrices, and LCA inputs—are provided (cf. Datasets S1–S3), with additional data available on reasonable request. Table S1: Comparative sustainability metrics (PMI, E-factor, and energy intensity) for the conventional and green Sertraline synthesis routes, including contributions from solvent substitution, catalytic hydrogenation, and solvent recovery. Table S2: Life-Cycle Assessment (LCA) indicators—Global Warming Potential (GWP) and Cumulative Energy Demand (CED)—comparing halogenated and bio-based solvent systems (ethanol, isopropanol, 2-MeTHF, CyreneTM). Table S3: Alignment of redesigned Sertraline process with the 12 principles of green chemistry. Table S4: Classification of solvents according to ACS GCI, CHEM21, and GSK solvent selection guides, highlighting environmental, health, and safety (EHS) rankings and circularity potential. Table S5: Hybrid Sustainability Index (HSI)—summary of weighting factors and scoring rules used for multi-metric assessment. Table S6: Uncertainty Analysis for Key Sustainability Metrics. Table S7: Solvent Substitutions in the green Sertraline Process. Table S8: Predicted vs Measured Performance. Figure S1: Sustainable Pharmaceutical Production Framework. Figure S2: Integrated Sustainability Dashboard (PMI, cPMI, GWP, CED). Figure S3: Timeline of Key Green-Chemistry Metrics. Figure S4: Conceptual Roadmap for Sustainable, Circular, and Digitalized Solvent Management. Figure S5: Distinction Between GWP and CED in LCA. Figure S6: Solvent Substitution Strategy for Greener Sertraline Manufacturing. Figure S7: Digital Solvent Design Workflow. Dataset S1: Normalized process data from Pfizer’s Sertraline manufacturing runs (2018–2024), including solvent mass balances, recovery efficiencies, energy-use data, and emission profiles. Dataset S2: Machine-learning descriptor dataset comprising solvent physicochemical parameters (dipolarity, hydrogen-bonding capacity, viscosity, biodegradability) for predictive modeling of solvent performance. Dataset S3: LCA model inputs and cradle-to-gate inventory data were used to estimate GWP and CED for conventional and green solvent systems. Supporting Notes: 1. Detailed explanation of the multi-metric assessment framework, including equations for PMI, cPMI, E-factor, and life-cycle normalization. 2. Description of computational workflow for AI-assisted solvent ranking and uncertainty quantification. 3. Summary of regulatory cross-references (REACH, ICH Q3C, EPA Safer Choice) relevant to solvent classification and process validation.
Statement of the Use of Generative AI and AI-Assisted Technologies in the Writing Process
During the preparation of this manuscript, the author(s) used the Equations tool (mathematical formulae) from OpenAI in order to use it in the Supporting Information. Because these questions are not the original contribution from the authors, but have good reasons to be in front of the readers for educational purposes. After using this tool/service for generating equations, the author(s) reviewed the content as needed and, if the publisher wants, can remove that part from the submission. A couple of figures were also polished using MS-PowerPoint & Paint applications, but the content in the figures is their own.
Acknowledgments
The author gratefully acknowledges the institutional and library support provided by the participating universities and affiliated research centers/consortia, which enabled access to scientific databases, journals, and reference materials essential for the completion of this study. Technical and administrative guidance from laboratory and academic staff are also sincerely appreciated. The research was conducted independently using institutional resources and publicly available data.
Author Contributions
I.R.S. served as the lead researcher and corresponding author, responsible for overall study design, data interpretation, manuscript writing and coordination. Both authors have read and approved the final manuscript. In fact, I.R.S. mentored M.M.S. throughout the study. Conceptualization, I.R.S. and M.M.S.; Methodology, I.R.S.; Software, I.R.S.; Validation, I.R.S. and M.M.S.; Formal Analysis, I.R.S.; Investigation, I.R.S.; Resources, I.R.S.; Data Curation, I.R.S.; Writing—Original Draft Preparation, I.R.S.; Writing—Review & Editing, I.R.S.; Visualization, I.R.S.; Supervision, I.R.S.; Project Administration, I.R.S.; Funding Acquisition, none.
Ethics Statement
Not applicable. Ethical review and approval were waived for this study, as it did not involve any experiments on humans or animals. The research was conducted in accordance with institutional academic ethics and integrity guidelines and is based solely on secondary data sources, authors’ novel approach focusing on the published literature, and publicly available scientific information. Institutional compliance was maintained throughout all stages of the study.
Informed Consent Statement
Not applicable. This study did not involve humans, human participants, or patient data and was based entirely on secondary sources and published scientific literature.
Data Availability Statement
All relevant data supporting the findings of this study are included within the manuscript and its supplementary materials. The datasets generated and/or analyzed during the current study are made publicly available under license, CC BY 4.0.
Funding
This research received no external funding.
Declaration of Competing Interest
The authors conducted this study independently; however, Pfizer may provide feedback on the study outcomes related to their Sertraline process to ensure consistency with established chemical process methodologies and sustainability metrics. The authors declare no other competing financial interests or personal relationships that could have influenced the work reported in this paper.
References
-
Jiménez-González C, Ponder CS, Broxterman QB, Manley JB. Using the Right Green Yardstick: Why Process Mass Intensity Is Used in the Pharmaceutical Industry to Drive More Sustainable Processes. Org. Process Res. Dev. 2011, 15, 912–917. DOI:10.1021/op200097d [Google Scholar]
-
Prat D, Wells A, Hayler J, Sneddon H, McElroy CR, Abou-Shehada S, et al. CHEM21 selection guide of classical- and less classical-solvents. Green Chem. 2016, 18, 288–296. DOI:10.1039/C5GC01008J [Google Scholar]
-
Byrne FP, Jin S, Paggiola G, Petchey THM, Clark JH, Farmer TJ, et al. Tools and techniques for solvent selection: Green solvent selection guides. Sustain. Chem. Process. 2016, 4, 7. DOI:10.1186/s40508-016-0051-z [Google Scholar]
-
Raymond MJ, Slater CS, Savelski MJ. LCA approach to the analysis of solvent waste issues in the pharmaceutical industry. Green Chem. 2010, 12, 1826–1834. DOI:10.1039/C003666H [Google Scholar]
-
Anastas PT, Warner JC. Green Chemistry: Theory and Practice; Oxford University Press: Oxford, UK, 1998. [Google Scholar]
-
Sheldon RA. The E-factor 25 years on: The rise of green chemistry and sustainability metrics. Green Chem. 2017, 19, 18–43. DOI:10.1039/C6GC02157C [Google Scholar]
-
Durand M, Wollschläger L, Ma L, Finkbeiner M, Bardow A, Kätelhön A, et al. Sustainability assessment tools for greener analytical chemistry: challenges and opportunities. Trends Environ. Anal. Chem. 2025, 47, e00275. DOI:10.1016/j.teac.2025.e00275 [Google Scholar]
-
Ferrara M, Della Negra F, Verzini M, Buda F, Kätelhön A, Bardow A, et al. Solvent Eco-Impact Metric: A Tool for Chemists to Drive Sustainability in Chemical Processes across Safety, Health, Waste, and Environmental Aspects. Org. Process Res. Dev. 2025, 29, 1110–1124. DOI:10.1021/acs.oprd.4c00546 [Google Scholar]
-
Sheldon RA. The greening of solvents: Towards sustainable organic synthesis. Curr. Opin. Green Sustain. Chem. 2019, 18, 13–19. DOI:10.1016/j.cogsc.2018.11.006 [Google Scholar]
-
ISO 14040:2006; Environmental Management—Life Cycle Assessment—Principles and Framework. International Organization for Standardization: Geneva, Switzerland, 2006. [Google Scholar]
-
Shaikh IR. Chemistry for Energy Conversion and Fossil-Free Sustainable Enterprise. In Sustainable Entrepreneurship, Renewable Energy-Based Projects, and Digitalization; CRC Press: Boca Raton, FL, USA, 2020; Chapter 5. Available online: https://www.taylorfrancis.com/chapters/edit/10.1201/9781003097921-5/chemistry-energy-conversion-fossil-free-sustainable-enterprise-isak-rajjak-shaikh (accessed on 13 November 2025).
-
Milanesi M, Runfola A, Guercini S. Pharmaceutical industry riding the wave of sustainability: Review and opportunities for future research. J. Clean. Prod. 2020, 261, 121204. DOI:10.1016/j.jclepro.2020.121204 [Google Scholar]
-
United Nations. Goal 12—Ensuring Sustainable Consumption and Production Patterns: An Essential Requirement for Sustainable Development. 2015. Available online: https://www.un.org/en/chronicle/article/goal-12-ensuring-sustainable-consumption-and-production-patterns-essential-requirement-sustainable (accessed on 13 November 2025).
-
Hessel V, Tran NN, Asrami MR, Tran QD, Van Duc Long N, Escribà-Gelonch M, et al. Sustainability of green solvents—Review and perspective. Green Chem. 2022, 24, 410–437. DOI:10.1039/D1GC03662A [Google Scholar]
-
Stini NA, Gkizis PL, Kokotos CG. Cyrene: A bio-based novel and sustainable solvent for organic synthesis. Green Chem. 2022, 24, 6435–6449. DOI:10.1039/D2GC02332F [Google Scholar]
-
Morelli Venturi D, Campana F, Marmottini F, Costantino F, Vaccaro L. Extensive screening of green solvents for safe and sustainable UiO-66 synthesis. ACS Sustain. Chem. Eng. 2020, 8, 17154–17164. DOI:10.1021/acssuschemeng.0c05587 [Google Scholar]
-
Clarke CJ, Tu WC, Levers O, Bröhl A, Hallett JP. Green and sustainable solvents in chemical processes. Chem. Rev. 2018, 118, 747–800. DOI:10.1021/acs.chemrev.7b00571 [Google Scholar]
-
Liu P, Hao JW, Mo LP, Zhang ZH. Recent advances in the application of deep eutectic solvents as sustainable media as well as catalysts in organic reactions. RSC Adv. 2015, 5, 48675–48704. DOI:10.1039/C5RA05746A [Google Scholar]
-
Foorginezhad S, Yu G, Ji X. Reviewing and screening ionic liquids and deep eutectic solvents for effective CO2 capture. Front. Chem. 2022, 10, 951951. DOI:10.3389/fchem.2022.951951 [Google Scholar]
-
Prabhune A, Dey R. Green and sustainable solvents of the future: deep eutectic solvents. J. Mol. Liq. 2023, 379, 121676. DOI:10.1016/j.molliq.2023.121676 [Google Scholar]
-
Xu P, Zheng GW, Zong MH, Li N, Lou WY. Recent progress on deep eutectic solvents in biocatalysis. Bioresour. Bioprocess. 2017, 4, 34. DOI:10.1186/s40643-017-0165-5 [Google Scholar]
-
Santos MM, Branco LC. Ionic liquids and deep eutectic solvents for application in pharmaceutics. Pharmaceutics 2020, 12, 909. DOI:10.3390/pharmaceutics12100909 [Google Scholar]
-
Sajal NH, Sutar R. Supercritical CO2 as a green solvent: A comprehensive review of its applications in industrial processes. Am. J. Adv. Technol. Eng. Solut. 2025, 1, 544–578. DOI:10.63125/n6esv923 [Google Scholar]
-
Nozari B, Kander R. Supercritical CO2 technology for biomass extraction: Review. Ind. Crops Prod. 2025, 233, 121348. DOI:10.1016/j.indcrop.2025.121348 [Google Scholar]
-
Milovanović S, Lukić I. An overview on the application of supercritical carbon dioxide for the processing of pharmaceuticals. Arch. Pharm. 2022, 72, 566–590. DOI:10.5937/arhfarm72-39999 [Google Scholar]
-
Sels H, De Smet H, Geuens J. SUSSOL—Using Artificial Intelligence for Greener Solvent Selection and Substitution. Molecules 2020, 25, 3037. DOI:10.3390/molecules25133037 [Google Scholar]
-
Fleitmann L, Kleinekorte J, Leonhard K, Bardow A. COSMO-susCAMPD: Sustainable solvents from combining computer-aided molecular and process design with predictive life cycle assessment. Chem. Eng. Sci. 2021, 245, 116863. DOI:10.1016/j.ces.2021.116863 [Google Scholar]
-
European Chemicals Agency (ECHA). REACH Legislation—Consolidated Version of Regulation (EC) No. 1907/2006 (REACH). 2024. Available online: https://echa.europa.eu/regulations/reach/legislation (accessed on 13 November 2025).
-
ICH (International Council for Harmonisation). Q3C(R8) Impurities: Guideline for Residual Solvents; ICH: Geneva, Switzerland, 2021. [Google Scholar]
-
Bopp SK, Barouki R, Brack W, Dalla Costa S, Dorne JLCM, Drakvik PE, et al. Current EU research activities on combined exposure to multiple chemicals. Environ. Int. 2018, 120, 544–562. DOI:10.1016/j.envint.2018.07.037 [Google Scholar]
-
U.S. Environmental Protection Agency (EPA). Safer Choice Criteria for Solvents. EPA Safer Choice. Available online: https://www.epa.gov/saferchoice/safer-choice-criteria-solvents (accessed on 18 July 2025).
-
American Chemical Society Green Chemistry Institute® (ACS GCI). Solvent Selection Guide: Version 2.0 (Pharmaceutical Roundtable). ACS. 2011. Available online: https://www.acs.org/content/dam/acsorg/greenchemistry/industriainnovation/roundtable/acs-gci-pr-solvent-selection-guide.pdf (accessed on 24 October 2025).
-
Nuthi A, Hirlekar BU, Singh KD, Rozy F, Murty US, Dixit VA. Cumulative Green Chemistry Principle Score for Objective Assessment of Drug Synthesis. ACS Sustain. Chem. Eng. 2023, 11, 16144–16155. DOI:10.1021/acssuschemeng.3c03961 [Google Scholar]
-
Pandit B, Saha P. Eco-friendly alternatives to conventional solvents: Innovations and applications in pharmaceutical manufacturing. Sustain. Chem. Catal. 2025, 7, 100140. DOI:10.1016/j.scca.2025.100140 [Google Scholar]
-
Miele M, Pillari V, Pace V, Alcántara AR, de Gonzalo G. Application of bio-based solvents in asymmetric catalysis. Molecules 2022, 27, 6701. DOI:10.3390/molecules27196701 [Google Scholar]
-
Wei P, Pan X, Chen CY, Li HY, Yan X, Li C, et al. Emerging impacts of ionic liquids on eco-environmental safety and human health. Chem. Soc. Rev. 2021, 50, 13609–13627. DOI:10.1039/D1CS00946J [Google Scholar]
-
Chevé-Kools E, Choi YH, Roullier C, Ruprich-Robert G, Grougnet R, Chapeland-Leclerc F, et al. Natural deep eutectic solvents for pharmaceutical applications and beyond. Green Chem. 2025, 27, 8360–8385. DOI:10.1039/D4GC06386D [Google Scholar]
-
Ha ES, Kang HT, Park H, Kim S, Kim MS. Advanced technology using supercritical fluid for particle production in pharmaceutical continuous manufacturing. J. Pharm. Investig. 2022, 53, 249–267. DOI:10.1007/s40005-022-00601-y [Google Scholar]
-
Boyall SL, Clarke H, Dixon T, Davidson RWM, Leslie K, Clemens G, et al. Automated optimization of multistep flow synthesis for pharmaceuticals using green solvents. ACS Sustain. Chem. Eng. 2024, 12, 15125–15133. DOI:10.1021/acssuschemeng.4c05015 [Google Scholar]
-
Xiao H, Feng Y, Goundry WRF, Karlsson S. Organic solvent nanofiltration in pharmaceutical applications. Org. Process Res. Dev. 2024, 28, 891–923. DOI:10.1021/acs.oprd.3c00470 [Google Scholar]
-
Davidopoulou C, Ouranidis A. Pharma 4.0—Artificially intelligent digital twins for solidified nanosuspensions. Pharmaceutics 2022, 14, 2113. DOI:10.3390/pharmaceutics14102113 [Google Scholar]
-
Jung H, Stubbs CD, Kumar S, Pérez-Soto R, Song SM, Kim Y, et al. Enhancing predictive models for solubility in multicomponent solvent systems using semi-supervised graph neural networks. Digit. Discov. 2025, 4, 1492–1504. DOI:10.1039/D5DD00015G [Google Scholar]
-
Kekessie I, Wegner K, Martinez I, Kopach ME, White TD, Tom JK, et al. Process Mass Intensity (PMI): A Holistic Analysis of Current Peptide Manufacturing Processes Informs Sustainability in Peptide Synthesis. J. Org. Chem. 2024, 89, 4261–4282. DOI:10.1021/acs.joc.3c01494 [Google Scholar]
-
Aboagye EA, Chea JD, Yenkie KM. Systems level roadmap for solvent recovery and reuse in industries. iScience 2021, 24, 103114. DOI:10.1016/j.isci.2021.103114 [Google Scholar]
-
Ors E, Schmidt R, Mighani M, Shalaby M. A conceptual framework for AI-based operational digital twin in chemical process engineering. In Proceedings of the 2020 IEEE International Conference on Engineering, Technology and Innovation (ICE/ITMC), Cardiff, UK, 15–17 June 2020. DOI:10.1109/ICE/ITMC49519.2020.9198575 [Google Scholar]
-
Chung Y, Green WH. Machine learning from quantum chemistry to predict experimental solvent effects on reaction rates. Chem. Sci. 2024, 15, 2410–2424. DOI:10.1039/d3sc05353a [Google Scholar]
-
Vassileiou AD, Robertson MN, Wareham BG, Soundaranathan M, Ottoboni S, Florence AJ, et al. A unified ML framework for solubility prediction across organic solvents. Digit. Discov. 2023, 2, 356–367. DOI:10.1039/D2DD00024E [Google Scholar]
-
Ma Y, Gao S, Mehta N, Fu Q, Li W, Benyahia B. SolECOs: A data-driven platform for sustainable and comprehensive solvent selection in pharmaceutical manufacturing. Green Chem. 2025, 27, 12621–12641. DOI:10.1039/D5GC04176G [Google Scholar]
-
Lucas E, Martín AJ, Mitchell S, Nabera A, Santos LF, Pérez-Ramírez J, et al. The need to integrate mass- and energy-based metrics with life cycle impacts for sustainable chemicals manufacture. Green Chem. 2024, 26, 9300–9309. DOI:10.1039/D4GC00394B [Google Scholar]
-
McElroy CR, Constantinou A, Jones LC, Summerton L, Clark JH. Towards a holistic approach to metrics for the 21st century pharmaceutical industry. Green Chem. 2015, 17, 3111–3121. DOI:10.1039/C5GC00340G [Google Scholar]
-
Castiello C, Junghanns P, Mergel A, Jacob C, Ducho C, Valente S, et al. GreenMedChem: The challenge in the next decade toward eco-friendly compounds and processes in drug design. Green Chem. 2023, 25, 2109–2169. DOI:10.1039/D2GC03772F [Google Scholar]
-
Udugama I, Mansouri S, Mitic A, Flores-Alsina X, Gernaey K. Perspectives on resource recovery from bio-based production processes: From concept to implementation. Processes 2017, 5, 48. DOI:10.3390/pr5030048 [Google Scholar]
-
Trost BM. The atom economy—A search for synthetic efficiency. Science 1991, 254, 1471–1477. DOI:10.1126/science.1962206 [Google Scholar]
-
Farina V. On scalability, synthetic efficiency, and convergency. Org. Process Res. Dev. 2025, 29, 979–985. DOI:10.1021/acs.oprd.5c00030 [Google Scholar]
-
Roschangar F, Sheldon RA, Senanayake CH. Overcoming barriers to green chemistry in the pharmaceutical industry—The Green Aspiration LevelTM concept. Green Chem. 2015, 17, 752–768. DOI: 10.1039/C4GC01563K [Google Scholar]
-
Kar S, Sanderson H, Roy K, Benfenati E, Leszczynski J. Green chemistry in the synthesis of pharmaceuticals. Chem. Rev. 2021, 122, 3637–3710. DOI:10.1021/acs.chemrev.1c00631 [Google Scholar]
-
Zhou F, Shi D, Mu W, Wang S, Wang Z, Wei C, et al. Machine learning models accelerate deep eutectic solvent discovery for the recycling of lithium-ion battery cathodes. Green Chem. 2024, 26, 7857–7868. DOI:10.1039/D4GC01418A [Google Scholar]
-
Roelofs CR, Ellenbecker MJ. Source reduction for prevention of methylene chloride hazards: Cases from four industrial sectors. Environ. Health 2003, 2, 9. DOI:10.1186/1476-069X-2-9 [Google Scholar]
-
Cenci F, Diab S, Ferrini P, Harabajiu C, Barolo M, Bezzo F, et al. Predicting drug solubility in organic solvents mixtures: A machine-learning approach supported by high-throughput experimentation. Int. J. Pharm. 2024, 660, 124233. DOI:10.1016/j.ijpharm.2024.124233 [Google Scholar]
-
Silva SS, Gomes JM, Reis RL, Kundu SC. Green solvents combined with bioactive compounds for drug delivery systems. ACS Appl. Bio Mater. 2021, 4, 4000–4013. DOI:10.1021/acsabm.1c00013 [Google Scholar]