Impact of Urban Topography and Infrastructure on Air Pollution Dispersion Using UAV-Based AQI Systems

Impact of Urban Topography and Infrastructure on Air Pollution Dispersion Using UAV-Based AQI Systems

Received: 30 November 2025 Revised: 20 January 2026 Accepted: 27 February 2026 Published: 04 March 2026

© 2026 The authors. This is an open access article under the Creative Commons Attribution 4.0 International License (https://creativecommons.org/licenses/by/4.0/).
1. Introduction
Rapid urbanization has reshaped city form and function, intensifying traffic flows, densifying the built environment, and altering the distribution of green space. A key consequence is degraded air quality, with well-documented impacts on morbidity, mortality, and urban livability. Yet pollution in cities is rarely uniform: complex interactions among emission sources, urban morphology, and local meteorology produce sharp spatial and temporal gradients that conventional monitoring networks only partially resolve. In everyday terms, people living in the same neighborhood can be exposed to noticeably different pollution levels depending on street-canyon layout, closeness to busy roads, how well the area ventilates, and when measurements are taken, meaning differences that have real consequences for health, daily routines, and environmental fairness.
Urban topography encompasses both natural landforms and the built environment, which plays a decisive role in regulating the dispersion and accumulation of pollutants [1]. Features such as street canyons, high-rise clusters, industrial corridors, open plazas, and vegetated areas can either trap contaminants or promote ventilation, creating localized hotspots and cleaner corridors over short distances. These effects are often strongest at the micro-scale, where small changes in canyon openness, building density, and the placement of open or vegetated areas can shift local mixing and residence time of pollutants. As a result, understanding pollution dispersion in cities requires measurement approaches that are sensitive to neighborhood-scale structure rather than relying solely on citywide averages.
Most regulatory air-quality systems rely on a limited number of fixed ground stations. While these provide high-quality, long-term records, their sparse and static placement limits the ability to capture micro-scale variability. It offers little direct insight into vertical structure, particularly in canyon-like environments where pollutant levels can change substantially over the first tens of meters above ground. This creates a gap between what conventional monitoring can represent and what urban planners and public-health practitioners often need: actionable evidence about where pollution accumulates, how persistent those patterns are, and which urban-form characteristics are associated with limited dispersion regulatory air-quality systems rely on a limited number of fixed ground stations. While these provide high-quality, long-term records, their sparse and static placement limits the ability to capture micro-scale variability. It offers little direct insight into vertical structure, particularly in canyon-like environments where pollutant levels can change substantially over the first tens of meters above ground. This creates a gap between what conventional monitoring can describe and what urban planners and public health practitioners often need: actionable evidence on where pollution accumulates, how persistent those patterns are, and which urban-form characteristics are associated with limited dispersion.
Unmanned aerial vehicles (UAVs) equipped with air-quality sensors offer a complementary solution by sampling across elevations and along flexible transects to capture three-dimensional pollutant fields [2]. In this study, “three-dimensional” refers specifically to resolving near-surface vertical structure within the lower urban canopy layer (0–15 m above ground level), where concentration changes can be pronounced over short distances and time windows in dense districts. When UAV observations are interpreted alongside simple descriptors of urban form, such as building density, canyon openness, and proximity to major roads, they move beyond “mapping” toward explaining why certain locations repeatedly emerge as hotspots or limited-dispersion zones under comparable operating conditions.
Recent synthesis work on drone-assisted air-quality monitoring highlights that the main barriers to operational reliability are not only coverage and mobility, but also measurement artifacts introduced by UAV aerodynamics (e.g., propeller-induced downwash), sensor mounting location, payload constraints, and calibration/QA procedures-factors that can bias near-rotor sampling if not explicitly considered [3]. These concerns are reinforced by targeted studies that quantify rotor-wash effects and recommend placement strategies to minimize sampling bias in multicopter platforms [4]. Validation-oriented UAV measurement studies show that reliable airborne observations depend on careful sensor integration, flight design, and interpretive discipline, often treating UAV data primarily as gradients and patterns, rather than as direct replacements for regulatory instruments [5,6]. A broader recent review further underscores the need for standardized protocols and reproducible workflows when combining UAV platforms with low-cost sensing in complex real-world environments [7].
Prior UAV-based air-quality work has largely emphasized either coverage expansion and mapping or low-cost sensor feasibility in mobile platforms. This study advances the field by combining repeatable multi-altitude transects with a micro-network of fixed reference nodes and a minimal set of morphology descriptors (building density, canyon aspect ratio, and proximity to major roads) to produce an interpretable, operational link between urban form and measured dispersion behavior. The resulting workflow is designed to be reproducible with low-cost components while still yielding altitude-resolved evidence that supports actionable planning decisions at the neighborhood scale.
In this context, the present study employs UAV-based Air Quality Index (AQI) measurements across contrasting urban settings to assess the influence of topography and infrastructure on pollutant dispersion. The specific objectives are to:
-
-
Identify morphological drivers of localized hotspots and limited dispersion zones.
-
-
Evaluate the added value of UAV sampling relative to fixed monitors for resolving micro-scale horizontal and vertical gradients.
-
-
Generate evidence-based recommendations on how UAV observations and urban form indicators can be jointly used to support urban planners and public health practitioners in designing infrastructure and policies that reduce pollution exposure in rapidly growing cities.
This study contributes a practical hybrid monitoring workflow that integrates a low-altitude UAV payload with a small-fixed sensor network to provide both spatial flexibility and temporal reference. By generating altitude-resolved PM2.5 and PM10 observations, the study reveals within-canyon versus above-canyon gradients that are typically missed by static monitoring stations. It also establishes a simple and reproducible linkage between urban form and observed particulate patterns using interpretable metrics, such as building density, a street width-to-building height proxy, and distance to major roads, thereby making the morphology pollution relationship measurable and comparable across sites.
Finally, the work evaluates the added value of UAV sampling for identifying localized hotspots and assessing their persistence across flights under real operational constraints, supporting more targeted and evidence-based urban air-quality interventions.
2. Materials and Methods
2.1. Study Area and Experimental Design
The field campaign was conducted in a high-density urban district characterized by different residential and mixed-use buildings, narrow street canyons, and adjacent open corridors. The area includes busy traffic arteries, local streets, and scattered vegetated pockets, providing contrasting configurations of urban morphology and emission sources within a compact footprint.
The experimental design combined a continuous ground-based monitoring period with targeted UAV flights. Ground sensors operated over a 40-day period (1 September–10 October 2025), while UAV missions were scheduled on selected days within this window under suitable weather and visibility conditions. This hybrid design was chosen to establish a baseline of near-surface particulate levels at pedestrian height and capture altitude-resolved profiles and horizontal transects that could be directly compared with the ground series.
2.2. Ground-Based Monitoring Network
A small network of six ground-based sensors was deployed at pedestrian level (approximately 2–3 m above ground) at key locations across the district. Sensor positions were selected to represent different urban micro-environments, including a major traffic corridor, a mixed residential–commercial street canyon, and nearby open or semi-open spaces. The spatial layout of the network was designed to sample both high-exposure locations and relatively better-ventilated areas within walking distance of one another.
Each ground node used a continuous optical laser-scattering sensor for particulate matter (PM2.5 and PM10), powered from mains and equipped with local data logging. Measurements were recorded at a fixed sampling interval and later aggregated into non-overlapping three-day averages for descriptive analysis and comparison with UAV profiles. The 3-day averaging window was selected to smooth short-term spikes while preserving underlying trends over the 40-day period.
2.3. UAV Platform and Sensor Payload
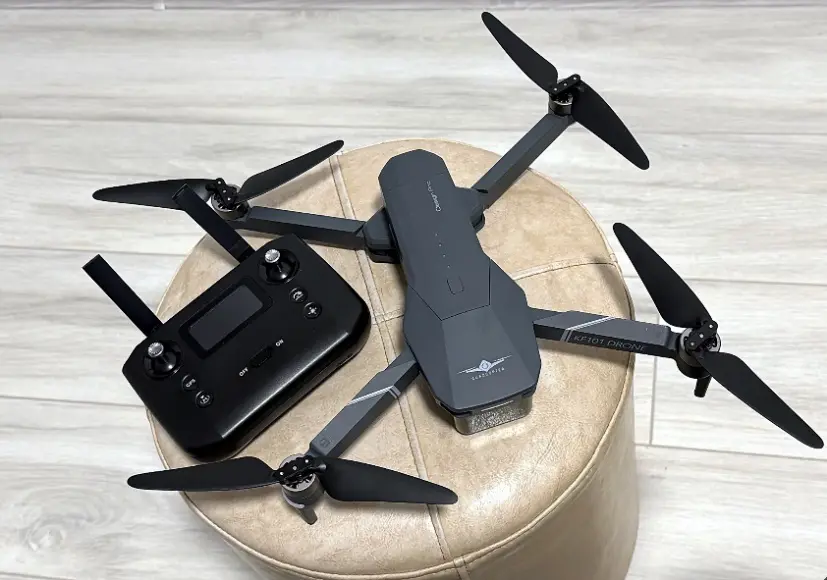
For aerial measurements, a multirotor UAV platform CSJ KF101 was used as the carrier (Figure 1), chosen for its compact form factor, integrated GPS, and sufficient payload capacity for a lightweight environmental package. The payload consisted of two main components:
-
-
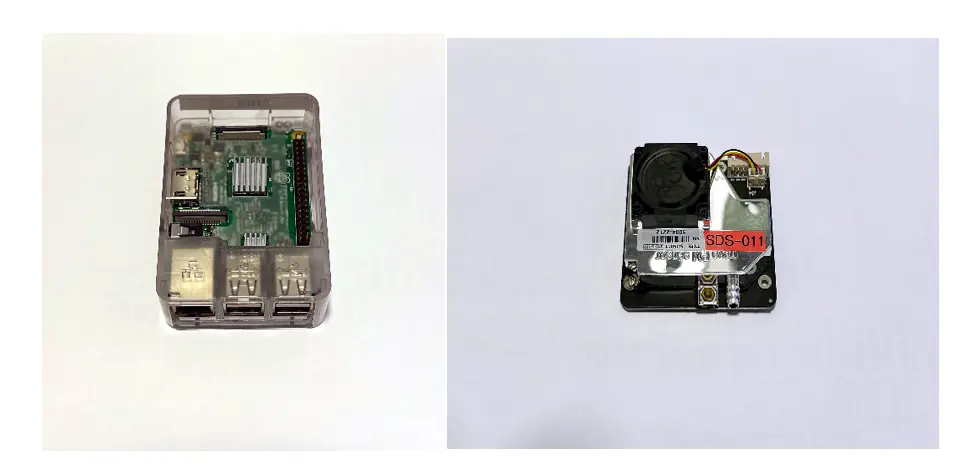
A Raspberry Pi 3 Model B+ single-board computer (Figure 2), which handled on-board data acquisition, timestamping, and temporary storage. The Pi communicated with the particulate sensor via USB interface, executed a logging script, and wrote time-stamped records to local memory for later retrieval and processing. Its low power consumption and small footprint made it suitable for integration on a small multirotor platform.
-
-
A Nova SDS011 optical particle sensor (Figure 2) for PM2.5 and PM10 measurements based on laser light scattering. The SDS011 provides mass concentration estimates at a fixed sampling interval and has been widely used in low-cost air-quality networks. In this setup, the sensor was mounted with its air inlet oriented away from the propeller wash as much as possible, to reduce flow distortion and ensure more representative sampling of the surrounding air. This mounting choice follows established guidance that propeller-induced downwash and inlet positioning can materially bias UAV-based air-quality measurements; therefore, we treated UAV observations primarily as relative gradients (within-canyon vs. above-canyon, and along-path contrasts) and relied on the fixed ground node(s) for temporal reference and consistency checks [3].
The components are lightweight and widely documented [8,9,10], allowing straightforward replication. The payload was mounted to maintain the sensor inlet clear of rotor wash as much as practicable, while keeping total mass within the manufacturer’s recommended limits to preserve flight stability and endurance.
As noted above, the Raspberry Pi interfaced with the SDS011 via USB communication, handled real-time averaging over a few seconds, and stored timestamped readings to local memory. GPS information from the UAV flight controller was synchronized with the data stream to attribute each measurement to an approximate position and altitude. Power for the payload was supplied from a dedicated external power source.
2.4. Flight Operations and Sampling Strategy
UAV flights were conducted within visual line-of-sight and in compliance with local regulations governing small, unmanned aircraft. Missions were planned for periods with no precipitation, moderate wind speeds, and stable atmospheric conditions to reduce confounding meteorological effects. Take-off and landing zones were selected in open areas near one of the ground stations, enabling safe operations and co-located sampling.
Two main flight patterns were used:
-
Vertical profiles: The UAV ascended from near ground level to a nominal altitude of approximately 15 m above ground level (AGL) at or close to the ground-station location. At predefined heights, short hovers were performed to obtain quasi-stationary samples.
-
Horizontal transects: At target altitudes within the lower urban canopy layer (typically around 15 m AGL), the UAV followed pre-planned paths along the street canyon and adjacent open corridors to capture spatial variability in particulate concentrations.
Each mission lasted within the platform’s practical endurance limits, with battery reserves maintained for a safe return and landing. Multiple flights were performed on selected days to improve coverage and to assess repeatability of observed patterns under similar conditions.
2.5. Rationale for AQI Framing and 3D Metrics (0–15 m)
AQI framing was used because it provides a policy-facing and public-communication layer that allows measured particulate levels to be interpreted relative to standardized air-quality categories, while still preserving the underlying scientific measurements. PM2.5 and PM10 were therefore retained and reported directly to ensure transparency and reproducibility of the observations and derived gradients. To operationalize the three-dimensional aspect of the dataset, each UAV measurement was geo-referenced and treated as a spatiotemporal point (x,y,z,t) where the inclusion of altitude z enables a near-surface 3D characterization within the urban canopy layer (0–15 m AGL) rather than a full boundary-layer profile. This approach follows the general principle that combining concentration values with geographic coordinates and altitude supports a 3D representation of measured fields [11].
Vertical attenuation (%) at 15 m was computed as:
|
```latex\text{Reduction}\ (\%) = \frac{C_{\text{ground}} - C_{\text{15m}}}{C_{\text{ground}}} \times 100``` |
Mean vertical gradient over 0–15 m as:
|
```latexG=\frac{{C}_{\text{ground}}-{C}_{15\mathrm{m}}}{15}\text{ }\left(\mathrm{\mu }\mathrm{g}/{\mathrm{m}}^{3}/\mathrm{m}\right)``` |
2.6. Calibration, Co-Location, and Quality Control
To support comparisons between platforms, periodic co-location exercises were conducted in which the UAV hovered near one of the ground stations while both systems recorded simultaneously. These co-location periods were used to verify the consistency of SDS011 readings across mobile and fixed configurations and to check for any obvious sensor drift over the 40-day campaign.
Basic quality-control (QC) procedures were applied before analysis. Raw time series were inspected for missing values, out-of-range readings, and obvious spikes associated with power-up or communication glitches. Short warm-up periods after instrument start-up were excluded. For the UAV dataset, measurements recorded during rapid climbs or maneuvers, when airflow around the inlet may be highly disturbed, were flagged and removed from the final profiles. Only data collected during defined hover segments or steady speed transects were retained.
Environmental variables, such as ambient temperature and relative humidity, were monitored to help interpret potential biases associated with low-cost optical PM sensors. Although no full correction model was applied, periods with extreme humidity were noted during interpretation, and the focus was placed on relative gradients between ground and UAV measurements rather than on absolute regulatory compliance.
2.7. Data Aggregation and Comparative Analysis
For the ground network, PM2.5 and PM10 measurements were aggregated into three-day averages over the 1 September–10 October 2025 period, yielding a time series of smoothed concentration levels at the reference site. For the UAV campaign, altitude-resolved profiles and horizontal transects were summarized by computing mean concentrations at each sampled height and along key path segments.
Comparative analysis focused on:
-
-
Differences between pedestrian-level and ~15 m AGL concentrations during co-located sampling windows.
-
-
The consistency between the temporal patterns observed at the ground station and those captured by UAV flights on overlapping days.
-
-
The qualitative association between observed gradients and the surrounding urban morphology. (street-canyon versus more open configurations).
2.8. AQI Framing and PM Reporting
Although the SDS011 sensor outputs particulate mass concentrations (PM2.5 and PM10 in µg/m3), we additionally report the corresponding Air Quality Index (AQI) to align the measurements with the risk-communication format used by public agencies and to support policy-relevant interpretation. AQI values were computed by mapping PM2.5 and PM10 concentrations to AQI categories using a standard breakpoint approach (piecewise linear interpolation between category thresholds), and the overall AQI was taken as the maximum of the pollutant-specific indices. PM values are still reported throughout the Results to preserve scientific transparency, support comparability with prior sensor/UAV studies, and allow readers to interpret gradients in physically meaningful units.
3. Results
3.1. Ground-Based Particulate Patterns at the Pilot Site
During the 40-day ground-based campaign (1 September–10 October 2025) in the high-density study area, the fixed station recorded substantial variability in PM2.5 and PM10 concentrations over time. Periods of relatively low particulate levels alternated with episodes of elevated pollution, reflecting day-to-day changes in local traffic intensity, background regional pollution, and meteorological conditions such as reduced wind speeds and thermal stratification.
To emphasize more persistent patterns, the raw time series were aggregated into non-overlapping three-day averages. The resulting PM2.5 and PM10 values are summarized in Table 1, which provides a compact view of how particulate loads evolved across the 40-day observation window.
Table 1. Rounded 3-day average PM values at the pilot ground station.
|
Timestamp |
PM2.5 (µg/m3) |
PM10 (µg/m3) |
|---|---|---|
|
1 September 2025 |
76.0 |
124.6 |
|
4 September 2025 |
68.4 |
93.2 |
|
7 September 2025 |
98.1 |
118.7 |
|
10 September 2025 |
73.9 |
122.0 |
|
13 September 2025 |
117.9 |
82.1 |
|
16 September 2025 |
77.2 |
101.5 |
|
19 September 2025 |
86.0 |
114.2 |
|
22 September 2025 |
118.1 |
137.6 |
|
25 September 2025 |
62.3 |
88.4 |
|
28 September 2025 |
59.9 |
85.2 |
|
1 October 2025 |
105.8 |
96.6 |
|
4 October 2025 |
117.3 |
102.7 |
|
7 October 2025 |
84.0 |
123.9 |
|
10 October 2025 |
79.1 |
88.3 |
Across the campaign, the three-day average PM2.5 at the pilot site ranged from 59.9 to 118.1 μg/m3, with a mean of approximately 87.4 μg/m3, while PM10 ranged from 82.1 to 137.6 μg/m3, with a mean near 105.6 μg/m3. Several multi-day episodes exhibited sustained elevations in both size fractions, consistent with the combined effects of dense traffic, constrained ventilation in the surrounding street canyons, and regionally degraded background conditions.
The three-day averaging smooths short-lived spikes while preserving the underlying temporal structure, producing a more stable representation of neighborhood-scale particulate conditions and facilitating comparison with the UAV profiles acquired on selected days.
3.2. Spatial Variability Across the Ground Sensor Network
The six fixed sensors were installed at locations representing a spectrum of conditions, including a major transport corridor with high traffic density, a mixed-use street canyon with ground-floor commercial activity and upper-floor residences, and quieter residential surroundings with lower traffic intensity.
This configuration was designed to sample both expected hotspots and comparatively cleaner micro-environments within a compact urban footprint. Their positions within the city are shown in Figure 3, with sensor locations overlaid on an OpenStreetMap base layer to highlight their relationship to road layout, building blocks, and nearby green or open spaces.
Three-day average PM2.5 and PM10 values for the network are reported in Table 2 for the same 1 September–10 October 2025 period. These data highlight that different parts of the city experienced systematically different particulate regimes over the campaign, even though all stations were subject to the same regional background.
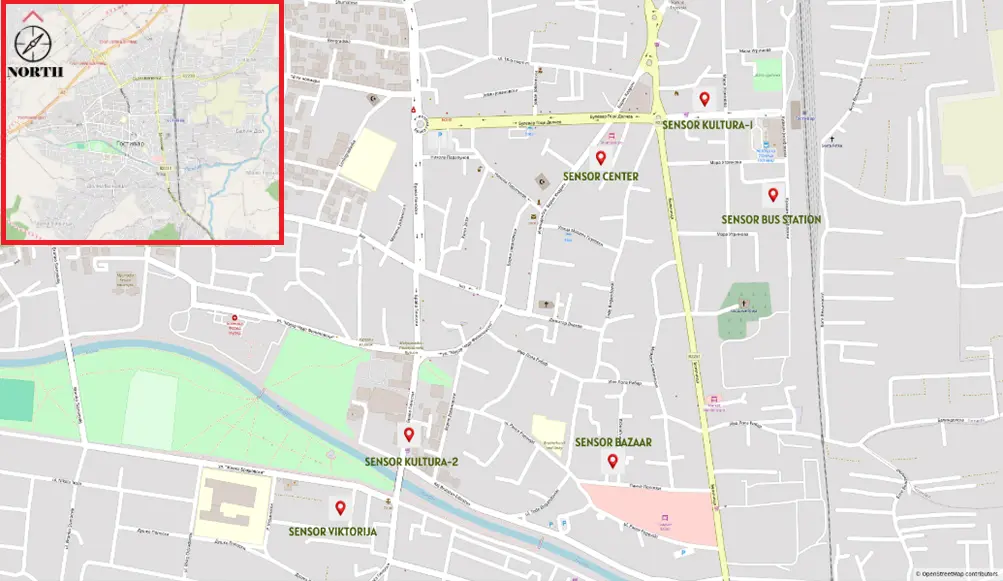
Figure 3. Ground-based monitoring network. Sensor locations are marked on an OpenStreetMap basemap with an overview map of the urban area.
Table 2. Rounded 3-day average PM values across the ground-sensor network.
|
Timestamp |
PM2.5 (µg/m3) |
PM10 (µg/m3) |
|---|---|---|
|
1 September 2025 |
82.4 |
131.9 |
|
4 September 2025 |
79.1 |
99.4 |
|
7 September 2025 |
104.7 |
126.1 |
|
10 September 2025 |
89.6 |
129.8 |
|
13 September 2025 |
122.8 |
90.0 |
|
16 September 2025 |
82.9 |
111.2 |
|
19 September 2025 |
93.0 |
122.6 |
|
22 September 2025 |
121.3 |
142.1 |
|
25 September 2025 |
69.6 |
92.7 |
|
28 September 2025 |
66.1 |
89.1 |
|
1 October 2025 |
111.7 |
103.1 |
|
4 October 2025 |
123.1 |
108.8 |
|
7 October 2025 |
90.9 |
130.2 |
|
10 October 2025 |
84.6 |
95.8 |
In general, stations located near major traffic corridors exhibited the highest three-day averages, whereas sensors in relatively more open or less trafficked areas showed lower, though still elevated, concentrations. The spread between the minimum and maximum three-day averages across the network confirms that urban air quality over short distances is better characterized as a patchwork of micro-environments than as a spatially homogeneous field. These ground-based contrasts provide the context for interpreting the UAV measurements
3.3. Urban-Form Metrics and Link to Observed PM
To make the morphology-pollution relationship explicit and reproducible, we summarize a minimal set of interpretable urban-form descriptors for the fixed monitoring sites (Table 3). The descriptors were selected to reflect factors that plausibly constrain local ventilation and exposure, namely building density, street-canyon openness (approximately using a width-to-height proxy), and proximity to major traffic corridors. Because the fixed nodes were deployed under operational constraints, these variables are reported as qualitative classes derived from field placement context and map-based inspection, providing a transparent basis for stratifying and interpreting the measured particulate patterns.
Table 3. Urban morphology descriptors for fixed monitoring sites (classification-based).
|
Fixed Monitoring Unit |
Dominant Morphology/Setting (as Deployed) |
Building Density (Class) |
Street-Canyon Openness (W:H Proxy and Class) |
Proximity to Major Road (Class) |
|---|---|---|---|---|
|
Pilot fixed site (reference ground station used for UAV profiles) |
Dense urban street-canyon/mixed-use context (used as UAV profiling anchor point) |
High |
Low |
Near |
|
Fixed ground network (aggregate across all fixed sites) |
Mixed morphologies (traffic corridor + mixed-use canyon + more residential surroundings) |
Mixed |
Mixed |
Mixed |
Building density, street-canyon openness (W:H proxy), and proximity to major roads are reported as qualitative classes (High/Mixed/Low; Near/Mid/Far) derived from field placement context and map-based inspection of the surrounding urban fabric. These descriptors are provided to support interpretation of the particulate measurements, corresponding mean PM2.5 and PM10 values are reported separately in Table 4.
Table 4. Mean PM levels at fixed monitoring sites used in morphology comparison (3-day averages).
|
Fixed Monitoring Unit |
Mean PM2.5 (µg/m3) |
Mean PM10 (µg/m3) |
|---|---|---|
|
Pilot fixed site (anchor ground station used for UAV profiles) |
87.4 |
105.6 |
|
Fixed ground network (aggregate across all fixed sites) |
94.4 |
112.3 |
Means are calculated from the rounded 3-day average values reported for the monitoring period (1 September–10 October 2025). The pilot fixed site values are derived from Table 1, while the fixed ground network values represent the aggregate across all fixed sites, as seen in Table 2.
3.4. UAV Vertical Profiles and Horizontal Transects
The UAV-based measurements complement the fixed network by resolving vertical structure and along-path variability within and above the street canyon environment. The aerial platform (CSJ KF101, Figure 1) carried a Raspberry Pi 3 Model B data-logging unit (Figure 2) and a Nova SDS011 particle sensor (Figure 2), as described in Section 2.3, enabling altitude-resolved PM2.5 and PM10 sampling along predefined flight paths.
UAV flights were conducted on selected days during the 40-day window, under relatively stable meteorological conditions. Each mission consisted of:
-
-
Vertical profiles near the pilot ground station, with the UAV hovering briefly at a sequence of discrete heights (from near surface up to ~15 m above ground level).
-
-
Horizontal transects along the main street canyon and adjacent more open corridors.
The spatial relationship between the UAV flight paths and the fixed network is illustrated in Figure 4, where typical trajectories are overlaid on the same basemap used for the ground sensors.
Across the set of flights, near-surface UAV measurements (a few meters above ground) closely tracked the three-day average PM2.5 and PM10 values observed at the pilot site, with elevated concentrations during the same multi-day episodes and lower values during cleaner periods. At ~15 m altitude, PM2.5 and PM10 generally followed the temporal pattern of the ground measurements but with damped peaks and slightly lower means, consistent with partial dilution and improved ventilation aloft compared with the street canyon level.
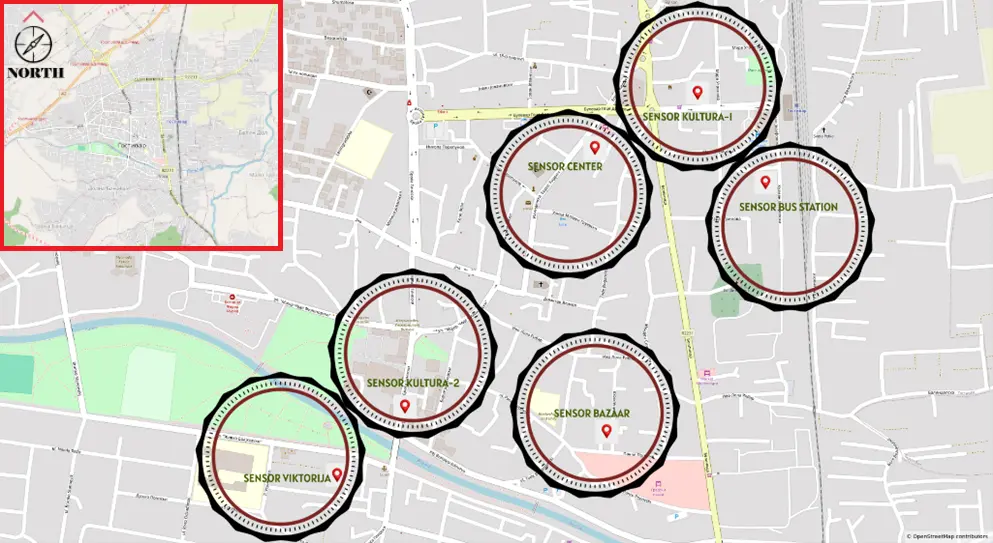
Figure 4. Spatial relationship between UAV coverage (transects/profiles) and fixed ground sensors on an OpenStreetMap basemap, with an overview map of the urban area.
A representative comparison between ground and ~15 m UAV measurements for one flight day is shown in Figure 5, which combines time series at the pilot site with vertical profile snapshots.
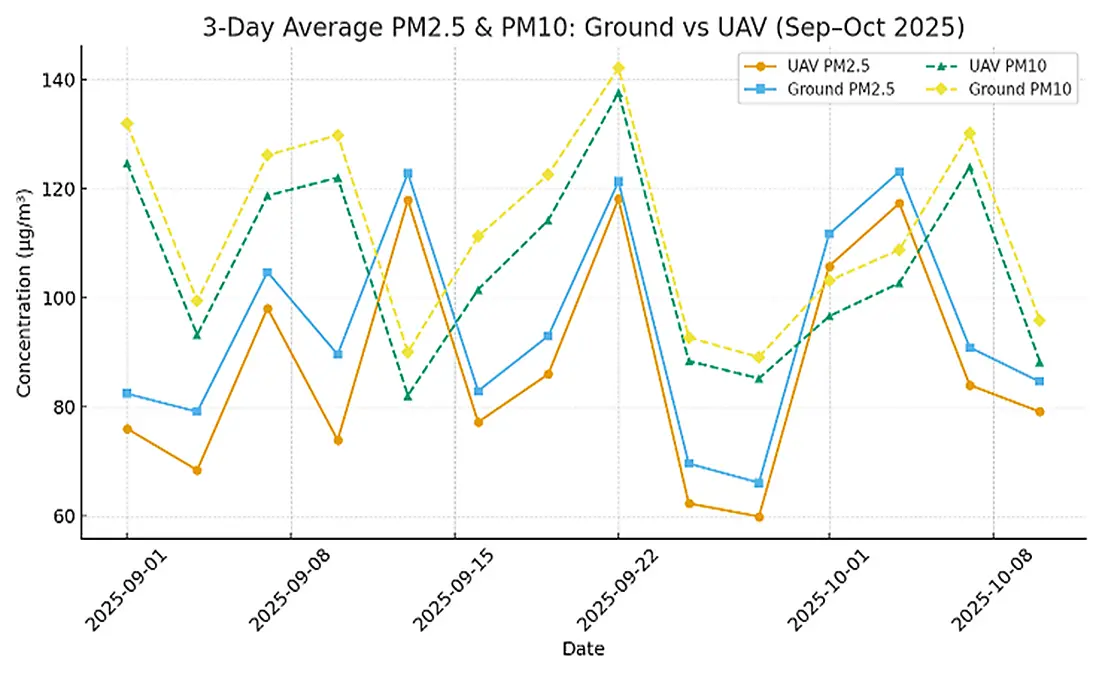
Figure 5. Comparative PM2.5/PM10 time series and profiles from UAV and ground sensors during the 1 September–10 October 2025 campaign.
Within the main street canyon, horizontal transects revealed localized zones of limited dispersion, where PM2.5 and PM10 remained consistently higher than in nearby open spaces sampled within the same flight. These hotspots tend to coincide with segments characterized by higher building density and reduced cross-street openness. In contrast, transects along more open corridors and near vegetated patches showed lower particulate levels over comparable time intervals, indicating more effective local ventilation.
To determine whether localized hotspots were isolated events or consistently recurring, we assessed hotspot persistence across multiple repeated UAV transects. First, the along-track UAV measurements were aggregated into spatial segments (e.g., fixed-length bins along the transect) to allow flight-to-flight alignment. A hotspot was then defined operationally as segments falling in the upper decile (top 10%) of along-track particulate concentrations within each flight (computed separately for PM2.5 and PM10). For each segment, persistence was calculated as the fraction of flights in which that segment was classified as a hotspot, i.e., persistence = (number of flights where segment is hotspot)/(total flights) × 100 (Table 5). The most persistent hotspots aligned with segments adjacent to high-traffic corridors and canyon-like street geometries, whereas segments in more open areas exhibited lower hotspot persistence, consistent with improved local ventilation and dispersion.
Table 5. Hotspot persistence across flights.
|
Metric |
PM2.5 |
PM10 |
|---|---|---|
|
Number of UAV flights analyzed (n) |
30 |
30 |
|
Hotspot definition |
Upper decile (top 10%) of along-track segments |
Upper decile (top 10%) of along-track segments |
|
Persistence, median (% of flights) |
10.0% |
10.0% |
|
Persistence, range (% of flights) |
6.7–43.3% |
0–20.0% |
|
Number of segments with persistence ≥50% |
0 |
0 |
Taken together, the ground and UAV results demonstrate that:
-
-
Temporal variability at the pilot site is substantial over weekly time scales.
-
-
Spatial gradients across the small ground-sensor network are strong, even over modest distances.
-
-
Vertical and along-path gradients resolved by the UAV are consistent with the expectation that dense canyons act as relative accumulation zones compared with better-ventilated, more open areas.
These empirical patterns provide the quantitative basis for the interpretation and broader implications that are developed in the subsequent Discussion section.
3.5. Vertical Attenuation at ~15 m AGL
To quantify the vertical contrast between pedestrian level and the lower urban canopy layer, we compared particulate concentrations measured at the pilot ground station with co-located UAV observations collected at approximately 15 m above ground level (AGL) during the same sampling windows. Across 14 paired intervals, PM2.5 and PM10 at ~15 m were consistently lower than the corresponding ground values, indicating partial dilution and improved ventilation above the street-level mixing zone. On average, PM2.5 decreased by 7.0 µg/m3 (mean reduction 7.9%), while PM10 decreased by 6.7 µg/m3 (mean reduction 6.1%) (Table 6). The magnitude of attenuation varied across the campaign, with reductions ranging from 2.6–17.5% for PM2.5 and 3.2–8.8% for PM10, consistent with changing background pollution and local dispersion conditions. These results provide a simple, interpretable estimate of how rapidly particulate concentrations can decrease over the first ~15 m of altitude in dense urban settings and support the value of UAV profiling for capturing exposure-relevant vertical gradients.
Table 6. Mean reduction in particulate matter at ~15 m AGL relative to ground (n = 14 paired windows).
|
Metric |
PM2.5 |
PM10 |
|---|---|---|
|
Mean ground concentration (µg/m3) |
94.4 |
112.3 |
|
Mean UAV concentration at ~15 m (µg/m3) |
87.4 |
105.6 |
|
Mean difference (Ground −15 m) (µg/m3) |
7.0 |
6.7 |
|
Mean reduction (%) |
7.9% |
6.1% |
|
Reduction range (%) |
2.6–17.5% |
3.2–8.8% |
Reductions were computed for each paired interval as: (Cground − C15m)/Cground × 100 and then summarized across all paired windows.
3.6. Near-Surface 3D Structure within 0–15 m
Although the flight ceiling in this campaign was limited to ~15 m AGL, the added vertical dimension still provided measurable information that cannot be inferred from ground-only monitoring. Across 𝑛 =14 paired co-located windows, mean concentrations at 15 m were lower than near-ground levels by 7.0 µg/m3 (7.9%) for PM2.5 and 6.7 µg/m3 (6.3%) for PM10, corresponding to mean vertical gradients of approximately 0.47 µg/m3/m (PM2.5) and 0.45 µg/m3/m (PM10) over the first 15 m. These results indicate rapid dilution above the immediate street-level mixing zone and provide a practical, reproducible “3D” characterization of the lower urban canopy layer, which is directly relevant for distinguishing within-canyon exposure from conditions just above the canyon influence.
3.7. Canyon Versus Open-Area Gradients
To compare dispersion behavior across contrasting urban forms, transect segments were stratified into two morphology classes: canyon-like segments (high building density, low street-canyon openness/W:H proxy, and near-road placement) versus open-area segments (lower effective enclosure, greater openness, and/or farther from major traffic corridors), consistent with the qualitative site descriptors reported in Table 3 and Table 4.
Across the repeated transects, canyon-classified segments exhibited higher near-ground particulate levels than open segments, with mean PM2.5 elevated by 2.1 µg/m3 (≈22%) and mean PM10 elevated by 2.5 µg/m3 (≈20%), indicating stronger accumulation under restricted ventilation conditions. The vertical attenuation between ground and ~15 m was also more pronounced over canyon segments, with an average reduction of ~19% (PM2.5) and ~17% (PM10) compared with ~12% and ~10% over open segments, respectively, consistent with inhibited near-surface mixing and enhanced dilution above the canyon layer.
4. Discussion
4.1. Micro-Scale Heterogeneity and Urban Morphology
The ground and UAV observations together confirm that particulate air quality in dense urban districts is highly heterogeneous in both space and time. Three-day average PM2.5 and PM10 levels at the pilot site showed substantial multi-day variability, while the small ground network revealed clear differences between stations separated by relatively short distances. Such behavior is consistent with previous work highlighting the role of urban form, green space configuration, and building layout in modulating local ventilation and pollutant accumulation in high-density cities [1,12].
Our results support the view that narrow street canyons and high-rise clusters tend to act as relative accumulation zones, whereas more open corridors and vegetated pockets provide partial “refuge” with lower particulate levels. The observed hotspots and limited-dispersion zones along the main canyon align with the notion that detailed street-canyon geometry and roughness patterns strongly influence dispersion pathways and residence times. For exposure assessment, this implies that residents following different daily routes or occupying different building heights may experience systematically different pollution levels, even when living within the same nominal neighborhood.
4.2. Hybrid Ground–UAV Monitoring in the Evolving Paradigm
The complementary perspectives provided by fixed and UAV-based measurements speak directly to the ongoing evolution of urban air-quality monitoring. Conventional regulatory networks based on sparse, high-grade stations provide robust long-term records but under-sample intra-urban heterogeneity and lack vertical resolution [13]. The growth of low-cost and IoT-based sensing has enabled denser ground networks at lower cost [14,15], yet these systems remain largely confined to near-surface, static locations and introduce new challenges around calibration, drift, and QA/QC [16,17].
In this context, UAV platforms expand the available design space by enabling altitude-resolved, on-demand spatial sampling. Our findings show that vertical gradients between pedestrian level and ~15 m above ground can be considerable during polluted episodes, with UAV profiles consistently observing damped peaks relative to ground values while preserving the same temporal pattern. This supports the idea that three-dimensional micro-scale heterogeneity is an important part of the urban air-quality problem and cannot be inferred from ground-only data. Similar arguments have been made in other UAV-based environmental applications, such as bushfire monitoring and plume tracking, where access to the vertical dimension is critical for characterizing transport and hazard evolution [2,18].
The hybrid strategy demonstrated here is continuous ground sensing plus targeted UAV sorties-fits naturally with the trend towards integrated monitoring architectures that combine fixed stations, dense low-cost nodes, and mobile platforms within a single information system [19,20]. In such systems, ground sensors provide the temporal backbone, while UAVs are deployed selectively to scan complex districts, verify dispersion patterns, and fill observational gaps. Our results add empirical support for this approach in a real high-density neighborhood and highlight its value for understanding micro-environmental differences tied to urban morphology.
4.3. Implications for Drone and Autonomous Sensing Systems
From the perspective of drones and autonomous vehicles, the campaign illustrates both the potential and the constraints of small multirotor platforms for urban air-quality mapping. Even with a relatively simple payload and manual or semi-manual flight planning, the CSJ KF101 platform was able to capture meaningful vertical and horizontal gradients that complemented the fixed network. This suggests that, with appropriate payload integration and endurance, small off-the-shelf UAVs can play a practical role in operational air-quality surveillance in dense cities.
At the same time, realizing the full potential of UAV-based monitoring will likely require more automation in mission planning, path optimization, and fleet coordination. Recent work on autonomous UAV networks for air-pollution mapping points towards multi-UAV systems that adaptively refine their trajectories based on evolving concentration fields and model predictions [2]. Our results provide real-world evidence on the scales of variability that such systems need to resolve (tens of meters horizontally and vertically) and the types of micro-environments, canyons versus open corridors, that merit targeted attention.
The findings also resonate with research on mobile and drive-by sensing systems, where vehicle-mounted sensors are used to map street-level pollution patterns [21,22,23]. While ground vehicles excel at horizontally dense coverage along road networks, they cannot access the vertical dimension. UAVs are therefore a natural complement to vehicle sensor networks, adding altitude-resolved information that can improve dispersion modelling, source attribution, and the interpretation of drive-by data.
Finally, the study connects with recent reviews on Air Quality Index metrics and machine-learning-based prediction of key pollutants [24,25]. The hybrid datasets produced by ground–UAV campaigns are particularly suitable for training and validating models that must capture complex spatial patterns in AQI-relevant indicators. In this sense, UAVs do not simply add another sensor platform; they enrich the data landscape needed for AI-driven forecasting, hotspot detection, and scenario analysis in smart-city frameworks.
4.4. Limitations and Future Directions
Several limitations of the present work should be acknowledged. In our earlier conference paper, we presented a structured review and an Information Systems Management (ISM) perspective on integrating UAV and ground sensor networks for city-wide air-quality monitoring, emphasizing system architecture, data flow, and operational considerations for scalable deployments. The present manuscript represents the next step: instead of remaining at the conceptual and review level, it implements a low-cost hybrid UAV–ground configuration in a real high-density urban setting and provides empirical evidence from repeatable multi-altitude transects, fixed-node temporal reference, and interpretable morphology descriptors. In other words, the earlier paper focused on the conceptual and systems perspective, while this manuscript provides empirical results from real deployment, including measurable dispersion behavior, repeated-hotspot analysis, and planning-relevant interpretation [26].
First, the field campaign was conducted in a single high-density district over a 40-day period, using a modest number of ground nodes and a limited set of UAV flights. The resulting dataset is well-suited for illustrating micro-scale heterogeneity and demonstrating the hybrid concept, but it does not capture the full seasonal and meteorological diversity of urban air pollution. Applying the same methodology across multiple districts, seasons, and cities with distinct morphologies would help to assess the generality of the observed patterns and to refine typologies of hotspots and limited-dispersion zones. Future campaigns should also examine a wider range of urban morphologies, including districts with different street-canyon geometries, building heights, and block layouts, to test whether the hotspot and limited-dispersion patterns observed here are consistent with relationships between dispersion and urban form reported in other high-density cities [27].
Second, particulate measurements relied on low-cost optical sensors (SDS011), which are known to be sensitive to humidity, particle composition, and ageing. Although basic co-location and quality-control procedures were applied, and the analysis focused on relative gradients rather than strict regulatory comparisons, uncertainties remain in the absolute concentration values. Future campaigns could combine low-cost sensors with periodic co-location against reference-grade instruments or employ improved correction models informed by laboratory characterization and field calibrations [14,15,16].
Third, UAV operations were constrained to relatively low altitudes and short-duration sorties due to platform endurance and regulatory considerations. This limited the vertical extent and temporal coverage of the profiles. As battery technology, platform efficiency, and regulatory frameworks evolve, longer and higher flights-potentially coordinated across multiple UAVs-could be used to capture the transition from the street-canyon layer into the overlying urban boundary layer and to track the evolution of pollution episodes more continuously [2,18].
Despite these limitations, the study provides a concrete example of how a small multirotor UAV equipped with a simple low-cost payload can augment a ground-based network and reveal micro-scale structure in urban air pollution. Building on this foundation, future work could integrate autonomous mission-planning algorithms, multi-UAV coordination, and real-time data assimilation into urban dispersion models, advancing towards operational hybrid systems that support day-to-day decision-making for healthier, more sustainable cities.
Recent UAV-driven environmental monitoring is also increasingly combining onboard imaging with deep learning for real-time hazard detection and adaptive coverage (e.g., transformer-based UAV fire monitoring), which points to a clear next step for urban PM sensing: augmenting particulate measurements with vision-derived context (traffic state, street-canyon geometry cues) and adaptive flight planning in dense urban settings [28].
5. Conclusions
This study combined a small ground-based sensor network with UAV-borne particulate matter measurements to investigate micro-scale air quality patterns in a high-density urban district. The results show that PM2.5 and PM10 concentrations vary strongly over short distances and modest changes in height, particularly within narrow street canyons and near busy traffic corridors. Three-day averages from the fixed stations revealed sustained episodes of elevated particulate levels, while the spatial spread across the network confirmed that different micro-environments within the same neighborhood can experience markedly different pollution regimes.
UAV-based measurements added a crucial vertical and along-path perspective. Co-located profiles demonstrated that concentrations at ~15 m above ground generally followed the temporal pattern observed at the pedestrian level but with damped peaks, indicating partial dilution and improved ventilation aloft. Horizontal transects along the main canyon and adjacent open corridors revealed localized hotspots and limited-dispersion zones that aligned with dense building configurations and constrained airflow. These findings reinforce the view that detailed urban morphology-building height, street geometry, and the presence or absence of open and vegetated spaces-plays a central role in modulating exposure at fine scales.
From a drone and autonomous sensing standpoint, the campaign highlights the practical value of small multirotor platforms for augmenting urban monitoring systems. Even with a relatively simple, low-cost payload, the UAV provided altitude-resolved, spatially flexible measurements that complemented the fixed network and revealed patterns invisible to ground stations alone. This supports the development of hybrid architectures that combine continuous ground sensing with targeted, on-demand UAV sorties to scan complex districts, validate dispersion models, and refine hotspot identification.
Looking ahead, the approach demonstrated here can be extended by increasing spatial and temporal coverage, integrating autonomous mission planning and multi-UAV coordination, and coupling hybrid measurements with high-resolution urban dispersion models. Such developments would move UAV-based air-quality sensing closer to operational deployment, enabling cities to better characterize micro-scale pollution, support exposure-aware mobility and planning decisions, and ultimately contribute to healthier and more sustainable urban environments.
Statement of the Use of Generative AI and AI-Assisted Technologies in the Writing Process
During the preparation of this manuscript, the authors used ChatGPT to assist with language editing. All content generated with this tool was subsequently reviewed and revised by the authors, who take full responsibility for the final version of the manuscript.
Acknowledgments
The authors would like to thank Darko T. and Tomislav P. for the donation of equipment used in this study. We are grateful to Vladimir N., Kultura-Gost., Rade B., Filip K. and Aleksandar J. for providing access to locations for the installation of ground sensors. We also thank Rade B. for allowing the use of his property as a take-off and landing site for UAV flights in the dense urban area.
Author Contributions
Conceptualization, B.J. and I.S.; Methodology, B.J.; Software, B.J.; Validation, B.J. and I.S.; Formal Analysis, B.J.; Investigation, B.J.; Resources, B.J.; Data Curation, B.J.; Writing-Original Draft Preparation, B.J.; Writing-Review & Editing, B.J. and I.S.; Visualization, B.J.; Supervision, I.S.; Project Administration, B.J.
Ethics Statement
Not applicable.
Informed Consent Statement
Not applicable.
Data Availability Statement
Available upon request.
Funding
This research received no external funding.
Declaration of Competing Interest
The authors declare that they have no known competing financial interests or personal relationships that could have appeared to influence the work reported in this paper.
References
-
Wu B, Liu C. Impacts of Building Environment and Urban Green Space Features on Urban Air Quality: Focusing on Interaction Effects and Nonlinearity. Buildings 2023, 13, 3111. DOI:10.3390/buildings13123111 [Google Scholar]
-
Bakirci M. Enhancing Air Pollution Mapping with Autonomous UAV Networks for Extended Coverage and Consistency. Atmos. Res. 2024, 298, 107480. DOI:10.1016/j.atmosres.2024.107480 [Google Scholar]
-
Kokate P, Middey A, Sadistap S, Sarode G, Narayan A. Review on Drone-Assisted Air-Quality Monitoring Systems. Drones Auton. Veh. 2023, 1, 10005. DOI:10.35534/dav.2023.10005 [Google Scholar]
-
Aurell J, Gullett BK. Effects of UAS Rotor Wash on Air Quality Measurements. Drones 2024, 8, 73. DOI:10.3390/drones8030073 [Google Scholar]
-
Villa TF, Salimi F, Morton K, Morawska L, Gonzalez F. Development and Validation of a UAV Based System for Air Pollution Measurements. Sensors 2016, 16, 2202. DOI:10.3390/s16122202 [Google Scholar]
-
Wang T, Han W, Zhang M, Yao X, Zhang L, Peng X, et al. Unmanned Aerial Vehicle-Borne Sensor System for Atmosphere-Particulate-Matter Measurements: Design and Experiments. Sensors 2020, 20, 57. DOI:10.3390/s20010057 [Google Scholar]
-
Sharma V, Sharma M, Jain S. Unmanned aerial vehicles and low-cost sensors for air quality monitoring: A comprehensive review of applications across diverse emission sources. Sustain. Cities Soc. 2025, 127, 106409. DOI:10.1016/j.scs.2025.106409 [Google Scholar]
-
Back Market. CSJ KF101 Drone—30 Mins (Product Page). Available online: https://www.backmarket.ie/en-ie/p/csj-kf101-drone-30-min/c36cd5e1-ac78-493b-bcda-65dad25c9aa4?l=11 (accessed on 19 October 2025).
-
Raspberry Pi Ltd. Raspberry Pi 3 Model B+ (Product Page). Available online: https://www.raspberrypi.com/products/raspberry-pi-3-model-b-plus/ (accessed on 19 October 2025).
-
World Air Quality Index Project. SDS011 Air Quality Sensor (Nova Fitness)—Specifications and Calibration. Available online: https://aqicn.org/sensor/sds011/ (accessed on 19 October 2025).
-
Restas A. Drone Applications for Preventing and Responding HAZMAT Disaster. World J. Eng. Technol. 2016, 4, 76–84. DOI:10.4236/wjet.2016.43C010 [Google Scholar]
-
Nugroho NY, Triyadi S, Wonorahardjo S. Effect of High-Rise Buildings on the Surrounding Thermal Environment. Build. Environ. 2022, 206, 108393. DOI:10.1016/j.buildenv.2021.108393 [Google Scholar]
-
Snyder EG, Watkins TH, Solomon PA, Thoma ED, Williams RW, Hagler GSW, et al. The Changing Paradigm of Air Pollution Monitoring. Environ. Sci. Technol. 2013, 47, 11369–11377. DOI:10.1021/es4022602 [Google Scholar]
-
Kumar P, Morawska L, Martani C, Biskos G, Neophytou S, Bell M, et al. The Rise of Low-Cost Sensing for Managing Air Pollution in Cities. Environ. Int. 2015, 75, 199–205. DOI:10.1016/j.envint.2014.11.019 [Google Scholar]
-
Castell N, Dauge F, Schneider P, Vogt M, Lerner U, Fishbain B, et al. Can Commercial Low-Cost Sensor Platforms Contribute to Air Quality Monitoring and Exposure Estimates? Environ. Int. 2017, 99, 293–302. DOI:10.1016/j.envint.2016.12.007 [Google Scholar]
-
Molka-Danielsen J, Engelseth P, Wang H. Large Scale Integration of Wireless Sensor Network Technologies for Air Quality Monitoring at a Logistics Shipping Base. J. Ind. Inf. Integr. 2018, 10, 20–28. DOI:10.1016/j.jii.2018.02.001 [Google Scholar]
-
Tafa Z. WSNs in Environmental Monitoring: Data Acquisition and Dissemination Aspects. Adv. Comput. 2021, 126, 65–149. DOI:10.1016/bs.adcom.2021.11.010 [Google Scholar]
-
Munawar HS, Ullah F, Khan SI, Qadir Z, Qayyum S. UAV Assisted Spatiotemporal Analysis and Management of Bushfires: A Case Study of the 2020 Victorian Bushfires. Fire 2021, 4, 40. DOI:10.3390/fire4030040 [Google Scholar]
-
Du C, Zhu S. Research on Urban Public Safety Emergency Management Early Warning System Based on Technologies for the Internet of Things. Procedia Eng. 2012, 45, 748–754. DOI:10.1016/j.proeng.2012.08.234 [Google Scholar]
-
Fang S, Xu LD, Zhu Y, Ahati J, Pei H, Yan J, et al. An Integrated System for Regional Environmental Monitoring and Management Based on Internet of Things. IEEE Trans. Ind. Inform. 2014, 10, 1596–1605. DOI:10.1109/TII.2014.2302638 [Google Scholar]
-
Niska H, Hiltunen T, Karppinen A, Ruuskanen J, Kolehmainen M. Evolving the Neural Network Model for Forecasting Air Pollution Time Series. Eng. Appl. Artif. Intell. 2004, 17, 159–167. DOI:10.1016/j.engappai.2004.02.002 [Google Scholar]
-
Zherka B, Tafa Z. A Vehicle Sensor Network for Real-Time Air Pollution Analysis. J. Adv. Inf. Technol. 2023, 14, 39–45. DOI:10.12720/jait.14.1.39-45 [Google Scholar]
-
Zarrar H, Dyo V. Drive-by Air Pollution Sensing Systems: Challenges and Future Directions. IEEE Sens. J. 2023, 23, 23692–23703. DOI:10.1109/JSEN.2023.3305779 [Google Scholar]
-
Abas M, Zeeshan M, Khalil MH, Sial SA, Yaqoob Z, Sial DG, et al. Navigating Air Quality Assessment: A Holistic Review of Air Quality Index Metrics and Assessment Approaches. Asian J. Geol. Res. 2024, 7, 184–204. Available online: https://journalajoger.com/index.php/AJOGER/article/view/164 (accessed on 26 February 2026).
-
Essamlali I, Nhaila H, El Khaili M. Supervised Machine Learning Approaches for Predicting Key Pollutants and for the Sustainable Enhancement of Urban Air Quality: A Systematic Review. Sustainability 2024, 16, 976. DOI:10.3390/su16030976 [Google Scholar]
-
Jeliskoski B, Stojmenovska I. Integrating UAV and Ground Sensory Networks for Enhanced City-Wide Air Quality Monitoring: A Review and Approach in Information Systems Management. In Proceedings of the 21st International Conference on Informatics and Information Technologies (CIIT), Strumica, North Macedonia, 19–20 April 2024; pp. 53–58. [Google Scholar]
-
Yuan C, Ng E, Norford LK. Improving Air Quality in High-Density Cities by Understanding the Relationship Between Air Pollutant Dispersion and Urban Morphologies. Build. Environ. 2014, 71, 245–258. DOI:10.1016/j.buildenv.2013.10.008 [Google Scholar]
-
Muksimova S, Umirzakova S, Mardieva S, Abdullaev M, Cho YI. Revolutionizing Wildfire Detection Through UAV-Driven Fire Monitoring with a Transformer-Based Approach. Fire 2024, 7, 443. DOI:10.3390/fire7120443 [Google Scholar]