Data-Driven Design of High-Purity Ni–Cr–Nb Master Alloy and Its Application in Scale-Up GH4169D Alloy

Data-Driven Design of High-Purity Ni–Cr–Nb Master Alloy and Its Application in Scale-Up GH4169D Alloy
Di Wang 1 Renhai Shi 2,* Qintian Zhu 1,* Xin Qi 1 Hang Dong 1
Received: 27 December 2025 Revised: 02 February 2026 Accepted: 26 February 2026 Published: 03 March 2026

© 2026 The authors. This is an open access article under the Creative Commons Attribution 4.0 International License (https://creativecommons.org/licenses/by/4.0/).
1. Introduction
GH4169D alloy, as a typical precipitation-strengthened alloy, is widely used for high-temperature load-bearing components in aero-engines and gas turbines owing to its excellent high-temperature strength, creep resistance, and microstructural stability. It serves as a critical material foundation supporting the safe and reliable operation of advanced equipment under extreme service conditions [1,2]. Extensive studies have demonstrated that the long-term service performance of GH4169D alloy is highly dependent on its metallurgical cleanliness. High concentrations of gaseous impurities, including oxygen and nitrogen [3], as well as a high number density and large size of non-metallic inclusions [4], can induce crack initiation at stress concentration sites, thereby accelerating fatigue damage and significantly shortening service life [1,5]. Consequently, improving the metallurgical cleanliness of GH4169D alloy is of great significance for enhancing service reliability and lifetime, and for supporting the independent development and engineering deployment of advanced superalloys.
To address this bottleneck, both domestic and international studies have mainly pursued two routes: improving raw material purity and optimizing melting processes. These approaches can effectively reduce impurity levels and suppress inclusion formation to a certain extent [6,7]. Feng et al. reported that increasing the purity of chromium raw materials led to a significant reduction in N, P, S, and Mn contents in GH4169 alloy, accompanied by a transformation of inclusion types from complex composite structures to single oxides and a marked decrease in inclusion population [8]. Gao et al. investigated the vacuum induction melting (VIM) process of nickel-based superalloys containing a high proportion of recycled materials and demonstrated that high-temperature interfacial reactions between the molten alloy and the crucible or refractory materials significantly increased the oxygen activity in the melt. This promoted the extensive formation of Al2O3 and magnesium aluminate spinel inclusions, which subsequently collided, aggregated, and coarsened during the melting process, resulting in a pronounced increase in inclusion size [9]. In addition, studies on the fatigue behavior of Inconel 718 alloy have revealed that Nb- and Ti-enriched non-metallic inclusions serve as the primary sites for crack initiation under high-cycle and even very-high-cycle fatigue conditions. Enhancing metallurgical cleanliness can therefore substantially improve the strength, ductility, and fatigue life of the alloy [10], further confirming the critical role of cleanliness in determining service performance.
However, the effectiveness of further improving alloy cleanliness through raw material purification and process parameter optimization has shown diminishing returns [11] while incurring extremely high costs. In this context, high-purity master alloys have been proposed as compositional carriers [12] to enable the clean introduction of key elements and suppress inclusion formation during melting [13], offering a potentially more cost-effective and industrially viable alternative. Nevertheless, existing studies have largely focused on binary master alloy systems, such as Ni–Nb [14,15] and Ni–Cr [16], with emphasis primarily on elemental recovery efficiency and qualitative characterization of inclusions. Systematic multi-compositional design strategies tailored for high-purity requirements remain relatively scarce, and there is still a lack of mechanistic understanding and industrial-scale validation regarding the effectiveness of master alloys in improving metallurgical cleanliness during scale-up superalloy melting. In contrast, CALPHAD-aided design has recently been demonstrated as an efficient paradigm for composition screening and phase-stability control in complex multi-component alloys (including Nb-containing systems), where thermodynamic modeling is used to constrain compositional space and guide targeted experimental validation [17,18]. These advances motivate extending CALPHAD-guided, constraint-driven design beyond phase optimization to impurity-element control and inclusion cleanliness, which remains a key gap for master-alloy-enabled high-purity melting.
Based on the above research gaps, the present study focuses on the design of a high-purity Ni–Cr–Nb master alloy that can be directly applied in melting processes of GH4169D alloy. By employing a CALPHAD-based high-throughput computational approach in combination with regulation of the melting process, the effects of the master alloy on inclusion evolution behavior and impurity element control are elucidated. Furthermore, its effectiveness in improving the metallurgical cleanliness of scale-up GH4169D alloy is validated under 3-ton industrial-scale melting conditions. This work provides theoretical support for the compositional design and preparation of Ni–Cr–Nb master alloys, and offers an industrially transferable pathway for high-purity melting of superalloys.
2. Experimental Methods
2.1. CALPHAD-Based Compositional Design of the Master Alloy
In this study, a CALPHAD-based compositional design approach was employed to develop a high-purity Ni–Cr–Nb ternary master alloy that meets industrial melting requirements. Thermo-Calc 2021a software with the TCNI10 database (hereafter referred to as TC software) was used to perform compositional screening under a set of empirically constrained criteria. A schematic illustration of the compositional design constraints is presented in Figure 1.
The designed NixCryNbz ternary master alloy compositions were required to satisfy four categories of screening conditions. First, the stoichiometric coefficients x, y, and z of Ni, Cr, and Nb, respectively, were varied from 0 to 1 with an interval of 0.05 under the constraint x + y + z = 1, generating a total of 231 candidate alloy compositions. Second, the mass ratio of Cr to Nb was constrained to the range of 2–4, with the combined mass fraction of Cr and Nb exceeding 0.25. Third, the alloy liquidus temperature was required to be below 1400 °C, and the molar fractions of precipitated elemental Cr and Nb after solidification were limited to less than 5%. Fourth, under low-oxygen melting conditions (e.g., x(O) = 0.01), the alloy was required to exhibit weak affinity toward oxygen and nitrogen.
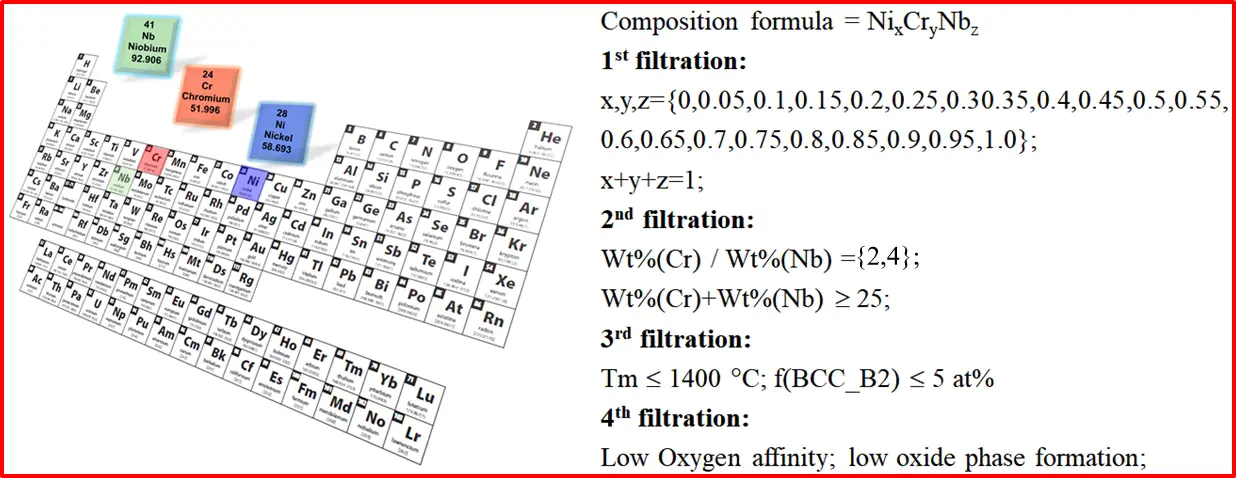
Figure 1. Schematic illustration of empirical constraint conditions for alloy compositional screening.
2.2. Preparation of the Master Alloy and GH4169D Alloy
2.2.1. Preparation of the Ni–Cr–Nb Master Alloy
The Ni–Cr–Nb master alloy was prepared using nickel plates, chromium blocks, and niobium bars as raw materials in a 3-ton vacuum induction melting (VIM) furnace, with an alumina crucible employed as the melting container. Prior to melting, the vacuum level inside the furnace was stabilized below 10 Pa to reduce the activities of oxygen and nitrogen during the melting stage. The charge materials were then added stepwise in a predetermined sequence and completely melted under a controlled atmosphere.
After complete melting, electromagnetic stirring was conducted at a power of 200 kW for 15 min to promote compositional homogenization of the molten alloy. Subsequently, a 60-min holding period was applied to allow sufficient flotation time for inclusions in the liquid phase. Finally, the melt was poured at 1430 ± 10 °C to obtain an industrial-scale ingot with a diameter of Φ340 mm.
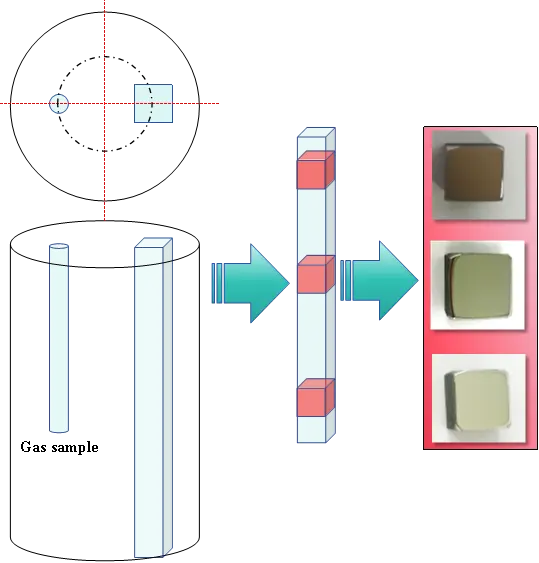
To investigate the evolution of metallurgical cleanliness during the melting process, intermediate samples were collected at four stages: after completely melting, after stirring, after holding, and prior to pouring. Each sample had dimensions of Φ50 mm × 80 mm. To minimize the influence of microstructural heterogeneity along the height direction, metallographic specimens with dimensions of 10 mm × 10 mm × 10 mm were prepared from the R/2 position at three heights—1/6 (top), 1/2 (middle), and 5/6 (bottom)—for each sample. In addition, Φ5 mm × 50 mm rods were machined for oxygen and nitrogen analysis. The sampling locations are illustrated in Figure 2. The oxygen and nitrogen contents were determined by an accredited third-party testing laboratory using an oxygen–nitrogen analyzer based on the inert gas fusion principle. Oxygen was quantified by infrared (IR) detection of CO/CO2 generated during fusion, and nitrogen was quantified by thermal conductivity detection (TCD). According to the laboratory’s accredited measurement specification, the measurement uncertainty is within ±2 ppm for both O and N. The official reports provide only the measured values and do not report replicate scatter (e.g., standard deviations); therefore, error bars are not included for O/N data in the present manuscript.
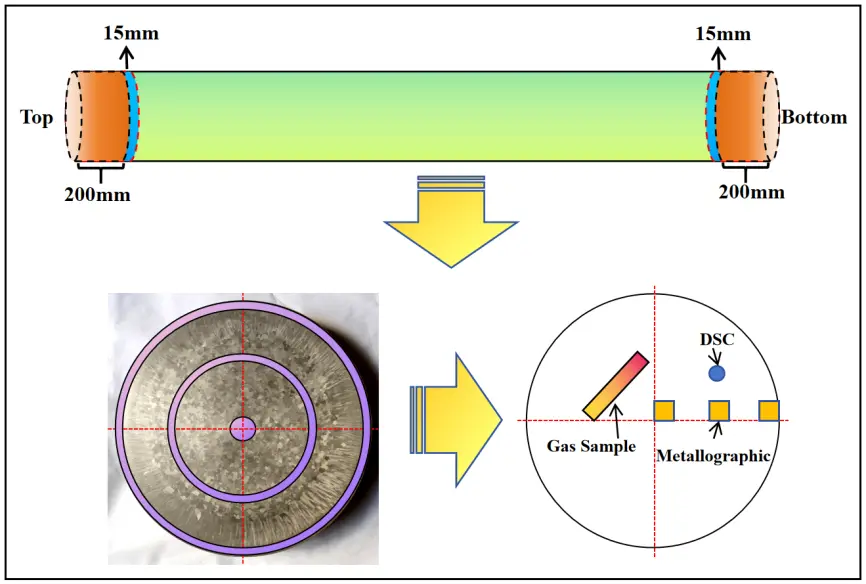
After ingot solidification, low-magnification inspection slices with a thickness of 15 mm were cut at positions 200 mm from both the top and bottom of the ingot to systematically characterize the spatial distribution of inclusions during solidification. Based on the differences in solidification conditions corresponding to typical low-magnification microstructural regions, metallographic specimens were prepared at the center, R/2, and edge positions of each section to reveal the radial distribution behavior of inclusions. In addition, Φ5 mm × 50 mm rods for oxygen and nitrogen analysis and Φ5 mm × 1 mm specimens for differential scanning calorimetry (DSC) were extracted at the R/2 position to evaluate gas impurity contents and melting characteristics, respectively. The sampling scheme is shown in Figure 3.
All metallographic specimens were prepared using standard grinding and polishing procedures and subsequently characterized using a JSM-7200F (JEOL Ltd., Tokyo, Japan) scanning electron microscope (SEM) equipped with an energy-dispersive spectrometer (EDS) to analyze inclusion morphology and composition. To ensure statistical representativeness and reproducibility, 100 random fields of view were analyzed for each specimen to quantify inclusion number density, size distribution, and chemical composition. This statistical approach effectively minimizes bias arising from local microstructural heterogeneity and provides a reliable basis for comparing different melting stages and sampling positions.
2.2.2. Preparation of Scale-Up GH4169D Alloy
To evaluate the industrial applicability of the Ni–Cr–Nb master alloy and quantitatively assess its effect on improving the metallurgical cleanliness of GH4169D alloy, comparative melting experiments were conducted using two different melting routes: a conventional route based entirely on virgin charge materials and a route employing the master alloy as a partial source of alloying elements. The final chemical compositions of the two GH4169D alloys are listed in Table 1. The ingot prepared using the virgin-material route is denoted as #1, while the ingot produced using the master-alloy-assisted route is denoted as #2.
Except for the intentional omission of the high-temperature refining step in route #2, both experiments were conducted under strictly identical conditions, including the melting schedule, vacuum level, electromagnetic stirring parameters, and pouring temperature (1450 ± 10 °C). Industrial-scale ingots with a diameter of Φ340 mm were produced for both routes to ensure comparability and engineering relevance. It should be noted that high-temperature refining is generally a purification operation; therefore, omitting this step would not be expected to improve cleanliness by itself. Rather, the refining step was omitted to address an industrially relevant question: whether the proposed master-alloy strategy can achieve comparable (or improved) oxygen control and inclusion cleanliness within a shortened process chain by suppressing primary oxide formation already during the melting stage.
After solidification, low-magnification inspection slices 15 mm thick were cut from the bottoms of both ingots. This location was selected following common industrial quality-evaluation practice, as it largely avoids the hot-top/riser and shrinkage-related regions, where feeding behavior, porosity, and macrosegregation can interfere with inclusion statistics and reduce comparability. Metallographic specimens were prepared at the center, R/2, and edge positions of each slice to analyze the radial distribution characteristics of inclusions (the ingot appearance and sampling locations are shown in Figure 4). The primary objective of this work was a controlled comparison between two melting routes; therefore, the same sampling position and protocol were applied to both ingots to quantify the relative improvement attributable to the master-alloy-assisted route under identical evaluation conditions. In addition, considering the downstream industrial processing plan for the produced ingots, only the bottom section was available for destructive inclusion characterization in the present study. All specimens were examined using SEM and EDS to characterize the morphology, size, and composition of inclusions. By comprehensively comparing inclusion number density, size distribution, and oxygen and nitrogen contents, the effectiveness of the Ni–Cr–Nb master alloy in improving the metallurgical cleanliness of GH4169D alloy was quantitatively evaluated, and its process advantages and application potential under industrial melting conditions were validated.
Table 1. Chemical composition of the GH4169D alloy (wt.%).
|
Experimental Group |
C |
Cr |
Nb |
Mo |
Ti |
Al |
Co |
Fe |
W |
|---|---|---|---|---|---|---|---|---|---|
|
1# |
0.018 |
17.74 |
5.52 |
2.70 |
0.80 |
1.66 |
9.26 |
9.59 |
0.97 |
|
2# |
0.018 |
18.00 |
5.55 |
2.77 |
0.81 |
1.65 |
9.45 |
9.60 |
0.98 |
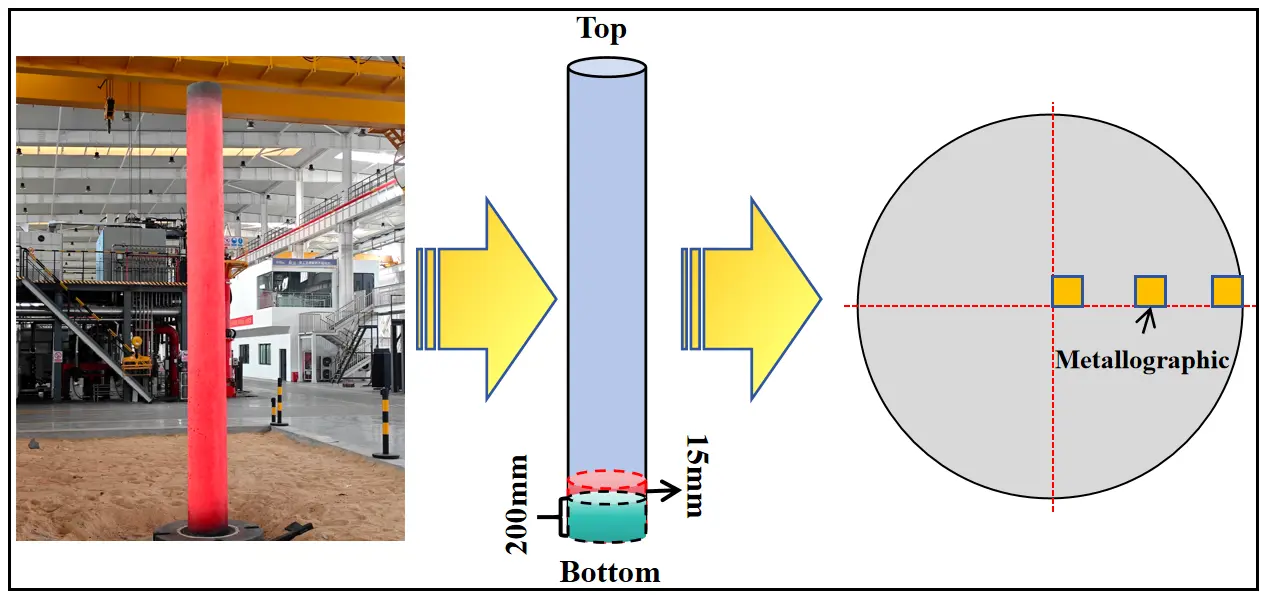
Figure 4. Photograph of the scale-up GH4169D ingot and schematic illustration of sampling locations.
3. Results and Discussion
3.1. CALPHAD-Based Compositional Design
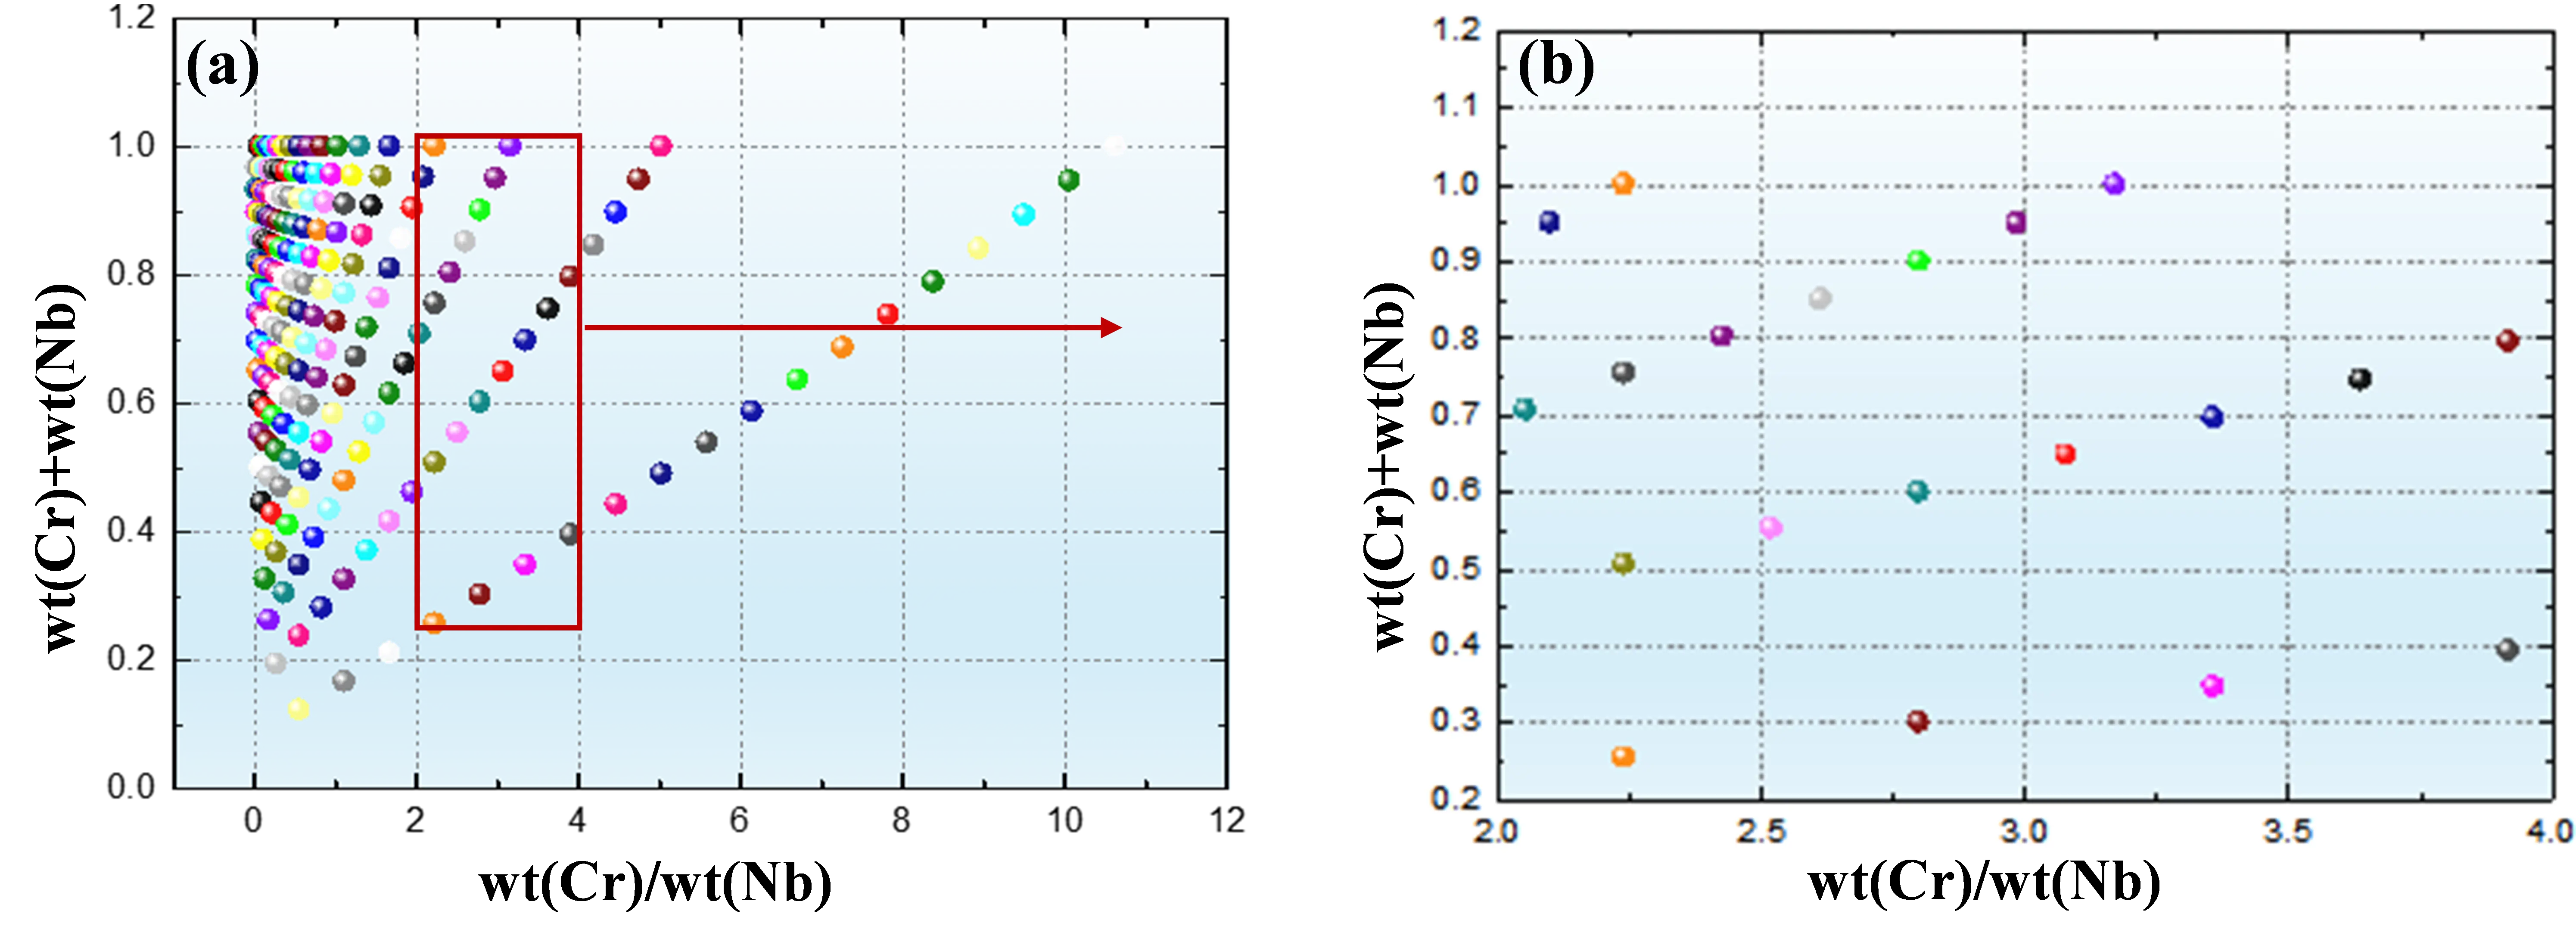
Based on constraint condition (2), the calculated Cr/Nb mass ratio and combined mass fraction of Cr and Nb for different alloys are presented in Figure 5. As shown in Figure 5a, the 231 candidate alloy compositions generated under constraint condition (1) generally exhibit relatively high combined mass fractions of Cr and Nb, whereas the mass ratio of Cr to Nb remains low for most compositions. Among the 231 candidate alloys, only 20 compositions satisfy constraint condition (2), as illustrated in Figure 5b.
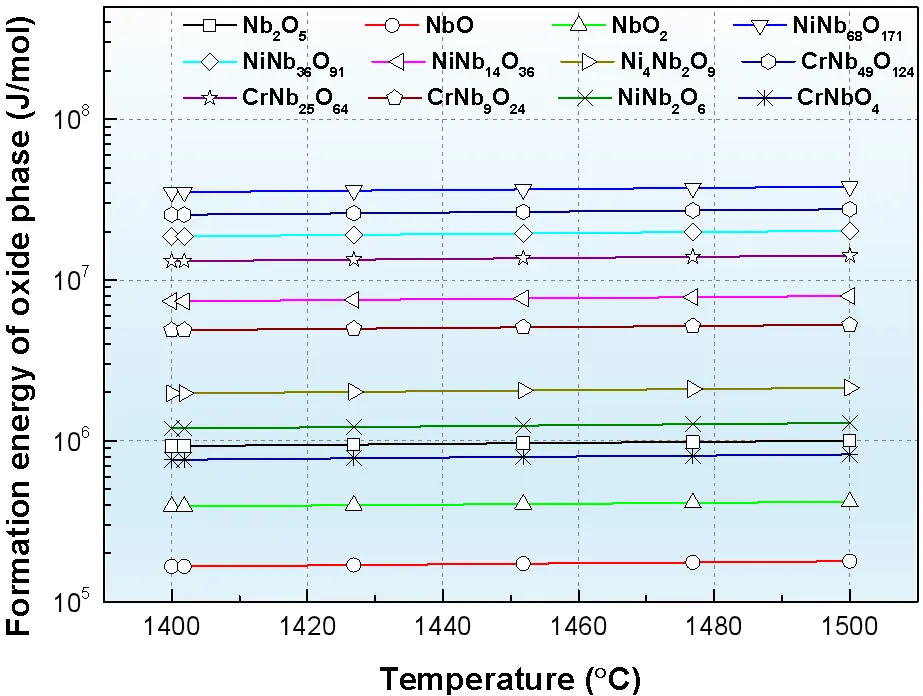
To further investigate the oxidation tendency of alloying elements, the formation behavior of relevant oxides in the Ni–Cr–Nb system was analyzed using the Tabulation Module in Thermo-Calc software with the TCOX10 database. To compare the relative thermal stability of each oxide phase, we modeled the reaction according to the equation $$xA+\left(y/2\right){O}_{2}\to {A}_{x}{O}_{y}$$. The resulting formation energy of each oxide phase is reported per mole of oxide formed, with all substances referenced to their standard state (T = 298.15 K, P = 1 bar). The calculated relationship between oxide formation energy and temperature is shown in Figure 6. The results indicate that the formation energies of various oxides exhibit only minor variation within the temperature range of 1400–1500 °C. Among them, NbO possesses the lowest formation energy, indicating the strongest tendency for formation, whereas NiNb68O171 exhibits the highest formation energy, corresponding to the weakest tendency. These results demonstrate that Nb shows the strongest affinity toward oxygen in the Ni–Cr–Nb system.
The solidification behavior of the 20 candidate alloys (denoted as #1–#20) was further evaluated using the Scheil solidification model implemented in Thermo-Calc. The calculated solidification paths are shown in Figure 7. Alloys #1–#15 exhibit relatively high fractions of precipitated elemental phases (>15%), and alloys #1 and #2 show initial solidification temperatures exceeding 1400 °C. According to constraint condition (3), only five alloys (#16–#20), with compositions listed in Table 2, satisfy the requirements of a liquidus temperature below 1400 °C and molar fractions of precipitated elemental Cr and Nb below 5% after solidification.
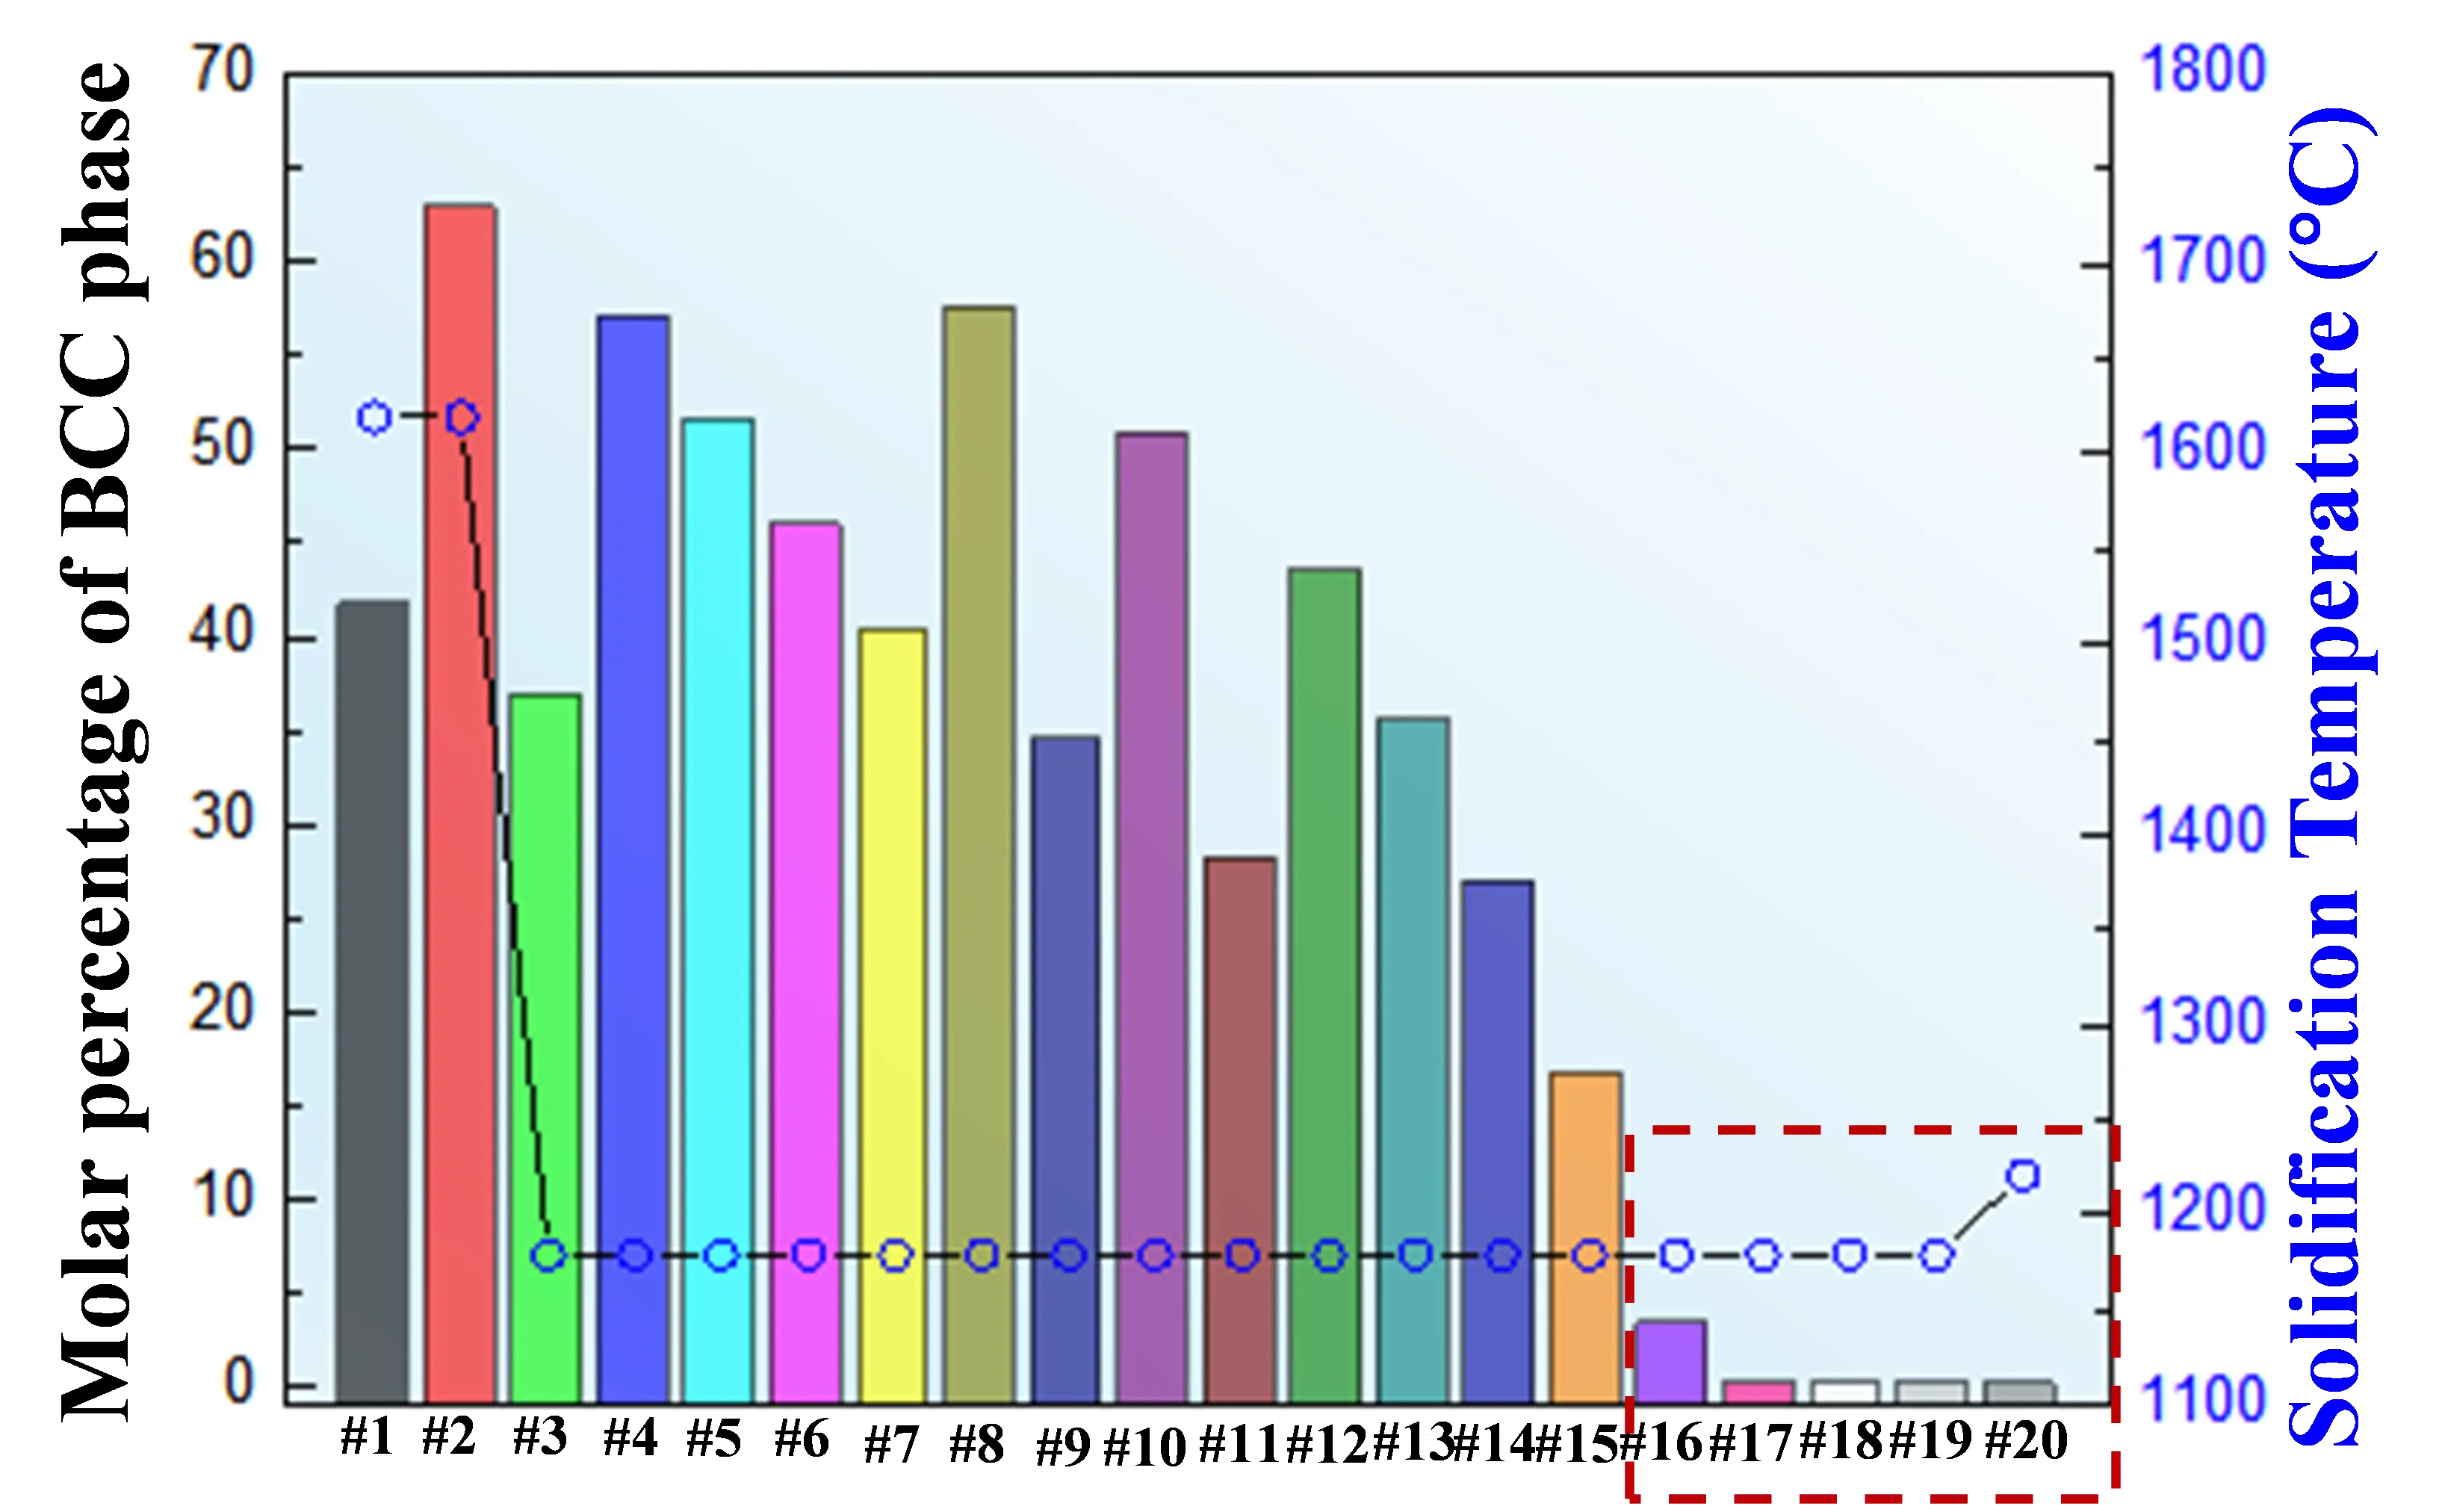
Figure 7. Molar fraction of precipitated BCC elemental phases and initial solidification temperature for the candidate alloys.
Table 2. Chemical compositions and calculated properties of alloys #16–#20.
|
No. |
Wt(Ni) |
Wt(Cr) |
Wt(Nb) |
Wt(Cr)/Wt(Nb) |
Wt(Cr) + Wt(Nb) |
Melting Point (°C) |
|---|---|---|---|---|---|---|
|
#16 |
0.494 |
0.350 |
0.159 |
2.239 |
0.506 |
1179 |
|
#17 |
0.607 |
0.313 |
0.080 |
3.918 |
0.393 |
1179 |
|
#18 |
0.653 |
0.267 |
0.080 |
3.358 |
0.347 |
1179 |
|
#19 |
0.700 |
0.221 |
0.079 |
2.798 |
0.300 |
1178 |
|
#20 |
0.745 |
0.176 |
0.079 |
2.239 |
0.255 |
1220 |
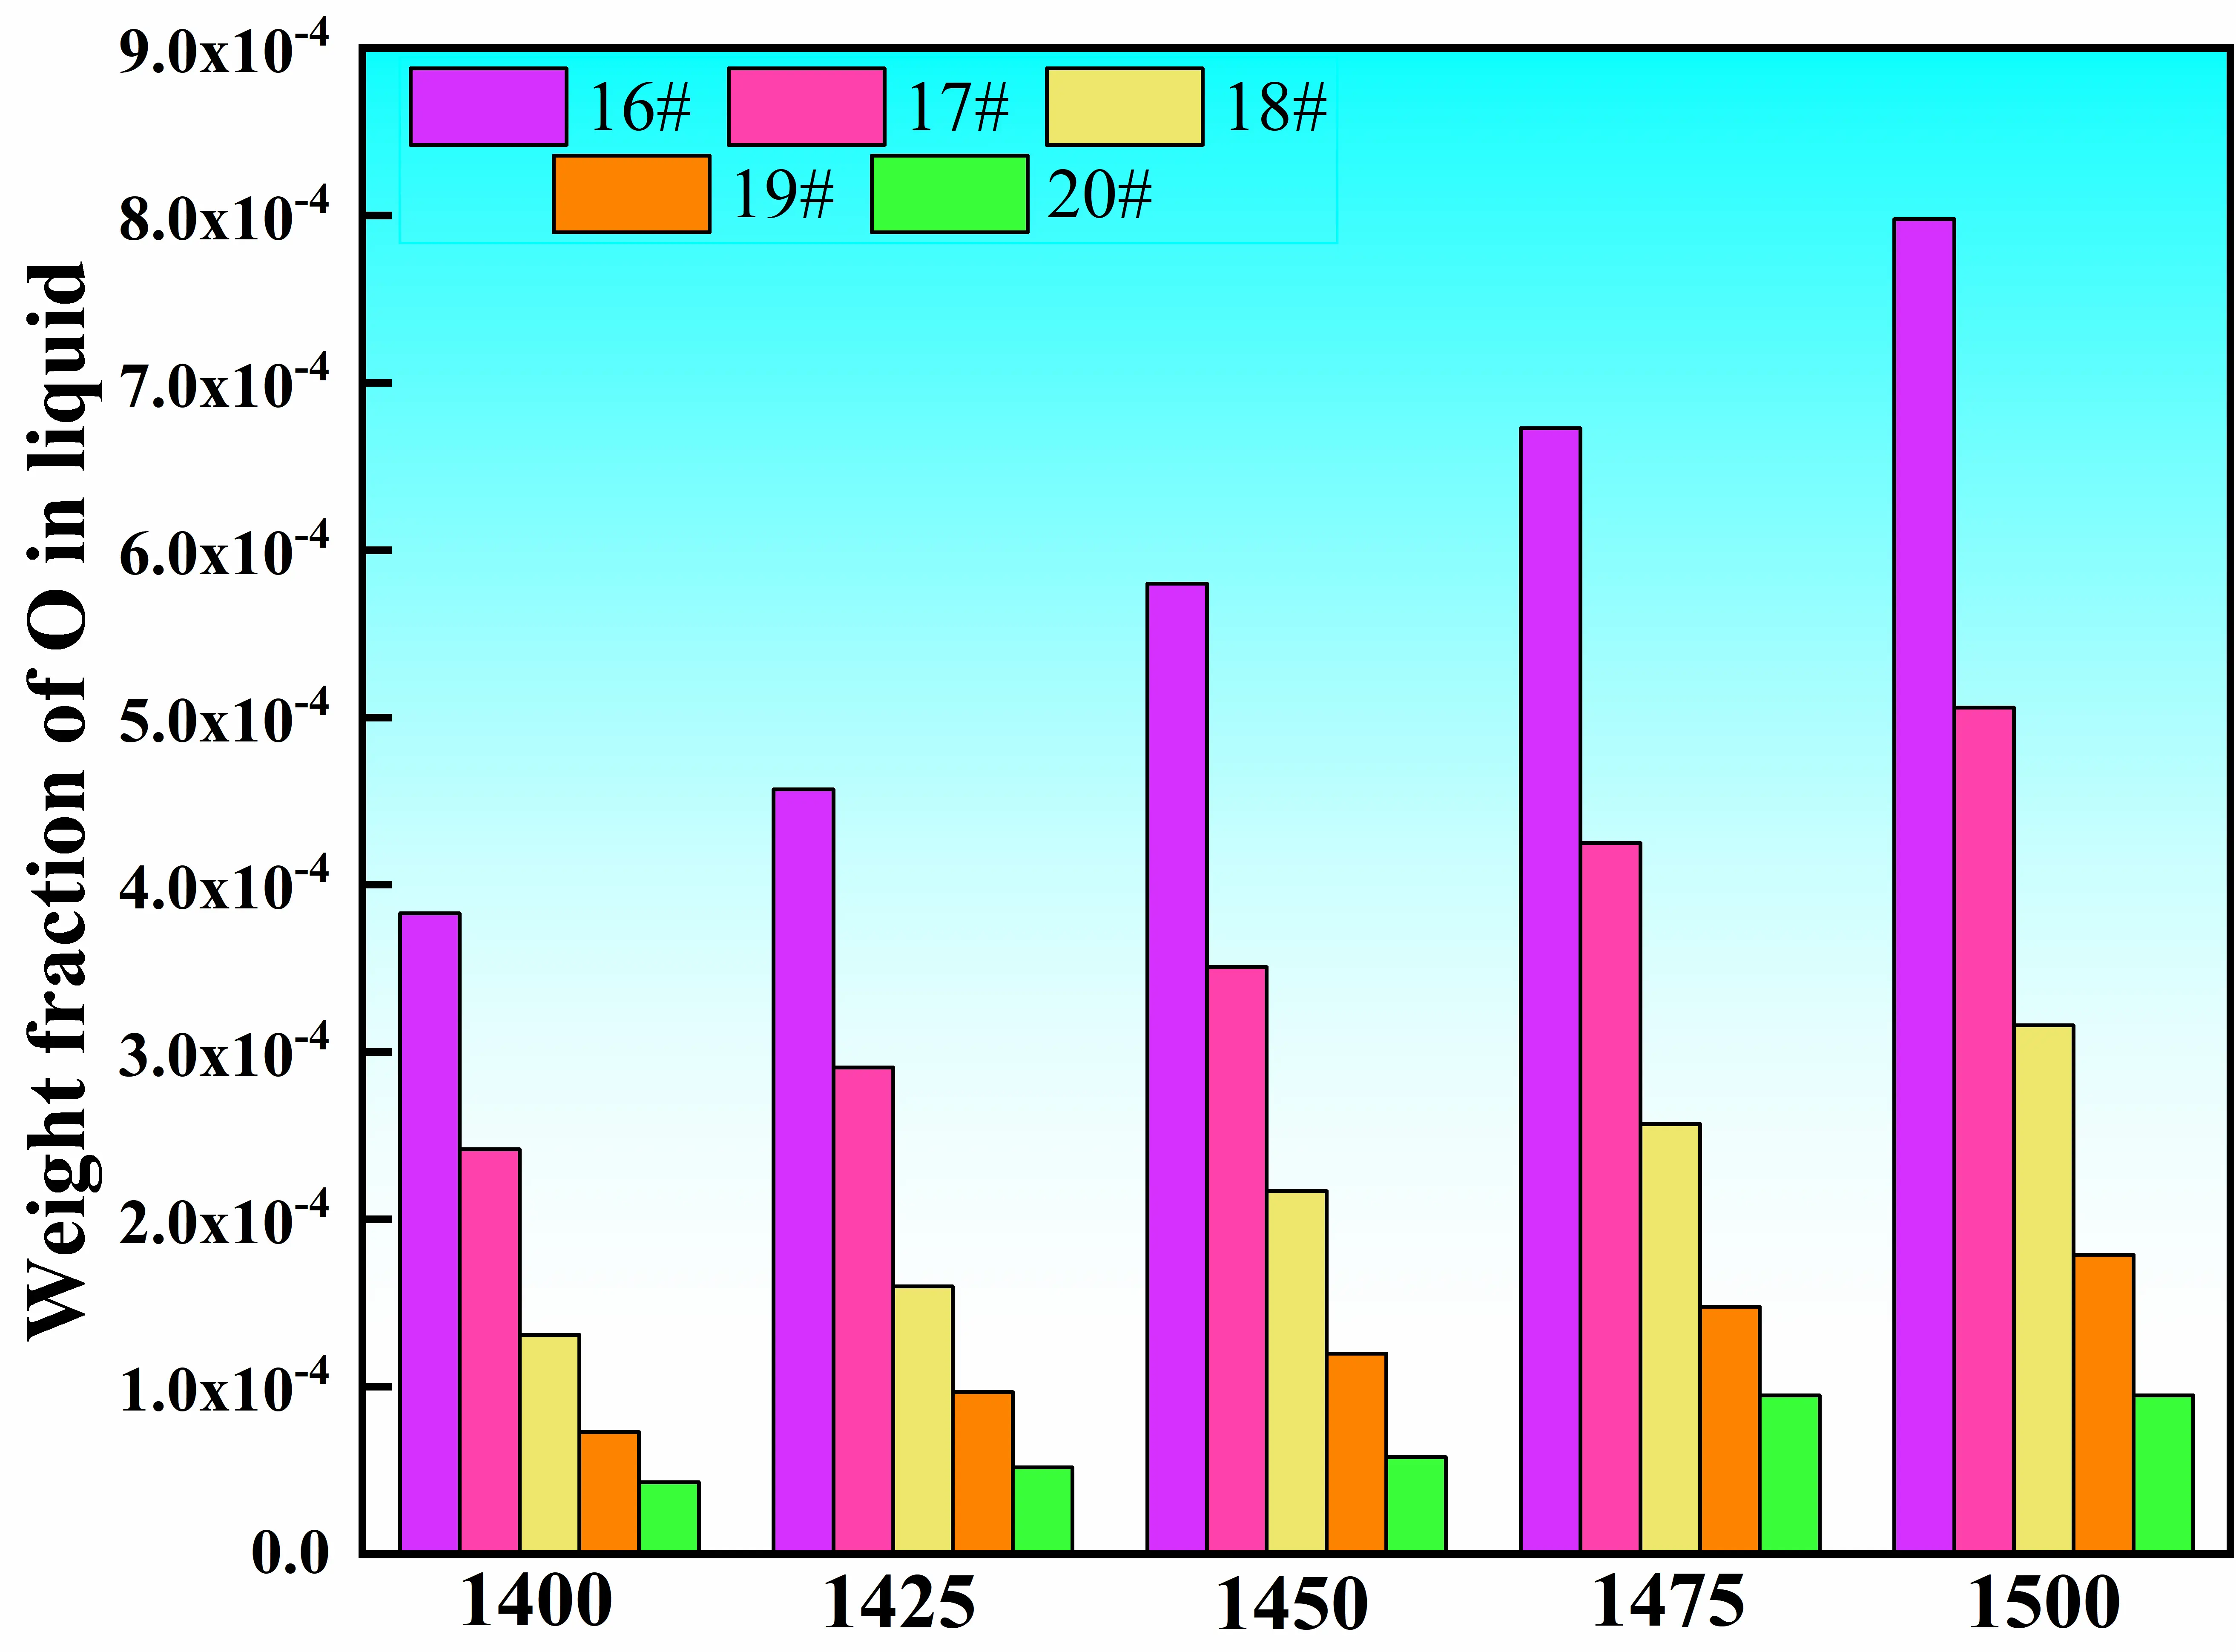
To further assess the oxygen affinity of these five alloys, the relationship between melt oxygen content and temperature was calculated over the range of 1400–1500 °C, as shown in Figure 8. The results reveal that the oxygen content of the melt increases with increasing temperature for all alloys. At a given temperature, the melt oxygen content decreases progressively from alloy #16 to alloy #20. This trend can be attributed to the gradual reduction in Nb content, which exhibits the strongest affinity toward oxygen, as indicated in Figure 5. These results suggest that the oxygen content of the melt is jointly governed by melt temperature and alloy composition.
Based on the comprehensive screening imposed by the above constraint conditions, alloys #16–#20 satisfy the fundamental design requirements. Considering the combined effects of liquidus temperature, Cr/Nb mass ratio, and oxygen affinity, alloy #18 exhibits the most favorable balance among these factors and is therefore selected as the final master alloy composition for subsequent experimental preparation and validation.
3.2. Characterization of the Master Alloy Quality
3.2.1. Impurity Element Contents
Based on the optimized compositional design, a 3-ton industrial-scale master alloy ingot was prepared using the #18 alloy composition. The stage-dependent evolution of oxygen and nitrogen contents during the melting process is summarized in Table 3. As shown, both gaseous impurity elements exhibit distinct variations in response to different melting stages.
The oxygen content decreases rapidly from the theoretical value introduced by the raw materials (127 ppm) to 37 ppm during the melting stage, then increases slightly during the stirring and holding stages, remaining at a low overall level. In contrast, the nitrogen content decreases from 80 ppm to approximately 34 ppm and subsequently stabilizes within the range of 30–40 ppm throughout the later stages.
Table 3. Evolution of major-element and impurity-element contents during the melting process of the master alloy.
|
No. |
Sampling Stage |
Ni |
Cr |
Nb |
C |
S |
Al |
O |
N |
|---|---|---|---|---|---|---|---|---|---|
|
1 |
Raw materials |
/ |
/ |
/ |
/ |
/ |
0.0154 |
0.0127 |
0.0080 |
|
2 |
Melting stage |
65.6 |
26.2 |
7.95 |
0.011 |
0.0014 |
0.0156 |
0.0037 |
0.0034 |
|
3 |
After electromagnetic stirring |
65.16 |
26.14 |
7.85 |
0.0086 |
0.0010 |
0.0155 |
0.0048 |
0.0031 |
|
4 |
After holding for 1 h |
65.19 |
26.11 |
7.94 |
0.012 |
0.0010 |
0.0156 |
0.0048 |
0.0034 |
|
5 |
Prior to reheating and pouring |
65.23 |
26.17 |
7.83 |
0.012 |
0.0010 |
0.0182 |
0.0076 |
0.0036 |
The sharp reduction in oxygen content during the melting stage can be attributed to the synergistic effects of a high-vacuum environment and self-deoxidation reactions of the charge materials, which enable rapid removal of dissolved oxygen from the melt [19]. The slight increase in oxygen content observed during the stirring stage primarily reflects the homogenization of the melt composition, whereby initially non-uniform, locally oxygen-enriched regions formed during early melting are redistributed, revealing the true bulk oxygen level. Upon entering the holding stage, the oxygen content remains essentially constant, indicating that, as superheat decreases and the furnace temperature stabilizes, the alumina crucible operates within a structurally stable regime and its contribution to oxygen supply becomes limited.
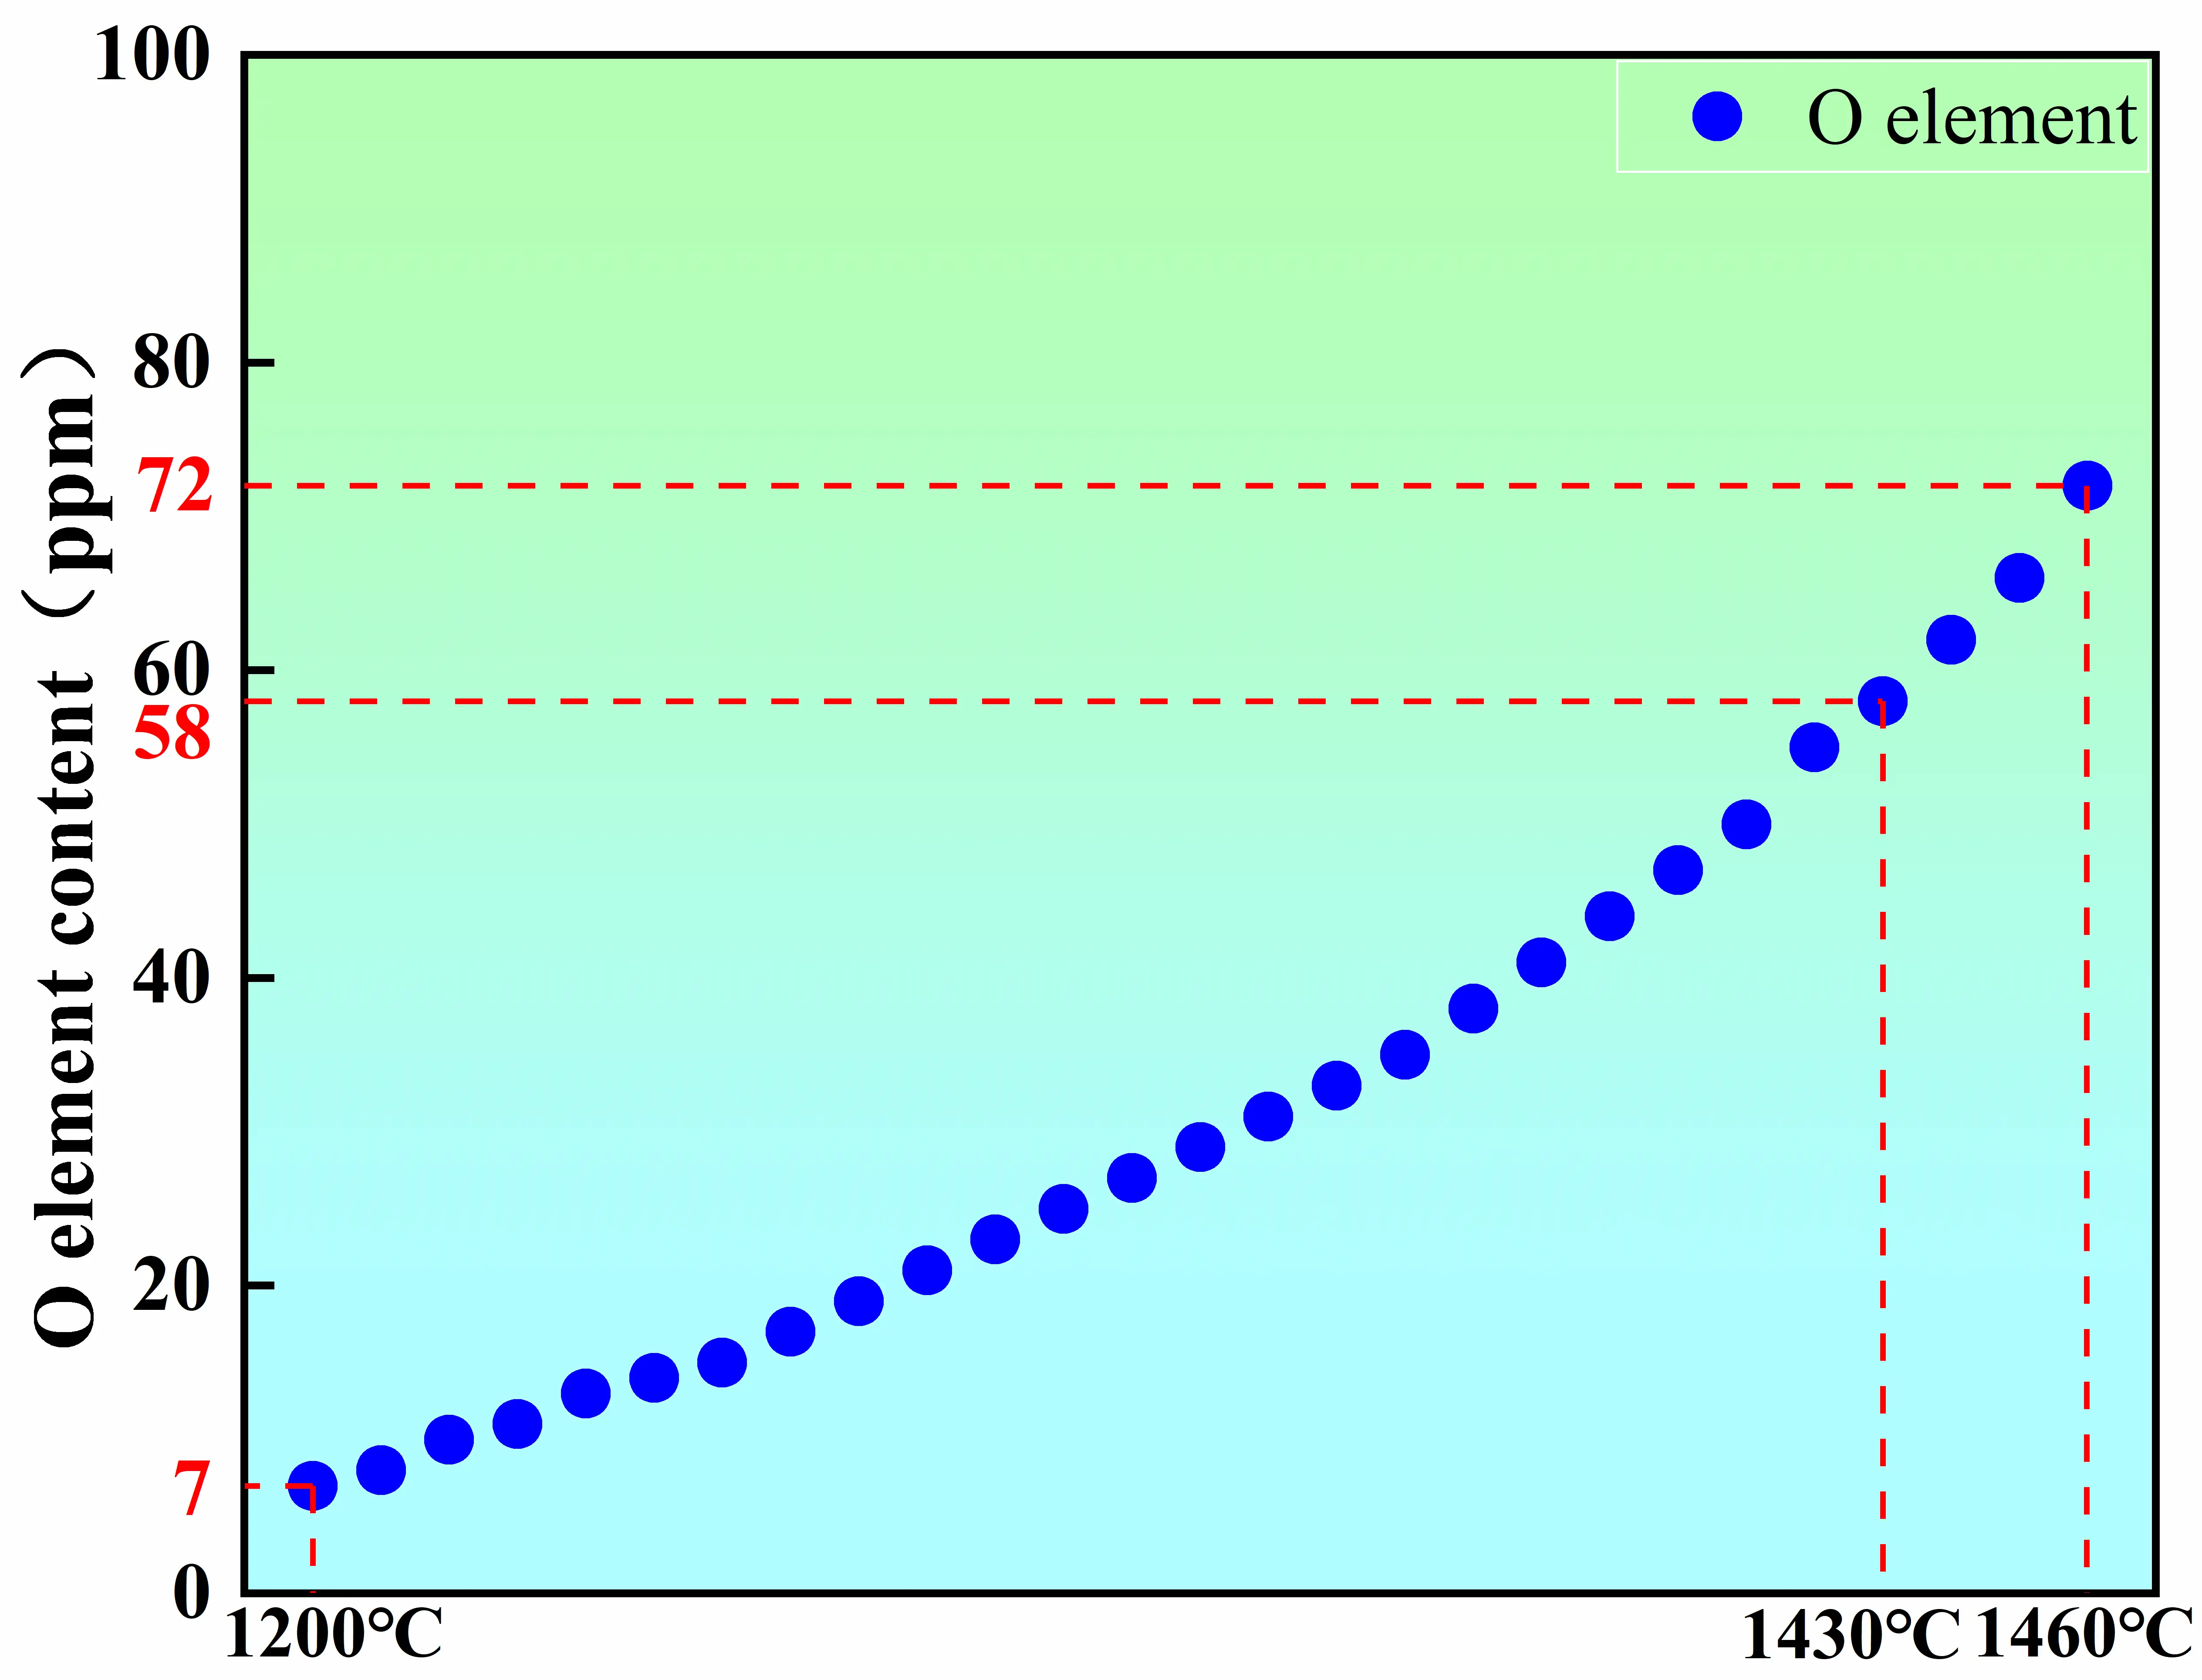
During the reheating stage prior to pouring, the oxygen content increases markedly to 76 ppm. This oxygen pickup is primarily attributed to the reduced thermal stability of the alumina crucible under prolonged high-temperature exposure. At elevated temperatures, the crucible may develop microcracks or undergo localized thermal degradation, which promotes oxygen release into the melt [20,21,22]. Thermodynamic calculations (Figure 9) further indicate that the equilibrium oxygen concentration in the melt increases significantly with temperature, thereby enhancing the thermodynamic driving force for crucible-melt interfacial reactions. To validate this prediction, the oxygen contents were experimentally measured at 1430 ℃ and 1460 ℃, yielding values of 58 ppm and 72 ppm, respectively. These experimental results are in good agreement with the fitted thermodynamic curve, confirming the reliability of the calculation and the temperature-dependent trend. Therefore, the evolution of oxygen content during the melting process is governed by the combined effects of vacuum deoxidation, melt homogenization, and crucible-derived oxygen supply. Vacuum deoxidation in the early stage establishes the baseline oxygen level, whereas crucible–melt interactions during the reheating stage constitute the dominant mechanism responsible for oxygen re-enrichment [23].
In comparison, the variation in nitrogen content is significantly smaller than that of oxygen, and its evolution is mainly controlled by vacuum degassing and the thermodynamic solubility of nitrogen in the melt, together with alloy compositional effects [24]. During the melting stage, the nitrogen content decreases from 80 ppm to 34 ppm, primarily due to the substantial reduction in nitrogen solubility under high-vacuum conditions. In addition, enhanced natural convection and charge-induced disturbances during melting promote renewal of the gas–liquid interface, facilitating rapid physical degassing of dissolved nitrogen [25,26]. During the subsequent stirring and holding stages, the nitrogen content remains stable within a narrow range of 30–40 ppm, without exhibiting a noticeable rebound similar to that observed for oxygen. This stability arises from two main factors. First, nitrogen exhibits relatively low chemical activity in the melt and is therefore less prone to participate in interfacial reactions comparable to those involving oxygen [27]. Second, alloying elements such as Nb and Cr possess a strong affinity for nitrogen and can form trace amounts of stable nitrides, which may buffer dissolved nitrogen activity and reduce the driving force for nitrogen desorption from the melt [28]. As a result, once the initial degassing process is completed, the nitrogen content approaches a thermodynamic equilibrium range and remains essentially stable during subsequent melting stages.
3.2.2. Inclusion Types and Morphology
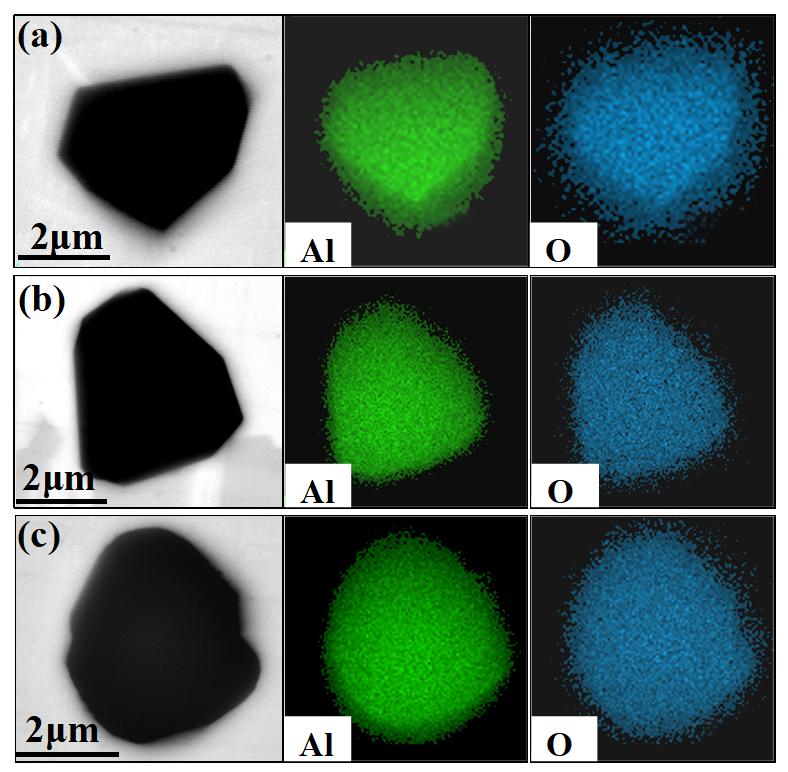
SEM observations of inclusions in the master alloy show a relatively simple inclusion population, dominated by Al2O3 particles with sizes mainly in the micrometer range. No multi-component composite oxides or complex inclusion systems were detected, as shown in Figure 10. Two concurrent sources can rationalize the predominance of Al2O3. First, under high-temperature conditions, localized thermal damage, decomposition, or microcracking of the alumina crucible can introduce fine Al2O3 particles and/or increase alumina-related oxygen supply to the melt; the introduced alumina species may remain dispersed during subsequent melt flow [29,30]. Second, trace Al carried by the charge materials may react with residual oxygen to form Al2O3, and this contribution cannot be completely excluded [31]. Table 3 shows that measurable Al levels persist throughout the process and do not remain strictly constant, supporting the possibility that Al from the charge materials participates in Al2O3 precipitation. Accordingly, the Al2O3 inclusions observed in Figure 10 are more appropriately interpreted as originating from the coupled effect of Al from the charge materials and crucible–melt interfacial reactions/structural degradation, rather than from a single source.
The predominance of a single inclusion type is consistent with the evolution behavior of gaseous impurities discussed above. During the melting stage, the combined effects of vacuum conditions and self-deoxidation reactions lead to a relatively low initial oxygen content, thereby suppressing extensive Al2O3 formation [28]. By contrast, during the reheating stage prior to pouring, the oxygen pickup observed in Table 3 is consistent with intensified crucible–melt interfacial reactions, which can promote Al2O3 formation and/or the introduction of fine alumina fragments into the melt, making Al2O3 the dominant inclusion type at later stages [29,32]. Overall, the stage-dependent evolution of oxygen content shows a clear correspondence with the appearance of Al2O3 inclusions, indicating that crucible-related reactions exert a significant influence on inclusion evolution during the late melting stage [30,33]. Meanwhile, the Al trend in Table 3 further suggests a non-negligible contribution from Al carried by the charge materials. A dedicated comparison using alternative crucible materials (e.g., MgO-based refractories) would help further decouple the relative contributions from these two sources and refine the mechanism, which is therefore beyond the scope of the present study.
3.2.3. Inclusion Size and Number Density
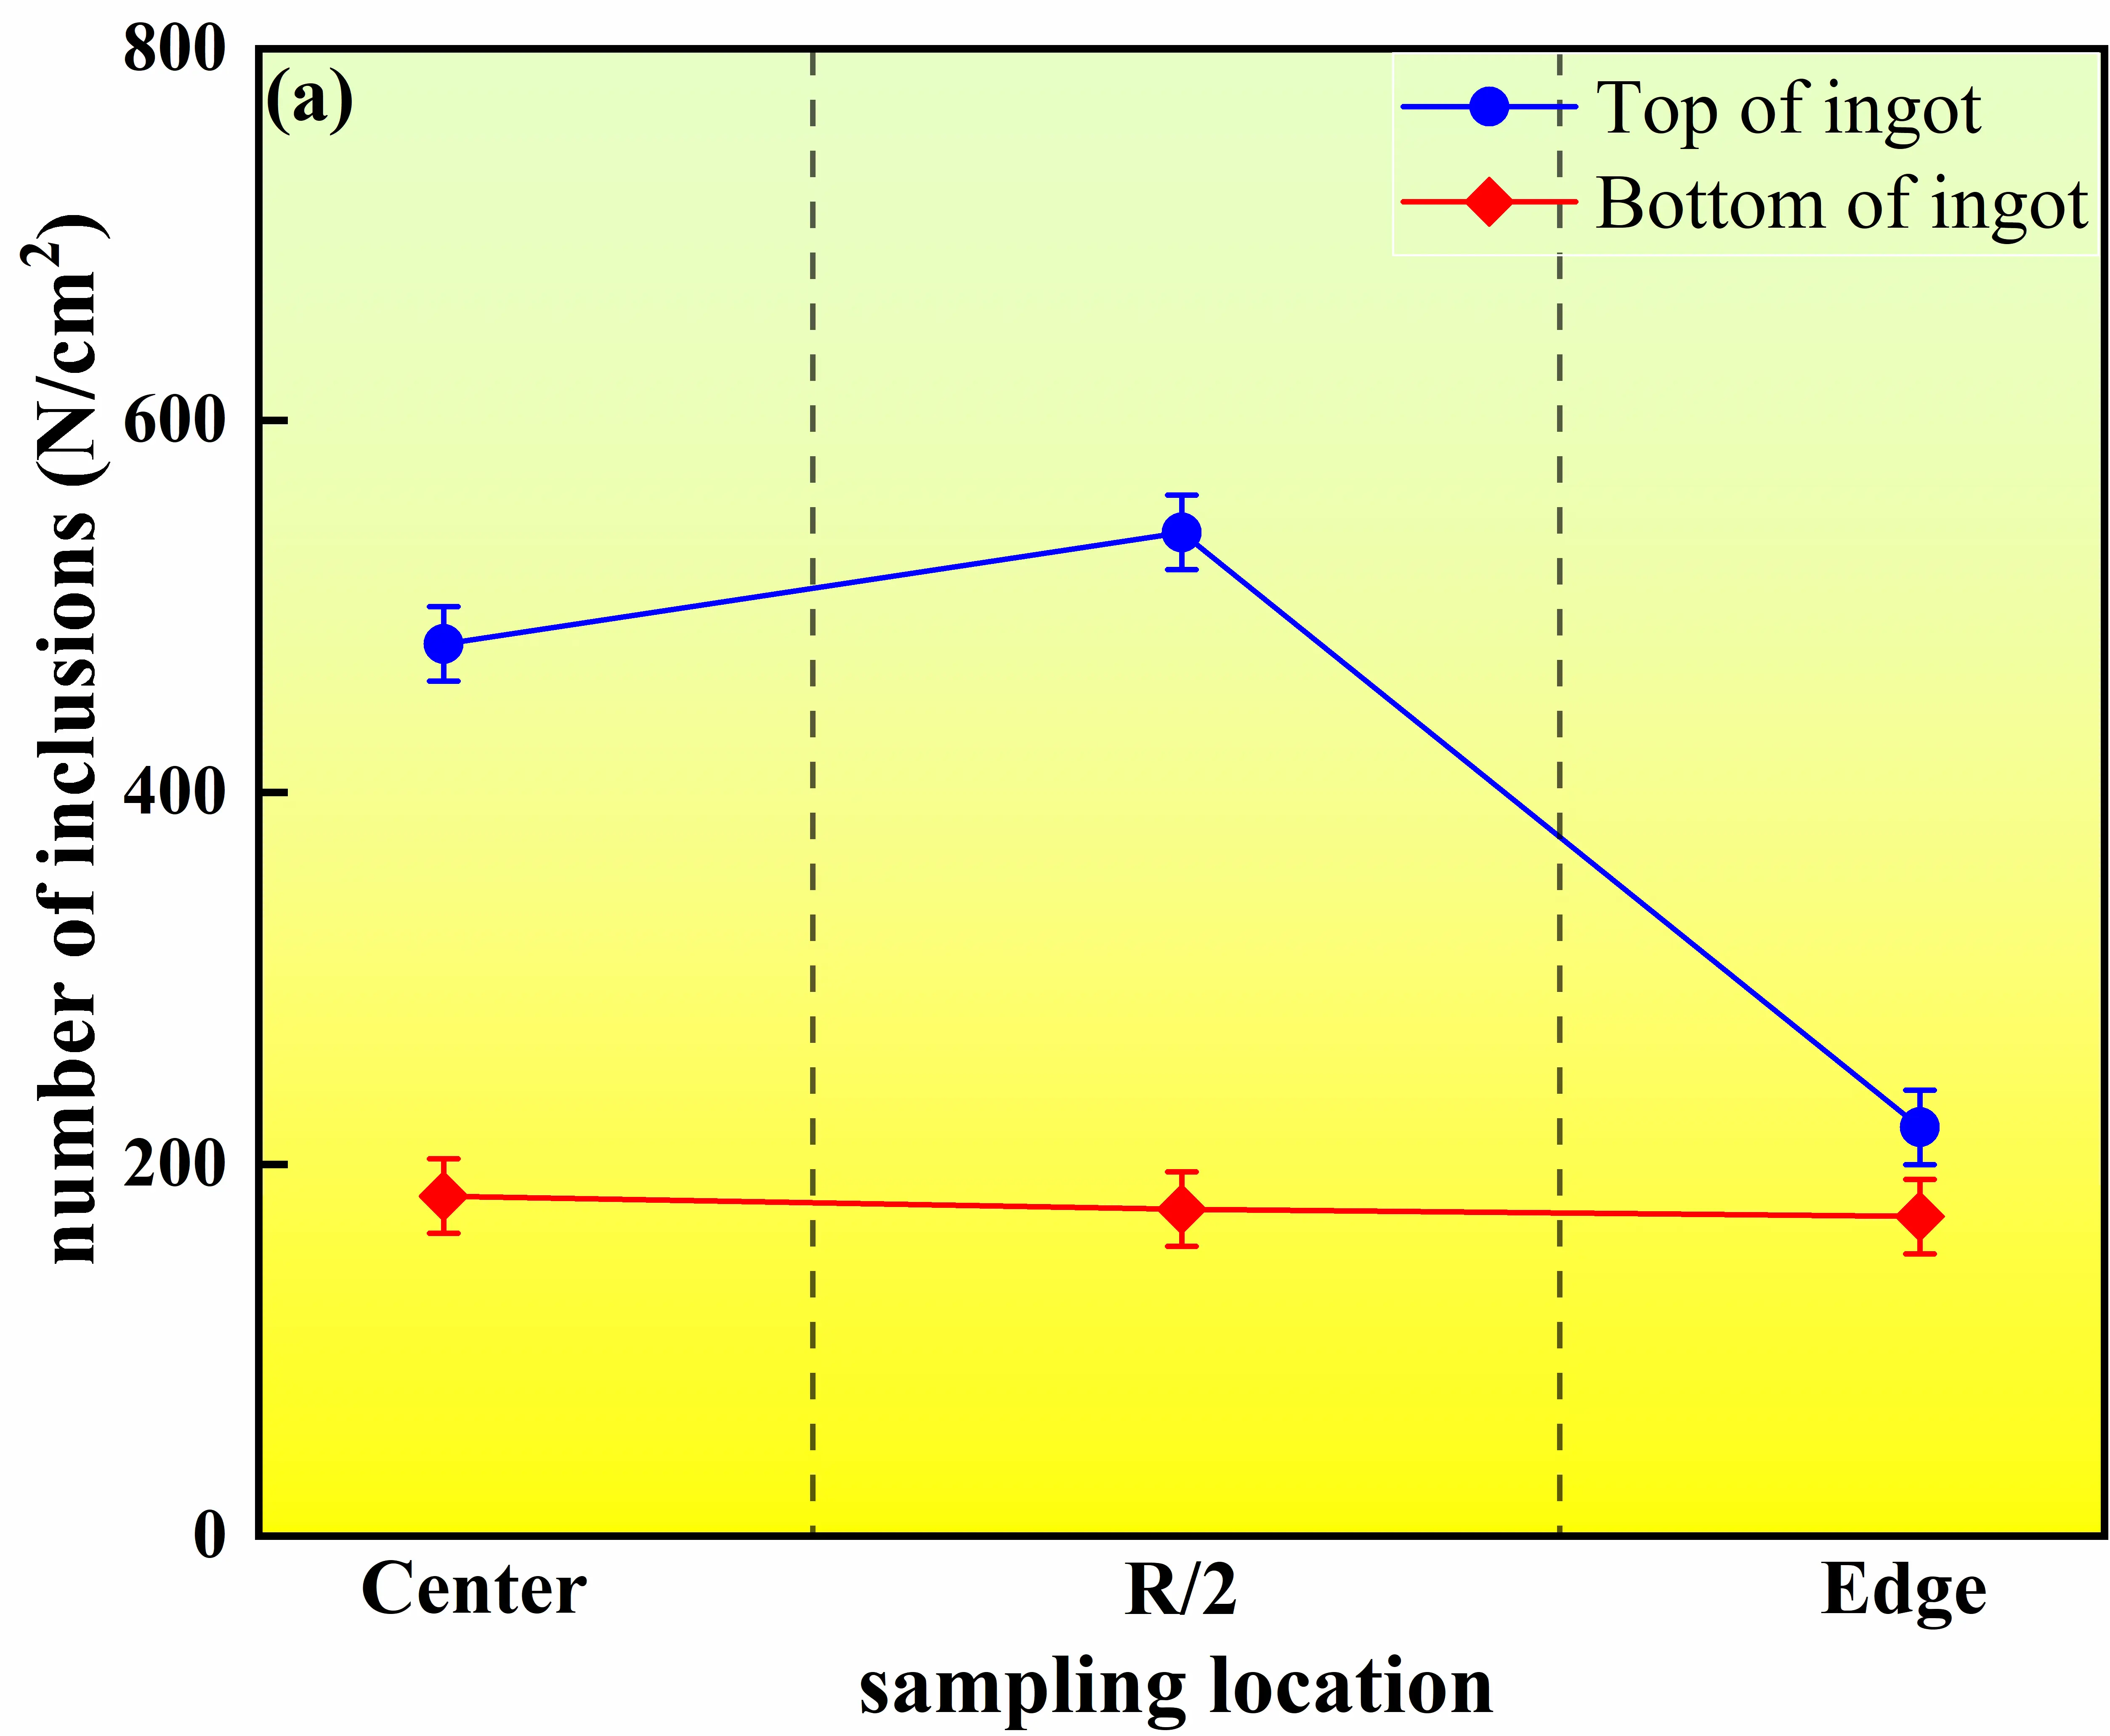
Figure 11 presents the distributions of average inclusion size and number density at different heights and radial positions within the master alloy ingot. Overall, both the average inclusion size and number density in the ingot head (the last solidified region) are significantly higher than those in the ingot bottom (the first solidified region), and pronounced radial variations are observed. At the head section, the average inclusion sizes at the center, R/2 position, and edge are 1.7 ± 0.15 μm, 2.2 ± 0.15 μm, and 1.3 ± 0.15 μm, respectively, with corresponding number densities of 480 ± 20 cm−2, 540 ± 20 cm−2, and 220 ± 20 cm−2. Among these locations, the R/2 region exhibits the most pronounced inclusion enrichment. In contrast, inclusions in the bottom section show much smaller average sizes, ranging from 0.97 to 1.2 μm, and number densities between 172 ± 20 cm−2 and 183 ± 20 cm−2, with relatively minor differences among radial positions.
 |
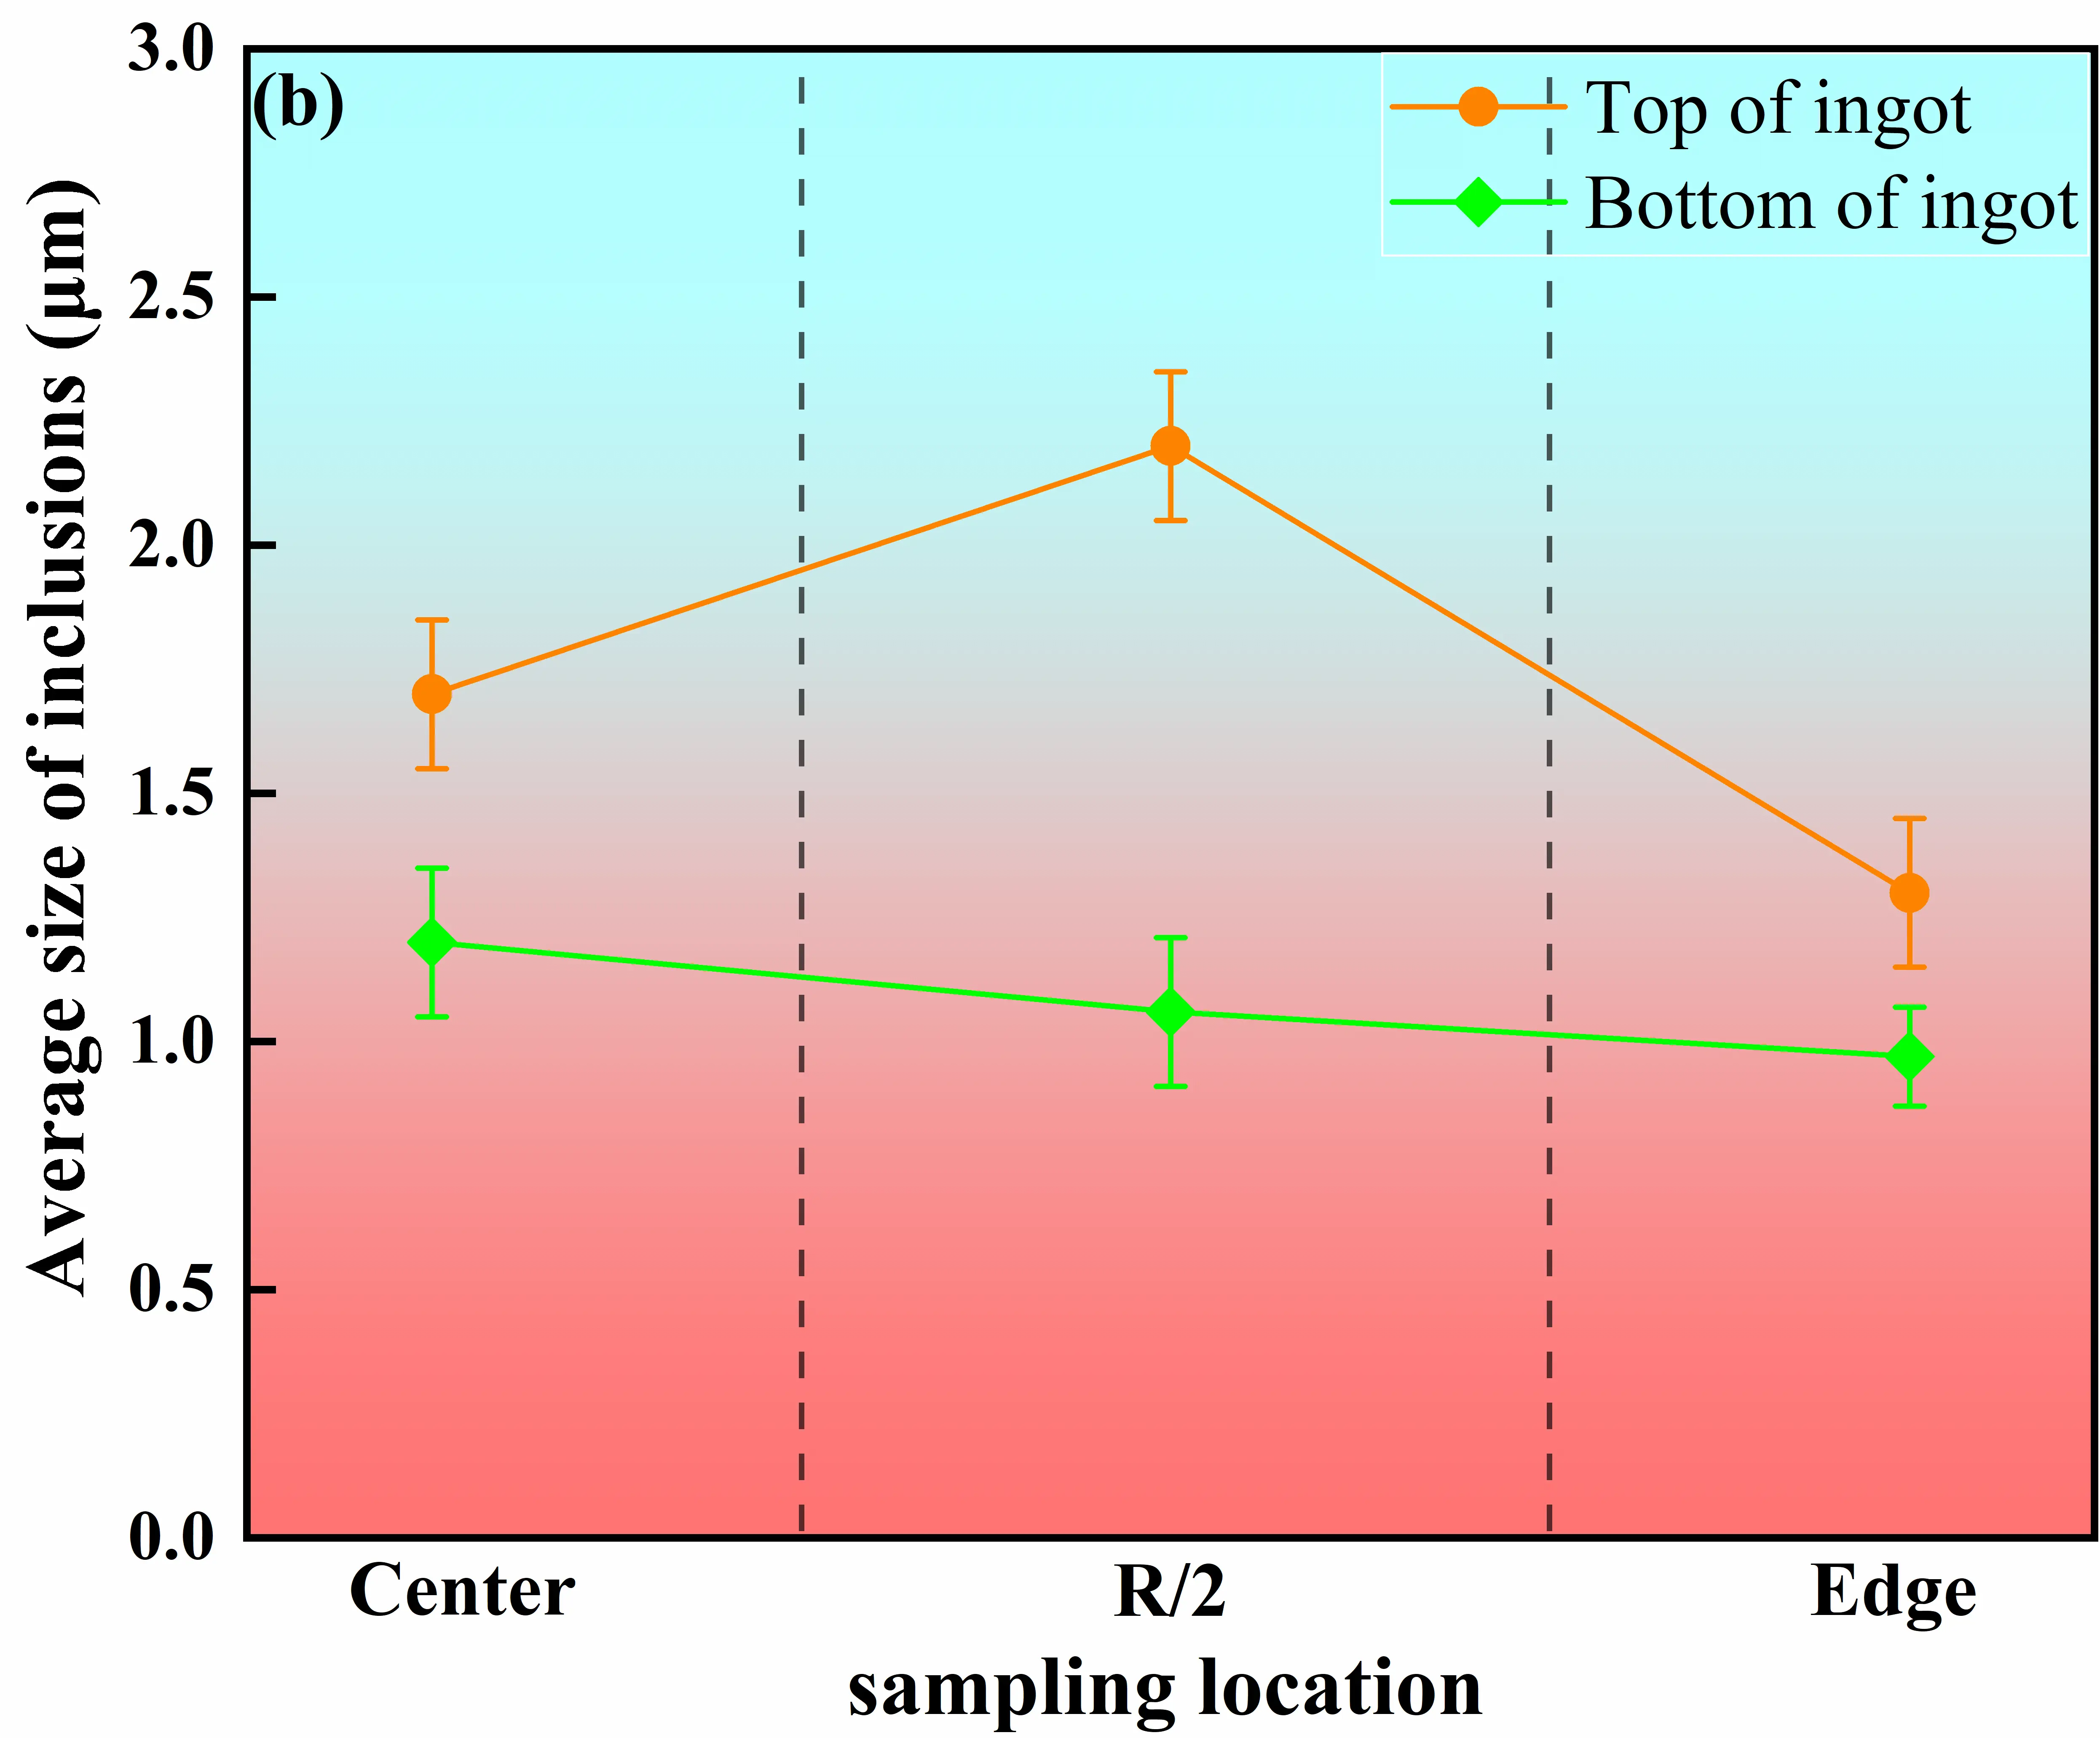 |
Figure 11. Variation in inclusion number density and average size in the master alloy. (a) Number of inclusions at different locations of the ingot; (b) Average size of inclusions at different locations of the ingot.
This spatial distribution behavior arises from the coupled effects of solidification sequence, melt flow, and local cooling conditions. In the bottom region, strong heat extraction from the mold base and sidewalls leads to rapid advancement of the solid–liquid interface, causing inclusions to be captured by the solid phase before significant collision or aggregation can occur [12]. Meanwhile, relatively strong melt convection at early stages facilitates inclusion dispersion, resulting in small inclusion sizes, low number densities, and a relatively uniform distribution. As the solidification front progresses upward, the liquid residence time in the head region increases substantially, allowing inclusions to undergo flotation, collision, and aggregation, leading to marked increases in both inclusion size and number density [34].
The R/2 region exhibits peak values of both inclusion size and number density due to its location at the intersection of melt recirculation zones and moderate cooling gradients. On the one hand, melt flow promotes the transport and local accumulation of inclusions in this region; on the other hand, an intermediate solidification rate provides sufficient time for inclusion growth and aggregation. Consequently, the R/2 position becomes the most favorable site for inclusion enrichment. In comparison, the ingot edge is constrained by rapid solidification and narrow interdendritic spacing, which hinder inclusion migration and promote early interfacial capture, resulting in lower inclusion sizes and number densities than those observed at the center and at R/2 positions [35].
3.3. Metallurgical Quality Evaluation of Scale-Up GH4169D Alloy
3.3.1. Impurity Element Contents
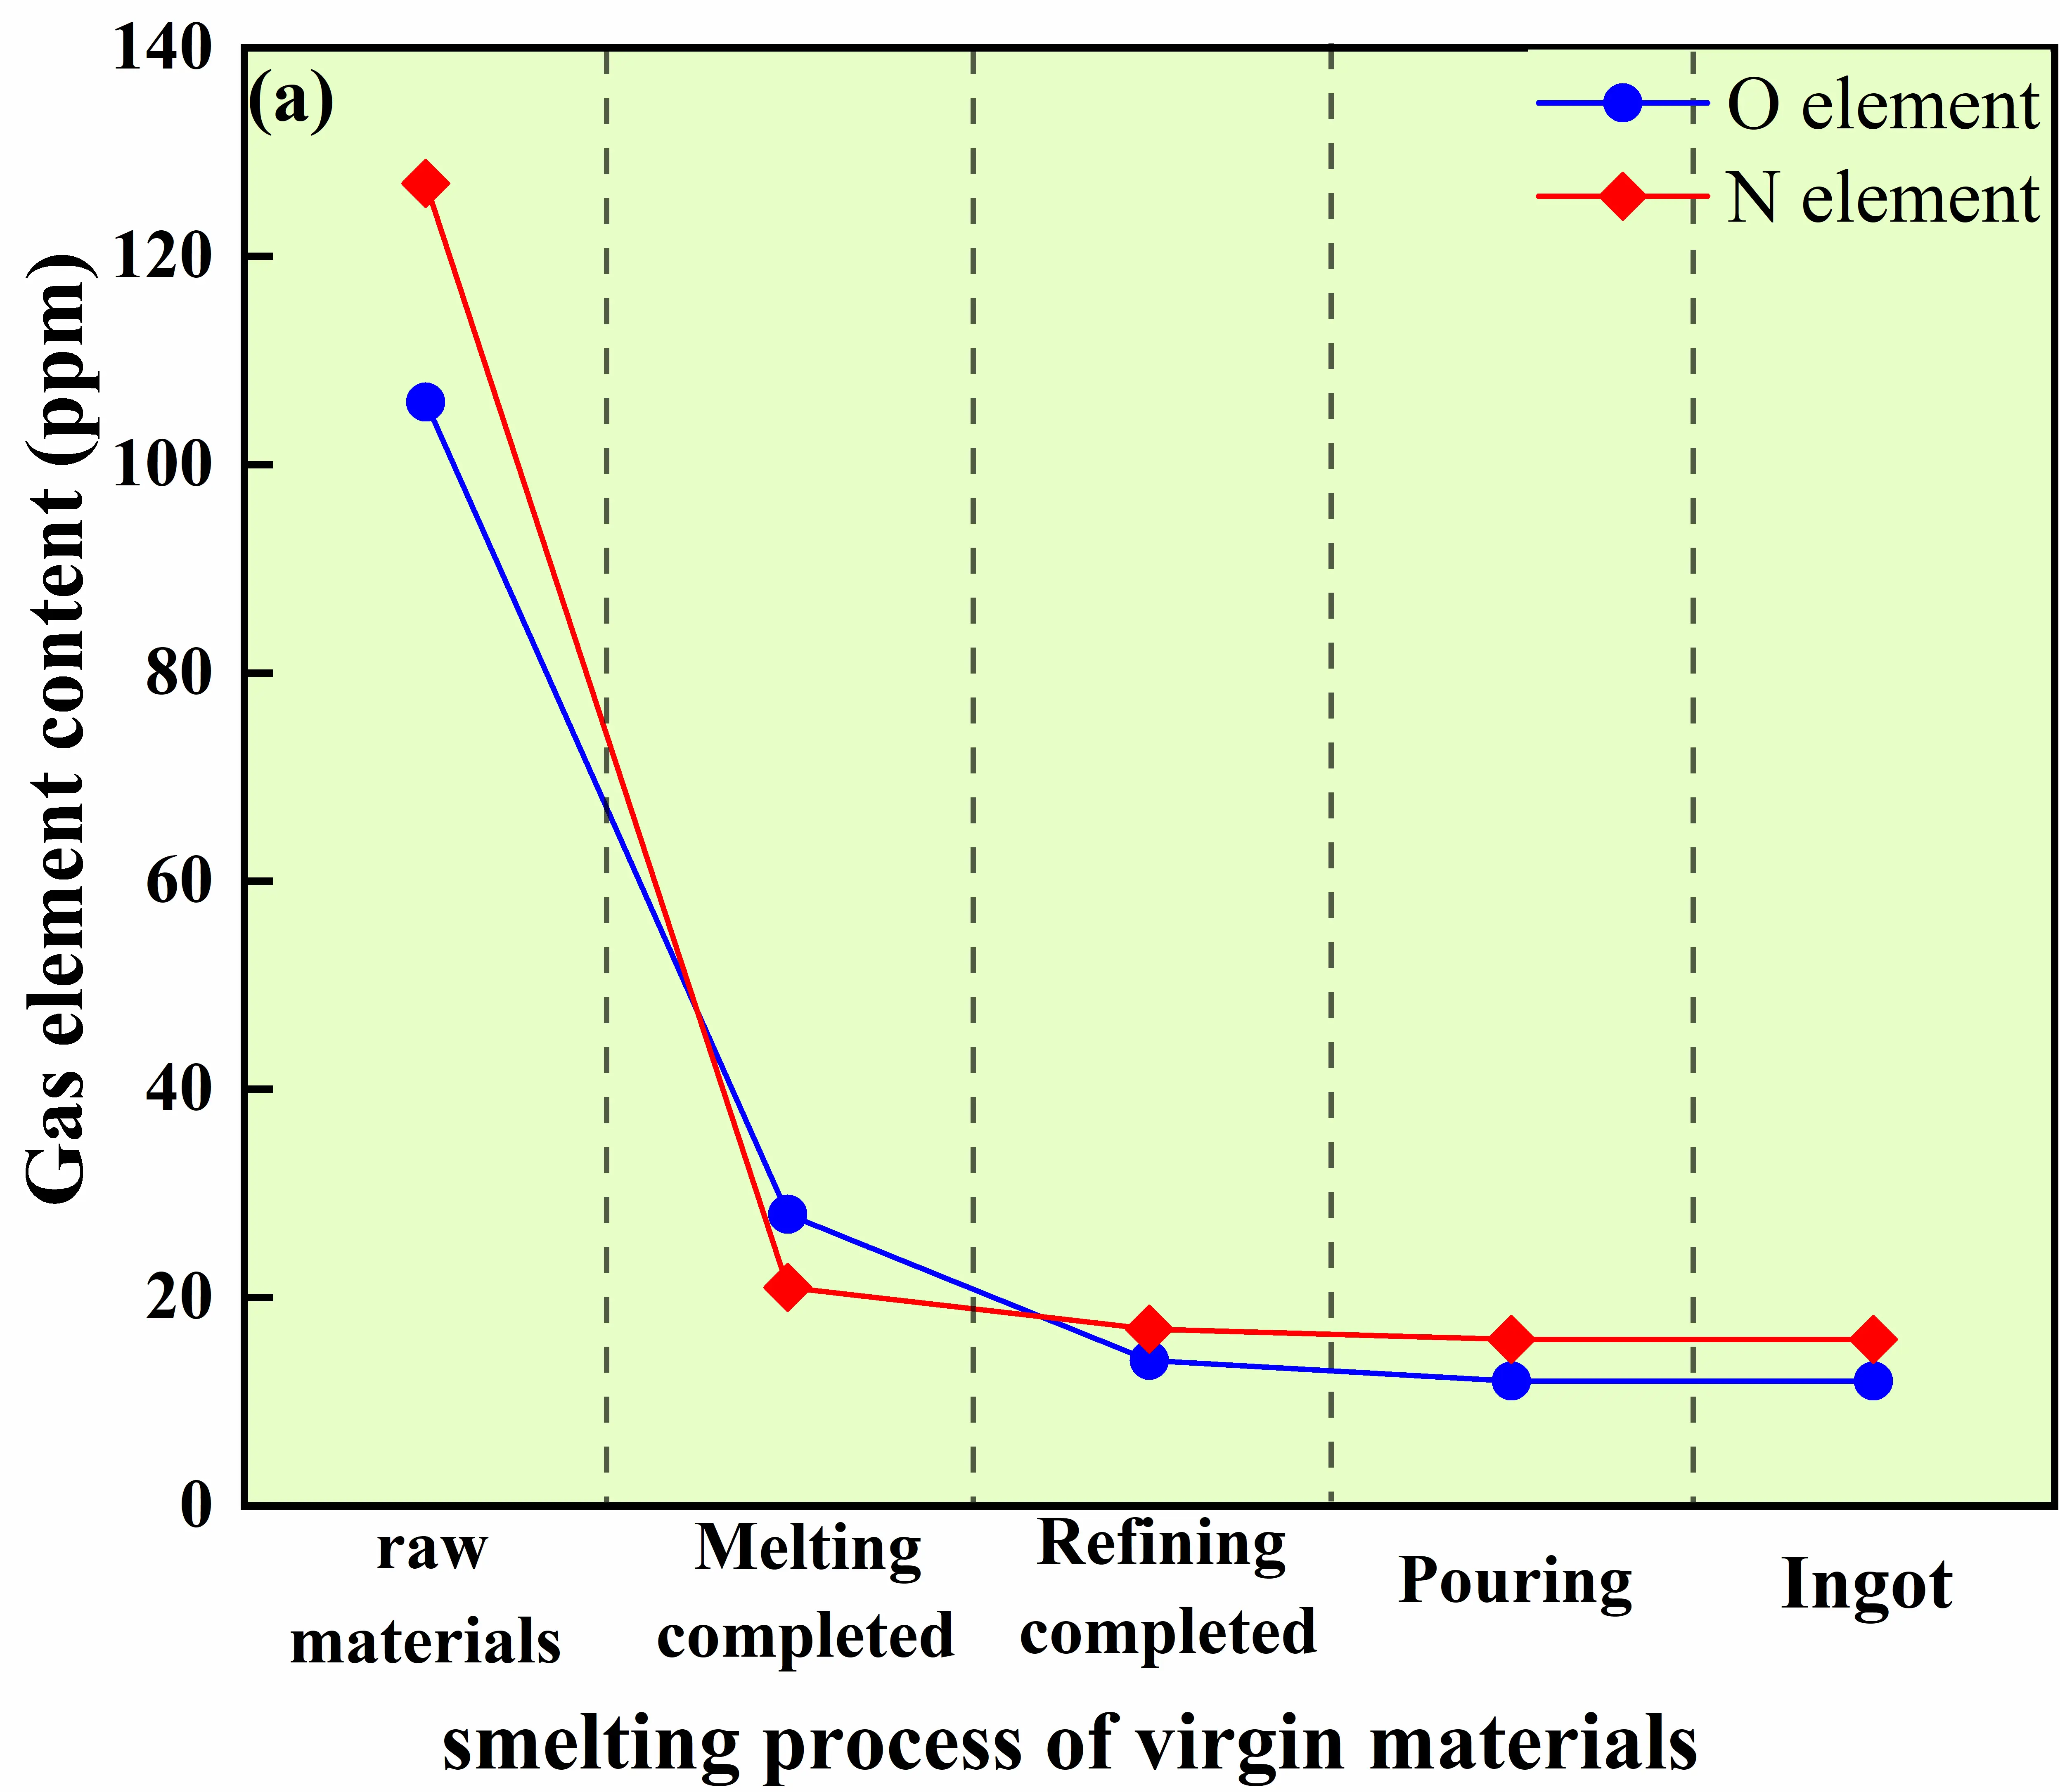
Figure 12 compares the evolution behaviors of oxygen and nitrogen contents in GH4169D alloy produced via the conventional virgin-material route and the master-alloy-assisted route. For the alloy prepared using virgin raw materials, the oxygen content decreases rapidly from an initial value of 106 ppm to 28 ppm during the melting stage, followed by a further reduction to 14 ppm during high-temperature refining, and finally stabilizes at approximately 12 ppm. This behavior indicates that oxygen removal in the virgin-material route mainly relies on melt self-deoxidation reactions and the aggregation and flotation of oxide inclusions. The additional decrease from 28 ppm to 14 ppm during high-temperature refining provides direct evidence that this refining step is an effective purification operation and can further improve melt cleanliness beyond what is achieved during melting alone. In contrast, the nitrogen content decreases from 127 ppm to 21 ppm after melting and subsequently stabilizes at around 16 ppm, suggesting that nitrogen removal predominantly occurs through physical degassing during the melting stage.
By comparison, the master-alloy-assisted route exhibits significantly lower initial oxygen and nitrogen contents of 86 ppm and 57 ppm, respectively, which markedly reduces the subsequent degassing burden during GH4169D melting. In this route, the oxygen content decreases to 12 ppm already during the melting stage and further stabilizes at approximately 8 ppm after electromagnetic stirring, demonstrating a substantially improved oxygen control capability relative to the virgin-material route. Notably, even without applying the high-temperature refining step, the master-alloy-assisted route achieves an oxygen level at the end of melting (12 ppm) that is comparable to the final stabilized level of the virgin-material route (~12 ppm). This indicates that the master-alloy strategy can maintain melt cleanliness at a comparable level within a shortened process chain by suppressing primary oxide formation and reducing oxygen pickup during the early melting stage. Meanwhile, the nitrogen content remains within a narrow range of 26–27 ppm with limited fluctuation throughout the melting process.
 |
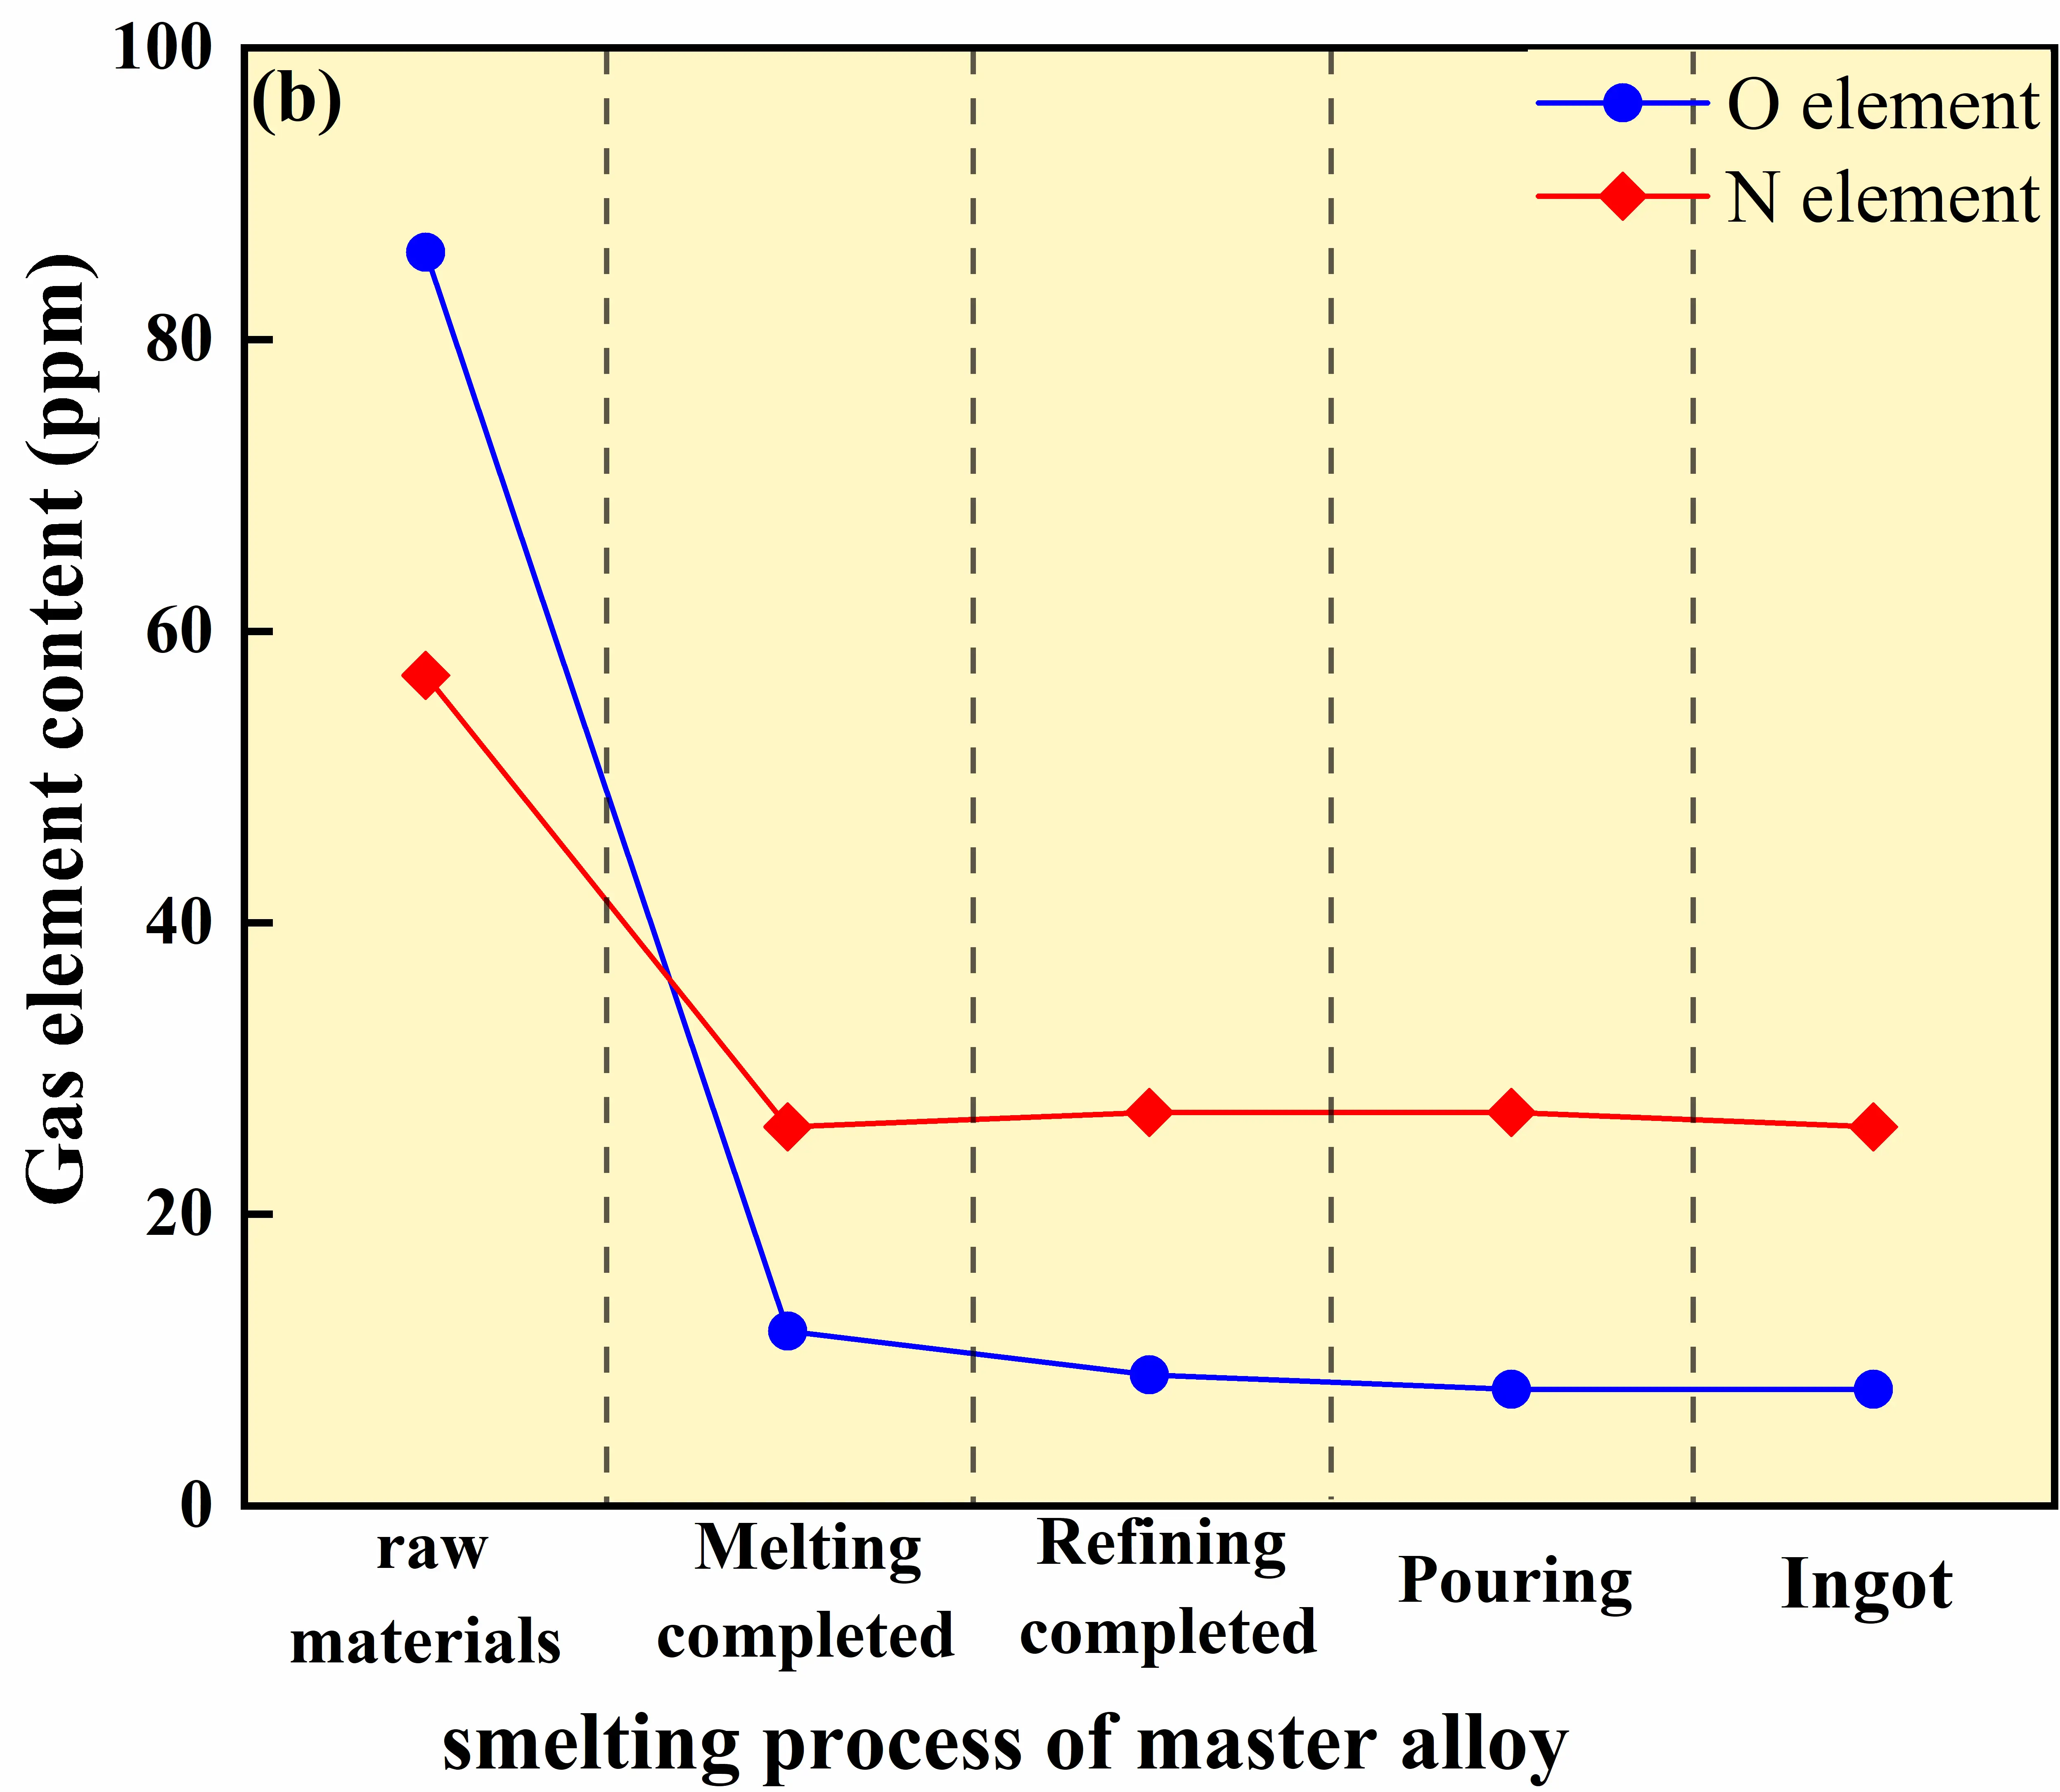 |
Figure 12. Evolution of oxygen and nitrogen contents during the melting process of GH4169D alloy. (a) Variation of gas element contents during melting using virgin materials; (b) Variation of gas element contents during melting using master alloys.
These differences originate from the intrinsic distinctions in the thermodynamic and kinetic behaviors of oxygen and nitrogen between the two charge material routes. For oxygen, effective deoxidation has already been achieved during the preparation of the master alloy, resulting in a significantly reduced oxygen activity during subsequent GH4169D melting. In addition, electromagnetic stirring promotes the migration and removal of oxide inclusions, enabling the attainment of a low oxygen level even in the absence of prolonged refining. Consequently, the master-alloy-assisted route does not rely on extended high-temperature refining to achieve low oxygen contents. In contrast, the virgin-material route, characterized by a higher initial oxygen activity, requires continuous refining to reach comparable oxygen levels.
The behavior of nitrogen is primarily governed by its chemical activity in the melt. The relatively higher Nb content introduced via the master alloy facilitates the formation of stable nitrides, thereby reducing the activity and desorption driving force of dissolved nitrogen. As a result, nitrogen removal efficiency in the master-alloy-assisted route is lower than that in the virgin-material route. Nevertheless, the stabilized nitrogen level of 26–27 ppm remains well below the specified upper limit, indicating that the master-alloy-assisted process can still satisfy compositional requirements while offering distinct advantages in oxygen control.
3.3.2. Inclusion Types and Morphology
Table 4 compares the distributions of inclusion types at different sampling positions in GH4169D ingots produced via the virgin-material and master-alloy-assisted routes. The results indicate that although multiple inclusion categories are observed in ingots produced by both routes, Al2O3 and TiN serve as the dominant nucleation cores in all cases. This finding suggests that inclusion nucleation in the GH4169D alloy is primarily governed by the intrinsic thermodynamic behavior of the alloy system rather than by the choice of charge material route. From a radial distribution perspective, the proportion of Al2O3 inclusions increases progressively from the ingot center to the R/2 position and further toward the edge, whereas the relative fraction of TiN inclusions exhibits an opposite trend. Notably, this radial variation pattern is consistently observed for both melting routes.
The observed distribution behavior arises from the fundamentally different formation mechanisms of Al2O3 and TiN inclusions [36]. Aluminum exhibits a strong affinity for oxygen, and the Gibbs free energy of Al2O3 formation is significantly lower than that of other oxides, enabling Al2O3 to form preferentially and remain thermodynamically stable during the early stages of melting. In addition, rapid solidification and narrower interdendritic spacing near the ingot edge enhance interfacial capture efficiency, leading to a gradual increase in the relative fraction of Al2O3 inclusions toward the edge region. In contrast, TiN formation predominantly occurs during the late stages of solidification and depends strongly on kinetic conditions such as local Ti and N supersaturation, solute segregation, and relatively low cooling rates. The ingot center, characterized by slower solidification and more pronounced compositional segregation, provides favorable conditions for TiN nucleation and growth. Conversely, rapid solidification and reduced solute segregation near the ingot edge suppress TiN formation, resulting in a decreasing TiN fraction from the center toward the edge.
Table 4. Types and proportions of inclusions in GH4169D alloy produced via different charge material routes.
|
Charge Material Route |
Al2O3-Centered Inclusions (%) |
TiN-Centered Inclusions (%) |
||||
|---|---|---|---|---|---|---|
|
Center |
R/2 |
Edge |
Center |
R/2 |
Edge |
|
|
Virgin materials |
14.2 |
16.5 |
24.8 |
85.8 |
83.5 |
75.2 |
|
Master alloy |
19.7 |
22.4 |
28.9 |
80.3 |
77.6 |
71.1 |
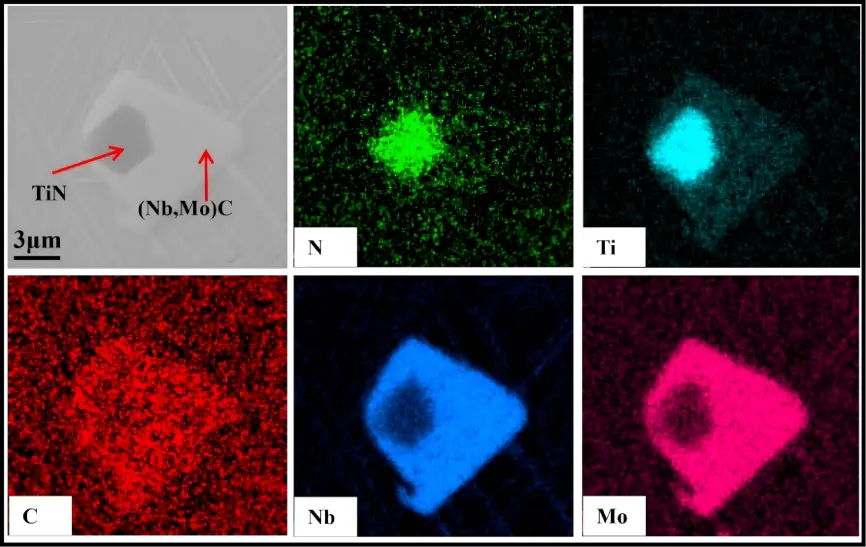
Figure 13 and Figure 14 present typical morphologies of Al2O3 and TiN inclusions, respectively. Al2O3 inclusions generally exhibit irregular blocky morphologies, reflecting their multi-stage nucleation behavior and interfacial capture during dendritic growth. In contrast, TiN inclusions precipitate with a cubic crystal structure and typically display polyhedral morphologies. Despite differences in charge material routes, the inclusion morphologies observed in both cases are highly similar, further confirming that inclusion nucleation and growth in GH4169D alloy are controlled by inherent thermodynamic and kinetic mechanisms rather than by variations in raw material sources.
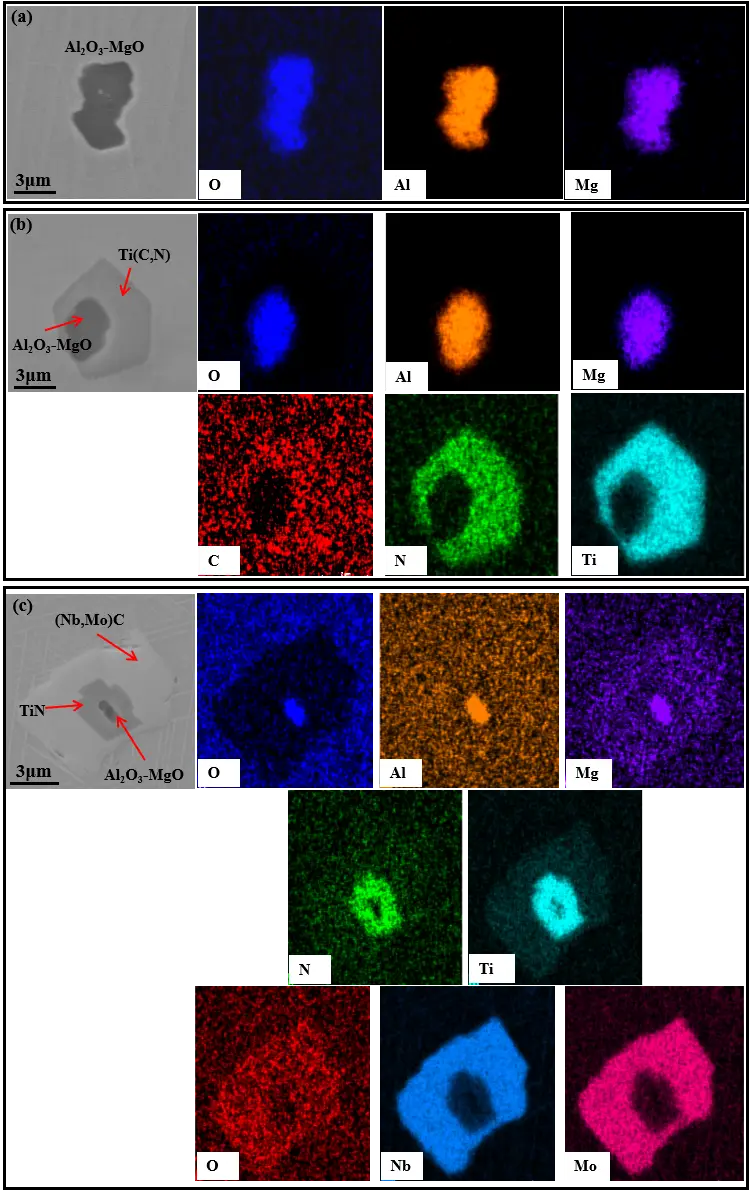
Figure 13. Morphology and EDS spectra of composite inclusions nucleated on Al2O3. (a) The inclusions of Al2O3-MgO; (b) The inclusions of Al2O3-MgO-Ti(C,N); (c) The inclusions of Al2O3-MgO-TiN-(Nb,Mo)C.
3.3.3. Inclusion Size and Number Density
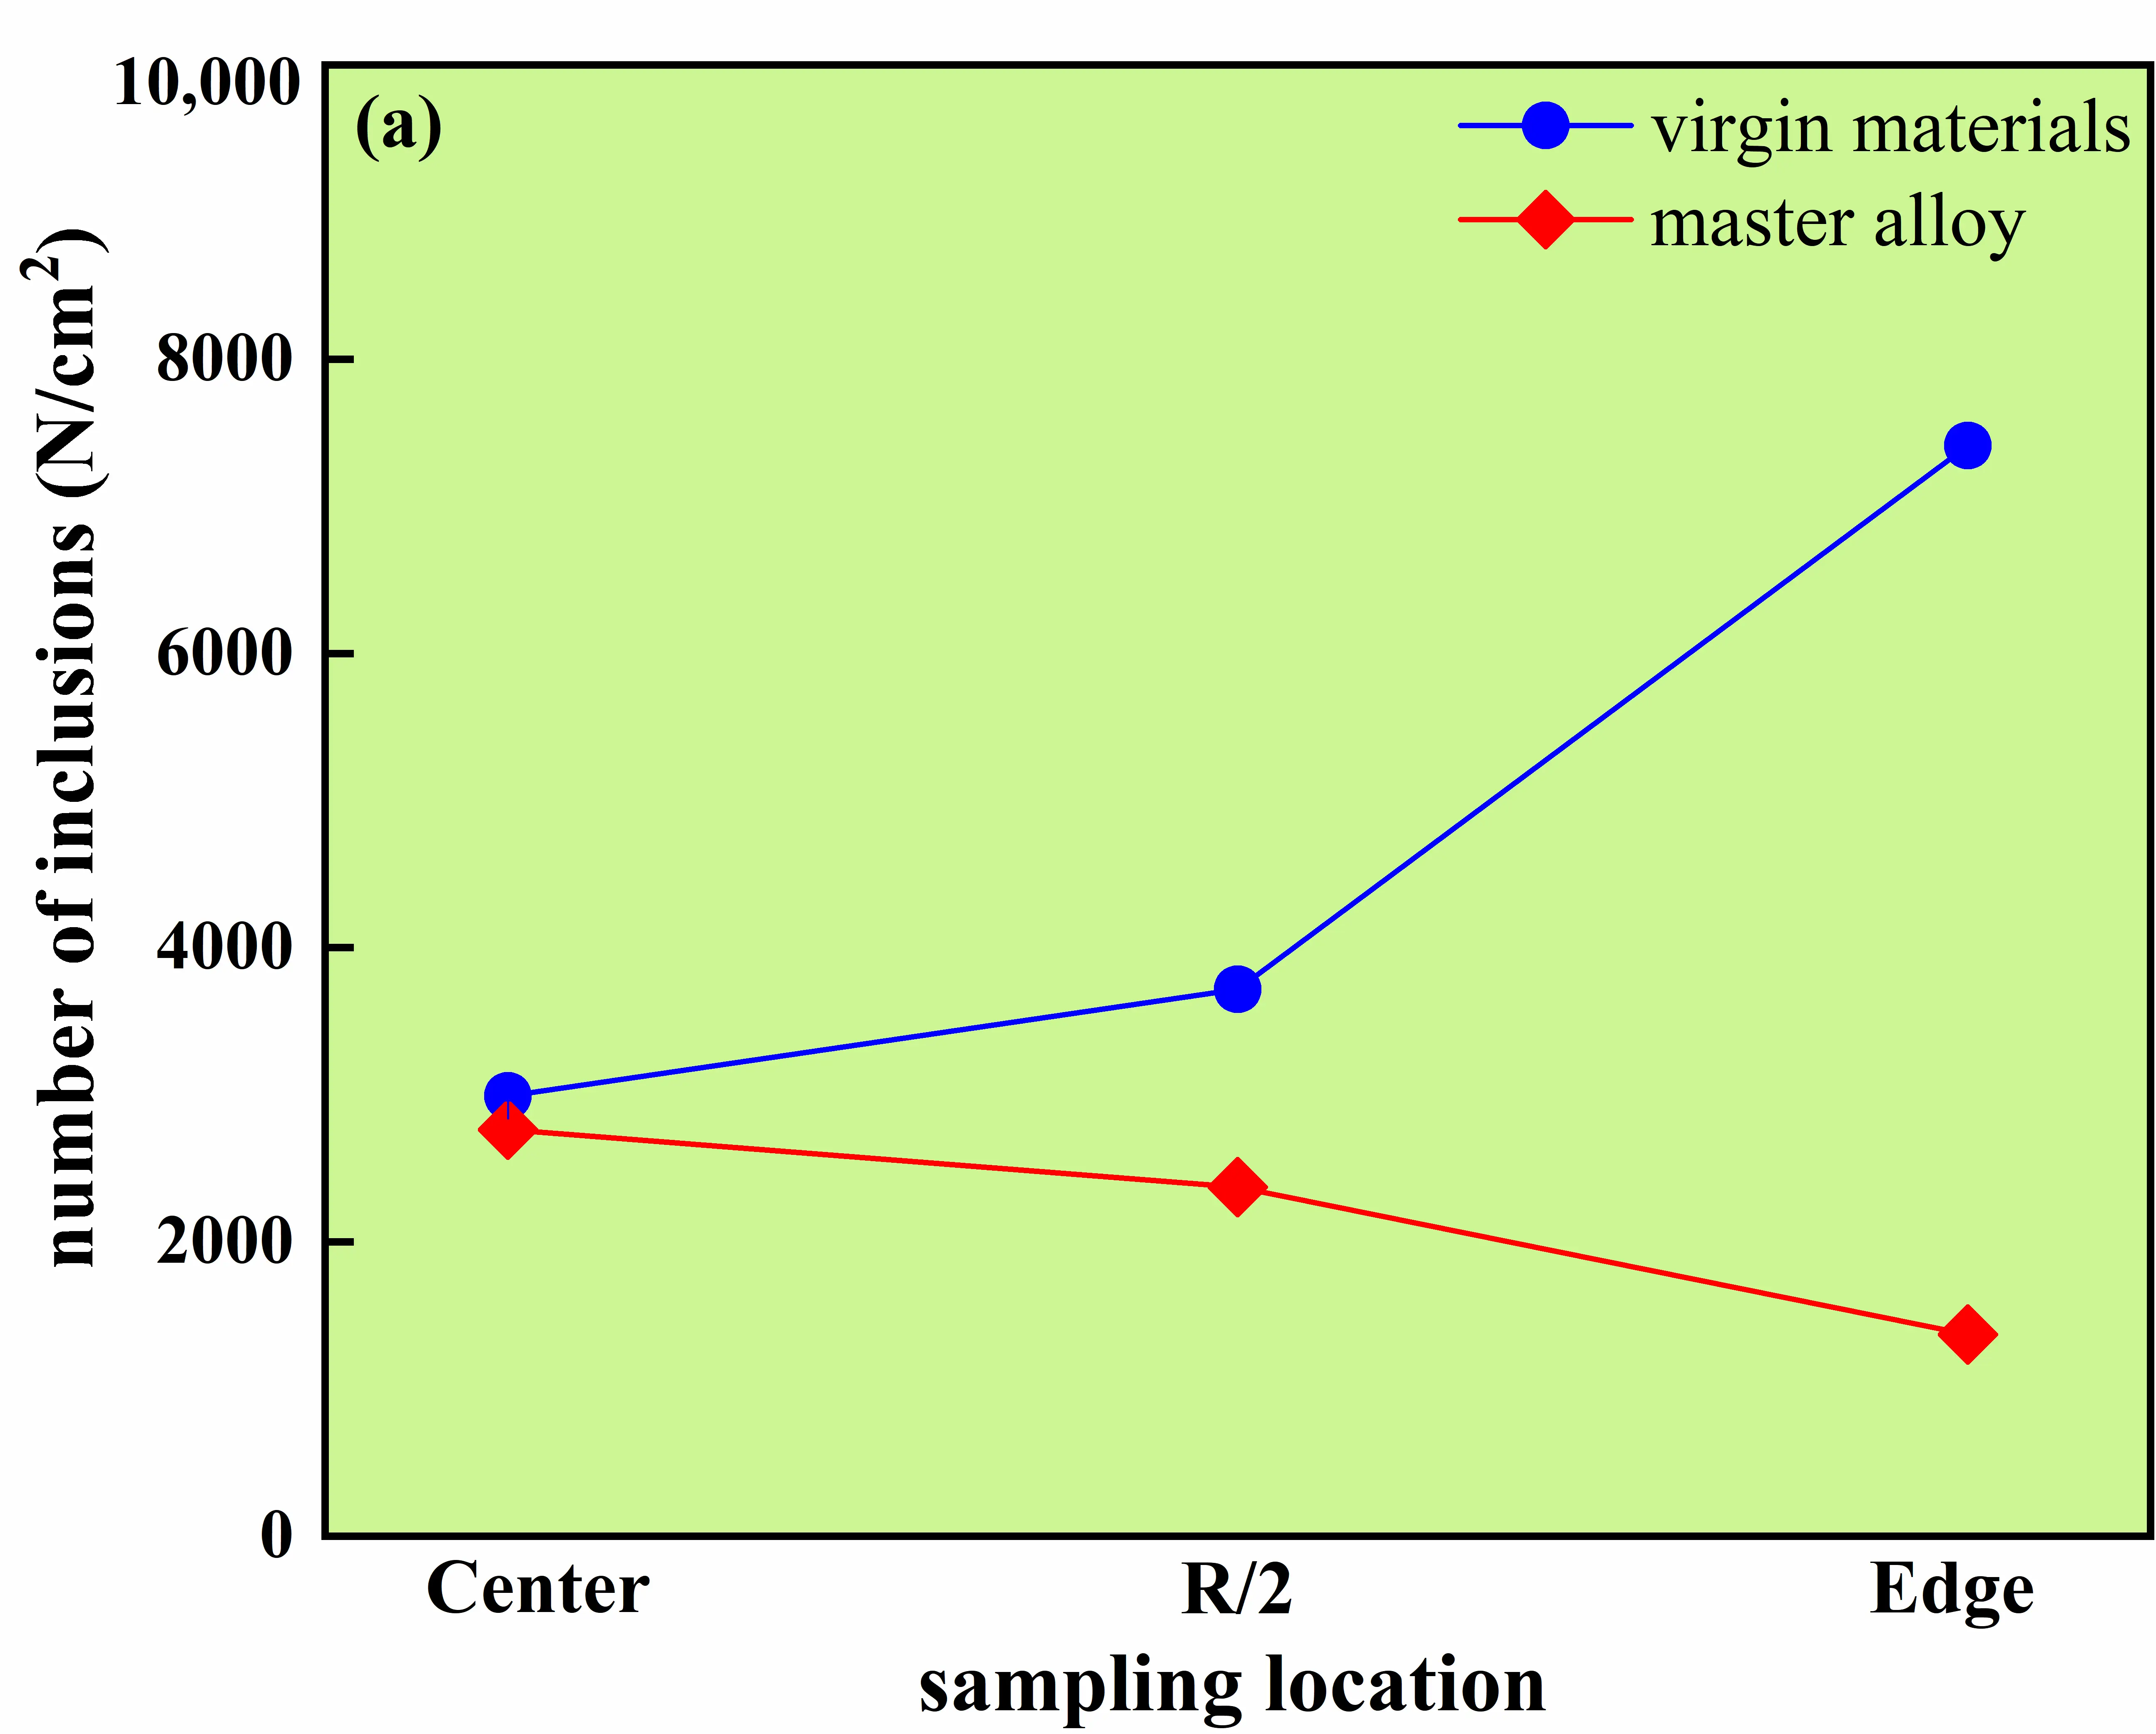
Figure 15 and Figure 16 compare the inclusion number density and size characteristics of GH4169D ingots produced via the virgin-material route and the master-alloy-assisted route at the center, R/2, and edge positions of the bottom section. For all positions, inclusion statistics were obtained under an identical inspection protocol, with a fixed inspected area of 100 mm2 per position. In this work, the “maximum inclusion size” is defined as the largest observed equivalent circle diameter (ECD) among all inclusions detected within this fixed inspection window, which provides a standardized basis for route-to-route comparison under the same sampling and observation conditions.
As shown in Figure 15, pronounced differences in inclusion characteristics are observed between the two melting routes. For the ingot produced using virgin materials, the inclusion number densities at the center, R/2, and edge positions are 2993, 3717, and 7414 per inspection area, respectively, and the maximum inclusion size remains nearly unchanged at ~28 ± 1 μm across radial positions. By contrast, for the master-alloy-assisted route, the corresponding inclusion number densities decrease to 2764, 2375, and 1371, and the maximum inclusion size decreases to 8–17 μm. Figure 16 further confirms that the master-alloy-assisted route shifts the inclusion population toward a finer size regime, exhibiting a low-density distribution with a decreasing trend from the center toward the edge. These results demonstrate that, under the same evaluation window and sampling protocol at the bottom section, the master-alloy-assisted route yields a substantially reduced inclusion population and a refined size distribution compared with the virgin-material route.
 |
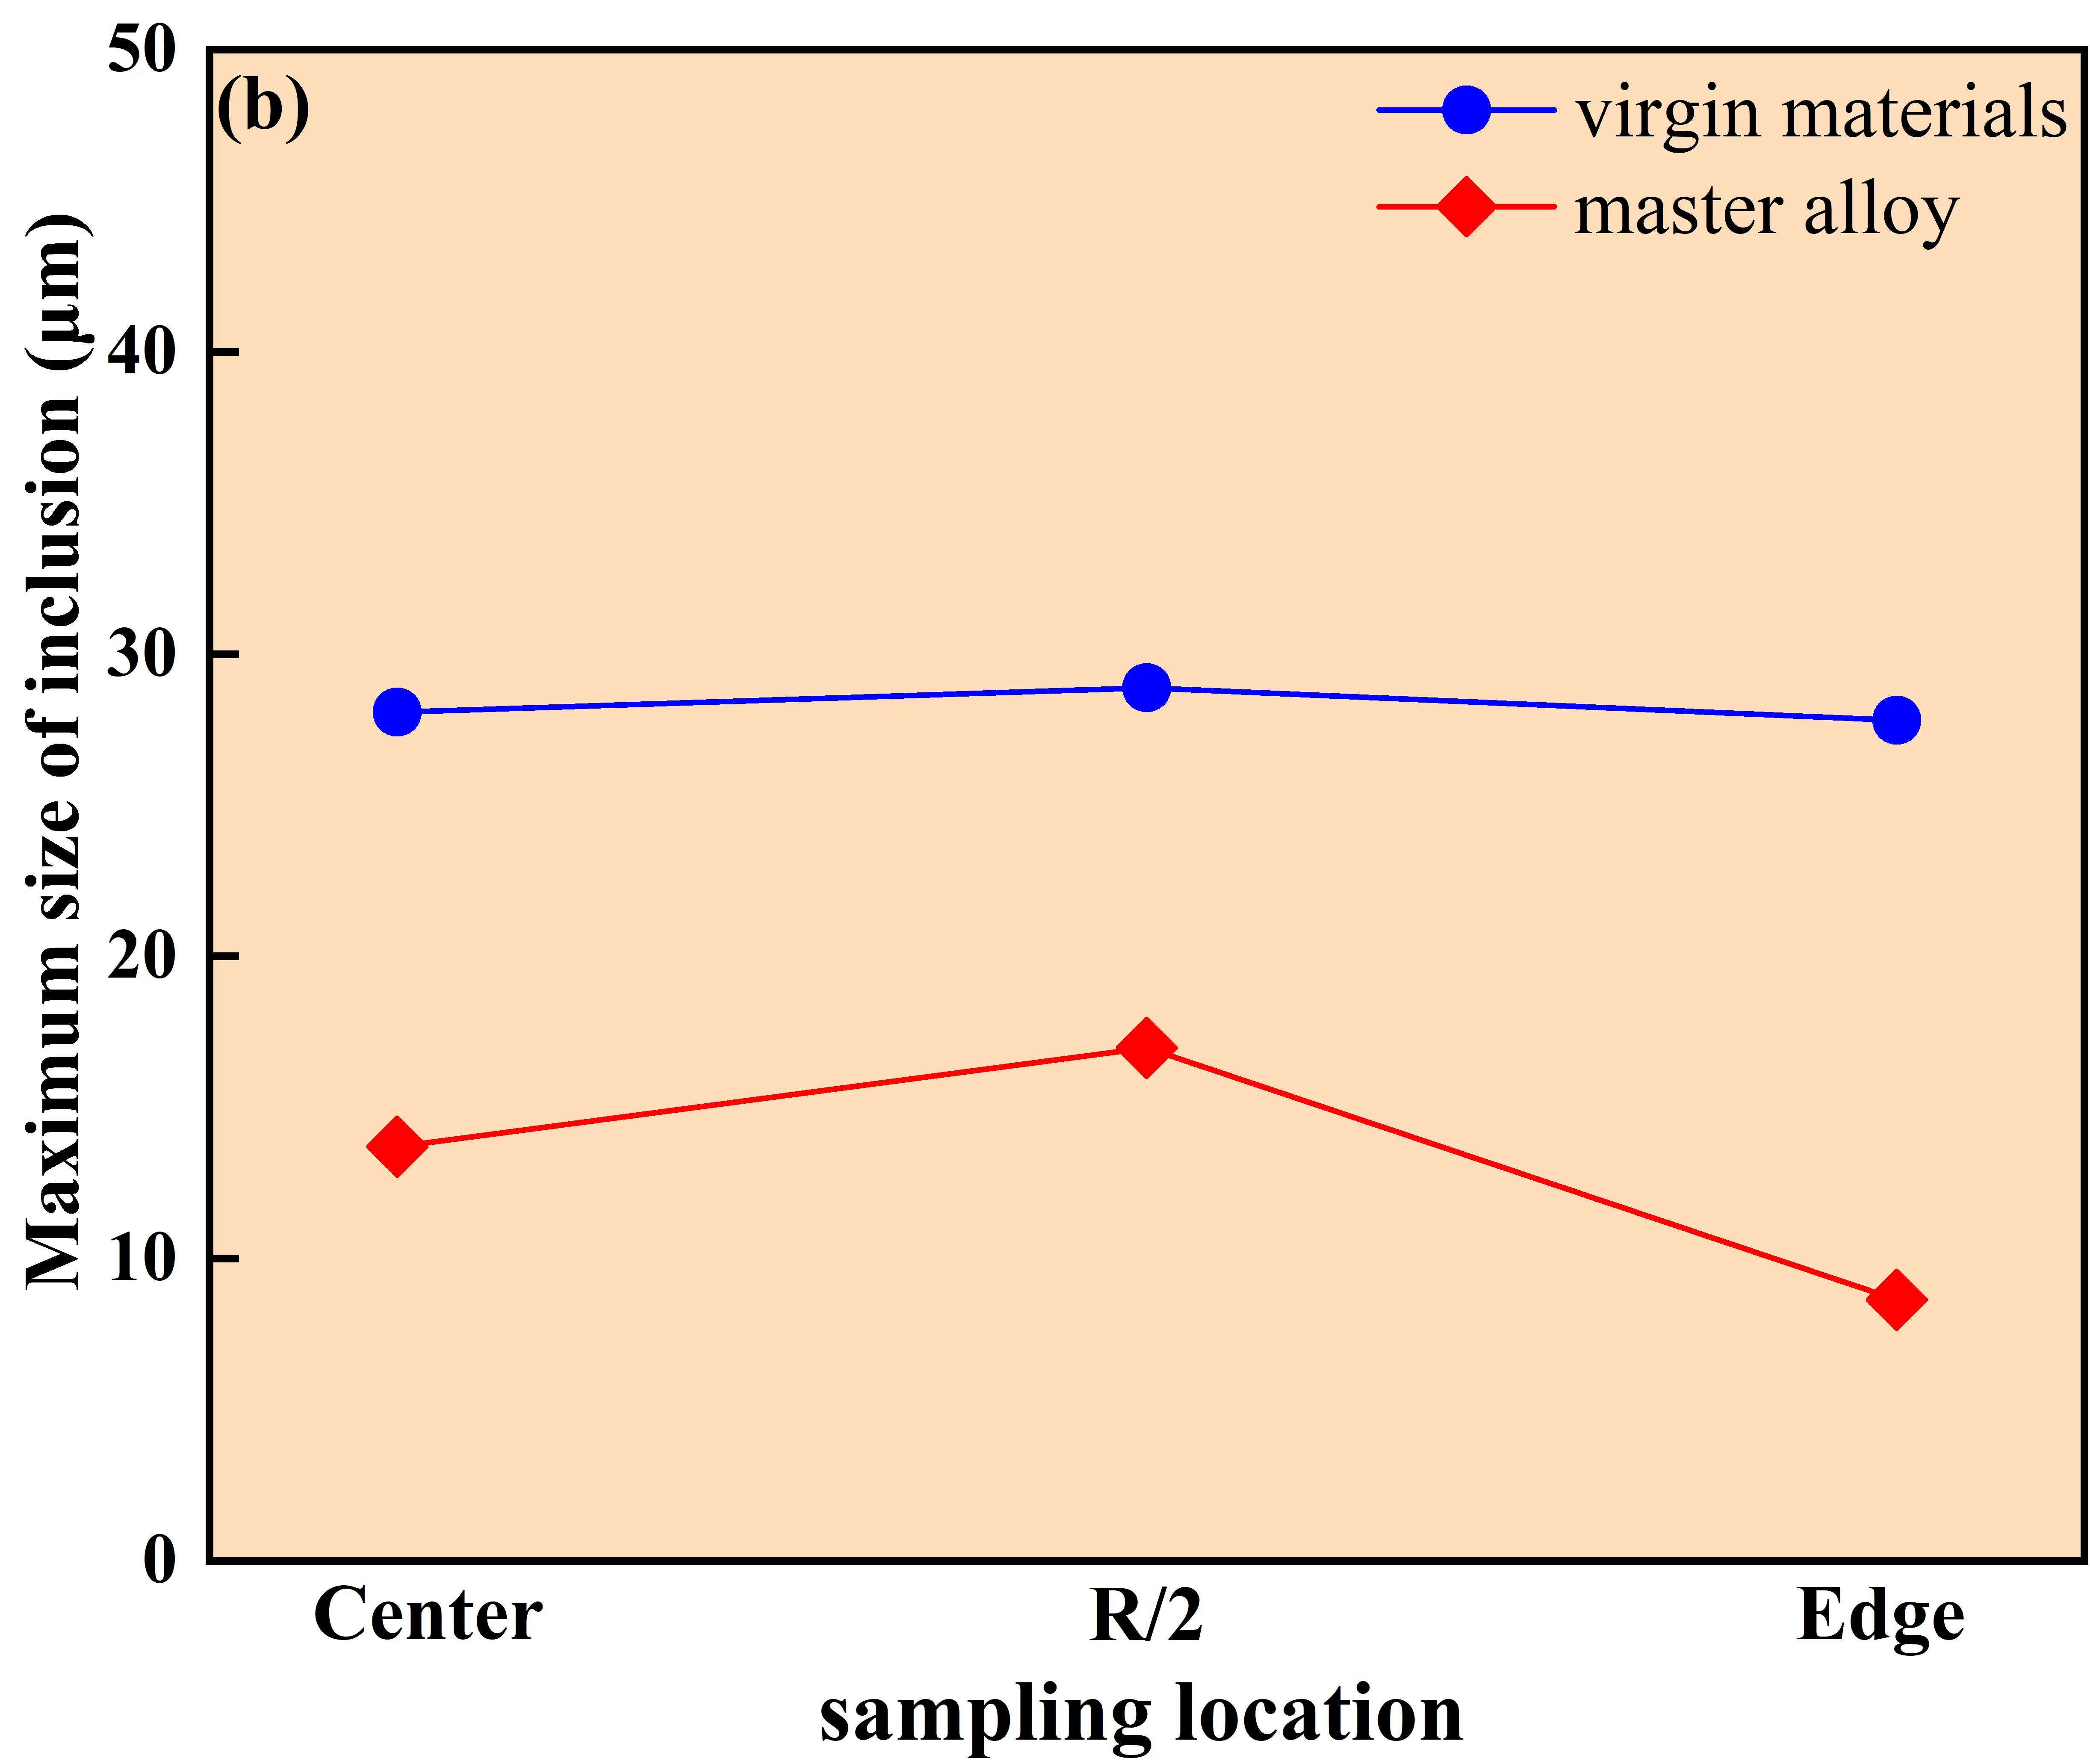 |
Figure 15. Inclusion number density and maximum size in GH4169D alloy produced via different charge material routes. (a) Number of inclusions at different locations of the ingot; (b) Maximum size of inclusions at different locations of the ingot.
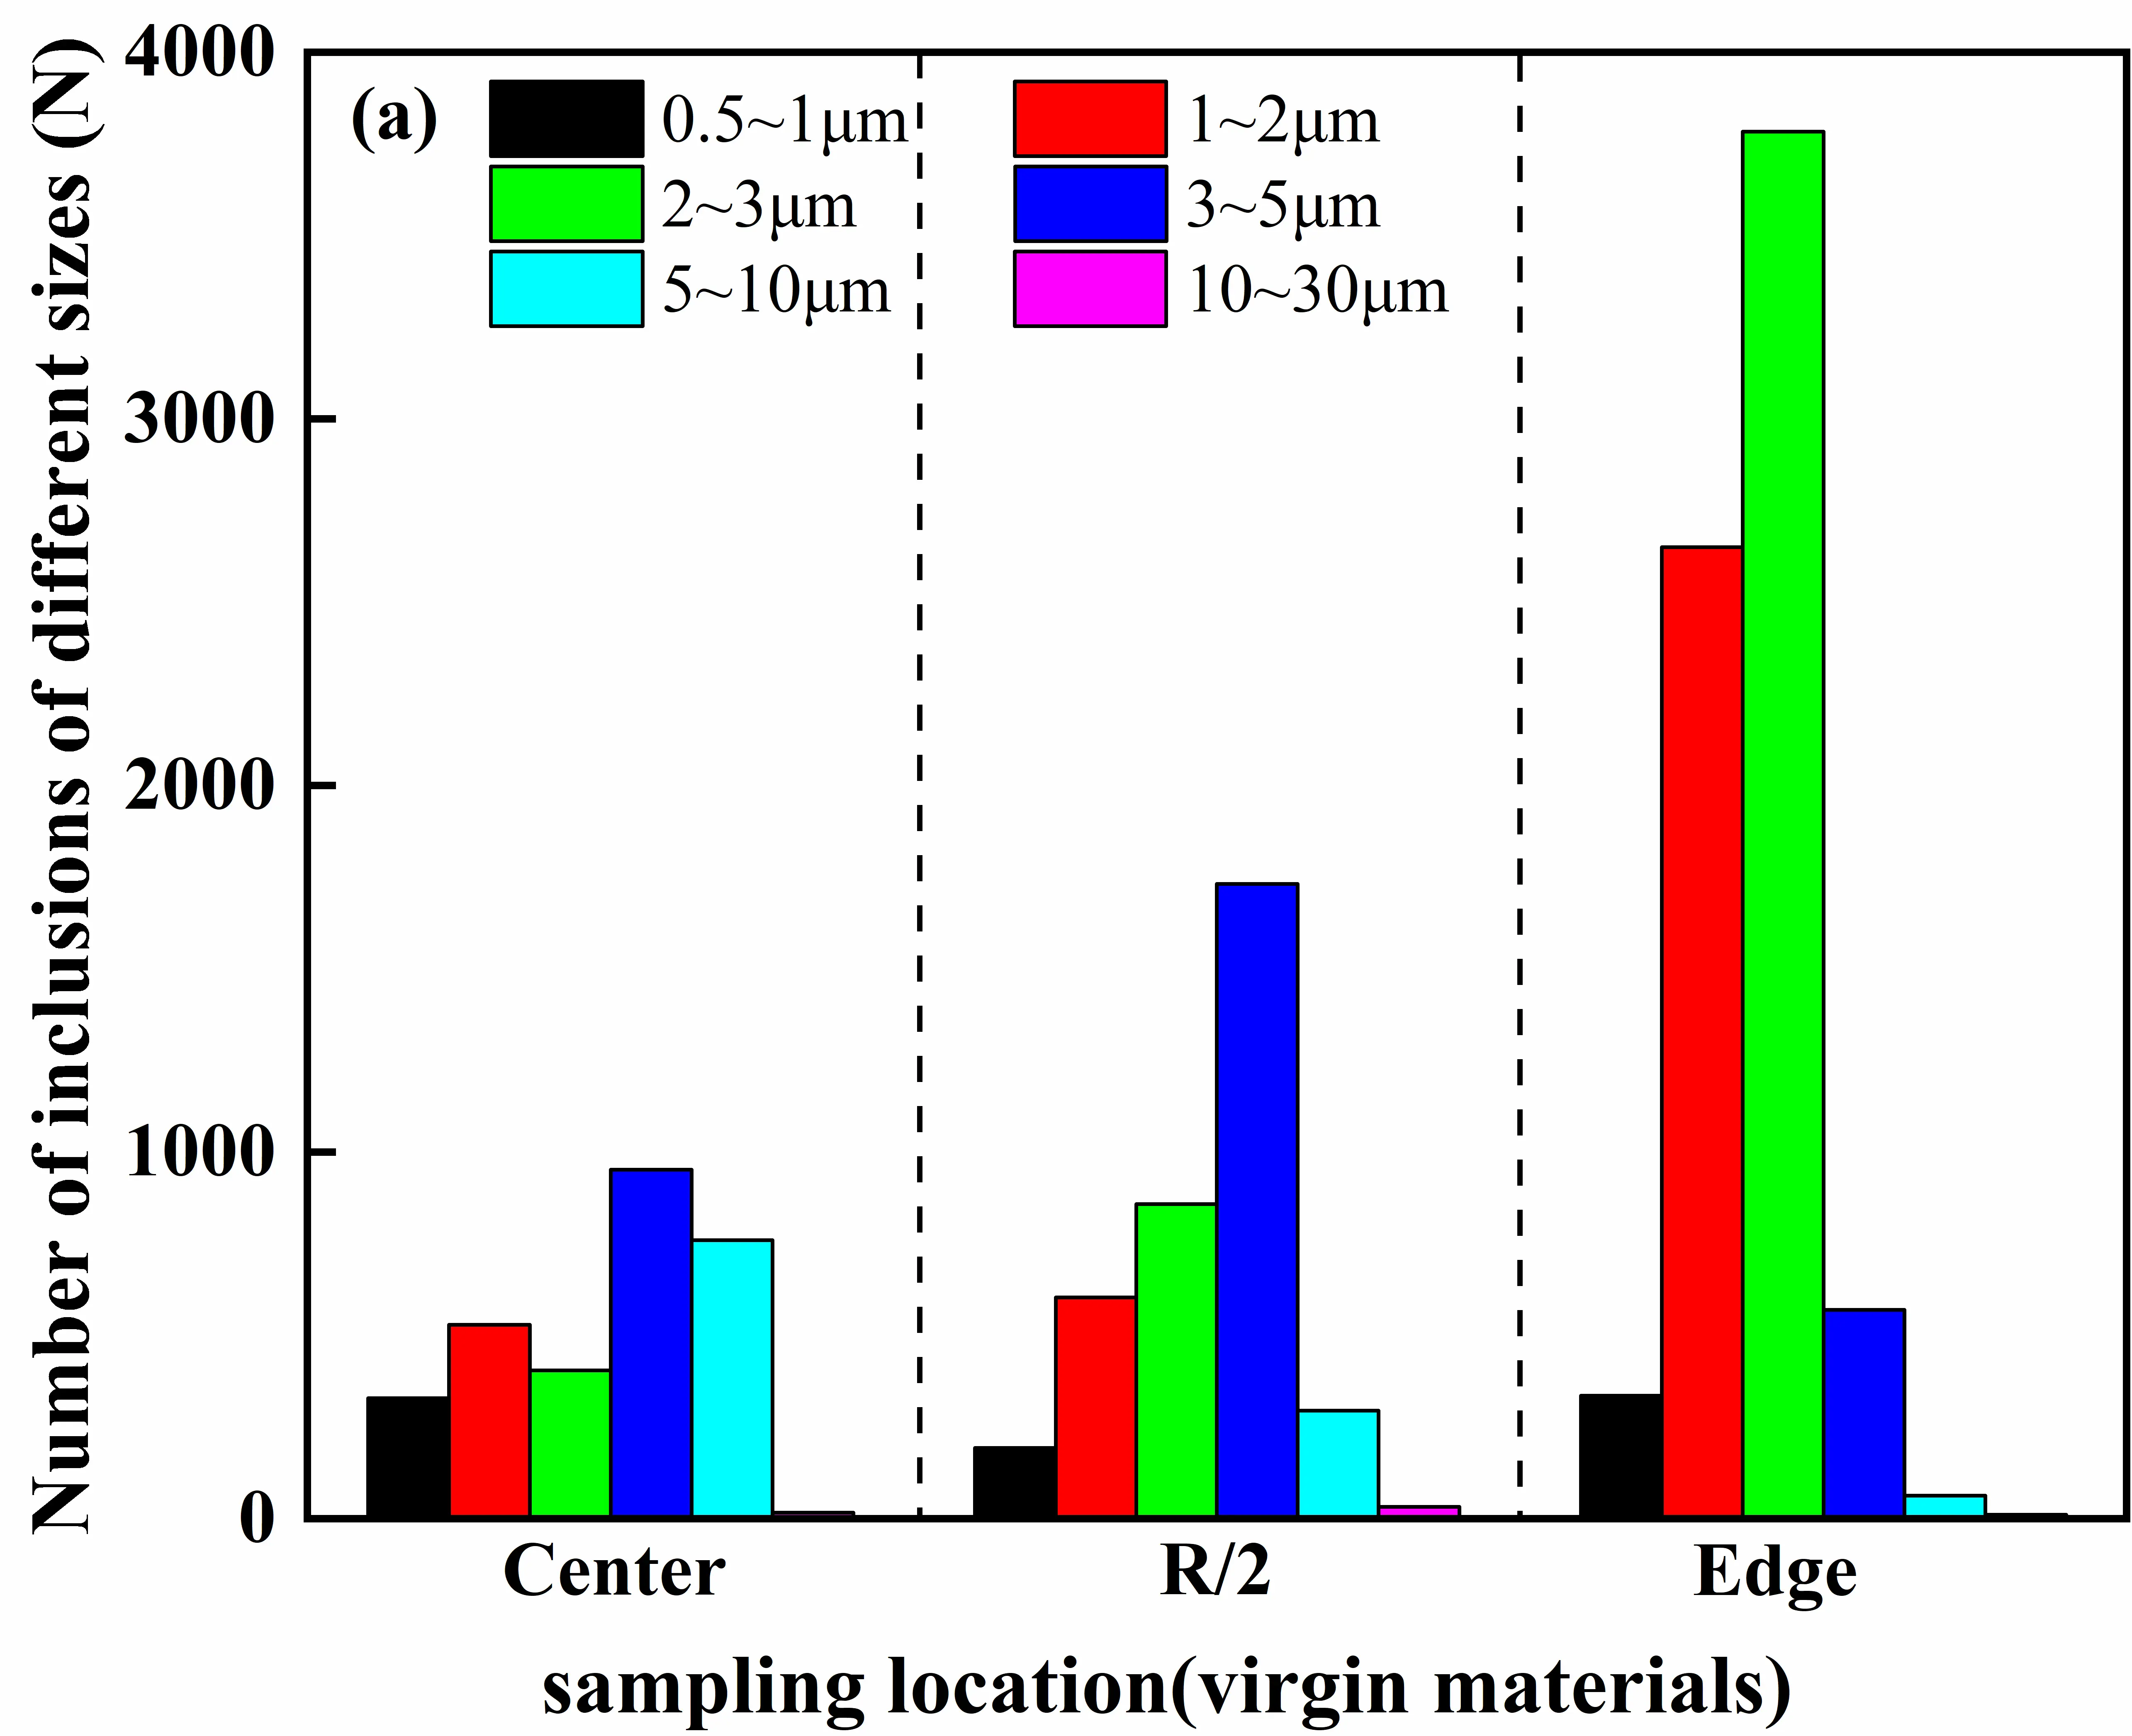
Further insights into the scale evolution of inclusions under different charge material routes can be obtained from the inclusion size distribution statistics shown in Figure 16. For the GH4169D ingot prepared using virgin materials, inclusions are predominantly distributed within the size range of 0.5–5 μm, with the highest proportion occurring in the 1–3 μm interval. As the sampling position shifts from the center toward the edge, the fraction of inclusions within this size range increases continuously and gradually becomes the dominant size characteristic in the edge region. By comparison, inclusions formed via the master-alloy-assisted route exhibit a noticeably finer overall size distribution, primarily concentrated in the range of 0.5–3 μm. Furthermore, the proportion of inclusions smaller than 2 μm increases progressively toward the edge, indicating a distinct refinement trend from the center to the edge.
 |
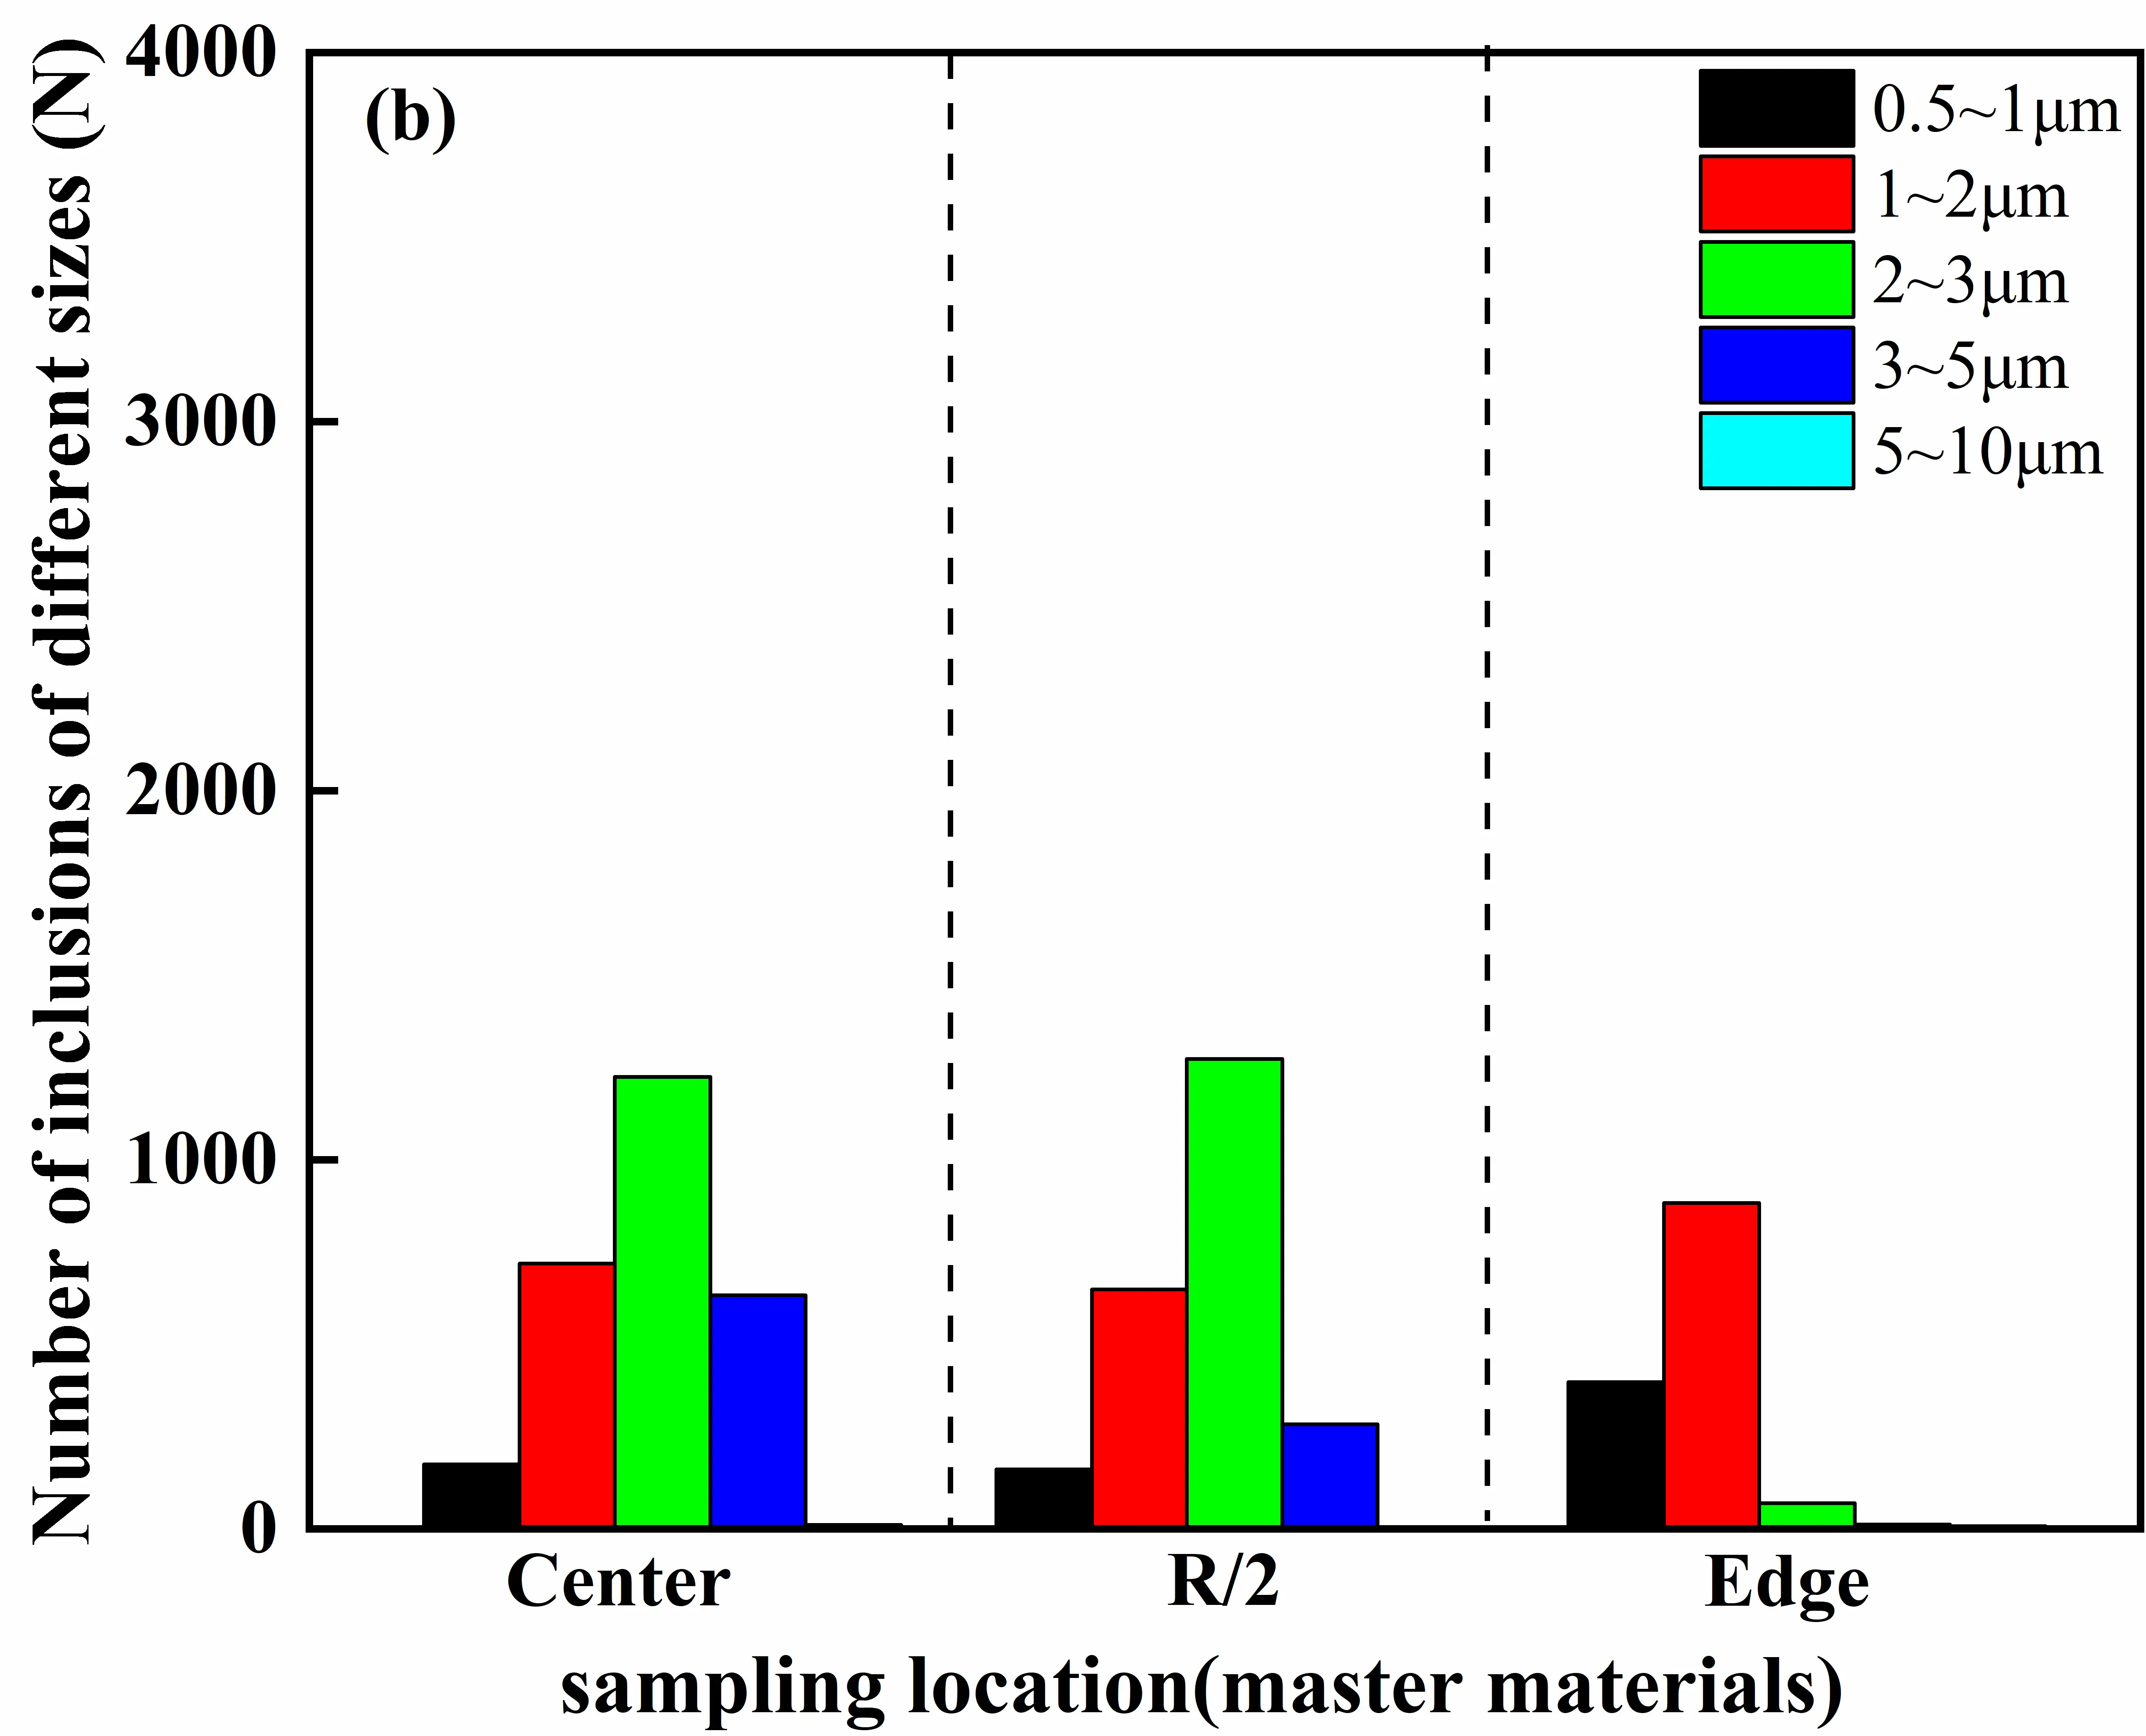 |
Figure 16. Inclusion size distribution ranges in GH4169D alloy produced via different charge material routes. (a) Number of inclusions of different sizes at various ingot locations prepared using virgin materials; (b) Number of inclusions of different sizes at various ingot locations prepared using master materials.
The origin of these differences can be attributed to systematic distinctions between the two routes in terms of inclusion nucleation behavior, melt transport, and solidification capture mechanisms. In the virgin-material route, relatively high oxygen and nitrogen activities promote the formation and stabilization of a large number of primary oxide nuclei during the early stages of melting. During subsequent pouring, melt convection and stirring in the central region—characterized by the slowest solidification rate and the longest liquid residence time—facilitate the collision and aggregation of inclusion particles [37,38], leading to the formation of coarse inclusions with sizes approaching 30 μm. In contrast, effective deoxidation and denitrification are achieved during the preparation of the master alloy, which significantly reduces the activities of oxygen and nitrogen in the melt. This suppresses the formation of primary inclusions at the source and reduces the likelihood of particle collisions and aggregation, thereby hindering the evolution of inclusions toward the medium- to large-size range. As a result, a fine-inclusion-dominated size distribution is maintained across the radial direction, with the maximum inclusion size generally remaining below 20 μm.
In addition, inclusion migration behavior further amplifies the differences between the two routes. Coarse oxide inclusions possess higher flotation and drift tendencies, making them more likely to migrate toward the outer regions of the ingot under the combined effects of pouring flow and melt convection. When approaching the mold wall, where cooling rates increase, and melt flow weakens, these inclusions are readily captured by the advancing solidification front, resulting in a pronounced number-density peak at the edge region in the virgin-material route. Conversely, inclusions formed in the master-alloy-assisted route are relatively small, and their migration is strongly limited by interfacial tension and solute drag effects. Consequently, most inclusions are captured near their formation locations by the solidification front, leading to a radial distribution characterized by higher inclusion densities in the center and lower densities toward the edge.
Solidification kinetics further reinforce this contrast. In the virgin-material route, the abundant presence of coarse inclusions allows the rapidly advancing solidification front at the edge to capture a large number of inclusions transported toward the near-surface region, thereby increasing the local number density. In the master-alloy-assisted route, however, the overall inclusion population is inherently limited, and the fine inclusions formed at later stages lack sufficient mobility to migrate toward the edge prior to solidification. As a result, the edge region consistently exhibits low inclusion density and small inclusion sizes.
In summary, by reducing the initial inclusion population, suppressing inclusion coarsening, and weakening radial migration effects, the master-alloy-assisted route enables GH4169D alloy ingots to achieve improved inclusion characteristics in terms of both number density and size distribution compared with the virgin-material route. These results demonstrate the technological advantages of the master alloy strategy for high-purity superalloy production.
3.3.4. Production Cost and Melting Efficiency
In addition to metallurgical cleanliness evaluation, the energy consumption structure and melting efficiency associated with the two charge material routes were further compared from a melting kinetics perspective under industrial VIM conditions, as shown in Figure 17. Although the master-alloy-assisted route introduces an additional pre-fabrication step, its lower liquidus temperature and higher initial compositional homogeneity significantly accelerate the melting process, enabling the melt to reach a stable liquid state within a shorter time. Since the melting stage accounts for the majority of energy consumption in VIM processing, the enhanced melting rate directly shortens the high-temperature holding duration, thereby reducing the specific energy consumption and lowering the total production cost by approximately 110 CNY per ton.
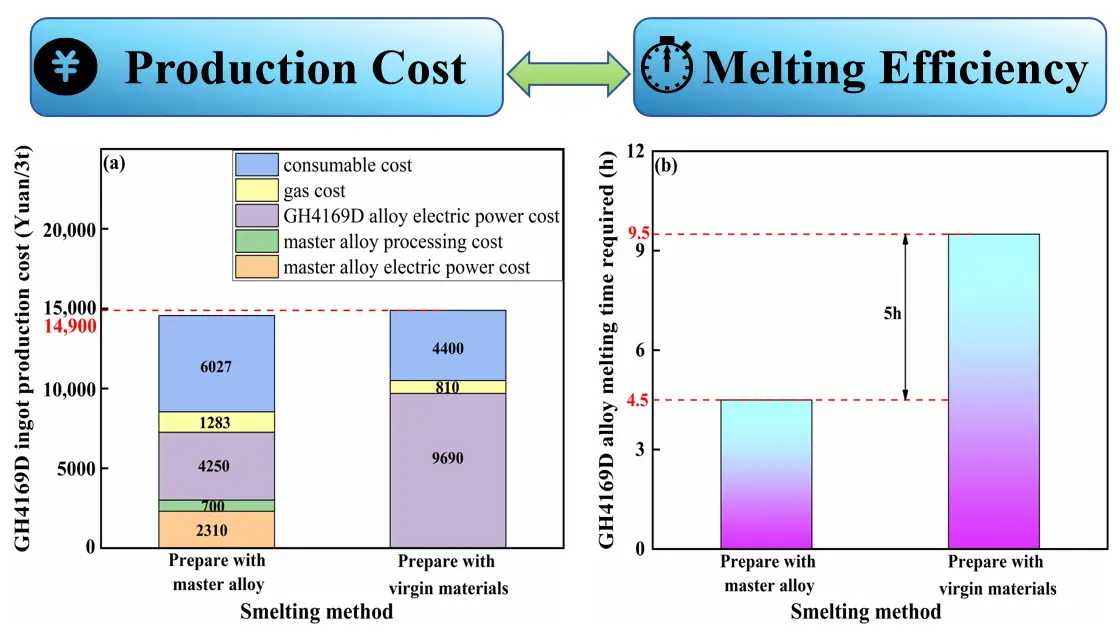
Figure 17. Production cost and melting efficiency of GH4169D alloy produced via different raw material routes. (a) Melting cost of GH4169D ingots using different smelting methods; (b) Melting time of GH4169D ingots using different smelting methods
Furthermore, the low oxygen and nitrogen characteristics of the master alloy substantially weaken the dependence on deoxidation and denitrification reactions during VIM processing. As a result, the kinetic time constant (τ) associated with the refining and homogenization stage is markedly reduced, leading to an overall increase in melting efficiency of 52.6%. These results demonstrate that the master-alloy-assisted route not only improves the metallurgical cleanliness of GH4169D alloy, but also achieves a synergistic optimization of energy consumption structure and process efficiency by regulating melt formation kinetics and solute activities. This highlights the significant technological and economic advantages of the master alloy strategy for producing high-purity superalloys.
4. Conclusions
To meet the requirements for high-purity and high-efficiency industrial production of GH4169D superalloy, a charge material strategy based on a Ni–Cr–Nb master alloy was proposed and systematically validated. Through compositional design, melting behavior analysis, and industrial-scale ingot verification, the following conclusions can be drawn:
A high-purity Ni–Cr–Nb master alloy with a nominal composition of Ni65.3Cr26.7Nb8 was successfully developed. The master alloy exhibits excellent metallurgical cleanliness, with oxygen and nitrogen contents of 76 ppm and 36 ppm, respectively. The inclusions show an average size of 2.2 ± 0.15 μm and a number density of 540 ± 20 cm−2, indicating stable interfacial reactions and good controllability of metallurgical purity.
The master-alloy-assisted route significantly improves the metallurgical purity of GH4169D alloy. After adopting the master alloy, the oxygen content is reduced to 8 ppm compared with 12 ppm for the virgin-material route, while the nitrogen content remains stable at approximately 27 ppm. These results demonstrate that the master alloy effectively suppresses oxygen contamination at the source and enhances compositional control accuracy, while maintaining nitrogen within the specified compositional limits.
The master alloy markedly suppresses inclusion formation, coarsening, and radial migration in GH4169D ingots. The inclusion number densities at the center, R/2 position, and edge are reduced from 2993 cm−2, 3717 cm−2, and 7414 cm−2 to 2764 cm−2, 2375 cm−2, and 1371 cm−2, respectively, while the maximum inclusion size decreases from 28–29 μm to 9–17 μm. These results confirm that the master alloy reduces the population of primary inclusions and weakens collision-induced aggregation and radial migration, thereby significantly improving the overall metallurgical cleanliness of the ingots.
The master-alloy-assisted route exhibits distinct advantages in energy consumption and melting efficiency during industrial VIM processing. The production cost is reduced by approximately 110 CNY per ton, and the melting efficiency is improved by 52.6%. These benefits originate from the lower liquidus temperature and higher initial compositional homogeneity of the master alloy, which accelerate melting kinetics, shorten refining duration, and reduce the kinetic demand for deoxidation and denitrification.
Overall, the proposed master alloy strategy not only achieves a substantial improvement in the metallurgical purity of GH4169D superalloy but also enables a synergistic optimization of melting efficiency and production cost. The compositional design concept and processing route established in this work provide a transferable methodology for the high-purity and low-energy production of advanced superalloys, offering valuable guidance for industrial applications in the aerospace and related high-performance alloy fields.
Author Contributions
Conceptualization, Q.Z. and D.W.; Methodology, R.S.; Validation, D.W. and X.Q.; Investigation, H.D.; Resources, Q.Z.; Data Curation, D.W. and Q.Z.; Writing—Original Draft Preparation, D.W.; Writing—Review & Editing, R.S. and Q.Z.; Supervision, R.S.; Project Administration, H.D.
Ethics Statement
Not applicable.
Informed Consent Statement
Not applicable.
Data Availability Statement
The datasets generated and/or analyzed during the current study are available from the corresponding author on reasonable request.
Funding
This research received no external funding.
Declaration of Competing Interest
The authors declare that they have no known competing financial interests or personal relationships that could have appeared to influence the work reported in this paper.
References
-
Chan KS. A fatigue life model for predicting crack nucleation at inclusions in Ni-based superalloys. Metall. Mater. Trans. A 2020, 51, 1148–1162. DOI:10.1007/s11661-019-05592-4 [Google Scholar]
-
Wang MQ, Du JH, Deng Q, Tian ZL, Zhu J. Effect of the precipitation of the η-Ni3Al0.5Nb0.5 phase on the microstructure and mechanical properties of ATI 718Plus. J. Alloys Compd. 2017, 701, 635–644. DOI:10.1016/j.jallcom.2017.01.145 [Google Scholar]
-
Wang MQ, Du JH, Deng Q. Influence of oxygen partial pressure on crack propagation of superalloys under fatigue–creep–environment interaction. Mater. Sci. Eng. A 2021, 812, 140903. DOI:10.1016/j.msea.2021.140903 [Google Scholar]
-
Zhao P, Di CX, Zhang T, Wang MQ. Fatigue behavior and fracture characteristics of 718Plus nickel-based superalloy at high temperature. Mater. Technol. 2023, 38, 2174797. DOI:10.1080/10667857.2023.2174797 [Google Scholar]
-
Chen K, Dong JX, Yao ZH, Ni TW, Wang MQ. Creep performance and damage mechanism of Allvac 718Plus superalloy. Mater. Sci. Eng. A 2018, 738, 308–322. DOI:10.1016/j.msea.2018.09.088 [Google Scholar]
-
Mitchell A. Progress in understanding clean metal production for IN718. Superalloys 1994, 718, 109–123. DOI:10.7449/1994/Superalloys_1994_109_123 [Google Scholar]
-
Zheng L, Zhang GQ, Gorley MJ, Lee TL, Li Z, Xiao CB, et al. Effects of vacuum on gas content, oxide inclusions and mechanical properties of Ni-based superalloy using electron beam button and synchrotron diffraction. Mater. Des. 2021, 207, 109861. DOI:10.1016/j.matdes.2021.109861 [Google Scholar]
-
Feng HX, Zhao LX, Liu EZ, Tan Z, Ning LK, Tong J, et al. Effect of chromium quality on inclusions in GH4169 ingot. Chin. J. Mater. Res. 2023, 37, 136–144. DOI:10.11901/1005.3093.2021.535 [Google Scholar]
-
Gao JG, Yang SL, Yang SF, Li JS, Liu W, Zhao MJ, et al. Evolution of inclusions in vacuum induction melting of superalloys containing 70% return material. J. Iron Steel Res. Int. 2024, 31, 719–728. DOI:10.1007/s42243-023-01069-2 [Google Scholar]
-
Schmiedel A, Burkhardt C, Henkel S, Weidner A, Biermann H. Very high cycle fatigue behavior of additively manufactured and wrought Inconel 718 at 873 K. Metals 2021, 11, 1682. DOI:10.3390/met11111682 [Google Scholar]
-
Yang SF, Yang SL, Qu JL, Du JH, Gu Y, Zhao P, et al. Inclusions in wrought superalloys: A review. J. Iron Steel Res. Int. 2021, 28, 921–937. DOI:10.1007/s42243-021-00617-y [Google Scholar]
-
Xu WY, Li Z, Yuan H, Wang Y, Liu NW, Zhang GQ. Influence of master alloy on the cleanliness of spray-formed superalloy. Mater. Sci. Forum 2014, 788, 421–425. DOI:10.4028/www.scientific.net/MSF.788.421 [Google Scholar]
-
Chen XW, Zhang L, Liu Y, Gao XY, Li D, Lu HF, et al. Phase evolution and densification behavior of MIM418 superalloy utilizing master alloy approach. J. Alloys Compd. 2019, 771, 33–41. DOI:10.1016/j.jallcom.2018.08.193 [Google Scholar]
-
Afonso CRM, Martinez-Orozco K, Amigo V, Della Rovere CA, Spinelli JE, Kiminami CS. Characterization, corrosion resistance and hardness of rapidly solidified Ni–Nb alloys. J. Alloys Compd. 2020, 829, 154529. DOI:10.1016/j.jallcom.2020.154529 [Google Scholar]
-
Li SM, Song YP, Ma BL, Tang L, Fu HZ. Effect of abrupt growth velocity change on directionally solidified microstructures of Ni–24.19 wt.% Nb hypereutectic alloy. Mater. Sci. Eng. A 2008, 475, 117–123. DOI:10.1016/j.msea.2007.04.086 [Google Scholar]
-
Detrois M, Jablonski PD. Trace element control in binary Ni–25Cr and ternary Ni–30Co–30Cr master alloy castings. In Proceedings of the Liquid Metal Processing & Casting Conference, Philadelphia, PA, USA, 10–13 September 2017. DOI:10.2172/1406915 [Google Scholar]
-
Lv SY, Kou YL, Liu YK, Zhang YH, Li QL. Improving strength-ductility synergy of TiNbVTa refractory high-entropy alloys at room temperature by Cr microalloying. Mater. Sci. Eng. A 2025, 946, 149111. DOI:10.1016/j.msea.2025.149111 [Google Scholar]
-
Lv SY, Li QL, Zhang XY, Jiao XW, Liu DX. CALPHAD-aided design for superior mechanical behavior in Ti40Zr20Hf40−xCrx eutectic refractory high-entropy alloys. Mater. Charact. 2024, 217, 114393. DOI:10.1016/j.matchar.2024.114393 [Google Scholar]
-
Chen JL, Wang XQ, Zhou L, Fu P, Cheng Y, Zhang HR. Effect of refining temperature and time on purification and composition control of FGH95 powder metallurgy superalloy return material during vacuum induction melting. Metals 2025, 15, 1140. DOI:10.3390/met15101140 [Google Scholar]
-
Gao XY, Zhang L, Qu XH, Chen XW, Luan YF. Effect of interaction of refractories with Ni-based superalloy on inclusions during vacuum induction melting. Int. J. Miner. Metall. Mater. 2020, 27, 1551–1559. DOI:10.1007/s12613-020-2098-9 [Google Scholar]
-
Liu YS, Gao YY, Wang EH, Chen GY, Xu EX, Zhao F, et al. Interaction between CA6–MA crucible and molten wrought Ni-based superalloys. J. Eur. Ceram. Soc. 2023, 43, 1714–1722. DOI:10.1016/j.jeurceramsoc.2022.11.050 [Google Scholar]
-
Song QZ, Qian K, Chen B. Interfacial reaction between nickel-based superalloy K417G and oxide refractories. Acta Metall. Sin. 2021, 58, 868–882. DOI:10.11900/0412.1961.2021.00048 [Google Scholar]
-
Zhang GD, Zhang JH, Yang HX, Wang J, Liu XH, Li JS. Interfacial reaction between nickel-based superalloy and Al2O3 crucible during vacuum induction melting. J. Vac. Sci. Technol. B 2024, 42, 054203. DOI:10.1116/6.0003860 [Google Scholar]
-
Wang N, Gao JG, Yang SL, Yang SF, Liu M, Liu W, et al. Numerical simulation of denitrification reaction of INCONEL 718 during vacuum induction melting. Metall. Mater. Trans. B 2022, 53, 1474–1483. DOI:10.1007/s11663-022-02457-x [Google Scholar]
-
Gao SY, Wang M, Xie XY, Liu M, Bao YP. Behavior of nitrogen in GH4169 superalloy melt during vacuum induction melting using returned materials. Metals 2021, 11, 1119. DOI:10.3390/met11071119 [Google Scholar]
-
Qian K, Chen B, Zhang L, Du ZH, Liu K. Kinetics of nitrogen removal from liquid IN718 alloy during vacuum induction melting. Vacuum 2020, 179, 109521. DOI:10.1016/j.vacuum.2020.109521 [Google Scholar]
-
Zhao P, Gao JG, Yang SF, Liu W, Li JS, Zhao MJ. Effect of revert addition on nitrogen removal from liquid superalloy during vacuum induction melting. Metall. Mater. Trans. B 2024, 55, 431–445. DOI:10.1007/s11663-023-02968-1 [Google Scholar]
-
Lu X, Matsubae K, Nakajima K, Nakamura S, Nagasaka T. Thermodynamic considerations of contamination by alloying elements in remelted end-of-life nickel- and cobalt-based superalloys. Metall. Mater. Trans. B 2016, 47, 1785–1795. DOI:10.1007/s11663-016-0665-2 [Google Scholar]
-
Garcia-Michelena P, Chamorro X, Herrero-Dorca N, Bernal D, Hurtado I, Ruiz-Reina E, et al. Effect of crucible composition on vacuum induction melting efficiency of Inconel 718. J. Mater. Res. Technol. 2023, 23, 3351–3361. DOI:10.1016/j.jmrt.2023.01.213 [Google Scholar]
-
Zhao L, Liu ZQ, Zhang YQ, Liang T, Ma YC, Li BK. Numerical simulation of inclusion transport behavior during vacuum induction melting of nickel-based superalloy. J. Iron Steel Res. Int. 2025, 32, 4052–4067. DOI:10.1007/s42243-025-01559-5 [Google Scholar]
-
Zhang LH, Liu EK, Xing WJ, Xue ZJ, Fan WJ, Zhao YS, et al. Formation mechanism of oxide inclusions in high-aluminum Ni-based superalloy during vacuum induction remelting. Metals 2024, 14, 654. DOI:10.3390/met14060654 [Google Scholar]
-
Garcia-Michelena P. Enhancement of Vacuum Induction Melting Through Numerical and Experimental Investigation. Ph.D. Thesis, Mondragon University, Mondragón, Spain, 2023. [Google Scholar]
-
Zhou HJ, You XG, Bi ZN, Cui CY, Wang YN, Tan Y. Quantitative analysis and formation mechanisms of non-metallic inclusions in GH4068 alloy prepared by vacuum induction melting. J. Mater. Res. Technol. 2023, 22, 2212–2221. DOI:10.1016/j.jmrt.2022.12.046 [Google Scholar]
-
Chang LZ, Yao LF, Su YL, Wang Y, Li HW, Shi XF. Evolution of inclusions in Inconel 718 during vacuum induction melting with 30% revert. Vacuum 2025, 244, 114859. DOI:10.1016/j.vacuum.2025.114859 [Google Scholar]
-
Gao XY, Zhan L, Luan YF, Chen XW, Qu XH. Inclusion agglomeration and flotation during levitation melting of Ni-based superalloy in cold crucible. JOM 2020, 72, 3247–3255. DOI:10.1007/s11837-020-04238-w [Google Scholar]
-
Liang Y, Cheng GG. Characteristics of Al2O3, MnS and TiN inclusions during remelting of bearing steel. Int. J. Miner. Metall. Mater. 2017, 24, 869–875. DOI:10.1007/s12613-017-1472-8 [Google Scholar]
-
Yue Q, Hu Z, Wu ZY, Long HM, Meng QM. Visualization of collision and aggregation behavior of particles simulating inclusions in molten steel. J. Iron Steel Res. Int. 2018, 25, 173–180. DOI:10.1007/s42243-018-0016-4 [Google Scholar]
-
Pumir A, Wilkinson M. Collisional aggregation due to turbulence. Annu. Rev. Condens. Matter Phys. 2016, 7, 141–170. DOI:10.1146/annurev-conmatphys-031115-011538 [Google Scholar]