A Comprehensive Study on the Phase Structure, Surface Properties, and Active Oxygen Species of A2B2O7 Composite Oxides

A Comprehensive Study on the Phase Structure, Surface Properties, and Active Oxygen Species of A2B2O7 Composite Oxides
Shijing Zhang 1,† Junwei Xu 1,2,*,† Xiaomei Yu 1 Yong Fu 1 Lei Mao 1 Xiang Wang 1,*
Received: 23 November 2025 Revised: 07 January 2026 Accepted: 23 January 2026 Published: 29 January 2026

© 2026 The authors. This is an open access article under the Creative Commons Attribution 4.0 International License (https://creativecommons.org/licenses/by/4.0/).
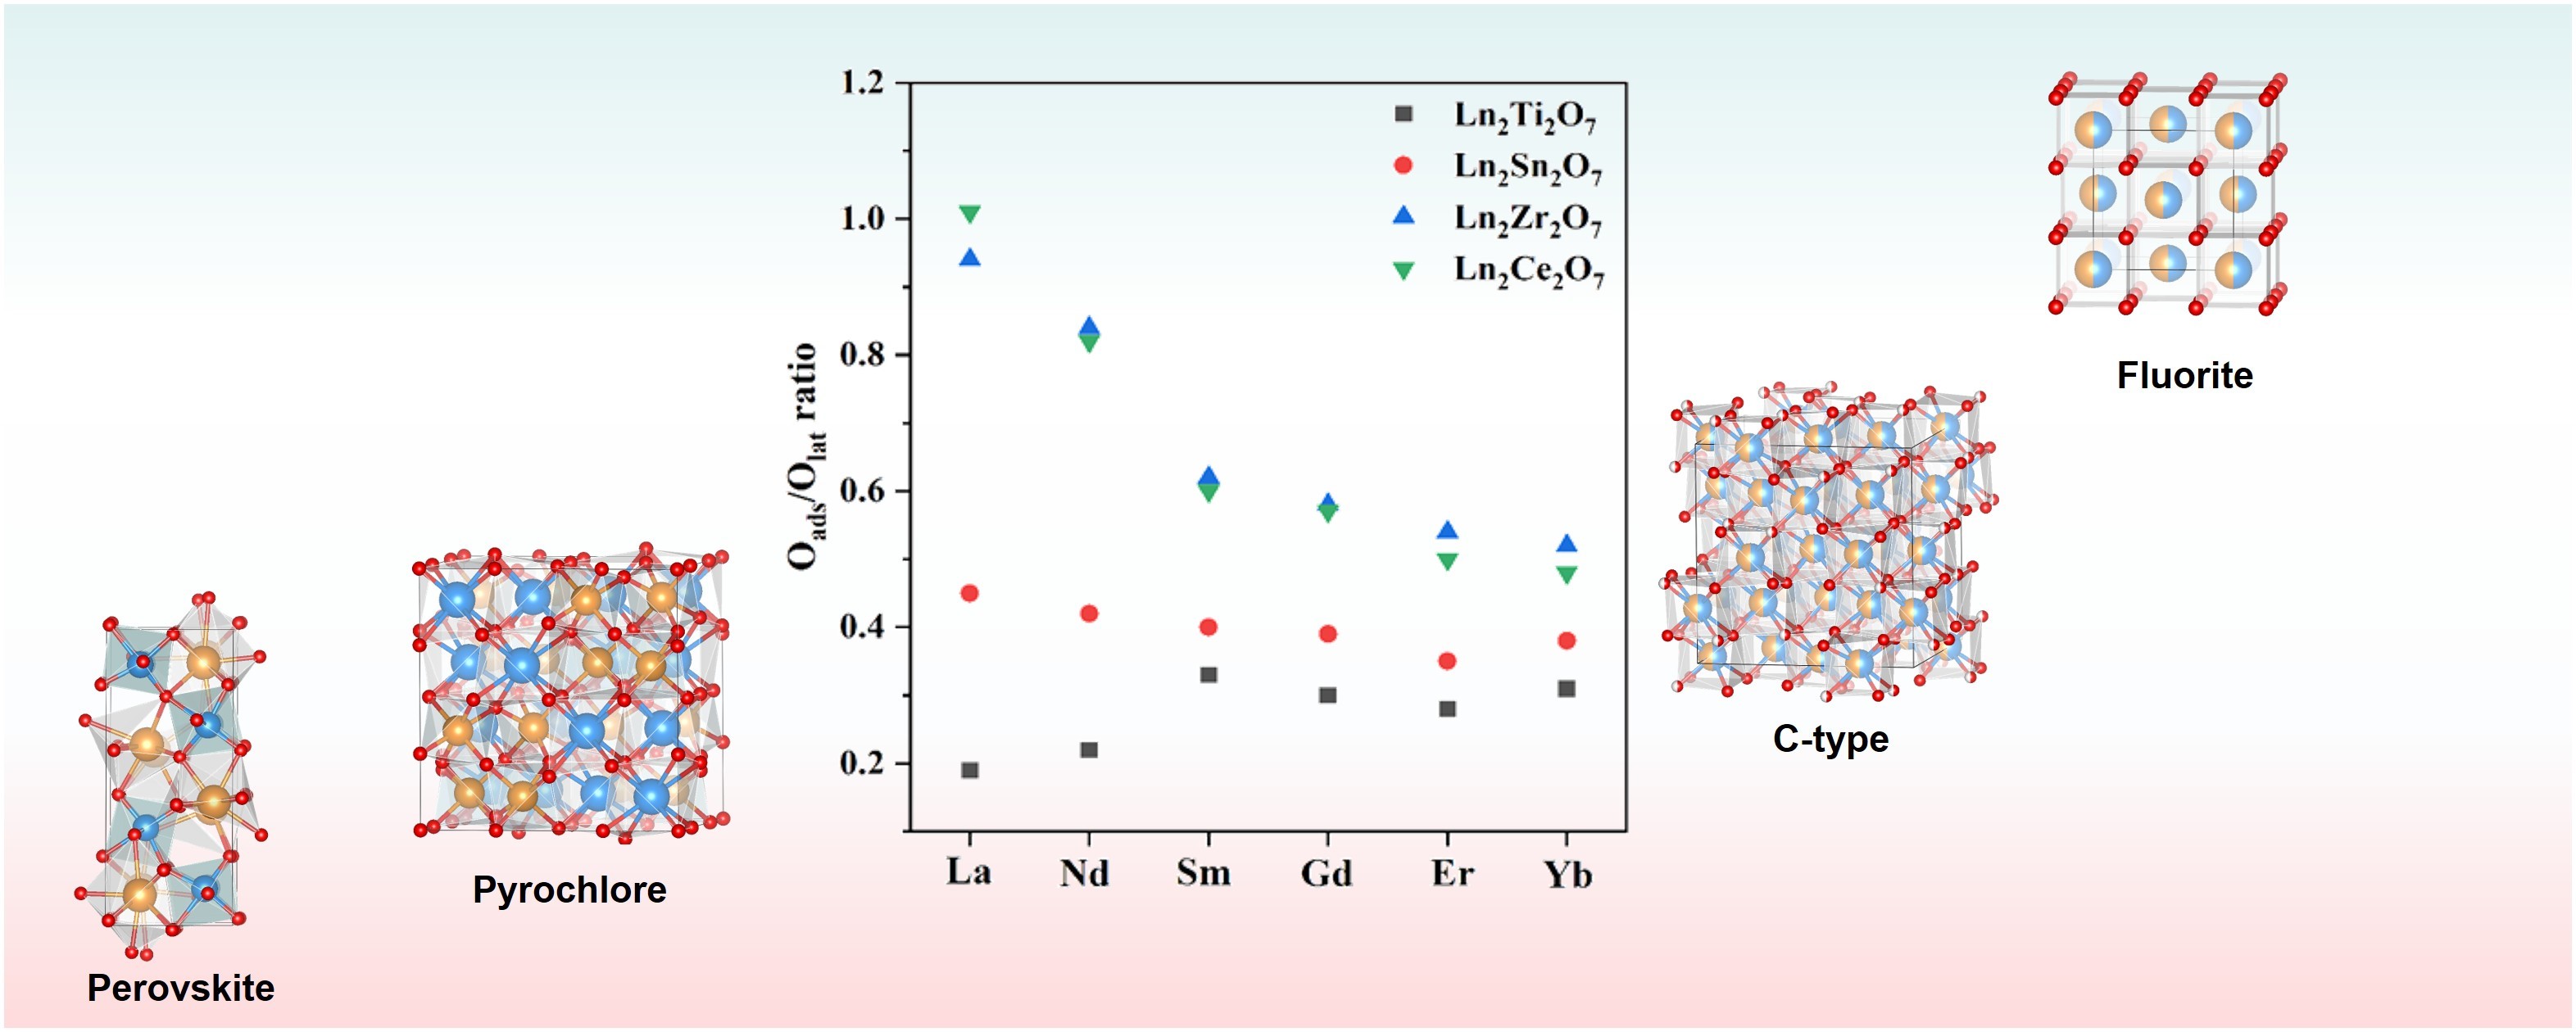
Graphical Abstract
1. Introduction
The A2B2O7-type composite oxides possess high chemical stability, high melting points, relatively low conduction temperatures, and excellent ionic conductivity, with some compounds exhibiting proton conductivity [1,2,3]. Further, they exhibit significant potential for applications in high-temperature solid oxide fuel cells, gas sensors, and heterogeneous thermal catalytic reactions in the presence of oxygen [1,2,3]. In addition, A2B2O7-type composite oxides exhibit distinct subcrystalline phase structures that show a significant dependence on the ionic radii of the A- and B-site elements and are affected by variations in synthetic methods [4]. Thus, the cationic radius ratio (rA/rB) has a crucial impact on the sub-crystalline phase structure [4,5,6]. Stable pyrochlore compounds can be obtained within a rA/rB range of 1.46 to 1.78 [4,5,6]. For rA/rB values below 1.46, a disordered defect fluorite-type crystal phase structure is easily formed [4,5,6], while rA/rB values above 1.78 yield a monoclinic perovskite structure [4,5,6]. When rA/rB approaches 1.17, a rare earth C-type crystal phase structure is formed [4,7]. As the sub-crystalline phase structure transitions from the monoclinic layered perovskite to the pyrochlore, disordered defect fluorite, and rare earth C-type structures, the lattice disorder transitions from ordered to disordered and then to ordered, with a change from no intrinsic oxygen vacancies to ordered ones and from disordered to ordered oxygen vacancies [3,4]. These changes affect the properties of reactive oxygen species on the surface.
In our previous research, we comprehensively explored the synthetic methods and structural characterization techniques of common A2B2O7 composite oxides, with Raman spectroscopy being the most effective in identifying the different sub-crystalline phase structures and lattice disorder of these oxides [4]. Furthermore, we found that, for A2B2O7 composite oxides at the edge of the rA/rB ratio, the sub-crystalline phase structure can be transformed into a series of polymorphs via different synthetic methods or calcination at various temperatures [4]. As the calcination temperature increases, the sub-crystalline phase structure of these polymorphs transitions from disordered to ordered [4]. For example, the disordered defect fluorite phase structure of La2Zr2O7 forms an ordered pyrochlore phase, and that of La2Ce2O7 forms an ordered rare earth C-type structure after high-temperature calcination [4]. FTIR and Raman spectroscopy are often complementary methods for structural characterization of compounds. Despite current reports on the FTIR study of certain sub-crystalline phase structures of A2B2O7 composite oxides, comparative studies on all four sub-crystalline phases are lacking. In addition, the surface properties of these composite oxides, such as the relationship between the binding energies of A- and B-site elements and their subcrystalline phase structures, have yet to be systematically explored.
Thus far, A2B2O7 composite oxides have demonstrated excellent reaction performance in several heterogeneous thermal catalytic reactions, such as the catalytic combustion of soot particles and methane, the oxidative coupling of methane, in addition to their use as supports for loading active metals in methane dry gas or steam reforming reactions [3]. In these heterogeneous thermal catalytic reactions, active oxygen species such as surface-adsorbed oxygen or surface lattice oxygen on the catalyst play a crucial role (e.g., in the deep oxidation and selective oxidation of methane and ethane molecules) [8,9]. The electrophilicity and nucleophilicity of surface lattice oxygen can affect the reaction selectivity [8,9]. For example, in the OCM reaction, electrophilic lattice oxygen on the surface of perovskite-type composite oxides favors C2 selectivity, while nucleophilic lattice oxygen promotes the deep oxidation of methane [8,9]. In the dry reforming of methane, the elimination of carbon deposition is closely related to active adsorbed oxygen [10]. Despite studies addressing the impact of sub-crystalline phase structures on reactive oxygen species, researchers have mostly focused on a specific structure or have not covered all aspects in the few sub-crystalline phase structures investigated.
To further investigate the role of FTIR spectroscopy in identifying the sub-crystalline phase structures of A2B2O7 composite oxides, this study explores the relationship between XPS spectroscopy and the structures of such oxides; the electrophilic and nucleophilic properties of surface lattice oxygen; and the relationship between surface-adsorbed oxygen, the sub-crystalline phase structure of the oxides, and lattice disorder. Herein, a series of A2B2O7 composite oxides (A = La, Nd, Sm, Gd, Er, Yb; B = Ti, Sn, Zr, Ce) with different sub-crystalline phase structures were synthesized using the glycine–nitrate combustion method and characterized. Given the exploration of the four sub-crystalline phase structures of A2B2O7 composite oxides in previous work [4], this study doe s not delve into specific discussions in this regard.
2. Materials and Methods
2.1. Sample Preparation
The A-site ion precursors of all samples were their nitrates. Regarding the B-site ions, the precursors of Ti4+, Sn4+, Zr4+, and Ce4+ were Ti(OC4H9)4, SnC2O4, ZrO(NO3)2·2H2O, and Ce(NO3)3·6H2O, respectively. In the synthesis of the Zr- and Ce-based A2B2O7 composite oxides, equimolar amounts of the A- and B-site ion precursors were dissolved in deionized water; glycine was then added, using the same molar amount of total metal ions, and the solution was evaporated in a water bath at 80 °C to form a dry gel. The gel was ignited in a muffle furnace at 300 °C in an air atmosphere to remove the glycine, and the resulting powder was heated up from room temperature to 800 °C at a rate of 10 °C/min and then calcined at 800 °C for 4 h in an air atmosphere. Regarding the Ti-based A2B2O7 compounds and the presence of carbon-containing organics in the precursor, the heat generated by the combustion of glycine was insufficient to burn the organics completely. This necessitated the addition of an oxidizer, NH4NO3, to the combustion system. Since Ti(OC4O9)4 is hydrolyzed in water to produce Ti(OH)4, it was first dissolved in 15% dilute nitric acid, followed by the addition of the A-site ion precursor, glycine, and NH4NO3 to prevent its hydrolysis. The molar ratio of A3+:B4+:glycine: NH4NO3 was 1:1:2.2:6.2. Similarly, a dry gel was formed after evaporating the solution in a water bath at 80 °C, followed by ignition at 300 °C to remove the glycine and carbon-containing organic compounds. The resulting powder was calcined at 800 °C for 4 h. Regarding the Sn-based A2B2O7 composite oxides, SnC2O4 was dissolved in H2O2 (30%) to oxidize Sn2+ to Sn4+ in a water bath at 80 °C. Subsequently, the A-site ion precursor and glycine were added. Since SnC2O4 contains carbon-based organic compounds, an oxidizer (NH4NO3) was also required. The proportions used were the same as those for the Ti-based materials. After forming and igniting the dry gel, the desired sample was obtained via calcination at the same temperature over the same period. Although the precursor of Sn is Sn2+, even if it is not completely oxidized when dissolved in H2O2, calcination at 800 °C in an air atmosphere can ensure the complete oxidation of Sn2+ to Sn4+. Notably, using glycine nitrate to synthesize La2Zr2O7 with a disordered defect fluorite phase structure requires the addition of NH4NO3 when the Zr4+ precursor is ZrO(NO3)2·2H2O. The proportions of the metal ions, glycine, and NH4NO3 were consistent with those used in the synthesis of the Ti- and Sn-based compounds.
2.2. Sample Characterization
The bulk phase of the samples was assessed via X-ray diffraction (XRD) with a (Bruker AXS D8 Focus X-ray diffractometer, Karlsruhe, Germany) operating at 40 kV and 30 mA, utilizing a copper target and Kα X-ray irradiation. Scans were conducted over a 2θ range of 10° to 90° with a step size of 0.01°/s. The elemental composition of all samples was determined using an inductively coupled plasma (ICP) experiment, which was conducted on an (Agilent 700 system, Santa Clara, CA, USA). Each sample underwent complete dissolution using a microwave-assisted acid digestion system (Anton Paar Multiwave PRO, Graz, Austria) along with a mixture of concentrated nitric acid (HNO3) and hydrofluoric acid (HF). Raman spectroscopy was performed using a (Renishaw inVia Reflex spectrometer, Gloucester, UK ) with a 532-nm laser excitation wavelength. In situ Raman spectroscopy was performed on the same instrument equipped with a (Linkam TS 1500, Surrey, UK) in situ cell. FTIR spectroscopy was carried out using a (Nicolet 5700 spectrometer, Thermo Fisher Scientific, Waltham, MA, USA). The KBr pellet samples were prepared by homogeneously mixing the sample with dried KBr powder at a 1:50 mass ratio, followed by compression at 10 MPa using a hydraulic tablet press. XPS was conducted using a (Thermo Fisher Scientific ESCALAB 250Xi system, Waltham, MA, USA) equipped with a monochromatic Al Kα X-ray source (1486.6 eV). The binding energies were calibrated using the C 1s peak at 284.8 eV. A quartz tube (inner diameter = 10 mm, wall thickness = 2 mm, length = 300 mm) was used as a micro fixed bed reactor to pretreat the samples before the XPS O 1s measurements. The specific surface areas of the fresh and spent samples were determined via nitrogen adsorption–desorption isotherm analysis at −196 °C (77 K, the temperature of liquid nitrogen) using a (Micromeritics ST-08B surface area analyzer, Norcross, GA, USA). The Brunauer–Emmett–Teller (BET) method was applied to calculate the BET specific surface area. The DFT calculation method is described in the supporting materials.
3. Results and Discussion
3.1. XRD Analysis
The ICP results for all samples are detailed in Table S1, while the molar ratios of A-site and B-site ions are listed in Table 1, clearly conforming to the stoichiometric ratio of 1:1. The XRD patterns of the samples are shown in Figure 1a–d. Except for the characteristic XRD peaks of La2Ti2O7 and Nd2Ti2O7, which are complex, those of the remaining samples and fluorite-phase CeO2 are very similar. The rA/rB ratios of these samples were calculated, theoretically enabling the determination of the crystal phases they form. The rA/rB ratios of La2Ti2O7 and Nd2Ti2O7 are 1.90 and 1.84, respectively, both exceeding 1.78. Theoretically, they should form a monoclinic layered perovskite crystal phase. In practice, their characteristic XRD peaks closely match those of the standard card. The rA/rB ratios of the compounds from Sm2Ti2O7 to Yb2Ti2O7 range from 1.77 to 1.62 within the pyrochlore range. In addition, for all samples, the 2θ angles at 36.9° and 44.5° correspond to the characteristic pyrochlore crystal faces of (331) and (511) [11], proving that this series of samples belongs to the pyrochlore crystal phase and matches the corresponding standard cards.
In the case of Ln2Sn2O7, La2Sn2O7, Nd2Sn2O7, Sm2Sn2O7, and Gd2Sn2O7, a pyrochlore phase is theoretically formed, while a disordered defect fluorite phase is produced for Er2Sn2O7 and Yb2Sn2O7. Similarly, a pyrochlore phase is theoretically formed for Ln2Zr2O7, La2Zr2O7, Nd2Zr2O7, and Sm2Zr2O7, while a disordered defect fluorite phase is generated for Gd2Zr2O7, Er2Zr2O7, and Yb2Zr2O7. However, no characteristic diffraction peaks belonging to pyrochlore were observed for these samples, and according to our previous studies, XRD cannot distinguish between the disordered pyrochlore and disordered defect fluorite phases. In the Ln2Ce2O7 system, the rA/rB values are very close to the critical values of 1.46 and 1.17 for distinguishing between the fluorite and rare earth C-type crystal phases, making it difficult to determine the specific crystal phases.
Table 1. The physico-chemical properties of the samples.
|
Samples |
rA/rB Ratios |
Crystalline Phases |
Lattice Parameters * |
Specific Surface Areas (m2/g) |
Bulk A/B Molar Ratio ** |
Surface A/B Ratio *** |
|
|---|---|---|---|---|---|---|---|
|
a = b = c (Å) |
α = β = γ (o) |
||||||
|
La2Ti2O7 |
1.90 |
perovskite |
- |
- |
12.7 ± 0.3 |
1.03 ± 0.01 |
1.03 ± 0.01 |
|
Nd2Ti2O7 |
1.84 |
perovskite |
- |
- |
15.3 ± 0.5 |
1.03 ± 0.01 |
1.02 ± 0.01 |
|
Sm2Ti2O7 |
1.77 |
pyrochlore |
10.233 |
90 |
12.3 ± 0.2 |
1.01 ± 0.02 |
1.01 ± 0.01 |
|
Gd2Ti2O7 |
1.72 |
pyrochlore |
10.185 |
90 |
10.6 ± 0.3 |
1.01 ± 0.02 |
1.00 ± 0.02 |
|
Er2Ti2O7 |
1.64 |
pyrochlore |
10.156 |
90 |
14.6 ± 0.2 |
1.00 ± 0.01 |
0.99 ± 0.02 |
|
Yb2Ti2O7 |
1.62 |
pyrochlore |
10.120 |
90 |
13.1 ± 0.5 |
0.99 ± 0.02 |
0.98 ± 0.01 |
|
La2Sn2O7 |
1.68 |
pyrochlore |
10.701 |
90 |
9.3 ± 0.3 |
1.02 ± 0.01 |
1.02 ± 0.01 |
|
Nd2Sn2O7 |
1.62 |
pyrochlore |
10.567 |
90 |
15.4 ± 0.2 |
0.98 ± 0.01 |
1.01 ± 0.01 |
|
Sm2Sn2O7 |
1.56 |
pyrochlore |
10.510 |
90 |
13.9 ± 0.5 |
1.00 ± 0.02 |
1.00 ± 0.02 |
|
Gd2Sn2O7 |
1.52 |
pyrochlore |
10.454 |
90 |
10.2 ± 0.2 |
0.99 ± 0.02 |
0.98 ± 0.02 |
|
Er2Sn2O7 |
1.45 |
pyrochlore |
10.350 |
90 |
10.5 ± 0.3 |
1.01 ± 0.01 |
1.02 ± 0.01 |
|
Yb2Sn2O7 |
1.43 |
pyrochlore |
10.305 |
90 |
11.4 ± 0.5 |
1.00 ± 0.02 |
1.01 ± 0.01 |
|
La2Zr2O7 |
1.61 |
fluorite |
5.407 |
90 |
16.1 ± 0.3 |
1.00 ± 0.01 |
0.99 ± 0.02 |
|
Nd2Zr2O7 |
1.56 |
fluorite |
5.302 |
90 |
20.4 ± 0.2 |
1.03 ± 0.01 |
1.02 ± 0.02 |
|
Sm2Zr2O7 |
1.50 |
fluorite |
5.273 |
90 |
21.7 ± 0.2 |
1.02 ± 0.01 |
1.01 ± 0.01 |
|
Gd2Zr2O7 |
1.46 |
fluorite |
5.270 |
90 |
20.6 ± 0.2 |
0.99 ± 0.02 |
0.99 ± 0.02 |
|
Er2Zr2O7 |
1.39 |
fluorite |
5.191 |
90 |
19.9 ± 0.3 |
0.99 ± 0.01 |
0.98 ± 0.02 |
|
Yb2Zr2O7 |
1.38 |
fluorite |
5.172 |
90 |
13.3 ± 0.3 |
1.01 ± 0.02 |
1.00 ± 0.01 |
|
La2Ce2O7 |
1.33 |
fluorite |
5.661 |
90 |
11.5 ± 0.2 |
0.98 ± 0.01 |
0.99 ± 0.02 |
|
Nd2Ce2O7 |
1.29 |
C-type |
10.980 |
90 |
10.4 ± 0.5 |
1.01 ± 0.02 |
1.02 ± 0.01 |
|
Sm2Ce2O7 |
1.24 |
C-type |
1.0925 |
90 |
9.8 ± 0.5 |
0.99 ± 0.01 |
0.98 ± 0.02 |
|
Gd2Ce2O7 |
1.21 |
C-type |
10.856 |
90 |
9.8 ± 0.5 |
1.00 ± 0.02 |
1.03 ± 0.01 |
|
Er2Ce2O7 |
1.15 |
C-type |
10.824 |
90 |
9.6 ± 0.3 |
0.99 ± 0.01 |
0.99 ± 0.02 |
|
Yb2Ce2O7 |
1.14 |
C-type |
10.765 |
90 |
11.9 ± 0.2 |
1.01 ± 0.02 |
1.01 ± 0.01 |
* Calculated by Scherrer formula; ** Obtained by ICP; *** Obtained by XPS.
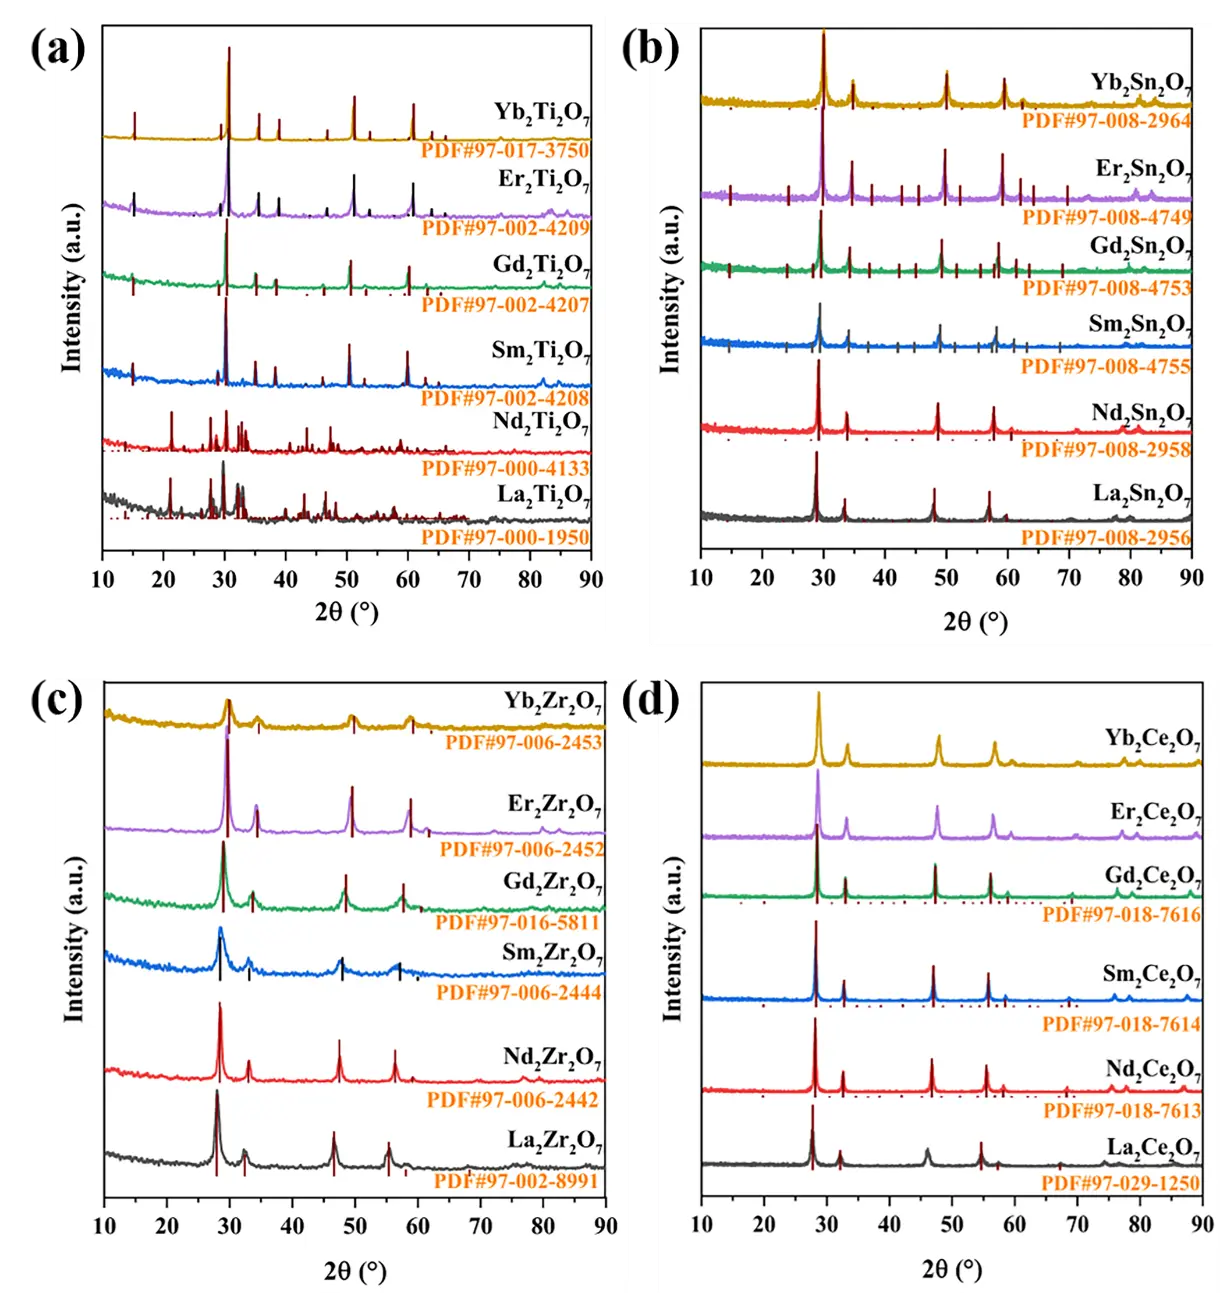
Figure 1. XRD patterns of the samples. (a) Ln2Ti2O7, (b) Ln2Sn2O7, (c) Ln2Zr2O7 and (d) Ln2Ce2O7 (Ln = La, Nd, Sm, Gd, Er, Yb).
3.2. Raman Spectra Analysis
Raman spectroscopy was used in the identification of the specific crystalline phase structures of the samples; this technique is more sensitive to the four sub-crystalline phase structures of A2B2O7 composite oxides, and the results were compared with the standard cards. The Raman spectra of all samples are presented in Figure 2. Notably, the Er-based composite oxides all display broadened and comparable Raman bands. This arises from fluorescence interference induced by ErIII photoluminescence under excitation by 532-nm and 785-nm lasers, which consequently obscures the Raman signals [12]. Therefore, for the identification of the sub-crystal phase structure of Er-based A2B2O7 composite oxides, we primarily rely on XRD and FTIR techniques, and do not assign their Raman bands.
As shown in Figure 2a, due to the low symmetry of the monoclinic layered perovskite structure, the Raman spectrum, like the XRD pattern, exhibits significant complexity. The Raman bands of La2Ti2O7 and Nd2Ti2O7 are quite similar. The bands located in the ranges of 110–460 cm−1 and 500–600 cm−1 are assigned to the vibrations of La–O or Nd–O bonds and the distorted vibrations of TiO6 octahedra, respectively. The bands at 785 and 810 cm−1 are ascribed to Ti–O stretching vibrations [13,14]. According to group theory analysis, theoretically, six Raman-active vibrational modes (i.e., Eg + A1g + 4F2g) can be observed in the pyrochlore crystal phase [4,15]. Eg, and A1g are attributed to the bending vibrations of O–B–O bonds and BO6 octahedra, respectively, while F2g is ascribed to a combination of stretching and bending vibrations of A–O and B–O bonds [4,15]. Notably, variations in the B-site elements give rise to certain differences in the intensity of the peaks and their wave numbers [4]. Furthermore, given the degeneracy or the weakness of some Raman bands, not all six Raman-active modes can be fully observed [4].
As shown in Figure 2a,b, Sm2Ti2O7, Gd2Ti2O7, La2Sn2O7, Nd2Sn2O7, Sm2Sn2O7, and Gd2Sn2O7 exhibit distinct Eg, A1g, and F2g modes, with their specific assignments provided in Table 2 and Table 3 [16,17]. Notably, while Yb2Ti2O7 and Yb2Sn2O7 also display approximate characteristic Raman-active modes of the pyrochlore phase, compared to samples in the same series, Yb2Ti2O7 lacks certain F2g peaks, while Yb2Sn2O7 not only lacks some F2g peaks but also exhibits broadened peak shapes. This indicates that these two compounds belong to the disordered pyrochlore phase. As shown in Figure 2c, all Ln2Zr2O7 samples demonstrate a disordered defect fluorite crystalline phase; the Raman bands at 610–650 cm−1 are assigned to the F2g mode of the disordered defect fluorite phase, with the range being close to that of the F2g mode for cubic ZrO2 in the fluorite phase [18]. The wave numbers from 330 to 350 cm−1 are attributed to the pyrochlore microdomain [18]. Raman bands below 200 cm−1 are considered external modes of vibration [18]. Notably, as the radius of the A-site ions decreases, lattice contraction causes the F2g mode of the sample to shift towards lower wave numbers.
As shown in Figure 2d, all samples display rather similar Raman bands. Except for La2Ce2O7, the other samples, excluding Er2Ce2O7, exhibit characteristic peaks of the rare earth C-type structure at 360–380 cm−1 [7]. This strongly demonstrates that La2Ce2O7 exhibits a disordered defect fluorite phase, while the remaining samples all possess rare earth C-type phase structures. The wave number range of 445–455 cm−1 is attributed to the F2g mode of the disordered defect fluorite structure [4]. The Raman bands at 575–585 cm−1 are characteristic of oxygen vacancies [4]. For Ce-based doped metal oxides, the oxygen vacancy concentration can be calculated using the ratio of peak areas $${\mathrm{A}}_{{\mathrm{V}}_{\mathrm{O}}/}{\mathrm{A}}_{{\mathrm{F}}_{2\mathrm{g}}}$$. Due to the fluorescence interference generated by Er(III) photoluminescence in Er2Ce2O7, the relevant Raman bands cannot be clearly identified, thus preventing the determination of the oxygen vacancy concentration, which is not provided here. The oxygen vacancies in Er2Ce2O7 are indirectly reflected through the concentration of Ce3+ in the Ce 3d spectra or the ratio of Oads/Olat in the O 1s spectra. As shown in Table 4. As the ionic radius of the A-site elements decreases, the oxygen vacancy concentration decreases accordingly. The remaining peaks below 300 cm−1 can be attributed to lattice disorder arising from the substitution of high-valence Ce4+ in CeO2 with low-valence rare earth oxygen ions [4]. Similarly, one can also observe a shift towards lower wave numbers due to lattice contraction.
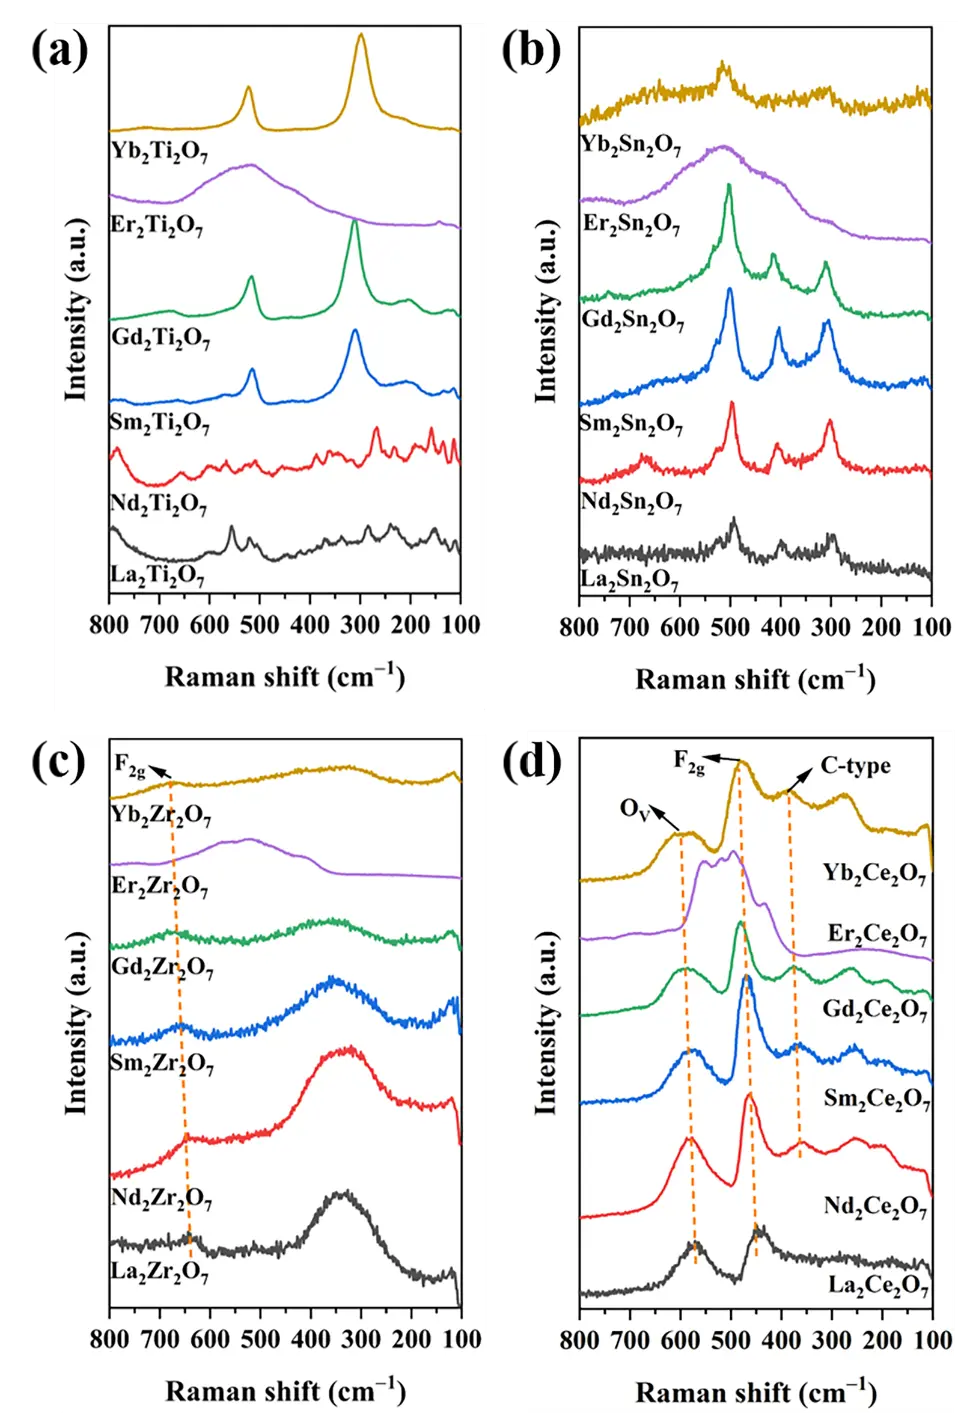
Figure 2. Raman spectra of the samples. (a) Ln2Ti2O7, (b) Ln2Sn2O7, (c) Ln2Zr2O7 and (d) Ln2Ce2O7 (Ln = La, Nd, Sm, Gd, Er, Yb).
Table 3. Frequencies (cm−1) of the Raman active modes for Ln2Sn2O7 pyrochlores [17].
|
Assigned Mode |
La2Sn2O7 Frequencies (cm−1) |
Nd2Sn2O7 Frequencies (cm−1) |
Sm2Sn2O7 Frequencies (cm−1) |
Gd2Sn2O7 Frequencies (cm−1) |
Yb2Sn2O Frequencies (cm−1) |
|
|---|---|---|---|---|---|---|
|
Eg |
296 |
300 |
306 |
308 |
310 |
|
|
A1g |
495 |
497 |
500 |
505 |
512 |
|
|
F2g |
332 |
337 |
339 |
342 |
353 |
|
|
F2g |
399 |
402 |
410 |
415 |
- |
|
|
F2g |
522 |
525 |
530 |
533 |
- |
|
|
F2g |
- |
677 |
708 |
714 |
- |
Table 4. The $${\mathrm{A}}_{{\mathrm{V}}_{\mathrm{O}}/}{\mathrm{A}}_{{\mathrm{F}}_{2\mathrm{g}}}$$ ratio and Ce3+ content of the Ln2Ce2O7 samples.
|
Samples |
$${\mathbf{A}}_{{\mathbf{V}}_{\mathbf{O}}/}{\mathbf{A}}_{{\mathbf{F}}_{2\mathbf{g}}}$$ Ratio |
Ce3+ Content (%) |
|---|---|---|
|
La2Ce2O7 |
0.76 |
30.2 |
|
Nd2Ce2O7 |
0.62 |
28.6 |
|
Sm2Ce2O7 |
0.56 |
26.4 |
|
Gd2Ce2O7 |
0.43 |
24.6 |
|
Er2Ce2O7 |
- |
22.5 |
|
Yb2Ce2O7 |
0.30 |
19.8 |
It is noteworthy that, theoretically, Er2Sn2O7 and Yb2Sn2O7 have a disordered defect fluorite structure, while the rA/rB ratio of Gd2Zr2O7 falls at the boundary between the fluorite and pyrochlore phases. Raman spectroscopy identifies their actual crystal phases as pyrochlore, disordered pyrochlore, and disordered defect fluorite structure. This indicates that empirical rules can only roughly predict the sub-crystal phase structures they may form, and the specific structure still requires experimental verification. Similarly, it also demonstrates that Raman spectroscopy is the most accurate method for identifying the sub-crystal phase structure of A2B2O7 composite oxides.
3.3. FTIR Spectra Analysis
The FTIR spectra of all samples are shown in Figure 3a–d. The peaks located at 3300, 1400–1600, and 400–600 cm−1 are attributed to the vibrations of surface hydroxyl groups, carbonates, and metal–oxygen bonds, respectively [19]. As shown in Figure 3a,b, similar to the Raman spectra, the FTIR spectra of the low-symmetry monoclinic layered perovskites La2Ti2O7 and Nd2Ti2O7 are complex, with the specific FTIR band assignments presented in Table 5. For the pyrochlore phase, two distinct stretching vibration peaks of metal–oxygen bonds can be observed. The peak in the higher wave number range of 550–650 cm−1 is attributed to the stretching vibration of B–O bonds, while the peak in the lower range of 450–480 cm−1 corresponds to Ln–O stretching [20,21,22]. For the disordered defect fluorite and rare earth C-type crystalline phases, only one type of metal–oxygen stretching vibration can be observed [23,24]. This is due to the random distribution of A- and B-site ions at the positive ion sites in the lattice and the disordered distribution of oxygen ions and oxygen vacancies at the negative ion sites in these phases [4]. It can be regarded as the average stretching vibration of the Ln/B–O metal–oxygen bonds. The peak values are also influenced by the type of B-site ions. As displayed in Figure 3c,d. For example, the stretching vibrations of the Ln/B–O bonds in the Zr- and Ce-based composite oxides occur at ~510 and ~465 cm−1, respectively.
Based on the FTIR characterization results, one can further identify the Er-based composite oxides, whose Raman spectra are influenced by photoluminescence. Er2Ti2O7 and Er2Sn2O7 exhibit two types of metal–oxygen stretching vibrations, indicating their pyrochlore crystal phase structure. In contrast, Er2Zr2O7 and Er2Ce2O7 only show one such vibration type. Considering both the FTIR and Raman results, these can be further identified as possessing disordered defect fluorite and rare earth C-type structures, respectively. The above results indicate that FTIR spectroscopy can distinguish between the monoclinic layered perovskite, pyrochlore, and disordered defect fluorite structures; however, it cannot distinguish between the disordered defect fluorite and rare earth C-type structures, nor can it determine whether the pyrochlore structure is ordered or disordered.
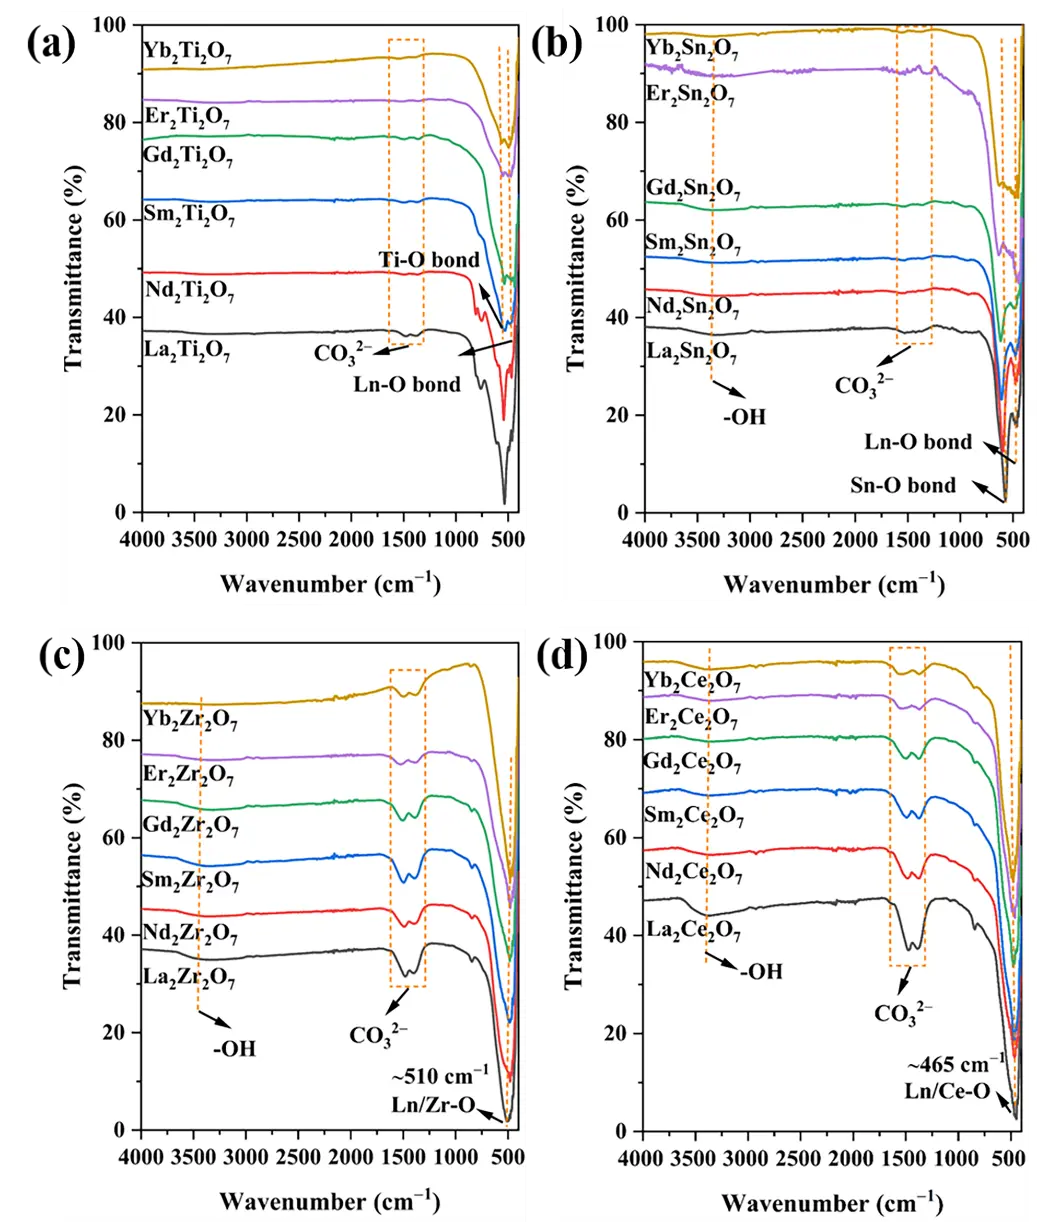
Figure 3. FTIR spectra of the samples. (a) Ln2Ti2O7, (b) Ln2Sn2O7, (c) Ln2Zr2O7 and (d) Ln2Ce2O7 (Ln = La, Nd, Sm, Gd, Er, Yb).
Table 5. FTIR band assignments for La2Ti2O7 and Nd2Ti2O7 [25].
|
La2Ti2O7 Frequencies (cm−1) |
Band Assignment |
Nd2Ti2O7 Frequencies (cm−1) |
Band Assignment |
|---|---|---|---|
|
805 |
Eu–LO of TiO2 |
808 |
Eu–LO of TiO2 |
|
611 |
La–O |
615 |
Nd–O |
|
531 |
Ti–O in TiO6 |
539 |
Ti–O in TiO6 |
|
489 |
Eu–LO of TiO2 |
495 |
Eu–LO of TiO2 |
|
456 |
Ti–O–La |
462 |
Ti–O–Nd |
|
437 |
La–O |
443 |
Nd–O |
Considering the Raman and FTIR results, the samples were further compared with standard XRD cards, with all except for Er2Ce2O7 and Yb2Ce2O7 showing a good correspondence. The lattice parameters, calculated based on the XRD peaks, show good consistency with the sub-crystalline phase structures. For La2Ti2O7, its lattice parameters are a = 13.011 Å, b = 5.550 Å, c = 7.798 Å; α = β = 90°, γ = 98.6°. For Nd2Ti2O7, its lattice parameters are a = 13.003 Å, b = 5.464 Å, c = 7.675 Å; α = β = 90°, γ = 98.5°. The other sub-crystalline structures are all cubic crystalline phases, and their lattice parameters are shown in Table 1. In addition, the specific surface areas of the samples were measured, ranging from 9.6 to 21.7 m2/g.
3.4. XPS Spectra Analysis
XPS spectra were utilized to investigate the surface properties of the samples; the XPS spectra of the samples with different A-site ions are presented in Figure 4a–f. As the radius of the B-site ions increases sequentially from Ti to Sn, Zr, and Ce, the binding energies of the 3d or 4d orbitals of the respective A-site cations shift towards lower values. This is due to the transformation of the sub-crystalline phase structure of the A2B2O7 composite oxides from monoclinic layered perovskite to the ordered or disordered pyrochlore, disordered defect fluorite, and rare earth C-type structures. Additionally, the coordination number of the A-site ions changes from 8 in the monoclinic layered perovskite and pyrochlore phases to an average value of 7 in the disordered defect fluorite phase and 6 in the rare earth C-type phase[4,26]. The transition from a high to a low coordination number leads to a shift in the binding energy towards lower values.
As shown in Figure 4a, the binding energies at 835.5–836.1 eV and 832.9–853.1 eV can be attributed to La 3d5/2 and La 3d3/2, respectively; these values also indicate that the valence state of La is +3 [19]. Furthermore, in the case of La2Ti2O7 and La2Sn2O7, only one spin-orbit splitting of La 3d5/2 and La 3d3/2 can be observed, whereas two are observed for La2Zr2O7 and La2Ce2O7, indicating the presence of two La species on the surface of these compounds. According to the literature [19], the difference in the spin-orbit splitting of the La 3d5/2 level can be used to determine the surface La species. For La2Ti2O7 and La2Sn2O7, the difference is 4.5 eV, indicating that the surface La species is La2O3 [19]. La2Zr2O7 and La2Ce2O7 yield differences of 4.5 and 3.5 eV, respectively, indicating La2O3 and La2(CO3)3 as the respective surface La species [19]. This may be due to the strong alkalinity of La2Zr2O7 and La2Ce2O7, which leads to a tendency toward carbonate formation on their surfaces.
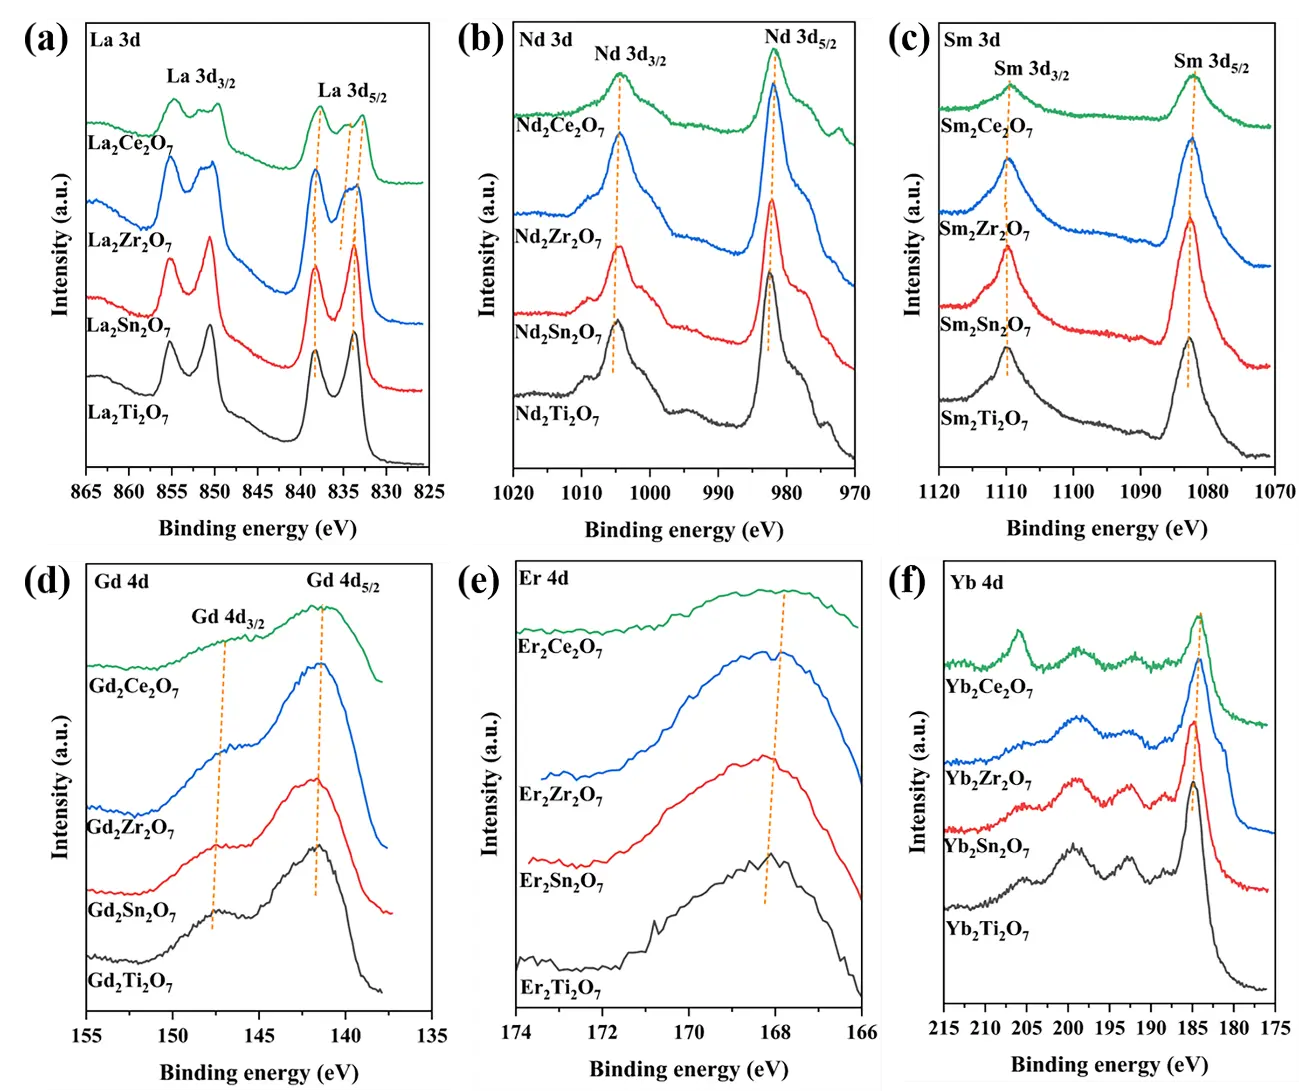
Figure 4. XPS spectra of A site cations for the samples. (a) La 3d, (b) Nd 3d, (c) Sm 3d, (d) Gd 4d, (e) Er 4d and (f) Yb 4d.
As displayed in Figure 4b, the binding energies at 981.7–982.5 eV and 1004.4–1005.0 eV are attributed to Nd 3d5/2 and Nd 3d3/2, respectively; the other accompanying peaks are their satellite peaks [27]. The valence state of Nd is confirmed as +3, based on binding energy values [27]. As shown in Figure 4c, the lower binding energy at 1082.1–1082.8 eV and the higher one at 1109.1–1109.8 eV is attributed to Sm 3d5/2 and Sm 3d3/2, respectively [28]; the valence state of Sm is +3 [28]. The peaks in Figure 4d at 141.2–141.7 eV and 146.9–147.2 eV are attributed to Gd 4d5/2 and Gd 4d3/2, respectively [29], with the binding energy values highlighting a valence state of +3 for Gd [29]. As shown in Figure 4e, the Er 4d spectrum is relatively broadened, encompassing both Er 4d5/2 and Er 4d3/2. The lower binding energy of Er 4d5/2 is located at ∽168.5 eV, while the higher binding energy of Er 4d3/2 occurs at ∽178.4 eV [30]; Er exhibits a valency of +3 [30]. As depicted in Figure 4f, the peaks at ∽180.0 and ∽188.3 eV are attributed to Yb 4d5/2 and Yb 4d3/2, respectively [31]. The presence of other peaks at ∽183.7, ∽187.1, ∽191.1, ∽197.9, and ∽204.4 eV confirms that Yb3+ is the predominant valence state [31].
The XPS spectra of the B-site ions in these A2B2O7 composite oxides are shown in Figure 5. Interestingly, as the radius of the A-site ions decreases from La to Yb, the binding energies of the respective B-site cations shift towards higher values. This is also due to the decreasing A-site ionic radius, with the sub-crystalline phase structure changing from monoclinic layered perovskite to the ordered or disordered pyrochlore, disordered defect fluorite, and rare earth C-type structures. The lattice disorder transitions from ordered to disordered and then to ordered. Further, the coordination number of the B-site ions transitions from 6 in the monoclinic layered perovskite and pyrochlore crystal phases to an average value of 7 in the disordered defect fluorite phase and 8 in the rare earth C-type structure [4,26]. The increase in the coordination number leads to an increase in the binding energy.
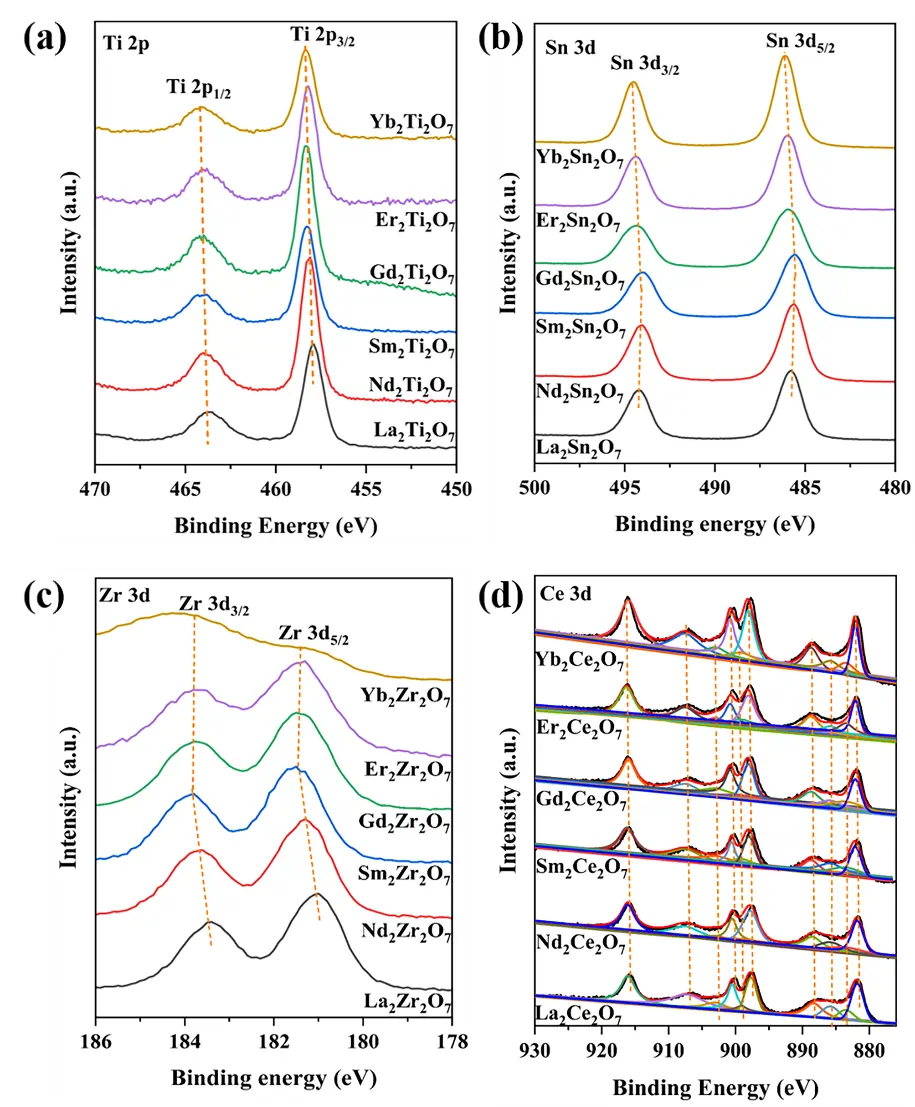
Figure 5. XPS spectra of B site cations for the samples. (a) Ti 2p, (b) Sn 3d, (c) Zr 3d, (d) Ce 3d.
As shown in Figure 5a–c, the peaks at the lower binding energies of 457.9–458.4 eV, 485.8–486.1 eV, and 181.0–181.4 eV are attributed to Ti 2p3/2, Sn 3d5/2, and Zr 3d5/2, respectively [32,33,34]. Meanwhile, the peaks at the higher binding energies of 463.8–464.2 eV, 494.2–494.5 eV, and 183.5–183.8 eV are attributed to Ti 2p1/2, Sn 3d3/2, and Zr 3d3/2, respectively [32,33,34]. These values confirm that their valence states are all +4 [32,33,34,35]. As shown in Figure 5d, based on the literature [35], deconvolution was performed on the Ce 3d spectrum of these samples, dividing it into 10 peaks and calculating the Ce3+ content from the peak areas. This content is positively correlated with the concentration of oxygen vacancies [35], as presented in Table 4. The oxygen vacancy concentration, calculated from the Raman results, follows the same trend as the Ce3+ content; that is, as the ionic radius decreases from La to Yb, both the oxygen vacancy concentration and the Ce3+ content decrease. As listed in Table 1, the surface A/B element molar ratios of all samples are very close to their stoichiometric ratio of 1.00/1.00.
A pretreatment step was performed to investigate the active oxygen species of the samples. First, the sample was first exposed to a 10% O2-Ar mixture and heated from room temperature to 800 °C at a rate of 10 °C/min. It was then calcined for 30 min under the same atmosphere (10%O2-Ar mixture) and temperature (800 °C) to remove surface impurities. They were then cooled to room temperature in the same atmosphere (10%O2-Ar mixture). After purging the surface with high-purity Ar for 15 min at room temperature to remove physically adsorbed O2, the XPS O1s spectra of the samples were quickly measured. This pretreatment effectively eliminated interference from adsorbed water and hydroxyl groups on the sample surface. As shown in Figure 6a–d, the binding energy of surface lattice oxygen is located at ∽529.5 eV, while the higher binding energy of ∽531.2 eV corresponds to surface-adsorbed active oxygen species [36]. Interestingly, as the Ln cation changes from La to Yb, the binding energies of both surface lattice oxygen and adsorbed oxygen shift towards higher values in all samples. That is, progressing from La to Yb, the electrons of the surface lattice oxygen are transferred to the metal elements, marking a change in the properties of the surface lattice oxygen from nucleophilic to electrophilic.
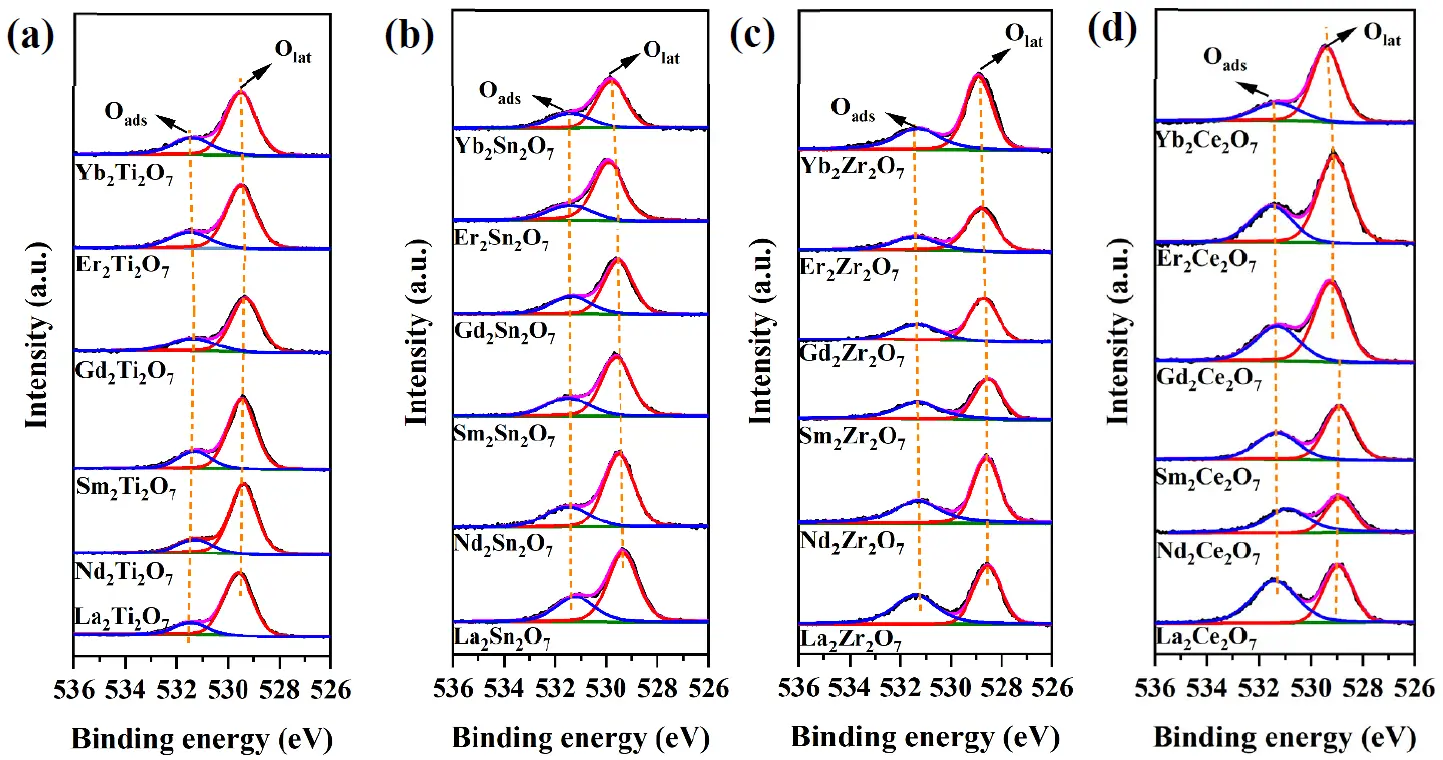
Figure 6. The pretreated XPS O 1s spectra of the samples. (a) Ln2Ti2O7, (b) Ln2Sn2O7, (c) Ln2Zr2O7 and (d) Ln2Ce2O7 (Ln = La, Nd, Sm, Gd, Er, Yb).
The above change can be explained considering the electronegativity of the elements in the samples, as presented in Table S2. As the A-site element transitions from La to Yb, the electronegativity values gradually increase. When the B-site ions are the same, the sum of the electronegativity of the two elements also increases, and their difference in electronegativity with respect to oxygen decreases. When they form metal–oxygen bonds, electrons gradually shift towards the metal element, indicating the tendency for oxygen to lose electrons. Consequently, the binding energies of surface lattice oxygen shift towards higher values.
Similarly, the deviation in the binding energy of elements at the A or B sites can be explained using elemental electronegativity. When the B-site elements are identical, as the A-site elements transition from La to Yb, their electronegativity gradually increases, leading to an electron shift from oxygen to the metal in the metal–oxygen bond. The tendency for oxygen to lose electrons increases, and that for metal elements to gain electrons also increases accordingly. This results in a shift in the binding energies of the B-site elements towards lower values. However, electronegativity cannot explain the change in the binding energy when the A-site element is the same but the B-site element is different. As mentioned earlier, when the A-site element is the same, the binding energy of this element shifts towards higher values from Ti to Sn, Zr, and Ce. The electronegativity values for the B-site elements follow the sequence Sn > Ti > Zr > Ce. When the A-site elements are the same, theoretically, the shift towards a higher binding energy for the A-site elements should follow the order of Ln2Sn2O7, Ln2Ti2O7, Ln2Zr2O7, and Ln2Ce2O7. This indicates that the influence of the positive-ion coordination environment on the sub-crystalline phase structure of A2B2O7 composite oxides on the binding energy is stronger than the effect of elemental electronegativity.
Based on the XPS O1s results, the Oads/Olat ratios were calculated to evaluate the relationship between the amount of active oxygen species and the sub-crystalline phase structure, as shown in Figure 7. In the case of Ln2Ti2O7, as the radius of the A-site ions decreases, the Oads/Olat ratio first increases, then decreases, and finally increases again. This is because the sub-crystalline phase structure of Ln2Ti2O7 transitions from a monoclinic layered perovskite to an ordered and disordered pyrochlore in moving from La to Yb. Given that the monoclinic layered perovskite structure does not possess intrinsic oxygen vacancies, it exhibits the least surface-adsorbed oxygen. As the ionic radius decreases, it tends to transition towards the pyrochlore crystal phase with intrinsic oxygen vacancies. Therefore, the content of surface-adsorbed oxygen in Nd2Ti2O7 is richer than that in La2Ti2O7, though not as rich as that in the pyrochlore phase. For the elements from Sm to Er, the sub-crystalline phase structures and lattice disorder remain unchanged; thus, the concentration of oxygen vacancies is influenced by the A-site ionic radius. Studies have shown that the A-O and B-O bonds in pyrochlore compounds exhibit ionic and covalent properties, respectively [37]. The larger the A-site ionic radius, the easier it is for the B–O bond to break, resulting in the generation of oxygen vacancies and, thus, an increased content of adsorbed oxygen [38]. The Oads/Olat ratio of Yb2Ti2O7 tends to increase due to its disordered pyrochlore crystal phase. The greater the lattice disorder, the higher the oxygen mobility.
Similarly, considering the elements from La to Yb, the sub-crystalline phase structure of Ln2Sn2O7 transitions from an ordered to a disordered pyrochlore. In addition, the Oads/Olat ratio decreases first and then increases since all compounds from La2Sn2O7 to Er2Sn2O7 exist as ordered pyrochlore crystalline phases. Furthermore, the concentration of oxygen vacancies and the content of adsorbed oxygen are influenced by the A-site ionic radius. Yb2Sn2O7 exhibits a disordered pyrochlore crystal phase when there is a change in the lattice disorder; the disorder degree is an important factor affecting the concentration of oxygen vacancies and the content of adsorbed oxygen.
However, in the case of Ln2Zr2O7 and Ln2Ce2O7, as the radius of the A-site ions increases, their Oads/Olat ratio gradually decreases. Concerning Ln2Zr2O7, this occurs since the ionic radius of the A-site ions varies from La to Yb, yet its sub-crystalline phase structure and lattice disorder remain unchanged. Therefore, the ionic radius is the sole factor affecting its oxygen vacancy concentration and chemisorbed oxygen content. For Ln2Ce2O7, as the A-site ions vary from La to Yb, the sub-crystalline phase structure and disorder degree transition from the disordered defect fluorite structure of La2Ce2O7 to the ordered rare earth C-type structure. The oxygen vacancy concentration and adsorbed oxygen content decrease. However, moving from Nd2Ce2O7 to Yb2Ce2O7, the sub-crystalline phase structure and lattice disorder degree remain unchanged. Therefore, the radius of the A-site ions is the sole factor affecting their oxygen vacancy concentration and adsorbed oxygen content.
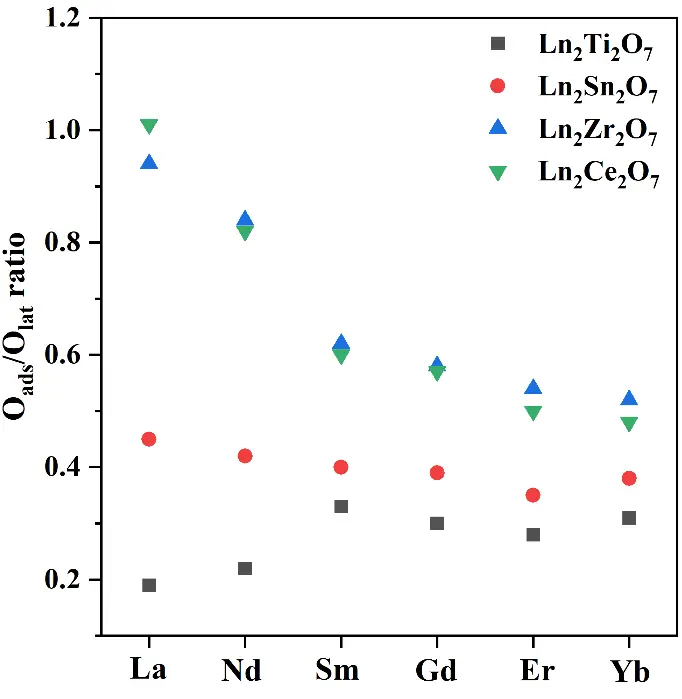
Figure 7. The relationship between Oads/Olat ratio and the sub-crystal phase structure of A2B2O7 composite oxides.
Keeping the A-site cations the same and varying the B-site cations, the Oads/Olat ratio first increases and then decreases with an increasing B-site cationic radius. This is because the sub-phase structure of Ln2Ti2O7 (Ln = La or Nd) is a monoclinic layered perovskite, which does not possess intrinsic oxygen vacancies, and when Ln = Sm to Yb, the sub-phase structure is an ordered pyrochlore. All Ln2Sn2O7 samples exhibit an ordered or disordered pyrochlore structure. However, all Ln2Zr2O7 samples display a disordered defect fluorite structure, with the highest degree of lattice disorder. Therefore, theoretically, this series of samples has the largest Oads/Olat ratio. While both La2Zr2O7 and La2Ce2O7 possess a disordered defect fluorite structure, their surfaces exhibit oxygen storage Ce3+/Ce4+ redox cycling, thus resulting in the richest content of oxygen vacancies and active oxygen on their surfaces. In addition, as the A-site ionic radius further decreases, the Oads/Olat ratio of the disordered defect fluorite phase remains generally higher than that of the ordered rare earth C-type and pyrochlore compounds.
Notably, keeping the B-site cations the same leads to a relatively small change in the Oads/Olat ratio, which changes due to the decrease in the A-site cationic radius. This is because the lanthanide contraction-induced change in the radius of the A-site cations is relatively small. Therefore, the span of changes resulting from the sub-crystalline phases and lattice disorder is very small. However, when keeping the A-site cations the same and increasing the radius of the B-site cations, the change in the Oads/Olat ratio is relatively large. This is because the change in the B-site cationic radius is relatively large, and the structural change in the sub-crystalline phase of the A2B2O7 composite oxides is relatively significant. Therefore, changes in the sub-crystalline phase structure have a greater impact on the concentration of oxygen vacancies and the content of adsorbed oxygen.
3.5. Identification of Adsorbed Oxygen Species and Oxygen Vacancies
In situ Raman spectroscopy was utilized to identify the types of surface-adsorbed oxygen species on the samples. Five composite oxides with different sub-crystalline structures, namely, La2Ti2O7, Sm2Ti2O7, Yb2Sn2O7, La2Zr2O7, and Yb2Ce2O7, were selected as representative samples; these possess monoclinic layered perovskite, ordered pyrochlore, disordered pyrochlore, disordered defect fluorite, and rare earth C-type crystal structures, respectively. All samples were calcined in a high-purity Ar atmosphere at 800 °C for 30 min in an in situ Raman cell to remove surface impurities. They were then cooled to room temperature in the same atmosphere. Thereafter, the atmosphere was switched to a 10% O2-Ar gas mixture, and the corresponding Raman spectra were collected at room temperature and 150, 300, 450, 600, and 750 °C, each temperature was maintained for 15 min.
As shown in Figure 8a–e, all samples maintain their Raman-active modes of the sub-crystalline phase structures at different temperatures, and no crystal phase changes can be observed. This indicates that the sub-crystalline phase structure of these representative samples is stable from room temperature to 750 °C. In addition, except for La2Ti2O7, at different temperatures, all the other samples exhibit Raman characteristic peaks attributed to the O2− species at 1050–1190 cm−1 [39]. This reveals that the adsorbed oxygen species on the sample surface is O2−, which can stably exist here at high temperatures. The absence of O2− observed in La2Ti2O7 may be attributed to the absence of intrinsic oxygen vacancies in this sub-crystalline phase structure, resulting in a weak ability to activate gaseous oxygen to generate O2−.
The EPR results of the five representative samples are shown in Figure 8f. g = 2.003 represents the characteristic signal of oxygen vacancy-bound single electrons, and its intensity is positively correlated with the oxygen vacancy concentration [40]. The intensities follow the order of La2Zr2O7 > Yb2Ce2O7 > Yb2Sn2O7 > Sm2Ti2O7 > La2Ti2O7, that is, disordered defect fluorite > rare earth C-type > disordered pyrochlore > ordered pyrochlore > monoclinic layered perovskite. This result aligns well with the XPS O1s results, indicating that the larger the concentration of oxygen vacancies, the greater the abundance of adsorbed oxygen.
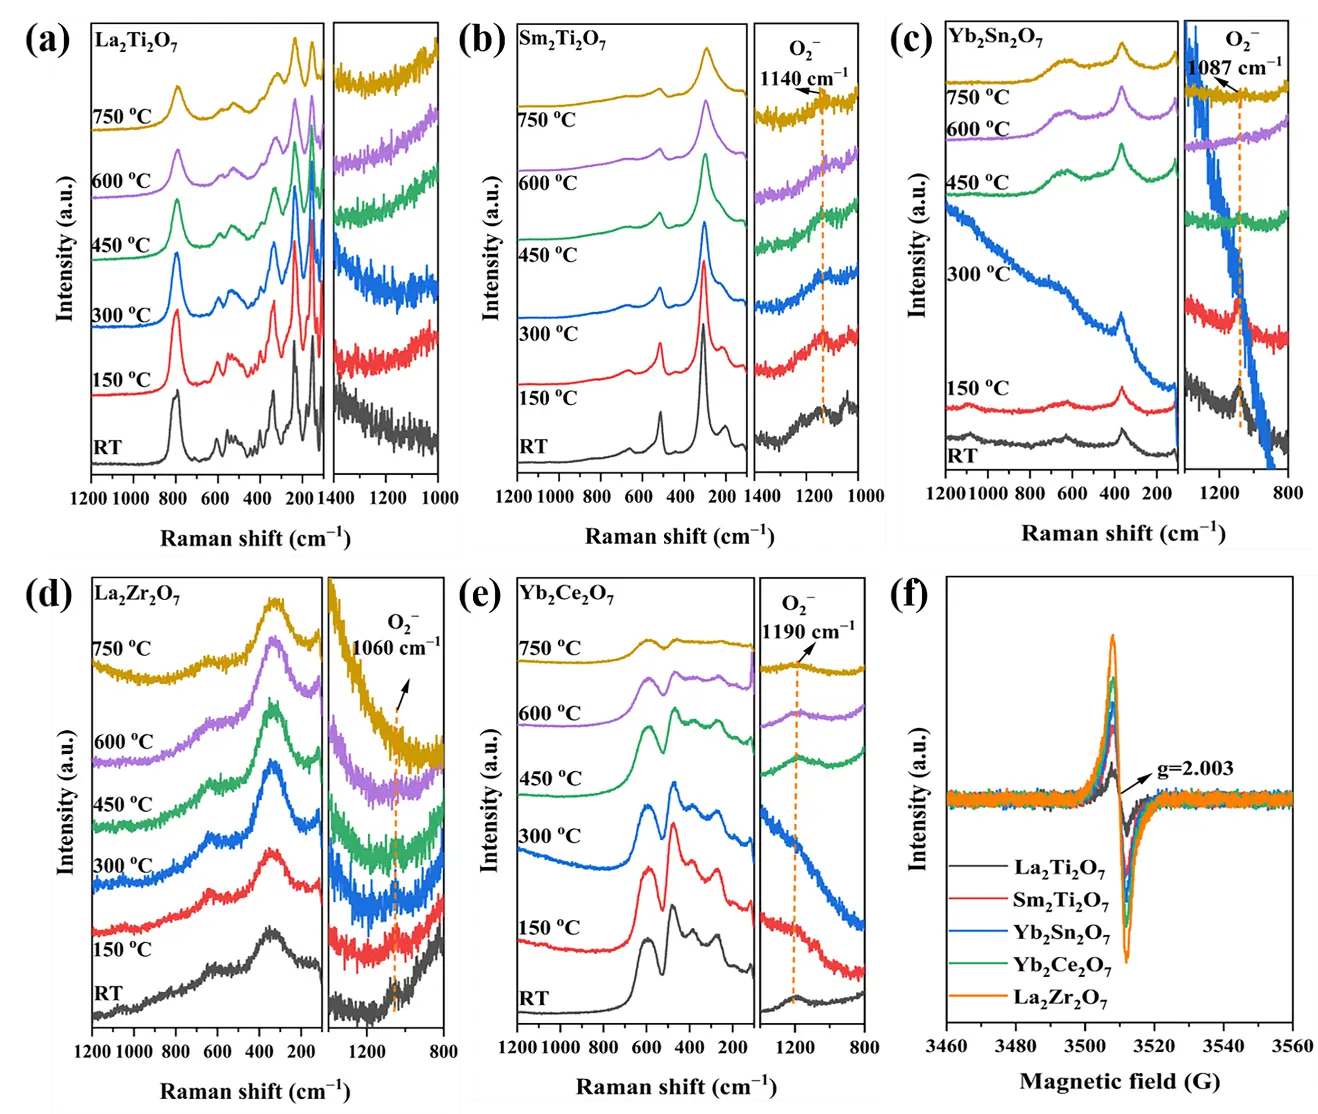
Figure 8. In situ Raman spectra of the typical samples. (a) La2Ti2O7, (b) Sm2Ti2O7, (c) Yb2Sn2O7, (d) La2Zr2O7, (e) Yb2Ce2O7 and (f) EPR spectra of the typical samples.
3.6. DFT Calculations
The crystal faces corresponding to the strongest XRD diffraction peaks of the five representative compounds were selected for DFT calculations to determine their oxygen vacancy formation energies. The calculated structures and corresponding oxygen vacancy formation energies of the samples are shown in Figure 9a–e. Obviously, the order of their oxygen vacancy formation energies is La2Ti2O7 > Sm2Ti2O7 > Yb2Sn2O7 > Yb2Ce2O7 > La2Zr2O7, which is opposite to their ability to form oxygen vacancies. Therefore, the ability of these sub-crystalline phase structures to form oxygen vacancies, from strongest to weakest, is as follows: disordered defect fluorite, rare earth C-type, disordered pyrochlore, ordered pyrochlore, and monoclinic layered perovskite crystal phase structures. This is consistent with their oxygen vacancy concentrations, as indicated by the EPR results, theoretically proving the strength of the oxygen vacancy formation ability of the A2B2O7 composite oxide sub-crystalline phase structures.
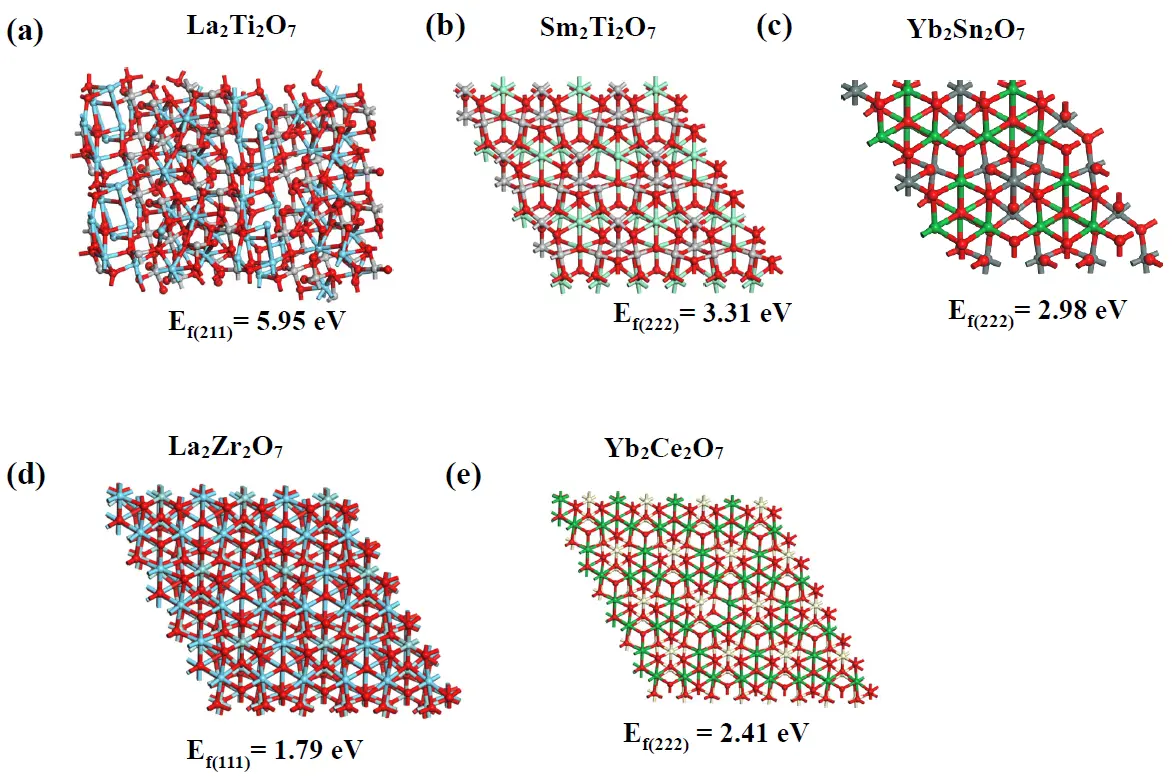
Figure 9. Calculated structures and corresponding oxygen vacancy formation energies of the typical samples. (a) La2Ti2O7 (211), (b) Sm2Ti2O7 (222), (c) Yb2Sn2O7 (222), (d) La2Zr2O7 (111), and (e) Yb2Ce2O7 (222). Blue and green represent A-site atoms, white and gray represent B-site atoms, and red represents oxygen atoms.
4. Conclusions
In this study, a series of samples containing all the sub-crystalline phase structures of A2B2O7 (A = La, Nd, Sm, Gd, Er, Yb; B = Ti, Sn, Zr, Ce) composite oxides was synthesised using the glycine–nitrate combustion method. The study explored the role of FTIR spectroscopy in identifying their sub-crystalline phase structures, the influence of the phase structures on XPS spectra, the factors affecting the nucleophilicity and electrophilicity of surface lattice oxygen species, the impact of the phase structures on surface-adsorbed oxygen, and the identification of surface-adsorbed oxygen species. The following conclusions were drawn:
-
FTIR spectroscopy is effective in identifying the monoclinic layered perovskite, pyrochlore, and disordered defect fluorite sub-crystalline phase structures. However, it cannot distinguish between the pyrochlore and disordered pyrochlore structures, or between the disordered defect fluorite and rare earth C-type phases. Within the range of 400–4000 cm−1, monoclinic layered perovskite crystals exhibit low symmetry and complex peak shapes for metal–oxygen bonds. The pyrochlore crystalline phases often show infrared absorption peaks of both A–O and B–O metal–oxygen bonds; on the other hand, in the case of the disordered defect fluorite and rare earth C-type structures, only one type of infrared absorption peak for A/B–O metal–oxygen bonds can be observed. This is due to the random and disordered distribution of A- and B-site ions at the positive ion sites in these two crystalline phase structures.
-
In the case of identical A-site cations and increasing B-site cationic radii, the binding energy of the A-site elements shifts towards a lower value. Conversely, for identical B-site cations and decreasing A-site cationic radii, the binding energy of the B-site elements shifts towards a higher value. This can be explained as follows. When the A-site cations are fixed, and the radius of the B-site cations gradually increases, or when the B-site cations are fixed, and the radius of the A-site cations gradually decreases, the sub-crystalline structures transition from monoclinic layered perovskite to ordered or disordered pyrochlore, disordered defect fluorite, and rare earth C-type structures. The coordination number of the A-site ions gradually decreases, while that of the B-site ions gradually increases.
-
Fixing the B-site cations and varying the A-site cations from La to Yb leads to a shift towards a higher binding energy in the lattice oxygen, indicating the transition from a nucleophilic to an electrophilic character of the surface lattice oxygen. This is attributed to the gradual increase in the electronegativity of the A-site elements from La to Yb, which induces an electron shift from the metal–oxygen bond towards the A-site metal and, thus, results in a higher binding energy for surface lattice oxygen.
-
In the case of an unchanged sub-crystalline phase structure and lattice disorder, the larger the ionic radius of the A-site cations, the richer the surface-adsorbed oxygen. When the sub-crystalline phase structure and lattice disorder change, the surface-adsorbed oxygen content roughly follows the order of disordered defect fluorite > rare earth C-type > disordered pyrochlore > ordered pyrochlore > monoclinic layered perovskite. This order is directly related to the intrinsic oxygen vacancy concentration of the different sub-crystalline phase structures. In addition, the surface-adsorbed oxygen species of the A2B2O7 composite oxides at high temperatures are O2−.
This study offers a theoretical foundation for designing and preparing A2B2O7-type composite oxide materials for heterogeneous thermal catalysts in the presence of gaseous oxygen.
Supplementary Materials
The following supporting information can be found at: https://www.sciepublish.com/article/pii/855, Table S1: ICP results of the samples; Table S2: Electronegativity of elements at A-site and B-site.
Acknowledgments
This research project is supported by the National Natural Science Foundation of China and the Natural Science Foundation of Jiangxi Province which is gratefully acknowledged.
Author Contributions
S.Z.: Investigation, Validation, Visualization, Writing—Original Draft, and Writing—Review & Editing; J.X.: Supervision, Project Administration, and Writing—Review & Editing; X.Y.: Investigation; Y.F.: Investigation; L.M.: Investigation; X.W.: Funding Acquisition, Project Administration and Writing—Review & Editing.
Ethics Statement
Not applicable.
Informed Consent Statement
Not applicable.
Data Availability Statement
Data will be made available on request.
Funding
This research was supported by the National Natural Science Foundation of China (22462011, 22376090), the Natural Science Foundation of Jiangxi Province (20252BAC240720, 20224BAB213017), the Key Laboratory of Jiangxi Province for Environment and Energy Catalysis (20242BCC32041).
Declaration of Competing Interest
The authors declare that they have no known competing financial interests or personal relationships that could have appeared to influence the work reported in this paper.
References
- Wang ZJ, Zhou GH, Jiang DY, Wang SW. Recent development of A2B2O7 system transparent ceramics. J. Adv. Ceram. 2018, 7, 289–306. DOI:10.1007/s40145-018-0287-z [Google Scholar]
- Peng ZJ, Wang YH, Wang SQ, Yao JT, Zhao QY, Xie EY, et al. Improvement strategy on thermophysical properties of A2B2O7-type rare earth zirconates for thermal barrier coatings applications: A review. Int. J. Miner. Metall. Mater. 2024, 31, 1147–1165. DOI:10.1007/s12613-024-2853-4 [Google Scholar]
- Xu JW, Xi R, Xu XL, Zhang Y, Feng XH, Fang XZ, et al. A2B2O7 pyrochlore compounds: A category of potential materials for clean energy and environment protection catalysis. J. Rare Earths 2020, 38, 840–849. DOI:10.1016/j.jre.2020.01.002 [Google Scholar]
- Zhang SJ, Xu JW, Lu CX, Ouyang RM, Ma JM, Zhong XS, et al. Preparation method investigation and structure identification by XRD and Raman techniques for A2B2O7 composite oxides. J. Am. Ceram. Soc. 2024, 107, 3475–3496. DOI:10.1111/jace.19645 [Google Scholar]
- Solomon S, George A, Thomas JK, John A. Preparation, Characterization, and Ionic Transport Properties of Nanoscale Ln2Zr2O7 (Ln = Ce, Pr, Nd, Sm, Gd, Dy, Er, and Yb) Energy Materials. J. Electron. Mater. 2015, 44, 28–37. DOI:10.1007/s11664-014-3473-y [Google Scholar]
- Shamblin J, Tracy CL, Ewing RC, Zhang FX, Li WX, Trautmann C, et al. Structural response of titanate pyrochlores to swift heavy ion irradiation. Acta Mater. 2016, 117, 207–215. DOI:10.1016/j.actamat.2016.07.017 [Google Scholar]
- Yamamura H, Nishino H, Kakinuma K, Nomura K. Crystal phase and electrical conductivity in the pyrochlore-type composition systems, Ln2Ce2O7 (Ln = La, Nd, Sm, Eu, Gd, Y and Yb). J. Ceram. Soc. Jpn. 2003, 111, 902–906. DOI:10.2109/jcersj.111.902 [Google Scholar]
- Kim I, Lee G, Bin Na H, Ha JM, Jung JC. Selective oxygen species for the oxidative coupling of methane. Mol. Catal. 2017, 435, 13–23. DOI:10.1016/j.mcat.2017.03.012 [Google Scholar]
- Sim Y, Kwon D, An S, Ha JM, Oh TS, Jung JC. Catalytic behavior of ABO3 perovskites in the oxidative coupling of methane. Mol. Catal. 2020, 489, 110925. DOI:10.1016/j.mcat.2020.110925 [Google Scholar]
- Jagadeesh P, Varun Y, Himajaa Reddy B, Sreedhar I, Singh SA. A short review on recent advancements of dry reforming of methane (DRM) over pyrochlores. Mater. Today 2023, 72, 361–369. DOI:10.1016/j.matpr.2022.08.107 [Google Scholar]
- Wang CJ, Wang Y, Zhang AH, Cheng YL, Chi F, Yu Z. The influence of ionic radii on the grain growth and sintering-resistance of Ln2Ce2O7 (Ln = La, Nd, Sm, Gd). J. Mater. Sci. 2013, 48, 8133–8139. DOI:10.1007/s10853-013-7625-x [Google Scholar]
- Cu JQ, Cui L, He HQ, Yan SH, Hu YS, Wu H. Raman spectra of RE2O3 (RE = Eu, Gd, Dy, Ho, Er, Tm, Yb, Lu, Sc and Y): laser-excited luminescence and trace impurity analysis. J. Rare Earths 2014, 32, 1–4. DOI:10.1016/S1002-0721(14)60025-9 [Google Scholar]
- Park JY, Park SJ, Kwak M, Yang HK. Rapid visualization of latent fingerprints with Eu-doped La2Ti2O7. J. Lumin. 2018, 201, 275–283. DOI:10.1016/j.jlumin.2018.04.012 [Google Scholar]
- Asadov AG, Mammadov AI, Kozlenko DP, Mehdiyeva RZ, Kichanov SE, Lukin EV, et al. The effects of high pressure on the crystal structure and vibration spectra of layered perovskite-like Nd2Ti2O7. Solid State Ion. 2024, 406, 116447. DOI:10.1016/j.ssi.2023.116447 [Google Scholar]
- Wang S, Li W, Wang S, Chen Z. Synthesis of nanostructured La2Zr2O7 by a non-alkoxide sol–gel method: From gel to crystalline powders. J. Eur. Ceram. Soc. 2015, 35, 105–112. DOI:10.1016/j.jeurceramsoc.2014.08.032 [Google Scholar]
- Gupta HC, Brown S, Rani N, Gohel VB. Lattice dynamic investigation of the zone center wavenumbers of the cubic A2Ti2O7 pyrochlores. J. Raman Spectrosc. 2001, 32, 41–44. DOI:10.1002/1097-4555(200101)32:1<41::AID-JRS664>3.0.CO;2-R [Google Scholar]
- Akbudak S, Kushwaha AK. Vibrational and elastic properties of Ln2Sn2O7 (Ln = La, Sm, Gd, Dy, Ho, Er, Yb, or Lu). J. Phys. Chem. Solids 2018, 115, 1–5. DOI:10.1016/j.jpcs.2017.11.030 [Google Scholar]
- Vijayan D, John A, Thomas JK, Solomon S. Development, characterization, and properties of LnSmZr2O7 (Ln = Dy, Ho, Yb) defect fluorite functional ceramics. Mater. Chem. Phys. 2023, 307, 128085. DOI:10.1016/j.matchemphys.2023.128085 [Google Scholar]
- Lopes LB, Vieira LH, Assaf JM, Assaf EM. Effect of Mg substitution on LaTi1−xMgxO3+δ catalysts for improving the C2 selectivity of the oxidative coupling of methane. Catal. Sci. Technol. 2021, 11, 283–296. DOI:10.1039/D0CY01783C [Google Scholar]
- Chen ZS, Gong WP, Chen TF, Li SL. Synthesis and characterization of pyrochlore-type yttrium titanate nanoparticles by modified sol-gel method. Bull. Mater. Sci. 2011, 34, 429–434. DOI:10.1007/s12034-011-0116-2 [Google Scholar]
- Trujillano R, Martín JA, Rives V. Hydrothermal synthesis of Sm2Sn2O7 pyrochlore accelerated by microwave irradiation. A comparison with the solid state synthesis method. Ceram. Int. 2016, 42, 15950–15954. DOI:10.1016/j.ceramint.2016.07.090 [Google Scholar]
- Guidorzi MV, Borges FH, da Costa AC, Fu L, Ferreira RAS, Gonçalves RR. Stabilization of pyrochlore phase of nanostructured Eu3+-doped Y2Sn2O7: A potential material for imaging via time-resolved luminescence analysis. J. Alloys Compd. 2025, 1010, 178285. DOI:10.1016/j.jallcom.2024.178285 [Google Scholar]
- Rejith RS, Thomas JK, Solomon S. Structural, optical and impedance spectroscopic characterizations of RE2Zr2O7 (RE = La, Y) ceramics. Solid State Ion. 2018, 323, 112–122. DOI:10.1016/j.ssi.2018.05.025 [Google Scholar]
- Jeyanthi CE, Siddheswaran R, Kumar P, Shankar VS, Rajarajan K. Structural and spectroscopic studies of rare earths doped ceria (RELa,Sc,Yb:CeO2) nanopowders. Ceram. Int. 2014, 40, 8599–8605. DOI:10.1016/j.ceramint.2014.01.076 [Google Scholar]
- Swami R, Bokolia R, Sreenivas K. Effects of sintering temperature on structural, electrical and ferroelectric properties of La2Ti2O7 ceramics. Ceram. Int. 2020, 46, 26790–26799. DOI:10.1016/j.ceramint.2020.07.154 [Google Scholar]
- Xu J, Xi R, Gong Y, Xu X, Liu Y, Zhong X, et al. Constructing Y2B2O7 (B = Ti, Sn, Zr, Ce) Compounds to Disclose the Effect of Surface Acidity–Basicity on Product Selectivity for Oxidative Coupling of Methane (OCM). Inorg. Chem. 2022, 61, 11419–11431. DOI:10.1021/acs.inorgchem.2c01754 [Google Scholar]
- Ling W, Liao P, Zhu J, Wu J, Hu C, Zhang X, et al. MOF-derived bundle-like Nd2O3/Fe@C nanocomposite for efficient microwave absorption. J. Alloys Compd. 2025, 1039, 183214. DOI:10.1016/j.jallcom.2025.183214 [Google Scholar]
- Mahalakshmi G, Ponnarasi P, Rajeswari M. A eco-friendly, low cost green synthesis of Ag@Sm2O3/rGO nanocomposites with enhanced UV light photocatalytic and antimicrobial activity. Inorg. Chem. Commun. 2024, 161, 111811. DOI:10.1016/j.inoche.2023.111811 [Google Scholar]
- Bin J, Gee H, Park T, Go U, Kim JH, Lee Y-S. Composites of equiatomic Y, La, Ce, Nd, and Gd rare earth oxides: Chemical-shift effects and valence spectra. Curr. Appl. Phys. 2024, 59, 85–94. DOI:10.1016/j.cap.2023.12.016 [Google Scholar]
- Na Y, Hao W, Zhao X, Xie Y, Zhang Y. Magnetic properties and cryogenic magnetocaloric effects in RE2Zr2O7 (RE = Gd, Dy, Ho and Er) ceramics. Ceram. Int. 2025, 51, 31140–31149. DOI:10.1016/j.ceramint.2025.04.302 [Google Scholar]
- Kahraman A, Gurer U, Yilmaz E. The effect and nature of the radiation induced oxide-interface traps on the performance of the Yb2O3 MOS device. Radiat. Phys. Chem. 2020, 177, 109135. DOI:10.1016/j.radphyschem.2020.109135 [Google Scholar]
- Escamilla R, López Aranda JA, Cervantes JM, Muñoz H, León-Flores J, Antonio JE, et al. Molten salts synthesis and Raman, XPS, and UV–vis spectroscopy study of Zn-doped Y2Ti2O7−δ pyrochlore. Ceram. Int. 2024, 50, 15944–15951. DOI:10.1016/j.ceramint.2024.02.074 [Google Scholar]
- Jiang N, Feng Y, Liu Z, Yu M, Qian G, Zhang J, et al. Effect of La2Sn2O7 content on the anti-arc erosion capability of Ag-Ni-La2Sn2O7 composites. Mater. Res. Bull. 2024, 178, 112893. DOI:10.1016/j.materresbull.2024.112893 [Google Scholar]
- Su Y, Wang J, Han A, Chen C, Ye M. Novel composite materials with high near-infrared reflectance properties to retard the thermal aging of polyethylene: Pr3+ and Er3+ doped La2Zr2O7 compounds. J. Solid State Chem. 2023, 328, 124331. DOI:10.1016/j.jssc.2023.124331 [Google Scholar]
- Hu Z, Liu XF, Meng DM, Guo Y, Guo YL, Lu GZ. Effect of Ceria Crystal Plane on the Physicochemical and Catalytic Properties of Pd/Ceria for CO and Propane Oxidation. ACS Catal. 2016, 6, 2265–2279. DOI:10.1021/acscatal.5b02617 [Google Scholar]
- Wang Y, Li L, Xu F, Li S, Shi Y, Cai N. Enhancing diesel steam reforming activity by oxygen vacancy on La2Ce2O7 pyrochlore carrier. Fuel 2024, 373, 132296. DOI:10.1016/j.fuel.2024.132296 [Google Scholar]
- Ajayraj A, Baburao UV, Amala J, Kuppusamy RR, Suranani S, Anantharaman AP. Exploring the ionic conductivity of A2Ti2O7 (A = Y and Gd) pyrochlore: Experimental and DFT approach. Solid State Commun. 2025, 397, 115795. DOI:10.1016/j.ssc.2024.115795 [Google Scholar]
- Wang Z, Zhu H, Ai L, Liu X, Lv M, Wang L, et al. Catalytic combustion of soot particulates over rare-earth substituted Ln2Sn2O7 pyrochlores (Ln = La, Nd and Sm). J. Colloid Interface Sci. 2016, 478, 209–216. DOI:10.1016/j.jcis.2016.06.010 [Google Scholar]
- Wan HL, Zhou XP, Weng WZ, Long RQ, Chao ZS, Zhang WD, et al. Catalytic performance, structure, surface properties and active oxygen species of the fluoride-containing rare earth (alkaline earth)-based catalysts for the oxidative coupling of methane and oxidative dehydrogenation of light alkanes. Catal. Today 1999, 51, 161–175. DOI:10.1016/S0920-5861(99)00019-X [Google Scholar]
- Zhao Z, Guo Q, Li J-G, Sakka Y, Lu B. Novel magneto-optical transparent Dy2Sn2O7 ceramics with pyrochlore structure for advanced optical ammeter technology. J. Mater. Sci. Technol. 2026, 249, 1–11. DOI:10.1016/j.jmst.2025.05.059 [Google Scholar]