Optimizing SI Engine Performance and Emissions with Gasoline-Ethanol and Gasoline-Methanol Blends

Optimizing SI Engine Performance and Emissions with Gasoline-Ethanol and Gasoline-Methanol Blends
Firi Ziyad
1,*
 Sultan Aman
2
Habtamu Alemayehu
3
Adamu Hailu
4
Sultan Aman
2
Habtamu Alemayehu
3
Adamu Hailu
4
Received: 12 December 2025 Revised: 04 January 2026 Accepted: 30 January 2026 Published: 25 February 2026

© 2026 The authors. This is an open access article under the Creative Commons Attribution 4.0 International License (https://creativecommons.org/licenses/by/4.0/).
1. Introduction
Growing industrialization, the expansion of the transportation and agricultural sectors, and other factors are driving up the world’s energy demand [1]. The primary energy source for industry, transportation, agriculture, and other applications is fossil fuels. Transportation is one of the sectors that uses the most energy worldwide, according to reports. However, concerns about the depletion of reserves are raised by the rising use of gasoline. Concerns about the environment have also increased due to rising exhaust emissions from the use of gasoline [2]. These fuels negatively impact both human health and the environment. For example, acid rain, ozone layer thinning, and climate change can all be caused by the expansion of automobile exhaust emissions. Researchers have been working for a long time to increase the usage of fuels other than gasoline, which have more reserves. Gaseous fuels such as LPG and CNG, as well as alcohols like methanol, ethanol, and bioethanol, are used as alternative fuels in modern spark ignition engines [3]. Because they can be made from waste materials and sustainable, renewable biomass sources, methanol, ethanol, and bioethanol are highly regarded alternative fuels. Furthermore, it may be claimed that these compounds have a significant potential for usage in IC engines due to the inexpensive cost of raw materials and the physical similarities between these alcohols and gasoline and diesel. Alcohol molecules can burn more effectively and emit fewer emissions because they contain oxygen and have a high octane number (108) [4]. Alcohol vaporization has a high latent heat [5]. As a result, the intake manifold’s alcohol-air charge mixes are colder than the gasoline-air blends [6]. Similar to gasoline and diesel, alcohol-air blends lower NOx emissions from combustion by introducing them into the cylinder at lower temperatures than in a spark-ignition engine [7].
Methanol is one of the most often used alcohol fuel substitutes. Furthermore, several authorities and organizations assert that methanol and other alcohol fuels will eventually displace gasoline as the world’s main fuel [8]. Methanol is a simple bending hydrocarbon that comprises oxygen and hydrogen as part of its chemical makeup. It can be readily obtained from biomass sources such as wood waste, agricultural biomass, lignite, coal, and natural gas [9]. Tons of methanol have been used as fuel and fuel blends in the energy applications sector in recent years, and this quantity is increasing annually [10]. It has the lowest boiling temperature, which allows for better fuel evaporation in cold engine operation, and the highest hydrogen/carbon ratio, which guarantees the fuel’s lowest carbon density [11]. Even though it is difficult to start the engine when it is cold, the high evaporation temperature of methanol improves the engine’s volumetric efficiency [12]. The chemistry of combustion is also affected by the high evaporation temperature of methanol. The fermentation process can be used to produce ethanol from agricultural products, including sugarcane and potatoes, which are considered biomass [13]. Because it can be made from biomass, it is considered a clean, sustainable, and renewable fuel [14,15]. Its chemical structure is composed of the hydroxyl and ethyl groups that are joined to the carbon atom [16,17]. Improved in-cylinder combustion and reduced CO-HC emissions can result from higher oxygen concentrations [18]. It is being used at low rates as a fuel additive to gasoline to improve exhaust emissions [19].
Worldwide research has been done on the use of gasoline, methanol, ethanol blends, and other fuels in SI engines. According to Balat & Balat [20], the engine’s thermal efficiency is greatly increased by the gasoline-methanol mixture. When methanol was given to gasoline at 30%, 50%, and 70% by volume, Sapre [21] observed similar results. Shayan et al. [22] claim that engine performance (brake torque, brake power, thermal efficiency, and volumetric efficiency) much improves when additional methanol is added (containing 5–7.5–10–12.5, and 15% methanol). However, ÖRS et al. [23] found that burning 100% methanol in a spark-ignition engine resulted in a 5% decrease in output. Iodice et al. [19] looked into how performance characteristics were affected by leaded and unleaded methanol-gasoline mixes. They asserted that utilizing M5 gasoline allowed for the achievement of the maximum brake mean effective pressure (BMEP) and that adding methanol enhanced performance. Because it increases the octane number, methanol can be utilized in engines with high compression ratios, according to Abu-Zaid et al. [24]. Balki et al. [25] have compared the effects of alcohol mixtures. They asserted that engine torque, brake-specific fuel consumption, and thermal efficiency all raises when alcohol is added. The effects of ethanol-gasoline mixtures on a four-cylinder spark-ignition engine’s performance under varied loads and engine speeds (1000–4000 rpm) were examined by Topgül et al. [26]. The trials’ findings showed that ethanol use reduced the specific fuel and equivalent air-fuel ratio while increasing volumetric efficiency, thermal efficiency, braking torque, and power. Kamil & Nazzal [27] examine the performance characteristics of three distinct gasoline-alcohol mixes (88% gasoline–12% methanol, 88% gasoline–12% ethanol, and 88% gasoline–6% methanol–6% ethanol) in a single-cylinder spark-ignition engine running under varied engine operating circumstances. They asserted that BTE and BSFC increased, and exhaust gas temperature decreased when fuel blends were compared with gasoline. The effects of ethanol-gasoline mixtures at volumetric ratios of 0%, 5%, and 85% on performance were examined by Koç et al. [28]. When the performance results were analyzed, the engine’s power, torque, and fuel consumption all increased. In their studies employing small amounts of ethanol-gasoline combinations, Costa & Sodré [29] and Thakur et al. [30] came to similar conclusions. In the BTE driven by natural gas/methanol, the addition of methanol causes and encourages development, according to Z. Chen et al. [31]. Most researchers who examined exhaust emissions from methanol- and ethanol-gasoline combinations found that NOx emissions did not show a clear trend, whereas CO and HC emissions improved [32,33].
Methanol addition to gasoline dramatically reduced CO2 and NOx emissions while increasing CO and HC emissions, according to Shayan et al. [21]. Dorney et al. [34] looked into how ethanol-gasoline blends affected emissions at different engine speeds and throttle openings. Ethanol and gasoline were combined in the experiment in the following volumes: 0%, 5%, 10%, 20%, and 30%. The addition of ethanol decreased HC and CO emissions, according to an analysis of the test data. For HC and CO emissions, Topgül et al., 2006 [26] and Iodice et al., 2016 [19] came to similar conclusions. The use of ethanol-methanol-gasoline blends in a SI engine significantly reduced CO and HC (hydrocarbons) emissions when compared to regular gasoline, according to Elfasakhany [3], who also noted that among all test fuels, methanol-gasoline blends had the lowest CO and HC emissions. ÖRS et al. [23] reported significant reductions in NOx and carbon monoxide (CO) emissions but a slight increase in hydrocarbon (HC) emissions. Methanol (M85) at a high addition improved CO and NOx emissions by 23% and 80%, respectively, according to Kamil & Nazzal [27]. Balki et al. [26] claim that utilizing alcoholic gasoline lowers emissions of NOx, CO, and HC. Z. Chen et al. [32] claim that when methanol and natural gas are used as fuel, the addition of methanol decreases overall HC emissions while increasing NOx emissions. According to the literature mentioned above, there hasn’t been sufficient research on optimizing experiments using the Taguchi technique through statistical design for gasoline-ethanol and gasoline-methanol blends with the lowest CO and UHC emissions.
Fossil fuels are still the most widely used energy source for transportation, but their use significantly worsens the environment and raises greenhouse gas emissions. Recent researchers have examined the possibilities of alternative fuels, such as ethanol and methanol blends, to mitigate these issues. For instance, research has shown that adding some alcohols to gasoline can enhance engine performance and reduce some emissions. However, many recent studies focus on single performance metrics or qualitative assessments, ignoring the comprehensive optimization of engine settings. Surprisingly, there aren’t many systematic studies that evaluate the combined effects of engine load and fuel blend blends on emissions and performance using advanced statistical techniques like the Taguchi method. To fill these gaps and lay the groundwork for future research on sustainable fuel alternatives, this paper provides a comprehensive analysis of SI engine performance and emissions using gasoline-ethanol and gasoline-methanol blends.
In addition to evaluating the interaction effects of engine load and fuel blends, this study provides a comprehensive analysis of brake-specific fuel consumption (BSFC), brake thermal efficiency (BTE), and emissions (CO, HC, NOx) using Taguchi’s L16 orthogonal array. This innovative method provides crucial data to achieve optimal engine performance and reduce harmful emissions.
2. Materials and Methods
A series of experiments was carried out using gasoline, and various ethanol/methanol blends. The test blends were prepared just before the experiment began to ensure the fuel mixture was homogeneous. The engine was started and allowed to warm up for a period of 20–30 mts. Before running the engine with a new fuel blend, it was allowed to run for sufficient time to consume the remaining fuel from the previous experiment. All the blends were tested under constant speed. The required engine load was obtained through the dynamometer control. Fuel consumption and load were measured, while brake power, brake torque, brake specific fuel consumption (BSFC), and brake thermal efficiency (BTE) were computed. For each experiment, three runs were performed to obtain an average value of the experimental data. The engine speed kept content during the experiment
2.1. The Experiment Engine and Test Fuels
In the experimental setup, a variety of gasoline-ethanol and gasoline-methanol blends were used to evaluate the emissions and performance of a spark ignition (SI) engine. Previous studies have demonstrated that blends of 0%, 5%, 10%, and 15% can effectively improve combustion efficiency while reducing emissions; thus, these values were selected. For instance, Elfasakhany et al. [3] investigate the effects of ethanol-methanol-gasoline combinations in a spark-ignition engine. It highlights how combinations of 10% and 15% ethanol and methanol can significantly improve engine performance and reduce emissions when compared to pure gasoline. ÖRS et al. [23] found in their comparison that adding 10% methanol to gasoline reduced CO, HC, and NOx emissions while increasing brake-specific fuel consumption (BSFC). They concluded that these quantities could be suitable for methanol mixtures. Yanju W. et al. [34] looked at the performance of methanol blends in spark-ignition engines and found that blends with 10% to 15% methanol provided the best results in terms of brake thermal efficiency (BTE) and emissions reduction. A study by Thakur et al. [31] on the performance of ethanol blends indicated that a 10% ethanol blend significantly improves engine efficiency while reducing emissions, supporting the use of this blend ratio. Iliev S. [35] This study examined several alcohol blends with gasoline and found that mixes of 5% to 15% ethanol and methanol improved combustion efficiency and reduced harmful emissions, making them suitable for use in spark-ignition engines. These studies provide a solid foundation for understanding the optimal blend ratios of methanol and ethanol to enhance engine performance and reduce emissions.
2.2. Test Fuels Preparation and Measurement Protocol
Gasoline, gasoline-ethanol, and gasoline-methanol were employed as experimental materials in this investigation. Methanol and ethanol with a 99.9% purity were extracted (Atomic Educational Material Supply Company, Addis Ababa, Ethiopia). Ethiopia’s National Oil Company supplied pure gasoline. Before being employed for engine testing, the mixture was mixed for 15 min at room temperature and then allowed to settle for a further 15 min, as earlier researchers [16] had previously mentioned. The test fuels’ physical and chemical characteristics are displayed in Table 1.
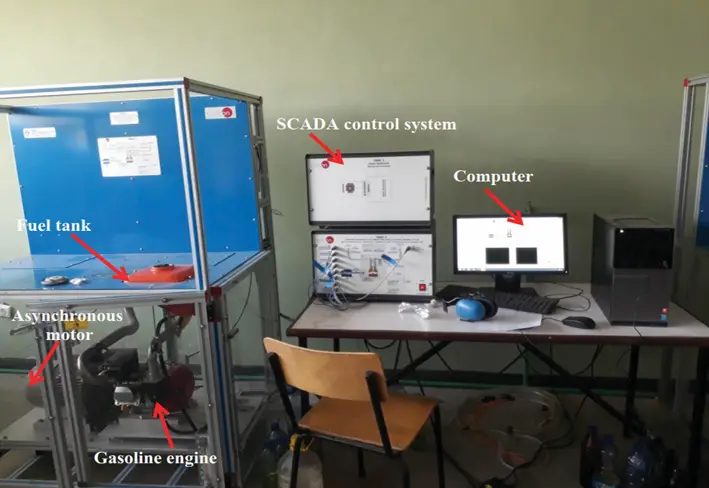
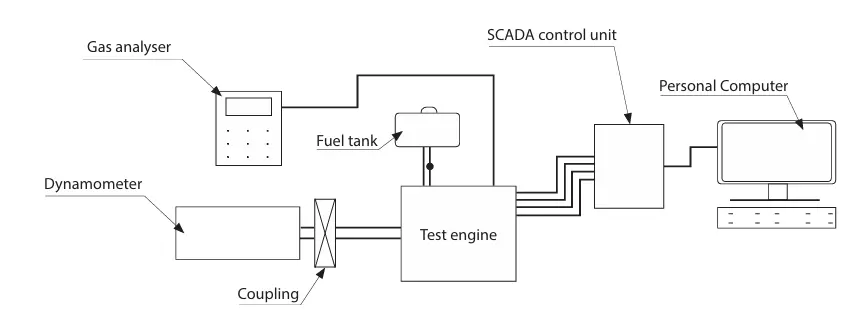
The engine test was conducted at the mechanical engineering department of Addis Ababa Science and Technology University. The TBM3 computer-controlled test bench can produce up to 2.2 kW of power and 7.7 Nm of torque, and the single-cylinder engine is equipped with an engine dynamometer. SCADA software controls and monitors this dynamometer; Figure 1 shows how the system sets and obtains the input and output parameters. To prevent errors on the interface, the proper procedure had to be followed. Figure 2 displays a schematic depiction of the test system, and Table 2 provides a comprehensive specification of the test engine. An MRU DELTA 1600L exhaust gas analyzer (manufactured by MRU Messgeräte für Rauchgase und Umweltschutz GmbH. Based in Neckarsulm-Obereisesheim, Germany) was used to quantify the exhaust emissions of nitrogen oxide (NOx), hydrocarbons (HC), and carbon monoxide (CO). Each test began with the engine running on pure gasoline for 15 min at room temperature, without any load, until it reached operating temperature. For baseline data, the SI engine is first tested using gasoline fuel. An alcohol gasoline blend was then used in place of the pure gasoline. Until it stabilized, the engine ran on blended gasoline fuel. Following that, all pertinent information was recorded, including emissions and engine performance. To remove any remaining alcohol-gasoline combinations, each test engine was conducted again using only pure gasoline, especially in the fuel line system. To make sure the engine performance tests and exhaust gas characteristics were accurate, the experiment was conducted three times. To maintain a desired equivalency ratio, automated systems dynamically modify the flow of fuel and air depending on exhaust gas analyzer sensor data.
Table 1. Physical and chemical properties of the test fuels.
|
Property |
Gasoline |
Ethanol |
Methanol |
|---|---|---|---|
|
Density (g/cm3 at 20 °C) |
0.72–0.76 |
0.790 |
0.792 |
|
Lower heating value (kJ/kg) |
44,300 |
26,900 |
20,100 |
|
Stoichiometric air/fuel ratio |
14.6 |
9.0 |
6.47 |
|
The heating value of the stoichiometric |
|||
|
Mixture (kJ/kg-mixture) |
3034.25 |
2998.89 |
3111.45 |
|
Oxygen (wt%) |
– |
34.73 |
49.94 |
|
RON/MON |
95/85 |
108.6/89.7 |
108.7/88.6 |
|
Heat of vaporization (kJ/kg) |
349 |
923 |
117 |
|
Auto-ignition temperature (°C) |
228–470 |
363 |
455 |
|
Stoichiometric flame speed (m/s) |
0.34 |
0.41 |
0.43 |
|
Adiabatic flame temperature (°C) |
2002 |
1920 |
1870 |
Table 2. Technical specifications of the test engine.
|
Engine Type |
Single-Cylinder, Two-Stroke, 196 cc, Air-Cooled |
|---|---|
|
Cylinder bore |
54 mm |
|
Cylinder diameter |
68 mm |
|
Compression ratio |
8.5:1 |
|
Maximum power |
4.8 kW at 3600 rpm |
|
Maximum torque |
12.4 Nm at 2500 rpm |
|
Specific fuel consumption |
310 g/kW·h |
2.3. The Effects of Ethanol and Methanol’s Distinct Properties on Engine Operation
Compared to gasoline, ethanol can tolerate greater compression before igniting because it has a higher octane rating. In some circumstances, this characteristic may result in a prolonged ignition delay. Additionally, it has a higher heat of vaporization, which helps the intake air mixture cool down. Because it takes longer for the fuel to evaporate and completely combine with the air, this may cause the ignition timing to be delayed. A shorter ignition delay may result from methanol’s lower ignition temperature than ethanol. This characteristic increases methanol’s reactivity and can enhance cold start efficiency. It has a high oxygen content, which improves combustion efficiency. In some circumstances, this can aid in reaching ignition more quickly.
Flame speed is the rate at which a flame spreads through a flammable combination. It has a big impact on engine performance and combustion. The flame speed of ethanol is moderate when compared to gasoline. This implies that although it burns effectively, the combustion rate may be slower than with some other fuels. Particularly under heavy loads, this characteristic may affect the engine’s efficiency and power output. In addition to reducing knocking and improving stability during operation, the moderate flame speed may facilitate smoother combustion.
Compared to ethanol and gasoline, methanol has a faster flame speed. Faster combustion can increase torque and power output; hence, this attribute is advantageous. Especially in high-performance engines, the increased flame speed can aid in preserving a more stable combustion process. If not adequately controlled, it may also result in higher NOx emissions.
Engine performance is greatly impacted by the different characteristics of ethanol and methanol, especially with regard to ignition delay and flame speed. When using these alternative fuels, it is essential to understand these distinctions to maximize engine performance and reduce pollution.
2.4. Design of Experiment
Before establishing parameters for this particular work, the experiment runs the entire set of noise factor settings at every combination of control factor settings (at each run). This allows optimal conditions to be established. The experiments are planned using the Taguchi Technique to determine the optimal parameters for creating experiment samples. During this work and development, the Taguchi approach offers significant improvements in engine performance, enabling rapid, economical acquisition of high performance for the experiment. By employing the Taguchi technique, DOE drastically reduces the time required for experimental research. The initial step of this inquiry is conducting trials using Taguchi’s orthogonal arrays to determine the optimum engine performance condition for the chosen fuel [36,37].
Taguchi Analysis
The Taguchi analysis is used to study the significance and effect of the engine parameters [38,39]. The following are factors and the 4 Levels that are considered in Taguchi’s design. The combination Design of Experiments with the optimization of engine performance control parameters to obtain the best results can be achieved in the Taguchi Method, and Table 3 below shows the selected engine parameters and their level.
Table 3. Input Parameter.
|
Parameters |
Level 1 |
Level 2 |
Level 3 |
Level 4 |
|---|---|---|---|---|
|
Engine load (%) |
20 |
40 |
60 |
80 |
|
Blend (%) |
0 |
5 |
10 |
15 |
For this experiment, sixteen sets of gasoline-methanol and sixteen sets of gasoline-ethanol blends were studied to maximize engine performance parameters. It is done with several sets of parameter combinations. Using the Taguchi method, control settings are optimized to produce optimal performance. Three Signal-to-Noise ratios are commonly used in the Taguchi method for optimization. Taguchi L16 has been selected because it is a robust design method developed by Genichi Taguchi to improve the quality of manufactured goods and, more recently, has also been applied in engineering and biotechnology [1]. Limitations of Taguchi in this study include poor handling of complex factor interactions, reliance on static orthogonal arrays that may not fit all studies, and a lack of statistical rigor compared to traditional Design of Experiments (DOE). It assumes linear relationships, making it difficult to isolate noise-factor contributions, and it requires extensive knowledge of the system beforehand. It is generally assumed that interactions between control factors are insignificant, which may not hold in real-world scenarios, leading to potentially inaccurate optimization.
i. Smaller-The-Better:
n = −10 Log10 [mean of the sum of squares of measured data]
ii. Larger-The-Better:
n = −10 Log10 [mean of the sum squares of reciprocal of measured data]
iii. Nominal-The-Best:
n = 10 Log10 [ratio of the square of the mean to the variance (or standard deviation)]
3. Result and Discussion
In this chapter, the general findings of the tests employing Taguchi and an ANN are presented.
3.1. Effect of Ethanol-Gasoline Blend and Methanol-Gasoline Blend on Engine Performance and Emission
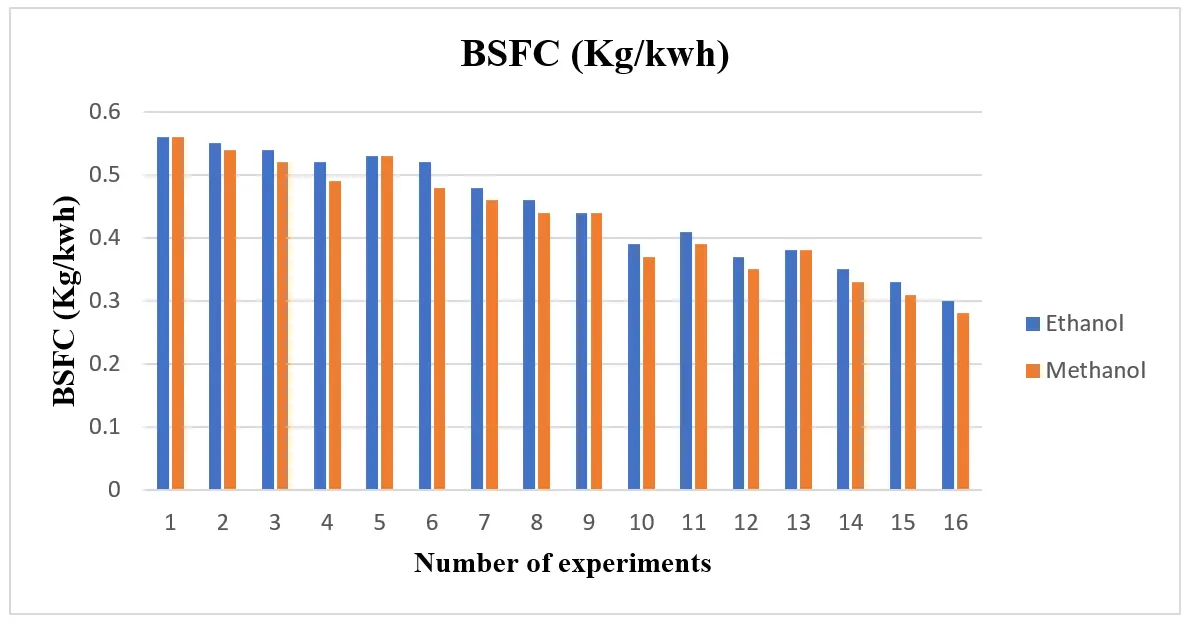
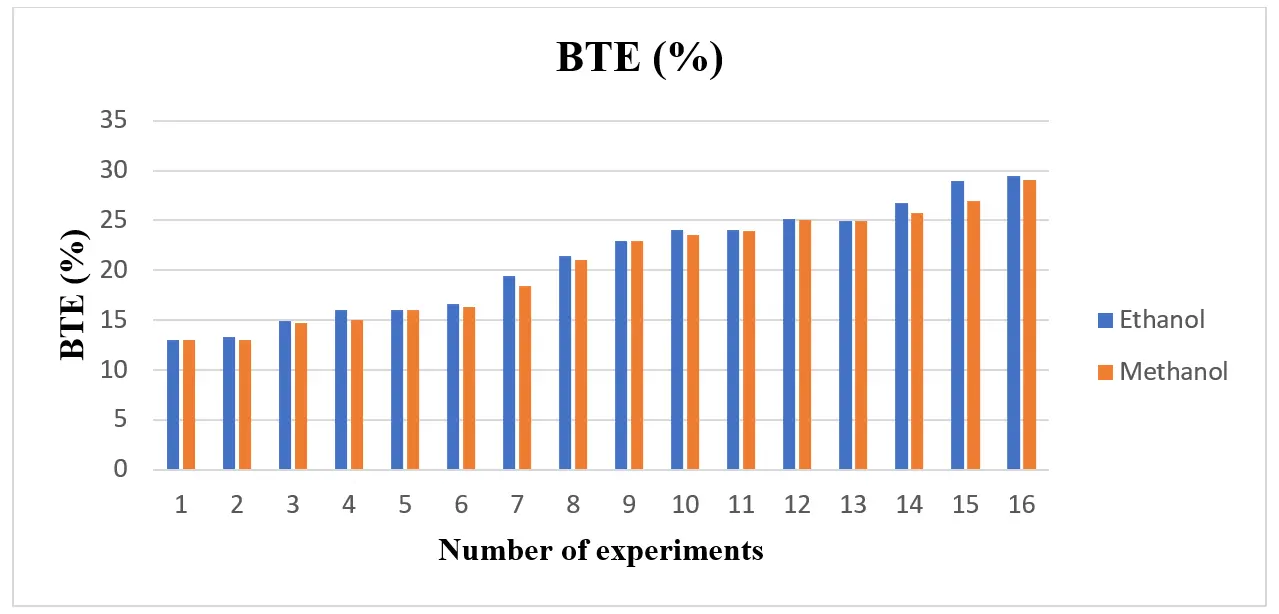
The ethanol and methanol blend’s BSFC is displayed in Figure 3. Based on the figure, the BSFC for both blends is low when compared to gasoline. The main cause is alcohol’s increased volatility, which speeds up air/fuel mixing, improves combustion, and increases combustion efficiency. Additionally, by decreasing the blend’s density and viscosity, the efficient mixing of alcohol with gasoline has enhanced fuel properties and decreased BSFC under all load circumstances. Despite having a lower heating value than ethanol, Figure 3 shows that methanol’s BSFC was lower than ethanol’s due to its higher oxygen rate. Increased combustion efficiency results from more oxygen, which lowers BSFC. The BTE of the ethanol and methanol blend is higher than that of gasoline, and ethanol has a higher BTE than methanol, as seen in Figure 4. In general, using ethanol and methanol raised BTE. It was demonstrated that the use of BTE in ethanol raises more than in gasoline. Shayan et al. [22] confirmed a similar tendency, stating that more methanol (containing 5–7.5–10–12.5, and 15% methanol) significantly increases engine performance (brake torque, brake power, thermal efficiency, and volumetric efficiency). Additionally, Balat & Balat [20] found that the gasoline-methanol mixture significantly boosts the engine’s thermal efficiency. Additionally, Elfasakhany [3] claims that using ethanol-gasoline blends in an SI engine significantly reduced CO and HC (hydrocarbon) emissions compared to using ordinary gasoline.
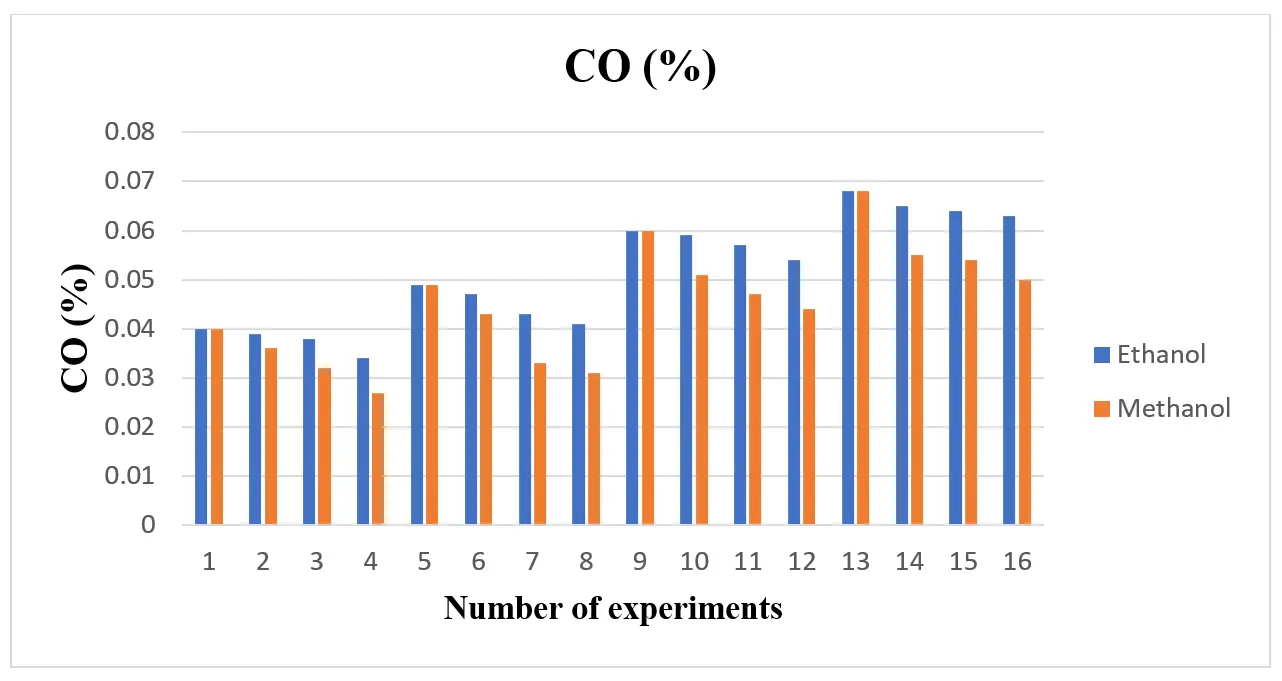
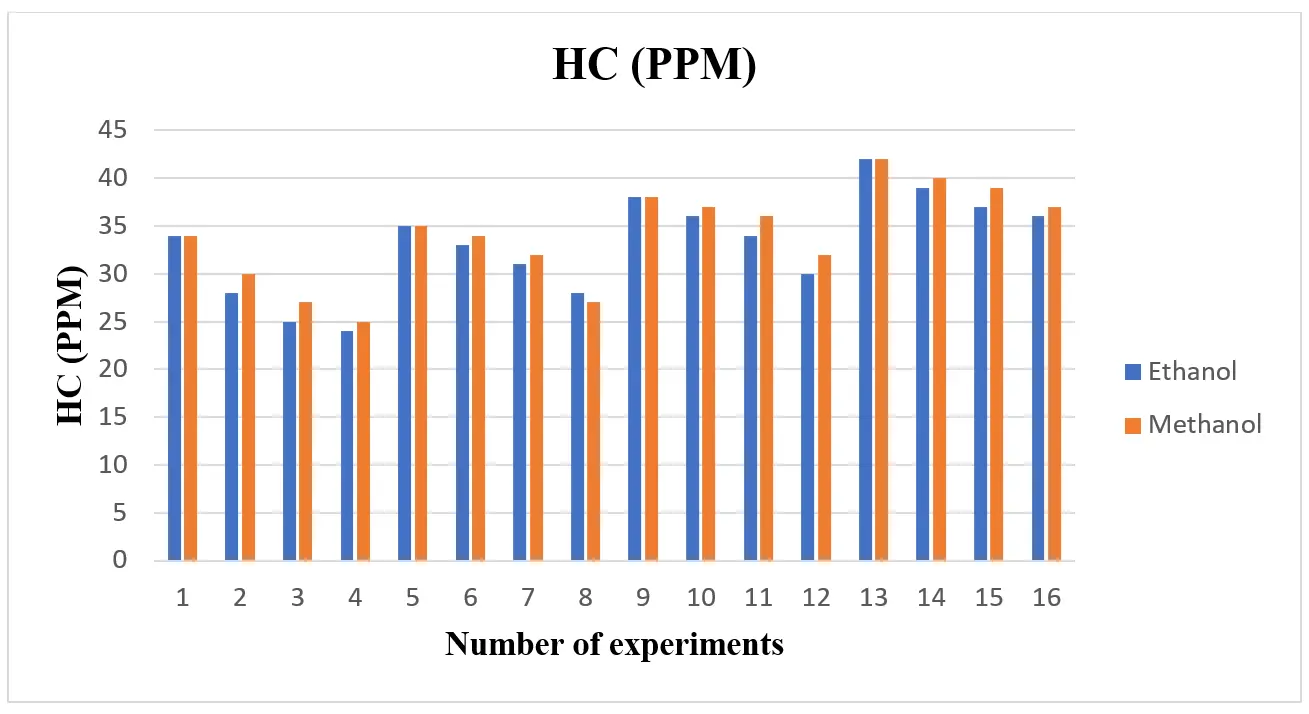
When compared to gasoline, the use of alcohol fuel resulted in lower CO and HC emissions, as shown in Figure 5 and Figure 6 Because ethanol and methanol have a lower boiling point, a faster rate of flame propagation, a higher oxygen content, and a simpler chemical structure than gasoline, they contribute to a reduction in CO and hydrocarbon (HC) emissions. This suggests that adding an alcohol blend can effectively reduce CO emission concentrations. Because methanol and ethanol contain oxygen in their chemical structures, they fill the oxygen gap during burning and reduce CO emissions. The hydrogen atom cannot locate enough oxygen atoms to react when gasoline fuel is utilized if the cylinder does not receive enough oxygen. As a result, incomplete combustion increases HC emissions. The alcohol fuels’ oxygen content decreased HC emissions. To do this, Dorney et al. [34] looked into how ethanol-gasoline blends affected emissions. The addition of ethanol decreased the emissions of CO and HC, according to an analysis of the test data. Regarding HC and CO emissions, Topgül et al. [26] and Iodice et al. [19] came to similar conclusions.
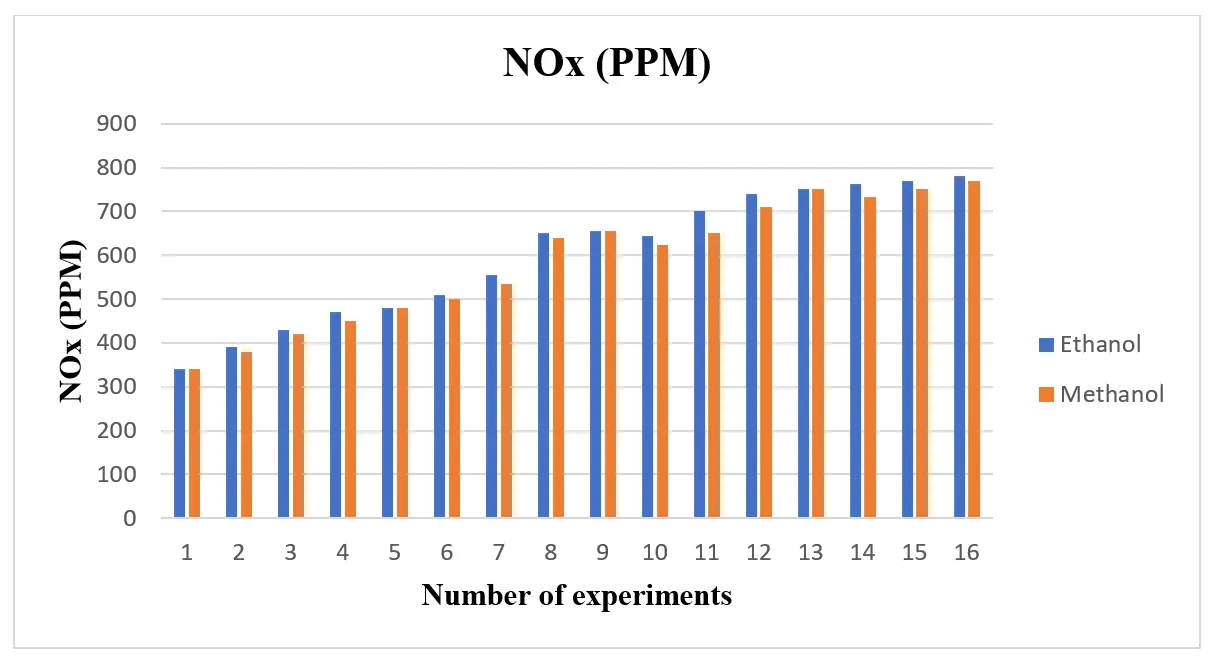
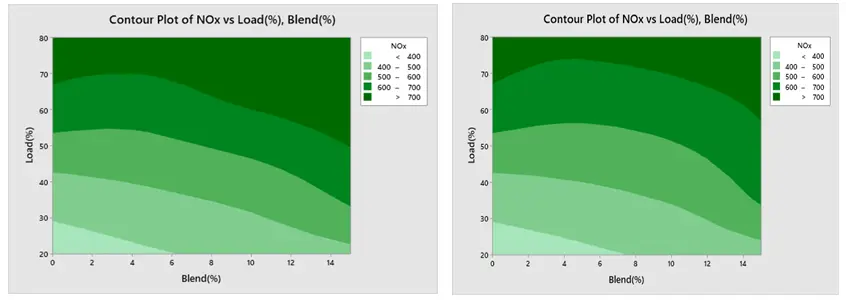
NOx generation rises with an increase in alcohol blend, as shown in Figure 7. The NOx emission level increases with the compression ratio. This results from a higher compression ratio and a higher maximum combustion temperature. NOx emissions rise as the combustion process approaches stoichiometry and produces a higher flame temperature. Alcohols’ high oxygen content and exhaust gas temperature also contribute to their elevated NOx emissions.
A similar tendency was demonstrated by Chen et al. [31]. They claim that adding alcohol to fuel raises NOx emissions while lowering total HC emissions. The figure shows abrupt changes in NOx emissions at different mix levels. These differences may indicate obscure connections between engine characteristics and fuel mixes that aren’t always evident.
3.2. Effect of Engine Load and Blends on Engine Performance Emission for Ethanol Blend
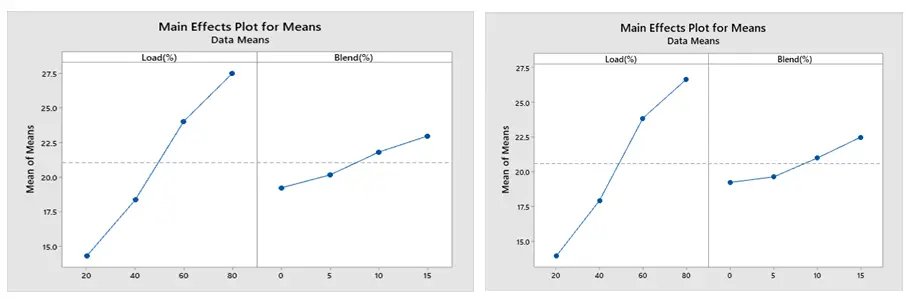
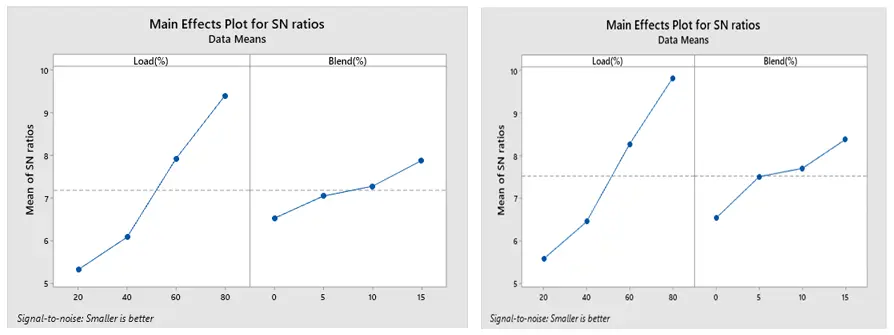
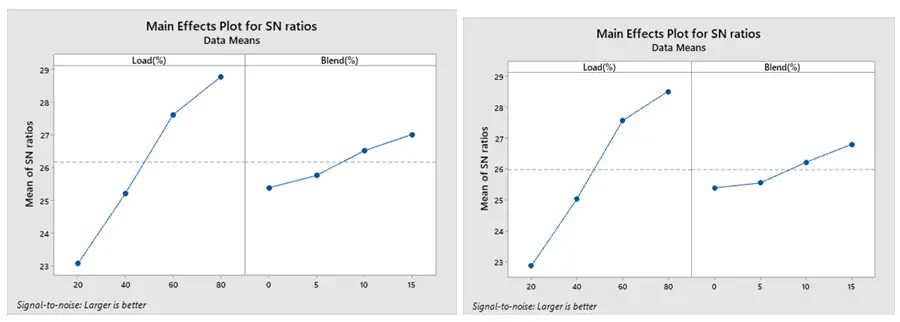
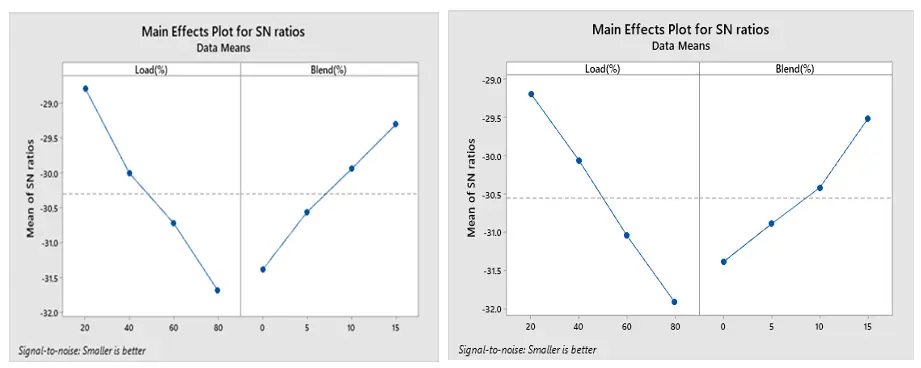
The current study examined the impact of operational factors on BSFC and BTE on engine performance and emissions (CO, NOx, and HC) at varying engine load and blend conditions. The primary impacts of BSFC and BTE under (a) for ethanol and (b) for methanol blend are shown in Figure 8 and Figure 9 below, respectively. As engine load and blend increase, BSFC decreases and BTE increases. Brake thermal efficiency increases in tandem with an increase in engine load. In the meantime, because biofuel boosts oxygen, increasing its blend will improve brake thermal efficiency. BSFC and BTE behave in opposite ways. This means that the engine blend with the lowest BSFC has the highest thermal efficiency. This chart illustrates how the BSFC falls as the percentages of ethanol and methanol rise.
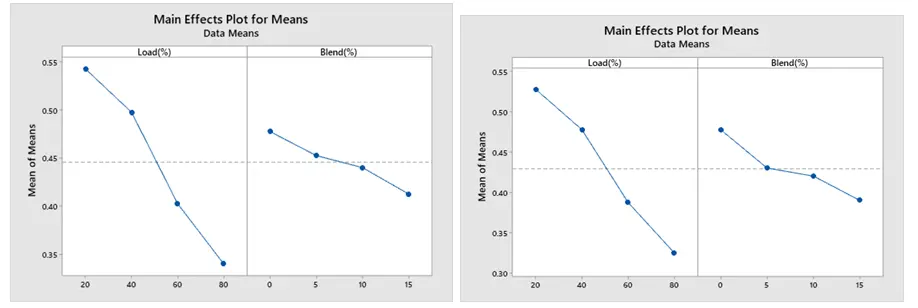
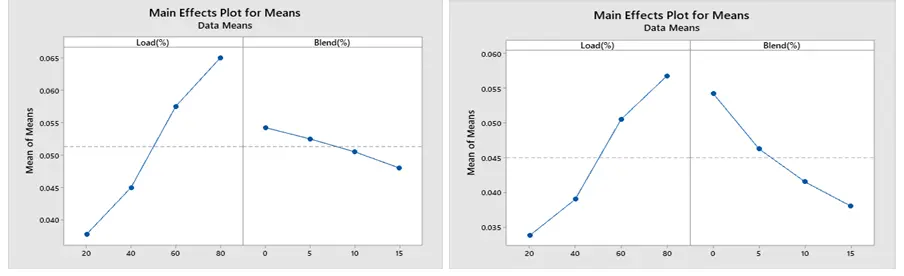
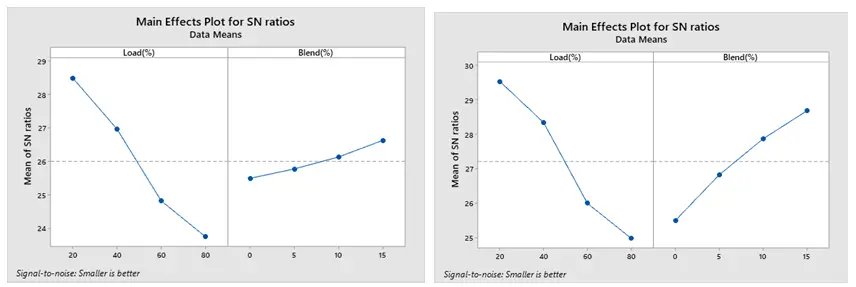
The MEP of CO is displayed in Figure 10 (a) for the ethanol blend and (b) for the methanol blend. The graph indicates that CO generation rises with increasing load in both ethanol and methanol blends, but falls with increasing blend. By supplying sufficient oxygen during combustion, which results in a lean air-fuel mixture, it is clear that adding a biofuel blend to gasoline will lower carbon monoxide emissions. Figure 10 displays the engine load-related CO emission values. Because gasoline lacks oxygen in its chemical structure, it cannot completely burn when used in an engine, and CO emissions rather than CO2 are released as exhaust. Because of the increased engine load, more fuel must be burned in the same amount of time. Because there is not enough time in the cycle, the larger amount of fuel in the combustion chamber cannot burn quickly. As engine load increases, CO emissions rise. Under all load settings, the 0% blend fuel produced higher CO levels.
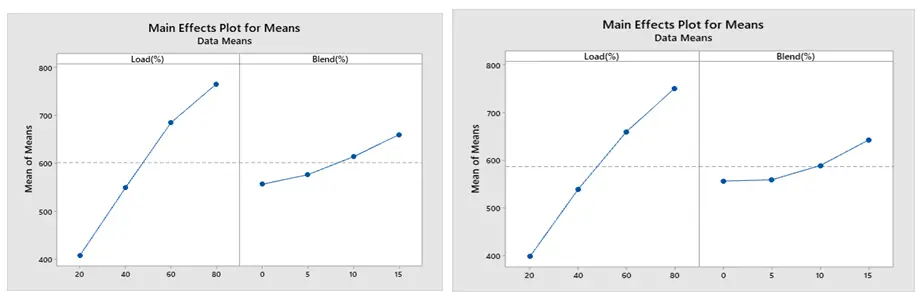
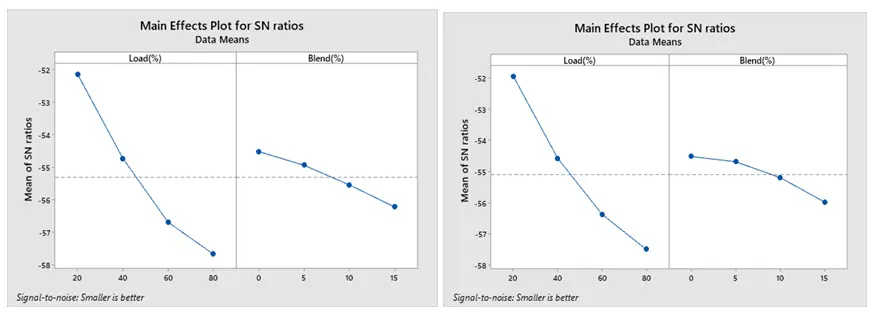
MEP of NOx (a) for ethanol blend and (b) for methanol blend, is displayed in Figure 11. According to the figure, mass emission of NOx is mostly caused by extremely high combustion temperatures and the presence of extra oxygen in the combustion chamber’s localized zones. As load increases, NOx generation increases as well. As engine load increases, NOx mass emission rises quickly for all test fuels. The majority of studies suggest that nitrogen oxides will rise in tandem with the amount of alcohol in the blend. More NOx is produced during the combustion stage as a result of the progressive increase in in-cylinder temperature brought on by the use of an ethanol and methanol combination. Additionally, because more oxygen is available, NOx generation increases as the blend increases. As engine load and power demand increase, a richer fuel-air mixture is injected to meet performance requirements. This richer mixture may raise the temperature at which NOx is produced during combustion. At higher loads, combustion may become less efficient if the air-fuel ratio is not properly tuned, leading to localized hot spots that further promote NOx formation [22].
The observed increase in nitrogen oxide (NOx) emissions with increasing engine load and higher ethanol and methanol blend percentages can be attributed to several factors. As engine load increases because of the increasing power demand, richer fuel-air mixes are injected, raising the temperature of combustion. These high temperatures promote the generation of NOx because nitrogen and oxygen react at high temperatures. Additionally, mixtures of ethanol and methanol can increase combustion efficiency due to their higher oxygen concentration; yet, this same trait may result in higher flame temperatures when combined with larger loads. This dual contribution highlights the difficulty of combustion dynamics in SI engines, where optimal performance requires balancing power demands and emissions management [26].
Methanol and ethanol operate differently in SI engines due to their distinct physical and chemical properties. Methanol may have different combustion dynamics than ethanol due to its lower boiling point and higher heat of vaporization, which could help cool the intake charge. Methanol often exhibits faster combustion rates, which enhance throttle responsiveness, but ethanol’s higher carbon content and higher flame temperature may lead to increased NOx emissions under specific load conditions. Furthermore, ethanol’s higher oxygen content encourages more thorough burning, which often reduces hydrocarbon emissions. These differences demonstrate the importance of considering fuel properties when optimizing blends for performance and emissions reduction.
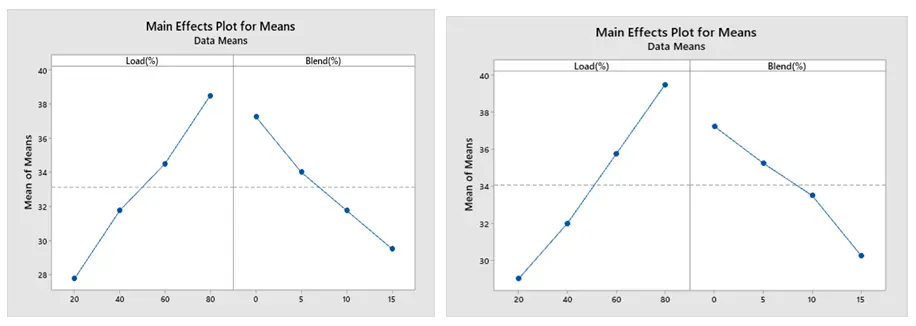
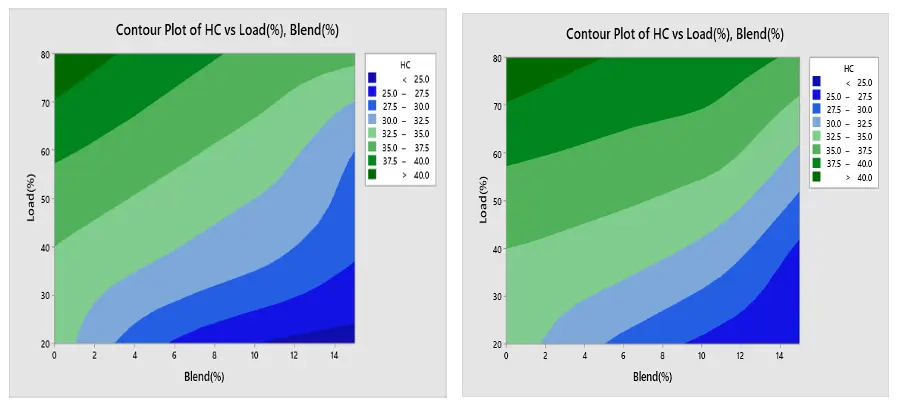
According to Figure 12a,b, the amount of hydrocarbon (HC) produced rises with increasing engine load and decreases with increasing blend. Wall wetting and flame quenching are the primary causes of incomplete fuel combustion. To meet power demands, more gasoline is pumped into the combustion chamber as engine load increases. Higher HC emissions may result from richer fuel-air mixtures that don’t burn completely. Additionally, when the temperature of combustion rises, an excessively rich mixture may cause the combustion process to become less effective, allowing unburned hydrocarbons to escape into the exhaust. Fuel blends with higher ethanol or methanol concentrations typically have better combustion efficiency due to their oxygen content, which promotes more complete combustion. Because these fuels might encourage greater atomization and mixing, which lowers the possibility of incomplete combustion, HC emissions usually decrease as the blend concentration rises [17].
The study provides valuable new insights into how engine loads and fuel blends affect emissions and efficiency. Our knowledge of combustion processes and how fuel properties impact engine performance is improved by this information.
3.3. Optimization of Engine Performance and Emission
Brake Specific Fuel Consumption (BSFC) and Brake Thermal Efficiency (BTE) are response variables when utilizing the Taguchi method to optimize engine performance. The engine’s capacity to transform fuel energy into productive work is measured by its BTE. It is computed as the brake power output divided by the fuel energy input. It is an important engine performance indicator. For efficiency, a higher BTE means more of the fuel’s energy is converted to mechanical energy. Because more fuel is used efficiently, fewer unburned hydrocarbons and CO emissions are released, which frequently results in lower emissions. This is in line with the objectives of contemporary engine design and environmental laws. When evaluating various fuel blends and operating conditions, BTE is an essential response variable since optimizing it immediately leads to increased fuel economy [26].
BSFC, which is commonly stated in grams per kilowatt-hour (g/kWh), is the quantity of fuel used per unit of power output. It shows how well fuel is used by an engine to produce power. It is a clear indicator of fuel economy. An engine’s ability to generate more power while using less fuel is shown by lower BSFC values, which is important for both performance and financial feasibility. Because less fuel is used, maximizing BSFC results in lower operating expenses for both consumers and businesses. This is especially important for commercial applications where fuel prices have a big influence on profitability. Additionally, it allows direct comparison of various fuels and operating conditions, making it a useful variable for determining how ethanol-methanol mixtures affect engine performance.
Because of their crucial roles in evaluating engine performance, efficiency, and economic viability, BTE and BSFC were chosen as response variables. These variables support the goals of performance optimization using the Taguchi approach and ANOVA by offering a thorough understanding of how various fuel blends and operating circumstances affect engine operation [19].
The optimized combustion run with the lowest BSFC under ethanol and methanol are displayed in Figure 13a,b, respectively, based on Taguchi’s approach. The maximum SNR is the optimum setting. Accordingly, 80% load and 15% blend are the optimal levels for both methanol and ethanol. Additionally, Figure 14a,b show that the best conditions for obtaining a greater BTE are at load 80% and 15% blend for both ethanol and methanol blends. The best combination to achieve low CO is a load of 20% and a blend 15% for both the ethanol and methanol blend, according to Figure 15a,b.
The SN ratio for NOx under ethanol and methanol is displayed in Figure 16a,b. According to Taguchi’s approach, 20% load and 0% blend for both ethanol and methanol result in the optimal combustion run with the least amount of NOx production. Because of its low biofuel percentage and reduced engine loads, this combustion technique is designed to produce the least amount of NOx. It is clear that when the load increases, the cylinder temperature rises, thereby increasing NOx emissions. As illustrated in Figure 17a,b, Taguchi’s research indicates that the optimal combination for the least amount of HC emission is 20% load and 15% blend for both ethanol and methanol blends.
Similar patterns about the optimum engine load for reducing emissions and Brake Specific Fuel Consumption (BSFC) have been documented by several authors. Li J et al. [40], for example, found that increased engine load improves combustion efficiency, thereby lowering BSFC and emissions. Additionally, Dahham et al. [41] observed that, in their experiment, running at about 80% load resulted in optimal fuel efficiency and decreased CO and hydrocarbon emissions. In their study on ethanol-diesel blends, Milojevic et al. [42] found that the highest performance metrics were achieved at engine loads between 70 and 90 percent. The results show that ethanol-methanol mixtures have complex effects on emissions. Manufacturers can use this information to choose and refine fuel formulations that limit harmful emissions without sacrificing performance.
3.4. The Potential of Using These Optimized Blends in Real-World Engines
Improved combustion efficiency from optimized blends can result in lower brake-specific fuel consumption (BSFC) and improved brake thermal efficiency (BTE). Consumers will save money as a result, and fleets will use less gasoline. Because of their oxygen content and more thorough burning, blended ethanol and methanol can drastically lower emissions of hydrocarbons (HC) and carbon monoxide (CO). Although increased loads may lead to higher NOx emissions, this problem can be avoided through proper engine parameter optimization, enabling compliance with strict emission standards.
Flex-fuel vehicles (FFVs), which can run on different ethanol blends, are a common design feature of modern automobiles. Because of this compatibility, switching to optimized blends can be easier and require fewer major changes. Retrofitting solutions, however, might be investigated to adapt these blends to older engines, increasing fuel efficiency and lowering emissions.
The availability of feedstock, production prices, and agricultural methods will all affect how economically viable it is to create optimum ethanol and methanol mixes. Technological developments in production can make traditional fuels more competitive. Manufacturers may be financially motivated to invest in these alternatives as a result of rising consumer knowledge and regulatory pressure for cleaner fuels, which may increase demand for optimized mixes.
Blends of ethanol and methanol may be more hygroscopic, which could cause problems with fuel stability and storage. To reduce these dangers, infrastructure and handling must be done properly. Fuels having a high ethanol or methanol percentage may be less volatile in colder climes, which may have an impact on cold start performance. To guarantee dependable functioning, engine management systems may require modifications. More research must be done on how different mixes affect performance, emissions, and combustion characteristics under actual use. This will aid in improving fuel compositions and honing engine tuning techniques.
With advantages like increased fuel economy and lower emissions, optimized ethanol and methanol blends have a lot of promise for application in actual engines. To ensure successful implementation, however, practical factors such as fuel stability, engine compatibility, and economic sustainability must be considered. To fully reap the benefits of these alternative fuels, research and development must continue.
3.5. Analysis of Variance
To identify the most important factors influencing engine performance and emissions, an analysis of variance (ANOVA) was conducted using Minitab18 software (version 22.1). 95% confidence intervals are included in the ANOVA. Sources are considered to have made a significant contribution to the performance metrics if their p-values are 0.05 or lower [39]. The table’s sum of squares (SS) column shows the total contribution of each component to the factor’s variance. A measure of the quantity of data in a set is called the Degree of Freedom (DOF). The residual error, also known as the percentage error, is the inaccuracy that may occur when measuring a response and is associated with uncontrollable or unpredictable circumstances. It shows whether an experiment is sufficient and practicable. If the percentage of errors is less than 15%, the experiment is acceptable; if it is more than 15%, the experiment is not satisfactory [40].
ANOVA for Engine Performance and Emission
The ANOVA table of BSFC for ethanol and methanol is displayed in Table 4 and Table 5, respectively. The Table indicates that load has a greater effect than blend. The percentage composition of the load is (89.25%), and the blend is (7.79%) as shown in Table 4, while it is (84.39%) for the load and (12.88%) for the blend as shown in Table 5. Because of inefficiencies under specific operating conditions, higher loads usually result in higher combustion temperatures and possibly higher BSFC because more fuel is needed to maintain performance. Given that load has the biggest impact on BSFC, focusing more on operational factors such as load management, rather than only on fuel type, may be necessary to maximize engine performance.
Table 4. Analysis of Variance for BSFC for ethanol blend.
|
Source |
DF |
Seq SS |
Contribution |
Adj SS |
Adj MS |
F-Value |
p-Value |
|---|---|---|---|---|---|---|---|
|
Load (%) |
1 |
0.098701 |
89.25% |
0.098701 |
0.098701 |
391.04 |
0.000 |
|
Blend (%) |
1 |
0.008611 |
7.79% |
0.008611 |
0.008611 |
34.12 |
0.000 |
|
Error |
13 |
0.003281 |
2.97% |
0.003281 |
0.000252 |
||
|
Total |
15 |
0.110594 |
100.00% |
Table 5. Analysis of Variance for BSFC for methanol blend.
|
Source |
DF |
Seq SS |
Contribution |
Adj SS |
Adj MS |
F-Value |
p-Value |
|---|---|---|---|---|---|---|---|
|
Load (%) |
1 |
0.097301 |
84.39% |
0.097301 |
0.097301 |
402.68 |
0.000 |
|
Blend (%) |
1 |
0.014851 |
12.88% |
0.014851 |
0.014851 |
61.46 |
0.000 |
|
Error |
13 |
0.003141 |
2.72% |
0.003141 |
0.000242 |
||
|
Total |
15 |
0.115294 |
100.00% |
Ethanol and methanol have error contribution percentages of 2.97% and 2.72%, respectively, which are less than 15%. It proves that the outcome is satisfactory. Additionally, since the p-value is less than 0.05, both factors are significant in the ethanol-methanol combination. The model is accurate with R squares of 97.03% for ethanol and 97.28% for methanol, both of which are greater than 95%. This demonstrates that measurement error-related variability in the data is negligible, confirming the validity of the conclusions. Low error contributions imply that the measurements and experimental setup were carefully managed.
The most significant component is load (90.50%), followed by blend (7.31%) for ethanol blend, and load (91.21%), followed by blend (5.81%) for methanol blend, as indicated by an ANOVA of BTE displayed in Table 6 and Table 7. The dominance of load implies that the engine’s efficiency in using fuel is greatly impacted when it runs under different load circumstances. If the engine is properly tuned, higher loads usually result in higher combustion temperatures and better thermal efficiency. The relevance of operational techniques that maximize engine performance across a range of load conditions is demonstrated by the substantial impact of load on BTE. This can entail adjusting the engine for particular uses if the load characteristics are known.
Table 6. Analysis of Variance for BTE for ethanol blend.
|
Source |
DF |
Seq SS |
Contribution |
Adj SS |
Adj MS |
F-Value |
p-Value |
|---|---|---|---|---|---|---|---|
|
Load (%) |
1 |
411.778 |
90.50% |
411.778 |
411.778 |
536.55 |
0.000 |
|
Blend (%) |
1 |
33.256 |
7.31% |
33.256 |
33.256 |
43.33 |
0.000 |
|
Error |
13 |
9.977 |
2.19% |
9.977 |
0.767 |
||
|
Total |
15 |
455.011 |
100.00% |
Table 7. Analysis of Variance for BTE for methanol blend.
|
Source |
DF |
Seq SS |
Contribution |
Adj SS |
Adj MS |
F-Value |
p-Value |
|---|---|---|---|---|---|---|---|
|
Load (%) |
1 |
390.68 |
91.21% |
390.68 |
390.684 |
397.94 |
0.000 |
|
Blend (%) |
1 |
24.88 |
5.81% |
24.88 |
24.876 |
25.34 |
0.000 |
|
Error |
13 |
12.76 |
2.98% |
12.76 |
0.982 |
||
|
Total |
15 |
428.32 |
100.00% |
The error contribution percentages are less than 15%:2.19% for the ethanol blend and 2.98% for the methanol blend. It shows that the result is appropriate. The R sq value for BTE is 97.81% for the ethanol blend and 97.02% for the methanol blend, and both are higher than 95%, indicating that the model is correct. The p-value also shows that both parameters are significant because they are all less than 0.05.
The load has a greater effect (93.83%) for ethanol and (66.13%) for methanol, followed by blend (4.55%) for ethanol and (29.21%), according to an ANOVA for CO under both ethanol and methanol blends, as indicated in Table 8 and Table 9. Engine load has a major impact on CO emissions, which highlights the necessity of efficient load control to reduce emissions. Optimizing engine operating conditions to lower CO output at different loads is one strategy.
Table 8. Analysis of Variance for CO for ethanol blend.
|
Source |
DF |
Seq SS |
Contribution |
Adj SS |
Adj MS |
F-Value |
p-Value |
|---|---|---|---|---|---|---|---|
|
Load (%) |
1 |
0.001777 |
93.83% |
0.001777 |
0.001777 |
752.01 |
0.000 |
|
Blend (%) |
1 |
0.000086 |
4.55% |
0.000086 |
0.000086 |
36.45 |
0.000 |
|
Error |
13 |
0.000031 |
1.62% |
0.000031 |
0.000002 |
||
|
Total |
15 |
0.001893 |
100.00% |
Table 9. Analysis of Variance for CO for methanol blend.
|
Source |
DF |
Seq SS |
Contribution |
Adj SS |
Adj MS |
F-Value |
p-Value |
|---|---|---|---|---|---|---|---|
|
Load (%) |
1 |
0.001296 |
66.13% |
0.001296 |
0.001296 |
184.14 |
0.000 |
|
Blend (%) |
1 |
0.000572 |
29.21% |
0.000572 |
0.000572 |
81.33 |
0.000 |
|
Error |
13 |
0.000091 |
4.67% |
0.000091 |
0.000007 |
||
|
Total |
15 |
0.001960 |
100.00% |
It shows that the error percentage contributions are less than 15%, 1.62% for ethanol and 4.67% for methanol. It proves that the outcome is satisfactory. Furthermore, since every value is less than 0.05, all parameters are significant from the perspective of the p-value. Since the ethanol R square value is greater than 95%, the model is considered accurate. It is 98.38% for ethanol and 95.33% for methanol.
The ANOVA Table of NOx for ethanol and methanol is displayed in Table 10 and Table 11, respectively. The Table indicates that load has a greater effect than blend. The percentage contribution of the load is (88.97%) and for the blend is (7.39%) under ethanol, while the percentage contribution of the load is (90.46%) and the blend is (5.42%) under methanol. For ethanol and methanol, the error contribution percentages are less than 15%, 3.64%, and 4.12%, respectively. It proves that the outcome is satisfactory. Additionally, since the p-value is less than 0.05, both factors are significant in the ethanol-methanol combination. The model is accurate with R squares of 96.36% for ethanol and 95.88% for methanol, both of which are greater than 95.
Table 10. Analysis of Variance for NOx for ethanol blend.
|
Source |
DF |
Seq SS |
Contribution |
Adj SS |
Adj MS |
F-Value |
p-Value |
|---|---|---|---|---|---|---|---|
|
Load (%) |
1 |
292,699 |
88.97% |
292,699 |
292,699 |
317.63 |
0.000 |
|
Blend (%) |
1 |
24,325 |
7.39% |
24,325 |
24,325 |
26.40 |
0.000 |
|
Error |
13 |
11,980 |
3.64% |
11,980 |
922 |
||
|
Total |
15 |
329,004 |
100.00% |
Table 11. Analysis of Variance for NOx for methanol blend.
|
Source |
DF |
Seq SS |
Contribution |
Adj SS |
Adj MS |
F-Value |
p-Value |
|---|---|---|---|---|---|---|---|
|
Load (%) |
1 |
278,362 |
90.46% |
278,362 |
278,362 |
285.46 |
0.000 |
|
Blend (%) |
1 |
16,675 |
5.42% |
16,675 |
16,675 |
17.10 |
0.001 |
|
Error |
13 |
12,677 |
4.12% |
12,677 |
975 |
||
|
Total |
15 |
307,714 |
100.00% |
As per the ANOVA of HC presented in Table 12 and Table 13, the load is the most significant factor (62.86%), followed by blend (33.37%) for ethanol blend, and load (67.73%), followed by blend (28.21%) for methanol blend. This implies that changes in engine load significantly affect the combustion process, resulting in fluctuations in HC emissions. The significant impact of load suggests that changes in load conditions may affect combustion efficiency, potentially leading to incomplete combustion and higher HC emissions.
Table 12. Analysis of Variance for HC for ethanol blend.
|
Source |
DF |
Seq SS |
Contribution |
Adj SS |
Adj MS |
F-Value |
p-Value |
|---|---|---|---|---|---|---|---|
|
Load (%) |
1 |
245.00 |
62.86% |
245.00 |
245.000 |
216.67 |
0.000 |
|
Blend (%) |
1 |
130.05 |
33.37% |
130.05 |
130.050 |
115.01 |
0.000 |
|
Error |
13 |
14.70 |
3.77% |
14.70 |
1.131 |
||
|
Total |
15 |
389.75 |
100.00% |
Table 13. Analysis of Variance for HC for methanol blend.
|
Source |
DF |
Seq SS |
Contribution |
Adj SS |
Adj MS |
F-Value |
p-Value |
|---|---|---|---|---|---|---|---|
|
Load (%) |
1 |
248.51 |
67.73% |
248.51 |
248.513 |
216.64 |
0.000 |
|
Blend (%) |
1 |
103.51 |
28.21% |
103.51 |
103.513 |
90.24 |
0.000 |
|
Error |
13 |
14.91 |
4.06% |
14.91 |
1.147 |
||
|
Total |
15 |
366.94 |
100.00% |
The percentage of error contributions is 3.77% for the ethanol blend and 4.06% for the methanol blend, both of which are below 15%, indicating that the outcome is appropriate. The p-values also indicate that both parameters are significant, as all are less than 0.05. The R sq value for HC is 96.23% for the ethanol blend and 95.31% for the methanol blend, and since both of these values are higher than 95%, the model is accurate.
The study provides a rigorous quantitative framework for subsequent research, using ANOVA to evaluate the significance of different components. This methodology establishes a standard for related studies in the area. The findings highlight how crucial load circumstances are in influencing engine emissions and efficiency. By using this information, load management solutions can be developed to increase engine performance and reduce their negative environmental impacts.
3.6. Contour Plot
A contour plot is useful for connecting response values to the various levels of each process parameter and provides a two-dimensional picture of the surface [41].
Contour Plot of Engine Performance and Emission under Ethanol and Methanol
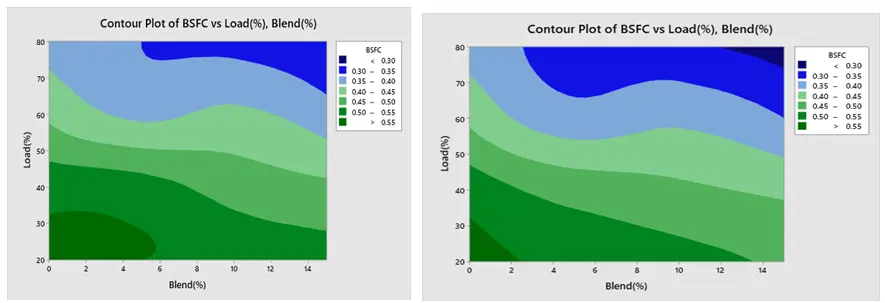
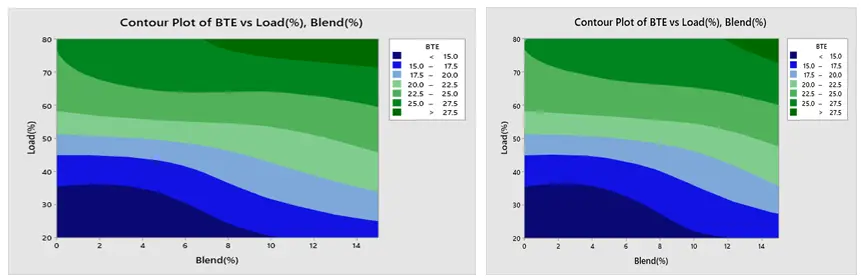
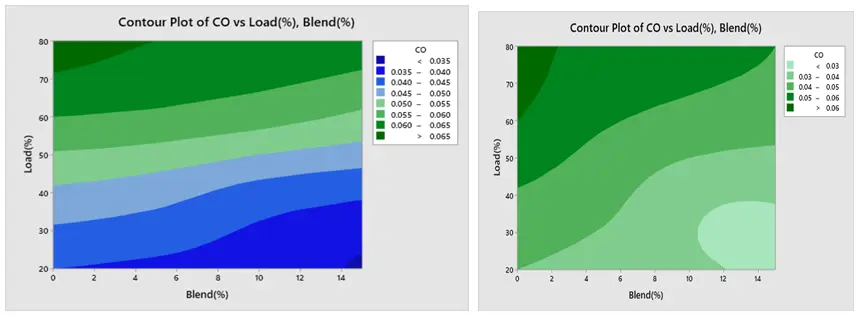
The contour plot findings of BSFC are displayed in Figure 18a,b respectively. The load and blend plot indicates that the BSFC is low at greater load and higher blend, and high at lower blend and lower load. Furthermore, Figure 19a,b show that BTE is low at lower load and lower mix and high at higher load and higher blend. Figure 20a,b show that CO creation is low at a lower blend and higher load, and high at a greater load and lower blend. The NOx contour plot in Figure 21a,b indicates that NOx generation is minimal at lower load and blend levels and high at higher load and blend levels. Furthermore, as seen in Figure 22a,b, HC is low at lower loads and higher blends, low at lower loads and lower blends, and high at greater loads and lower blends. All of these results are consistent with the Main Effect Plot for Means result.
4. Conclusions
The effects of engine load and blend on BSFC, BTE, CO, HC, and NOx have been effectively studied in the current study using gasoline-ethanol and gasoline-methanol. Consequently, the experimental and analytical results led to the following conclusions:
-
-
The results show that 80% engine load and a 15% blend for both ethanol and methanol provide the best engine performance, greatly lowering BSFC and raising BTE. Notably, 20% engine load and 15% blend result in the lowest CO emissions, whilst 20% load and 0% blend result in the lowest NOx emissions. Also, 20% load and 15% blend result in the lowest HC emissions. This study highlights the potential of alternative fuel blends to improve engine efficiency and reduce hazardous emissions.
-
-
For all engine responses during gasoline-ethanol and gasoline-methanol blends, engine load was found to be the most significant component, followed by blend.
-
-
When engine load and blend are increased, BSFC decreases, and BTE increases. Both in ethanol and methanol blends, the generation of CO rises with increasing load, while it falls with increasing blend. NOx generation rises with increasing load. Additionally, because there is more oxygen available, NOx generation rises as the blend increases. When the engine operates at higher loads, more hydrocarbon is formed; as the blend increases, less hydrocarbon is formed.
Statement of the Use of Generative AI and AI-Assisted Technologies in the Writing Process
The authors declare that Generative AI tools as Grok and ChatGPT were used for helping the translation of the manuscript and the optimization of syntax from the original text.
Author Contributions
F.Z.: Conceptualization, Methodology, S.A.: First draft, Visualization, Experimental work, H.A.: Editing, A.H.: Editing.
Ethics Statement
Not applicable.
Informed Consent Statement
Not applicable.
Data Availability Statement
The data used for the current study are available from the correspondent author upon reasonable request.
Funding
The authors declare no funding for this research.
Declaration of Competing Interest
The authors declare that they have no competing interest.
Abbreviations & Acronyms
|
ANOVA |
Analysis of variance |
|
ANN |
Artificial Neural Network |
|
BP |
Brake Power |
|
BT |
Brake Torque |
|
BTE |
Brake thermal efficiency |
|
BSFC |
Brake specific fuel consumption |
|
CO |
Carbon monoxide |
|
CO2 |
Carbon dioxide |
|
S/N |
Signal-to-noise ratio |
|
E5% |
5% of Ethanol |
|
M5% |
5% of Methanol |
|
G90% |
90% of Gasoline |
References
-
Jena P, Vachan Tirkey J, Raj R, Prajapati LK. Effect of propane blending with grape wood producer gas on SI engine performance and optimization. Appl. Therm. Eng. 2024, 242, 122480. DOI:10.1016/j.applthermaleng.2024.122480 [Google Scholar]
-
Gijón-Rivera C, Luis Olazagoitia J, Reyes-Avendaño JA. Design and development of a novel Four-Links rotational hybrid Energy-Harvesting suspension system compatible with conventional suspension technologies. Energy Convers. Manag. X 2024, 22, 100572. DOI:10.1016/j.ecmx.2024.100572 [Google Scholar]
-
Elfasakhany A. Investigations on the effects of ethanol–methanol–gasoline blends in a spark-ignition engine: Performance and emissions analysis. Eng. Sci. Technol. Int. J. 2015, 18, 713–719. DOI:10.1016/j.jestch.2015.05.003 [Google Scholar]
-
Wei Y, Liu S, Li H, Yang R, Liu J, Wang Y. Effects of Methanol/Gasoline Blends on a Spark Ignition Engine Performance and Emissions. Energy Fuels 2008, 22, 1254–1259. DOI:10.1021/ef7003706 [Google Scholar]
-
Fan C, Song C, Lv G, Wang G, Zhou H, Jing X. Evaluation of carbonyl compound emissions from a non-road machinery diesel engine fueled with a methanol/diesel blend. Appl. Therm. Eng. 2018, 129, 1382–1391. DOI:10.1016/j.applthermaleng.2017.10.086 [Google Scholar]
-
Chen F, Lu Y, Chen X, Li Z, Yu X, Roskilly AP. Numerical study of using different Organic Rankine cycle working fluids for engine coolant energy recovery. Energy Procedia 2017, 142, 1448–1454. DOI:10.1016/j.egypro.2017.12.533 [Google Scholar]
-
Zhou JH, Cheung CS, Leung CW. Combustion, performance, regulated and unregulated emissions of a diesel engine with hydrogen addition. Appl. Energy 2014, 126, 1–12. DOI:10.1016/j.apenergy.2014.03.089 [Google Scholar]
-
Sarıkoç S. Effect of H2 addition to methanol-gasoline blend on an SI engine at various lambda values and engine loads: A case of performance, combustion, and emission characteristics. Fuel 2021, 297, 120732. DOI:10.1016/j.fuel.2021.120732 [Google Scholar]
-
Sivasubramanian H, Pochareddy YK, Dhamodaran G, Esakkimuthu GS. Performance, emission and combustion characteristics of a branched higher mass, C3 alcohol (isopropanol) blends fuelled medium duty MPFI SI engine. Eng. Sci. Technol. Int. J. 2017, 20, 528–535. DOI:10.1016/j.jestch.2016.11.013 [Google Scholar]
-
Zhen X. Chapter 11—Methanol As An Internal Combustion on Engine Fuel. In Methanol; Basile A, Dalena FBT-M, Eds.; Elsevier: Amsterdam, The Netherlands, 2018; pp. 313–337. DOI:10.1016/B978-0-444-63903-5.00011-X [Google Scholar]
-
Sperling D, DeLuchi MA. Is methanol the transportation fuel of the future? Energy 1989, 14, 469–482. DOI:10.1016/0360-5442(89)90113-8 [Google Scholar]
-
Mahabir J, Samaroo N, Janardhanan M, Ward K. Pathways to sustainable methanol operations using gas-heated reforming (GHR) technologies. J. CO2 Util. 2022, 66, 102302. DOI:10.1016/j.jcou.2022.102302 [Google Scholar]
-
Bayraktar H. An experimental study on the performance parameters of an experimental CI engine fueled with diesel–methanol–dodecanol blends. Fuel 2008, 87, 158–164. DOI:10.1016/j.fuel.2007.04.021 [Google Scholar]
-
Sayin C, Ilhan M, Canakci M, Gumus M. Effect of injection timing on the exhaust emissions of a diesel engine using diesel–methanol blends. Renew. Energy 2009, 34, 1261–1269. DOI:10.1016/j.renene.2008.10.010 [Google Scholar]
-
Landälv I. Methanol As a Renewable Fuel—A Knowledge Synthesis. The Swedish Knowledge Centre for Renewable Transportation Fuels, Sweden. 2017. Available online: https://platformduurzamebiobrandstoffen.nl/wp-content/uploads/2017/09/2017_F3_Methanol-as-a-renewable-fuel.pdf (accessed on 1 December 2025).
-
Liu C, Li Z, Pei Y, An Y. Methanol as a fuel for internal combustion engines. In Engines and Fuels for Future Transport; Springer: Singapore, 2022; pp. 281–324. [Google Scholar]
-
Rößler E, Schmeckel T, Kesselheim U, Arning K. Driving towards sustainability: Exploring risk perceptions of fossil fuels, e-fuels, and electric drives in individual transport. Front. Energy Res. 2024, 12, 1415430. DOI:10.3389/fenrg.2024.1415430 [Google Scholar]
-
Jia L-W, Shen M-Q, Wang J, Lin M-Q. Influence of ethanol–gasoline blended fuel on emission characteristics from a four-stroke motorcycle engine. J. Hazard. Mater. 2005, 123, 29–34. DOI:10.1016/j.jhazmat.2005.03.046 [Google Scholar]
-
Iodice P, Senatore A, Langella G, Amoresano A. Effect of ethanol–gasoline blends on CO and HC emissions in last generation SI engines within the cold-start transient: An experimental investigation. Appl. Energy 2016, 179, 182–190. DOI:10.1016/j.apenergy.2016.06.144 [Google Scholar]
-
Balat M, Balat H. Recent trends in global production and utilization of bio-ethanol fuel. Appl. Energy 2009, 86, 2273–2282. DOI:10.1016/j.apenergy.2009.03.015 [Google Scholar]
-
Sapre AR. Properties, Performance and Emissions of Medium Concentration Methanol-Gasoline Blends in a Single-Cylinder, Spark-Ignition Engine; SAE Transactions: Warrendale, PA, USA, 1988. [Google Scholar]
-
Shayan SB, Seyedpour SM, Ommi F, Mousavi SH, Alizadeh M. Impact of Methanol—Gasoline Fuel Blends on the Performance and Exhaust Emissions of a SI Engine. Int. J. Automot. Eng. 2011, 1, 219–227. Available online: https://www.researchgate.net/profile/Soheil-Babazadeh-Shayan/publication/292005958_Impact_of_methanol-gasoline_fuel_blends_on_the_performance_and_exhaust_emissions_of_a_SI_engine/links/56b4fb9d08ae3c1b79ab1424/Impact-of-methanol-gasoline-fuel-blends-on-the-performance-and-exhaust-emissions-of-a-SI-engine.pdf (accessed on 1 December 2025).
-
ÖRS İ, GÜLCAN HE, SAYIN KUL B, YELBEY S, CİNİVİZ M. Evaluation of the Effects of Methanol and Ethanol Additions on Performance and Emissions in a Spark Plug Ignition Engine Fueled with Gasoline. Int. J. Automot. Sci. Technol. 2022, 6, 156–164. DOI:10.30939/ijastech..1081731 [Google Scholar]
-
Abu-Zaid M, Badran O, Yamin J. Effect of methanol addition on the performance of spark ignition engines. Energy Fuels 2004, 18, 312–315. DOI:10.1021/ef030103d [Google Scholar]
-
Balki MK, Sayin C, Canakci M. The effect of different alcohol fuels on the performance, emission and combustion characteristics of a gasoline engine. Fuel 2014, 115, 901–906. DOI:10.1016/j.fuel.2012.09.020 [Google Scholar]
-
Topgül T, Yücesu HS, Çinar C, Koca A. The effects of ethanol-unleaded gasoline blends and ignition timing on engine performance and exhaust emissions. Renew. Energy 2006, 31, 2534–2542. DOI:10.1016/j.renene.2006.01.004 [Google Scholar]
-
Kamil M, Nazzal IT. Performance Evaluation of Spark Ignited Engine Fueled with Gasoline-Ethanol-Methanol Blends. J. Energy Power Eng. 2016, 10, 343–351. DOI:10.17265/1934-8975/2016.06.002 [Google Scholar]
-
Koç M, Sekmen Y, Topgül T, Yücesu HS. The effects of ethanol-unleaded gasoline blends on engine performance and exhaust emissions in a spark-ignition engine. Renew. Energy 2009, 34, 2101–2106. DOI:10.1016/j.renene.2009.01.018 [Google Scholar]
-
Costa RC, Sodré JR. Compression ratio effects on an ethanol/gasoline fuelled engine performance. Appl. Therm. Eng. 2011, 31, 278–283. DOI:10.1016/j.applthermaleng.2010.09.007 [Google Scholar]
-
Thakur AK, Kaviti AK, Mehra R, Mer KKS. Performance analysis of ethanol–gasoline blends on a spark ignition engine: A review. Biofuels 2017, 8, 91–112. DOI:10.1080/17597269.2016.1204586 [Google Scholar]
-
Chen Z, Wang L, Zhang Q, Zhang X, Yang B, Zeng K. Effects of spark timing and methanol addition on combustion characteristics and emissions of dual-fuel engine fuelled with natural gas and methanol under lean-burn condition. Energy Convers. Manag. 2019, 181, 519–527. DOI:10.1016/j.enconman.2018.12.040 [Google Scholar]
-
Gautam M, Martin DW, Carder D. Emissions characteristics of higher alcohol/gasoline blends. Proc. Inst. Mech. Eng. Part A J. Power Energy 2000, 214, 165–182. DOI:10.1243/0957650001538263 [Google Scholar]
-
Gabele P. Exhaust emissions from in-use alternative fuel vehicles. J. Air Waste Manag. Assoc. 1995, 45, 770–777. DOI:10.1080/10473289.1995.10467405 [Google Scholar]
-
Dorney DJ, Flitan HC, Ashpis DE, Solomon WJ. The effects of blade count on boundary layer development in a low-pressure turbine. Int. J. Turbo Jet Engines 2001, 18, 1–14. DOI:10.1515/TJJ.2001.18.1.1 [Google Scholar]
-
Iliev S. A Comparison of Ethanol, Methanol, and Butanol Blending with Gasoline and Its Effect on Engine Performance and Emissions Using Engine Simulation. Processes 2021, 9, 1322. DOI:10.3390/pr9081322 [Google Scholar]
-
Ziyad F, Alemayehu H, Wogaso D, Dadi F, Badri M. Multi-objective optimization of machining parameters of mild steel AISI 1018 under compressed air-assisted cooling by using genetic algorithm. Int. J. Interact. Des. Manuf. (IJIDeM) 2024, 19, 5291–5311. DOI:10.1007/s12008-024-02134-0 [Google Scholar]
-
Sharma SK, Kumar ES. Optimization of Surface Roughness in CNC Turning of Mild Steel (1018) using Taguchi method. Carbon 2014, 3, 2928–2932. Available online: https://d1wqtxts1xzle7.cloudfront.net/64278735/optimization-of-surface-roughness-in-cnc-IJERTV3IS11132-libre.pdf?1598433162=&response-content-disposition=inline%3B+filename%3DIJERT_Optimization_of_Surface_Roughness.pdf&Expires=1771919769&Signature=V2Q5dTiHYGnbYOKEqtFNc9uogpc2peTwqflSKWqUL0Wthe8dgYxOuGAEaWB9ONwriiVVmNycZfS3wXgGH25ZrrUgBi7T9ZjqRGMTSS~Hh5gqrolZUzcNbHumBj~aTyOtdlo7iYRcsaOZDSBwjexWS90SEP6FHTB8yj7hl3erZkM3OGOVozJZ-ulcLbVM77QRABklKPxzsRx-1hKE3PLxs1APLiC7ltlVvVOJuZWO~0C6KXoVMD1t-02ZyAfQ75GrqSdOza~FrEL6Y7ly3PoinNe7ZWzOA4~JzHsK9naGm-H4GQvUsxTeTxZU-7BHkEtKCtSbNKTI8AoFoEuXSq72VQ__&Key-Pair-Id=APKAJLOHF5GGSLRBV4ZA (accessed on 1 December 2025).
-
Saravanakumar A, Karthikeyan SC, Dhamotharan B, Kumar VG. Optimization of CNC Turning Parameters on Aluminum Alloy 6063 using TaguchiRobust Design. Mater. Today Proc. 2018, 5, 8290–8298. DOI:10.1016/j.matpr.2017.11.520 [Google Scholar]
-
Ziyad F, Alemayehu H, Wogaso D, Dadi F. Prediction of surface roughness of tempered steel AISI 1060 under effective cooling using super learner machine learning. Int. J. Adv. Manuf. Technol. 2024, 136, 1421–1437. DOI:10.1007/s00170-024-14952-3 [Google Scholar]
-
Li J, Zhong W, Zhang J, Zhao Z, Hu J. The combustion and emission improvements for diesel–biodiesel hybrid engines based on response surface methodology. Front. Energy Res. 2023, 11, 1201815. DOI:10.3389/fenrg.2023.1201815 [Google Scholar]
-
Dahham RY, Wei H, Pan J. Improving Thermal Efficiency of Internal Combustion Engines: Recent Progress and Remaining Challenges. Energies 2022, 15, 6222. DOI:10.3390/en15176222 [Google Scholar]
-
Milojević S, Glišović J, Savić S, Bošković G, Bukvić M, Stojanović B. Particulate Matter Emission and Air Pollution Reduction by Applying Variable Systems in Tribologically Optimized Diesel Engines for Vehicles in Road Traffic. Atmosphere 2024, 15, 184. DOI:10.3390/atmos15020184 [Google Scholar]