Transcriptomic Insights into Selenite Response and Biotransformation in a Novel Selenium-Enriching Lactic Acid Bacterium

Transcriptomic Insights into Selenite Response and Biotransformation in a Novel Selenium-Enriching Lactic Acid Bacterium
Kai Chen
1,†
Xiaoyan Tang
1,†
Guangpeng Liu
2
Yan Zhao
2,*
Xiaobo Liu
1,*

Received: 01 December 2025 Revised: 23 December 2025 Accepted: 27 January 2026 Published: 02 February 2026

© 2026 The authors. This is an open access article under the Creative Commons Attribution 4.0 International License (https://creativecommons.org/licenses/by/4.0/).
1. Introduction
Selenium (Se) is an essential trace element that plays vital roles in antioxidant defense, immune modulation, and the prevention of several human and animal diseases [1]. It is incorporated into selenoproteins such as glutathione peroxidase and thioredoxin reductase through the amino acid selenocysteine, which is directly encoded by the UGA codon [2,3]. However, Se exhibits a narrow range between essentiality and toxicity—deficiency leads to disorders such as Keshan disease, cardiovascular dysfunction, and cancer, whereas excessive intake results in selenosis [4,5]. Given the narrow margin between deficiency and toxicity, developing bioavailable and low-toxicity selenium sources is essential for human and animal health [6].
In contrast to chemical synthesis, microbial biotransformation offers an efficient and environmentally friendly strategy for converting inorganic selenium into more bioavailable organic forms. Through this transformation, selenium becomes more biologically accessible and markedly less harmful [7,8]. A variety of microorganisms enriched with selenium—such as bacteria [9,10], yeasts, and fungi [11]—convert selenite or selenate through reduction, methylation, and incorporation into amino acids like selenocysteine and selenomethionine [12]. Among these, lactic acid bacteria (LAB) are particularly attractive due to their safety, probiotic functionality, and ability to maintain viability while synthesizing organic selenium under oxidative stress conditions [13,14]. Selenium-enriching LAB strains have been widely applied in fermented foods and dietary supplements, contributing both nutritional selenium and probiotic benefits to the host [15,16].
Selenium metabolism is closely intertwined with sulfur metabolism, as numerous sulfur-related enzymes and transporters also interact with selenium analogs. Genes such as serA, sat, cysH, selD, and metE participate in inorganic selenium assimilation and seleno-amino acid biosynthesis, while the glutathione (GSH) system plays a central role in redox homeostasis and detoxification [17,18]. Nevertheless, the molecular mechanisms governing selenium uptake, tolerance, and incorporation vary substantially among species and strains, suggesting that the effectiveness of selenium accumulation is shaped by a combination of genetic traits and environmental conditions [19,20].
With the advancement of omics technologies, particularly transcriptomics and proteomics, selenium-responsive genes, pathways, and enzymes have been systematically characterized in diverse microorganisms. Comparative transcriptomic analyses between selenium-treated and control conditions have revealed major changes in transport systems, redox metabolism, and energy pathways associated with selenium detoxification and assimilation. In lactic acid bacteria, omics-based studies have highlighted the differential expression of genes related to amino acid metabolism, NADPH regeneration, and antioxidant defense, reflecting complex cellular adaptations to selenium-induced oxidative stress [21].
In this study, we isolated a selenium-tolerant strain of Pediococcus acidilactici (03W) and found that it was particularly effective at accumulating selenium. To better understand how this strain takes up and adapts to selenium, we combined physiological optimization experiments with transcriptome profiling under selenium stress. By linking gene expression changes to biochemical measurements, we identified the major genes and metabolic pathways involved in selenium transport, reduction, and incorporation. These findings not only clarify how microorganisms handle selenium but also offer a scientific basis for developing selenium-enriched probiotic products.
2. Materials and Methods
2.1. Chemical Reagents
All chemicals were of analytical grade. Sodium selenite (Na2SeO3, ≥99%; Se(IV)) was obtained from Tansoole Co., Ltd. (Shanghai, China) and used as the selenium source in all stress experiments unless stated otherwise. Glucose, peptone, yeast extract, beef extract, sodium acetate, ammonium citrate, K2HPO4, MgSO4·7H2O, MnSO4·H2O, Tween 80, and CaCO3 were purchased from Shanghai Sangon Biotech Co., Ltd. (Shanghai, China) and used as the components of the MRS medium or for the preparation of selenium-supplemented media. All solutions were prepared using ultrapure water (Milli-Q grade, 18.2 MΩ·cm). The pH adjustments were made with sterile 1 M HCl or 1 M NaOH solutions prepared in ultrapure water and filtered through a 0.22 μm membrane, instead of autoclaving, to maintain reagent stability.
2.2. Sample Collection and Selenium-Tolerant Strain Isolation
Soil samples were collected from selenium-rich areas and transported to the laboratory under aseptic conditions. Approximately 10 g of each soil sample was added to 90 mL of sterile phosphate-buffered saline (PBS, pH 7.2) containing glass beads and agitated at 30 °C and 200 rpm for 30 min to detach microorganisms. Subsequent enrichment and growth assays were performed at 37 °C with shaking at 180 rpm. The mixture was allowed to stand for 5 min, after which the supernatant was collected and centrifuged at 5000 rpm for 15 min. The pellet was resuspended in 10 mL sterile PBS and stored at 4 °C for further use.
For enrichment, 2 mL of the soil suspension was inoculated into 100 mL of MRS broth supplemented with 100 µg·mL−1 sodium selenite (Na2SeO3) and incubated at 30 °C, 200 rpm for 48 h. Serial dilutions (10−2–10−6) were prepared and spread on MRS agar containing 0.5 g L−1 CaCO3. Plates were incubated at 30 °C until colonies appeared. Colonies with distinct morphology or reddish pigmentation were isolated and purified by repeated streaking. The composition and preparation of MRS medium are provided in Supplementary Table S1. The pH was adjusted to 6.2 ± 0.2 prior to sterilization (121 °C, 15 min). Sodium selenite (Na2SeO3) was added aseptically to sterile cooled medium (≤50 °C) when required.
Preliminary tolerance tests were conducted in 50 mL MRS broth (in 250 mL Erlenmeyer flasks) with graded concentrations of sodium selenite (Na2SeO3, 0–400 µg·mL−1). Each flask was inoculated with 1% (v/v) of an overnight seed culture adjusted to an initial OD600 of ≈0.1 (approximately 1 × 10⁷ CFU·mL−1). Cultures were incubated at 37 °C and 180 rpm, and growth was monitored by measuring optical density at 600 nm (OD600) at regular intervals. Strains exhibiting OD600 ≥ 0.6 incubation after 24 h in ≥ 200 µg·mL−1 Na2SeO3 were considered selenium-tolerant.
The isolate exhibiting the highest growth rate and red coloration—indicative of elemental selenium (Se0) deposition—was selected for further study and designated as strain 03W. Pure isolates were examined by Gram staining and microscopy to confirm lactic acid bacteria characteristics (Gram-positive, non-spore-forming, coccoid or short-rod). Purified strains were stored in MRS broth with 20% glycerol at −80 °C for long-term preservation. All isolation experiments were performed in triplicate, and identical results were obtained in independent trials.
2.3. Morphological and Biochemical Characterization
Cell morphology was examined by Gram staining under an optical microscope (Mshot, Guangzhou, China) to examine the cellular shape and surface structure. To evaluate selenium tolerance and growth kinetics, cultures were grown in MRS broth containing different concentrations of sodium selenite (Na2SeO3, 0–400 µg·mL−1) at 37 °C with shaking at 180 rpm. Optical density at 600 nm (OD600) was measured using a microplate reader (Tecan Infinite M Nano 2000, Männedorf, Switzerland), and growth curves were plotted based on OD600 values.
2.4. 16S rRNA Gene Amplification and Taxonomic Identification
Genomic DNA was extracted from the selenium-tolerant isolate grown to mid-log phase in MRS broth using a bacterial genomic DNA kit (Takara Bio, Tokyo, Japan). The nearly full-length 16S rRNA gene was amplified with universal primers 27F/1492R; detailed PCR mix and thermocycling parameters are provided in Supplementary Table S2 and Table S3. Amplicons were gel-purified (E.Z.N.A. Gel Extraction Kit, Omega Bio-Tek, Norcross, GA, USA) and bidirectionally Sanger-sequenced by Guangdong Magigene (Guangzhou, China). Sequences were assembled and edited in BioEdit; taxonomic assignment was performed using BLAST against NCBI GenBank and EzBioCloud. A phylogenetic tree was constructed in MEGA 11 using the neighbor-joining method with 1000 bootstrap replicates.
2.5. Detection of Biosynthetic Selenium Accumulation and Conversion Efficiency
2.5.1. Cultivation and Sample Preparation
A selenium-tolerant strain was inoculated into MRS broth containing sodium selenite (Na2SeO3) and incubated at 37 °C with shaking at 180 rpm for 48 h. Cells were harvested by centrifugation at 8000 rpm for 10 min, washed three times with deionized water to remove residual inorganic selenium, freeze-dried, and ground into a fine powder. This preparation ensured complete recovery of intracellular selenium for subsequent analysis.
2.5.2. Total Selenium Content Measurement
Total selenium was measured after complete digestion of bacterial cells. Microwave-assisted acid digestion was used to disrupt the cell wall and release intracellular selenium. The digested solution was treated with hydrochloric acid and potassium ferricyanide, then atomized. Fluorescence intensity was measured under a selenium lamp, and selenium concentration was calculated using a standard curve. Total selenium content was determined according to Equation (1):
where:
$${S}_{total}$$—total selenium content (µg·g−1 or µg·mL−1)
$$\rho$$—measured selenium concentration in the digested solution (μg·L−1)
$${\rho }_{0}$$—selenium concentration in the blank (μg·L−1)
$$V$$—total volume of the digested solution (mL)
$$m$$—sample mass or volume (g or mL).
Each measurement was performed in technical duplicate; the coefficient of variation (CV) between duplicates was <10%. Biological replicates (n = 3) are reported as mean ± SD.
2.5.3. Inorganic Selenium Measurement
Inorganic selenium was extracted by water bath heating and ultrasonic treatment, followed by centrifugation and filtration to remove particulates. Hexane extraction was used to concentrate the inorganic selenium to a final volume of 10 mL. Selenium species were stabilized with hydrochloric acid and potassium ferricyanide. The content of inorganic selenium was calculated using Equation (2):
where:
$${S}_{inorganic}$$—the inorganic selenium content (µg·g−1 or µg·mL−1)
$$C$$—measured concentration of selenium in the digest (µg·mL−1)
$${C}_{0}$$—concentration in the blank digest (µg·mL−1)
$$V$$—total volume of the digest (mL)
$$m$$—sample mass or volume (g or mL).
Measurements were performed in duplicate, and differences between replicates were kept below 10%.
2.5.4. Organic Selenium Calculation and Speciation
Organic selenium was calculated by subtracting inorganic selenium from total selenium. Additionally, HPLC coupled with ICP-MS was applied to separate and quantify specific selenium-containing amino acids, such as selenomethionine (SeMet) and selenocysteine (SeCys), providing detailed profiling of bioavailable organic selenium in the sample. Organic selenium content was obtained by subtracting inorganic selenium from total selenium, as calculated by the following Equation (3):
where:
$${S}_{organic}$$—organic selenium content (µg·g−1 or µg·mL−1)
$${S}_{total}$$—total selenium content (µg·g−1 or µg·mL−1)
$${S}_{inorganic}$$—the inorganic selenium content (µg·g−1 or µg·mL−1).
2.5.5. Selenium Conversion Efficiency
The efficiency of conversion of inorganic selenium into organic forms was evaluated using the following Equation (4):
where:
$${\eta }_{Se}$$—selenium conversion efficiency (%)
$${S}_{organic}$$—organic selenium content (µg·g−1 or µg·mL−1)
$${S}_{total}$$—total selenium content (µg·g−1 or µg·mL−1).
This measurement reflects how effectively the strain converts inorganic selenium into bioavailable organic forms, which is a key criterion for assessing the nutritional quality and functional potential of selenium-enriching probiotic strains.
2.6. Growth Conditions and Physiological Analysis
To better understand how the selenium-tolerant strain adapts physiologically and to determine the conditions most favorable for selenium enrichment, we carried out a series of controlled cultivation experiments. We examined how sodium selenite concentration, initial pH, and carbon-source composition influenced both cell growth and selenium uptake. These factors were chosen because they are well known to affect microbial metabolism and stress responses strongly.
For the selenium tolerance tests, the strain was grown in MRS broth containing increasing levels of sodium selenite (500, 1000, 1500, 2000, 2500, 3000, and 3500 µg·mL−1 Na2SeO3). Cultures were incubated at 37 °C with shaking at 180 rpm, and OD600 values were monitored at regular intervals to generate growth curves under varying selenium stress. This setup enabled pinpointing the selenium concentrations at which growth inhibition became evident, while the cells maintained metabolic activity sufficient for potential selenium transformation.
To examine pH adaptability, the initial pH of the MRS medium was adjusted to 3.0, 4.0, 5.0, 6.0, 7.0, 8.0, 9.0, and 10.0 before sterilization. Each culture was monitored for both growth and pH fluctuation during fermentation. The pH profile provided insight into the strain’s acid–base tolerance and its metabolic regulation in response to external pH stress, both of which are crucial to industrial-scale selenium conversion.
In addition, the influence of carbon source was explored by replacing glucose in the basal MRS medium with an equivalent carbon concentration (20 g L−1) of arabinose, fructose, mannose, or galactose. These monosaccharides differ in structure and metabolic entry points, allowing assessment of how carbon metabolism pathways affect selenium assimilation and energy flow.
Samples were harvested at the stationary phase to determine biomass dry weight, residual sugar content, medium pH, and total selenium concentration. All experiments were performed in triplicate. The combined data not only revealed the physiological limits of the strain under selenium stress but also provided a theoretical foundation for subsequent analysis of selenium conversion efficiency and transcriptomic profiling.
2.7. Transcriptomic Analysis
To investigate selenium-induced transcriptional responses, strain 03W was grown in MRS medium with 0 µg·mL−1 (control) or 1000 µg·mL−1 Na2SeO3 (treatment). Cells were harvested at late exponential phase (control at 4 h; selenite-treated at 12 h), with three biological replicates each. Samples were collected by centrifugation at 4 °C, snap-frozen, and stored at −80 °C for subsequent RNA extraction. Briefly, total RNA was extracted using the TRIzol™ Reagent (Invitrogen, Thermo Fisher Scientific, Waltham, MA, USA), RNA quality was assessed using a NanoDrop One spectrophotometer (Thermo Fisher Scientific, Waltham, MA, USA) and an Agilent 5400 TapeStation system (Agilent Technologies, Santa Clara, CA, USA). Ribosomal RNA was then removed using the Ribo-Zero rRNA Removal Kit (Epicentre, Madison, WI, USA). Strand-specific libraries were constructed using the NEBNext® Ultra II Directional RNA Library Prep Kit (New England Biolabs, Ipswich, MA, USA) before being sent to Novogene Co., Ltd. (Tianjin, China) for sequencing.
Raw reads were filtered with fastp to remove adapter sequences, poly-N, and low-quality bases. Clean reads were aligned to the reference genome using Bowtie2, and novel genes, operons, transcription start sites (TSS), and transcription termination sites (TTS) were predicted with Rockhopper. Gene-level read counts were summarized with feature counts to obtain a raw count matrix. Differential expression was assessed with DESeq2 on the raw counts (size-factor normalization and Wald test), and p values were adjusted using the Benjamini–Hochberg method (DEG threshold: |log2FC| ≥ 1 and Padj < 0.05). For visualization (e.g., heatmaps and expression profiles), expression values were converted to FPKM (and, where indicated, TPM). Three biological replicates were included for each condition. Gene Ontology (GO) and Kyoto Encyclopedia of Genes and Genomes (KEGG; Release 102.0, https://www.kegg.jp/, accessed by 29 January 2026) together with Cluster Profiler (v4.8.1) were employed to perform enrichment analyses, contextualizing the changes related to selenium transport, antioxidant activity, and amino acid metabolism.
2.8. RT-qPCR
To validate the reliability of the RNA-seq data, reverse transcription quantitative PCR (RT-qPCR) was performed on independent biological samples. The bacterial cells were cultivated under the same conditions as those used for the transcriptomic analysis, including both control and sodium selenite-treated groups, and harvested during the corresponding late-exponential growth phases. Total RNA was extracted using the Omega E.Z.N.A® Bacterial RNA Kit, and the RNA was treated with DNase I to remove contaminating genomic DNA. RNA quality was assessed using a NanoDrop spectrophotometer, and only samples with A260/A280 ratios between 1.8 and 2.1 were used for further analysis. First-strand cDNA synthesis was carried out using the FastKing-RT SuperMix reverse transcription kit, with 1 μg of total RNA as input. The cDNA was used as the template for RT-qPCR.
RT-qPCR reactions were performed using the Hieff® qPCR SYBR Green Master Mix (Low Rox Plus) on a real-time PCR system. The reaction mixture included SYBR Green dye, gene-specific primers, and the cDNA template. The amplification program included an initial denaturation step at 95 °C for 5 min, followed by 40 cycles of denaturation at 95 °C for 10 s, annealing at 55 °C for 20 s, and extension at 72 °C for 20 s. A melt-curve analysis was performed after amplification to confirm the specificity of the products. The relative gene expression levels were calculated using the 2−ΔΔCt method, with rpoB as the internal reference gene for normalization. All RT-qPCR assays were conducted with three biological replicates, and each biological replicate was analyzed in triplicate technical replicates.
2.9. Statistical Analysis
All experiments were conducted in triplicate, and data are presented as mean ± standard deviation (SD). Statistical significance was evaluated by one-way ANOVA followed by Tukey’s test using GraphPad Prism (version 10.4.1; GraphPad Software, USA). The capitalized letters (e.g., A, B, and C) indicate the significance of differences (p < 0.05). Figures were prepared using GraphPad Prism or R version 4.3.0 (R Foundation for Statistical Computing, Vienna, Austria).
3. Results
3.1. Isolation and Identification of Selenium-Enriching Lactic Acid Bacteria
A total of 16 isolates were obtained from selenium-rich environmental samples. Among these, 3 strains exhibited notable tolerance to sodium selenite at concentrations exceeding 150 µg·mL−1. The isolate designated 03W exhibited the highest growth rate and distinct reddish pigmentation when cultured in 200 µg·mL−1 Na2SeO3, which was consistent with intracellular reduction of selenite to elemental selenium, and morphological observations under optical microscopy showed that the cells were short, ovoid, Gram-positive cocci occurring in pairs or short chains, which are typical morphological features of Pediococcus species (Figure 1). Phylogenetic analysis of the 16S rRNA gene (1472 bp) revealed 99.79% similarity to Pediococcus acidilactici DSM20284 (GenBank accession no. AJ305320.1), thus identifying strain 03W as P. acidilactici.
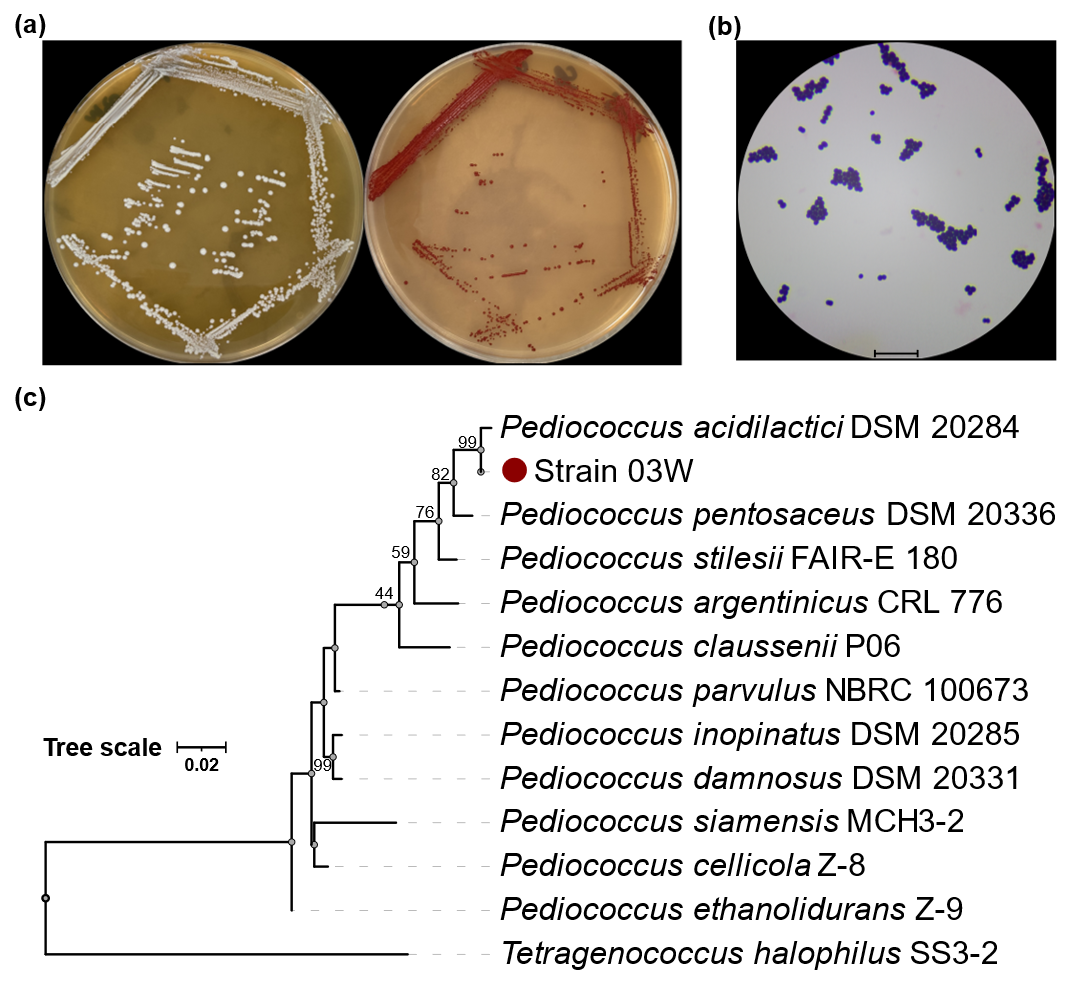
Figure 1. Morphological and phylogenetic characterization of Pediococcus acidilactici 03W. (a) Colony morphology on MRS and selenium-supplemented MRS agar, showing reddish pigmentation under selenium stress. (b) Optical micrographs of Gram-positive, non-motile cocci with ovoid to spherical morphology observed under oil immersion (magnification 1:1000; scale bar = 10 µm). (c) Neighbor-joining phylogenetic tree based on 16S rRNA sequences with 1000 bootstrap replicates. Tetragenococcus halophilus was used as the outgroup.
The capacity of this strain to survive and proliferate under selenium stress suggests intrinsic genetic and physiological mechanisms for selenium detoxification and incorporation, consistent with previous reports that Lactococcus species possess efficient redox and metal-ion homeostasis systems.
3.2. Selenium Tolerance and Accumulation Efficiency
The growth and selenium assimilation capabilities of P. acidilactici 03W were comprehensively evaluated under varying sodium selenite concentrations, pH levels, and carbon sources (Figure 2). The results collectively demonstrate the strain’s remarkable tolerance to selenium stress and its efficient conversion of inorganic selenium into bioavailable organic forms [22].
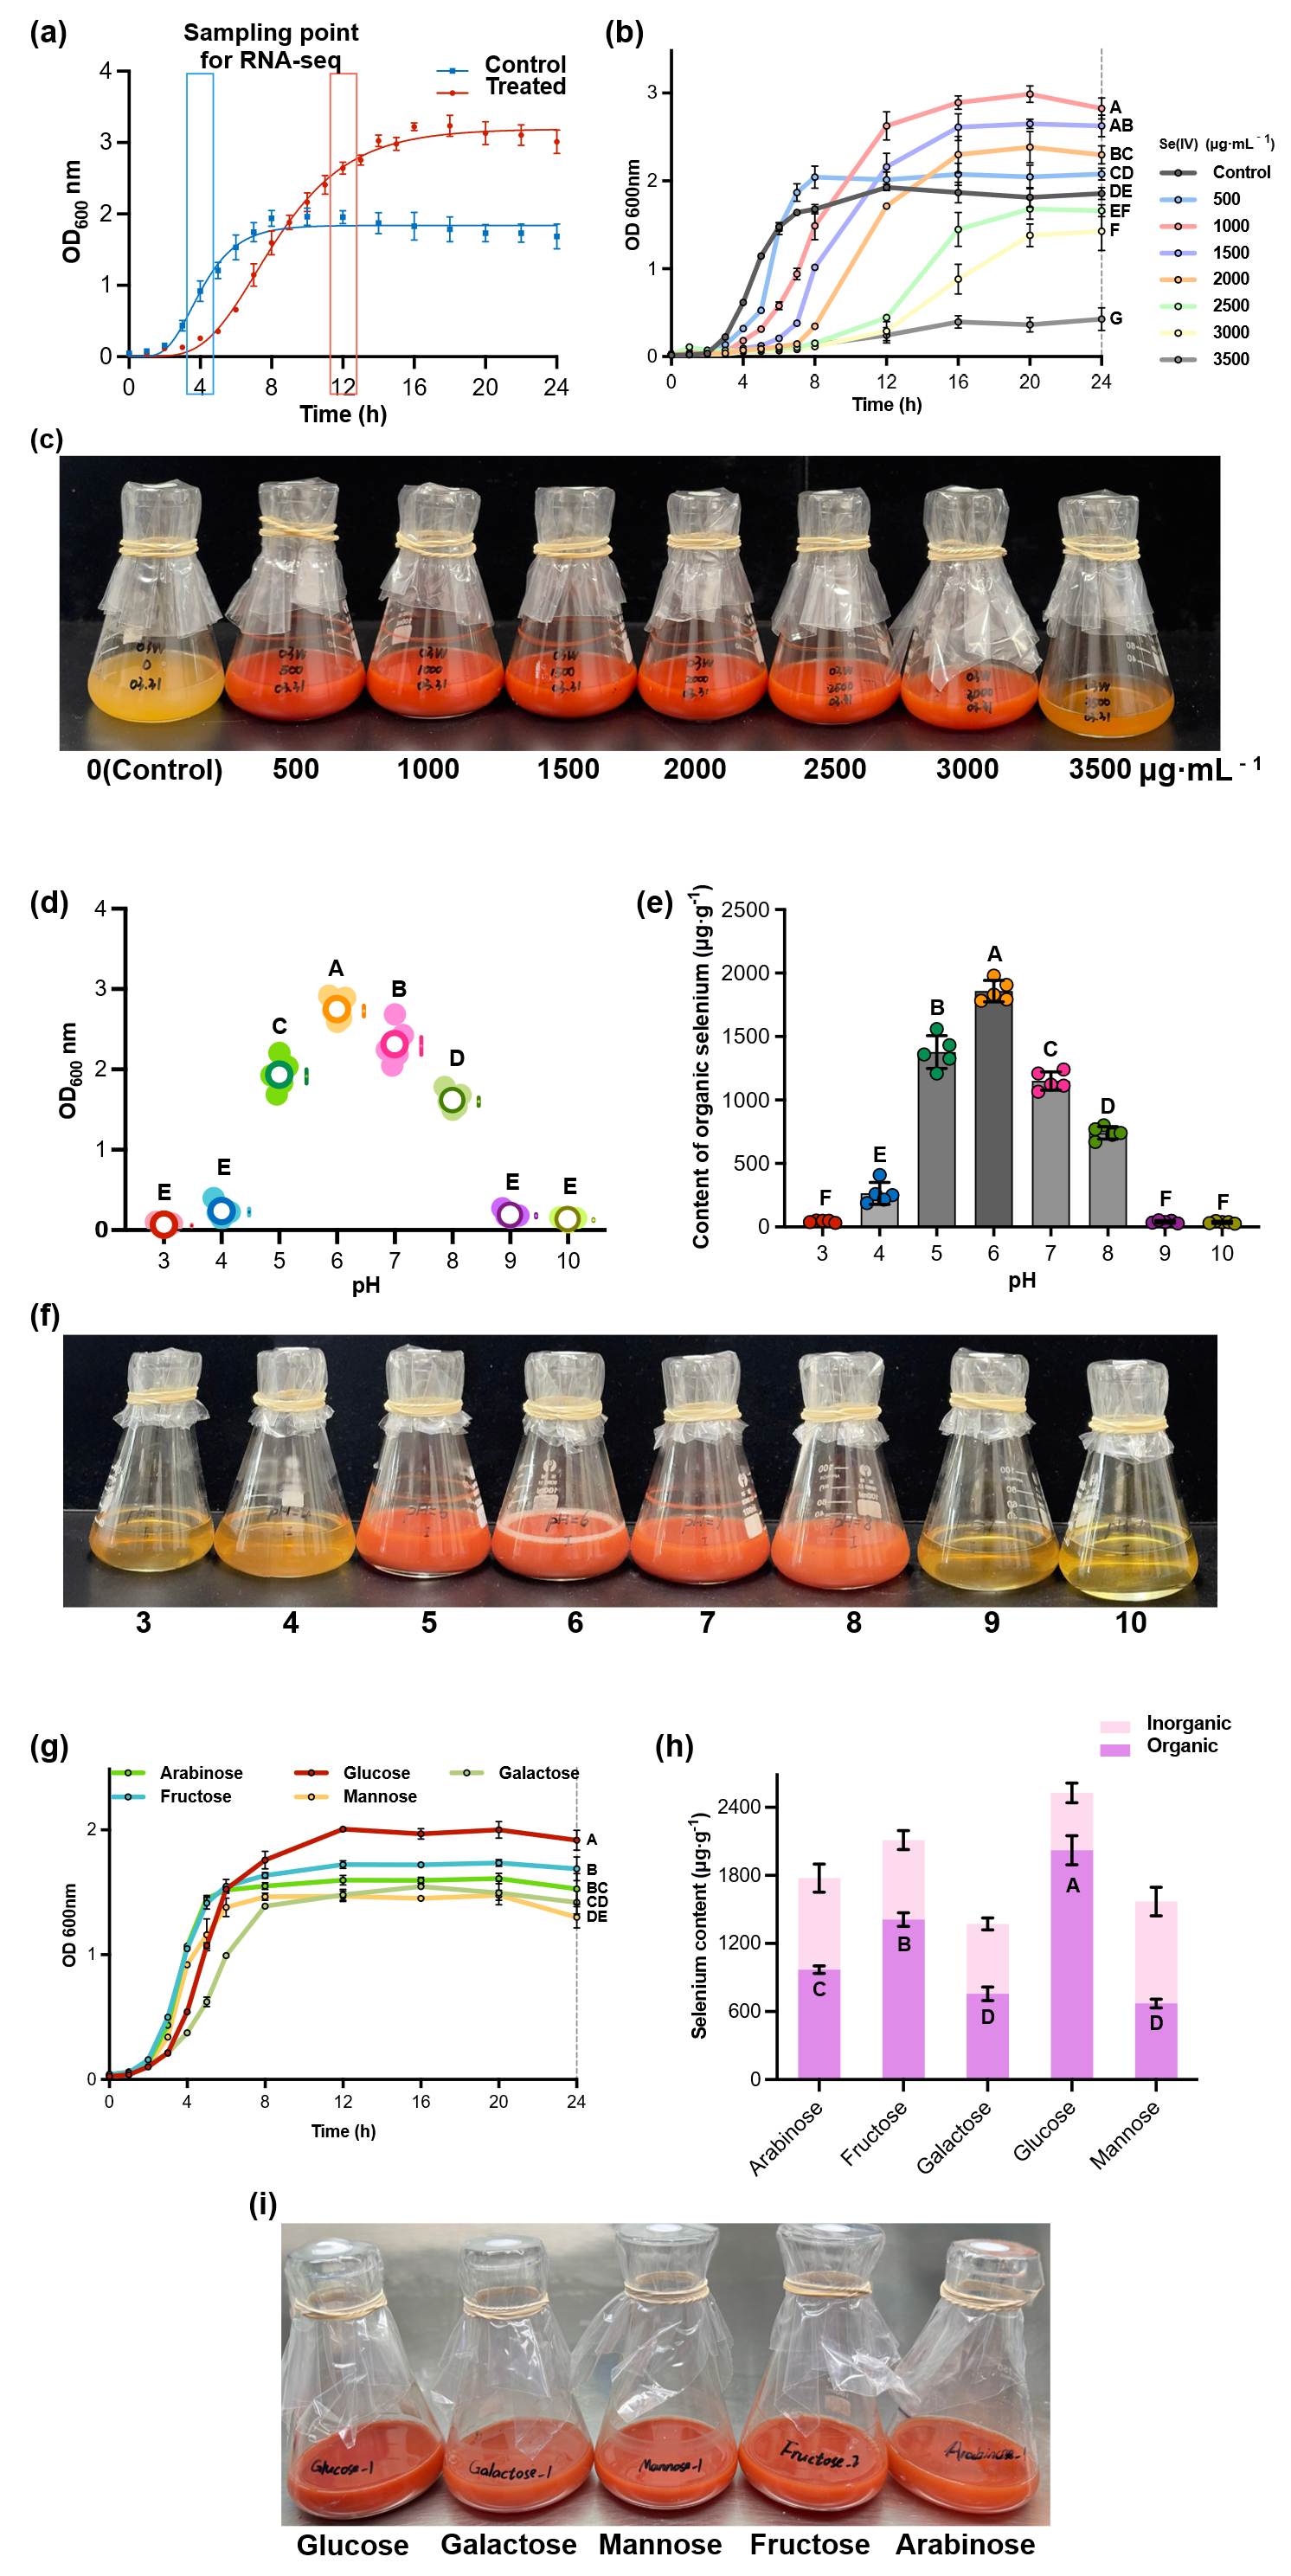
Figure 2. Biochemical patterns of Pediococcus acidilactici 03W under different cultivation conditions. (a) Growth curves of P. acidilactici 03W cultured in the absence and presence of 1000 µg mL−1 Na2SeO3. (b) Growth curves under different sodium selenite concentrations. (c) Fermentation with different concentrations of Na2SeO3 after 24 h. (d) Growth performance (OD600) at different initial pH values after 24 h incubation with 1000 µg mL−1 Na2SeO3. (e) Contents of organic selenium in the fermentation broth of P. acidilactici 03W when cultured at different initial pH values after 24 h. (f) Photographs of the cultures after 24 h incubation at different initial pH values with 1000 µg mL−1 Na2SeO3. (g) Growth of P. acidilactici 03W with different carbon sources (i.e., glucose, fructose, mannose, galactose, and arabinose). (h) Comparison of inorganic and organic selenium contents after 24 h cultivation in different carbon sources with 1000 µg mL−1 Na2SeO3. (i) Comparison of the fermentation broth of P. acidilactici 03W in different carbon sources with 1000 µg mL−1 Na2SeO3. Data are expressed as mean ± SD (n = 3). The capitalized letters (e.g., A, B, and C) indicate the significance of differences (p < 0.05).
3.2.1. Tolerance of P. acidilactici 03W to Selenite
Across 0–3500 µg·mL−1 Na2SeO3, strain 03W shows a clear dose–response in both time-course OD600 profiles and the 24-h culture appearance (Figure 2b). At 0–1000 µg·mL−1 (500, 1000), cells exit lag rapidly, enter exponential growth by 6–8 h, and reach high stationary-phase densities by 16–24 h. The 1000 µg·mL−1 curve displays the steepest exponential slope and the highest late-phase OD600, marking it as the overall optimum within the tested range. The 500 µg·mL−1 group closely tracks the control early on yet attains a slightly higher plateau later, indicating that low selenite can be accommodated without a growth penalty.
At intermediate doses (1500–2000 µg·mL−1), the growth profiles shift to the right, consistent with a prolonged lag phase and slower early accumulation. Despite this delay, cultures recover and continue to increase after 12–16 h; by 20–24 h, they maintain high final OD600, with 1500 µg·mL−1 ranking second only to 1000 µg·mL−1 and 2000 µg·mL−1, slightly lower but still robust. This pattern indicates strong tolerance in the low-to-moderate range, with biomass formation remaining substantial even when the onset of rapid growth is delayed.
At higher doses (≥2500 µg·mL−1), inhibition becomes evident and dose-dependent. The 2500 µg·mL−1 curve rises only modestly and plateaus well below the control, whereas the 3000 µg·mL−1 curve shows minimal increase above baseline through 24 h, indicating that proliferation is strongly curtailed at the upper end of the gradient. Together, these data define a practical operating window in which 500–1500 µg·mL−1 supports vigorous growth (optimum near 1000 µg·mL−1), a tolerance threshold around 2000 µg·mL−1, and a clear inhibitory regime ≥2500 µg·mL−1 [23].
The 24-h photographs (Figure 2c) visually reinforce the curve-based trends. Cultures at 500–2000 µg·mL−1 exhibit intense brick-red coloration and high turbidity relative to the pale control, consistent with vigorous growth under moderate selenite. The 2500 µg·mL−1 culture appears noticeably lighter (reduced turbidity and diminished redness), aligning with the depressed OD600 plateau. At 3000 µg·mL−1, the culture is pale and only slightly turbid, matching the near-flat growth curve. The monotonic shift in color/turbidity across the series provides a qualitative cross-check for the quantitative OD patterns: strong growth and pronounced pigmentation at 500–1500 µg·mL−1, partial recovery at 2000 µg·mL−1, and marked suppression at ≥2500 µg·mL−1.
Together, P. acidilactici 03W grows best at 1000 µg·mL−1, remains highly tolerant up to 2000 µg·mL−1, and experiences progressive, dose-dependent inhibition at 2500–3500 µg·mL−1. The concordance between time-course OD600 and endpoint culture appearance strengthens this interpretation.
3.2.2. Effects of pH on Growth and Selenium Uptake
Across the initial pH range tested, P. acidilactici 03W showed a clear pH-dependent response (Figure 2d–f). Growth was optimal at pH 6.0, where the 24-h OD600 was the highest and significantly greater than at all other pH conditions. Cultures at pH 5.0–7.0 sustained high biomass, with pH 5.0 and 7.0 slightly below the pH-6 peak but still markedly higher than off-optimum groups. At pH 8.0, OD600 declined to an intermediate level, and extreme pH values (3.0–4.0 and 9.0–10.0) yielded near-baseline readings, indicating strong inhibition. The 24-h photographs (Figure 2f) mirror these trends: cultures at pH 5–7 appear intensely brick-red and highly turbid, pH 8 is lighter yet visibly turbid, while pH 3–4 and pH 9–10 are pale and clear [24].
Selenium uptake exhibited the same peaked profile (Figure 2e). Organic Se content maximized at pH 6.0 (1800–2000 µg·g−1) and remained high at pH 5.0–7.0; it dropped sharply at pH 8.0 and fell to trace levels at pH ≥ 9.0 (≤60 µg·g−1), with similarly low values at pH 3.0–4.0. Multiple-comparison tests confirmed that pH 6.0 was significantly higher than the off-optimum conditions. Taken together, these data define a mildly acidic window (pH 5–7; the optimum 6.0) that simultaneously supports robust growth and efficient selenite bioconversion, consistent with the ecological preference of lactic acid bacteria for slightly acidic environments.
3.2.3. Effects of Carbon Source on Selenium Biotransformation
Carbon source strongly modulated both growth and selenium bioconversion in P. acidilactici 03W (Figure 2g–i). Among the five monosaccharides, glucose supported the greatest biomass and the highest total cellular Se, with fructose ranking second for Se accumulation. In contrast, mannose, galactose, and arabinose yielded slower growth and significantly lower cellular Se than glucose/fructose. Speciation analysis further showed that glucose produced the largest organic-Se fractions (1850 µg·g−1 on average), whereas mannose and galactose retained a larger inorganic component, and arabinose gave the poorest organic conversion. Together, these data identify glucose (≈fructose) as the most favorable carbon source for both biomass formation and Se biotransformation, while mannose/galactose are sub-optimal and arabinose is the least favorable—consistent with the idea that readily catabolized hexoses supply more reducing equivalents and thereby support faster growth coupled to higher Se conversion efficiency.
Generally, P. acidilactici 03W achieved its highest selenium-enriching growth at 1000 µg·mL⁻¹ Na2SeO3, pH 6.0, with glucose serving as the carbon source. These conditions revealed the strain’s metabolic flexibility and strong redox regulatory capacity. Such traits not only support its suitability for large-scale selenium biotransformation but also underscore its promise as a probiotic candidate for producing selenium-fortified functional foods and nutritional supplements.
3.3. Differential Gene Expression under Selenium Stress
Transcriptomic sequencing was conducted on P. acidilactici 03W cultured under control and selenium stress (1000 µg·mL−1 Na2SeO3) conditions. RNA-seq was performed on cells harvested at late-exponential phase, corresponding to 4 h for the control and 12 h for the selenite-treated cultures, with three biological replicates per group. High RNA integrity numbers (RIN > 9.5) and sequencing quality (Q30 > 97%) confirmed the reliability of the data. Mapping efficiency to the P. acidilactici reference genome ranged from 96.7% to 97.9%, supporting downstream expression analysis. Principal component analysis (PCA) and Pearson correlation demonstrated high consistency across the three biological replicates for both control and selenium-treated groups (Figure 3).
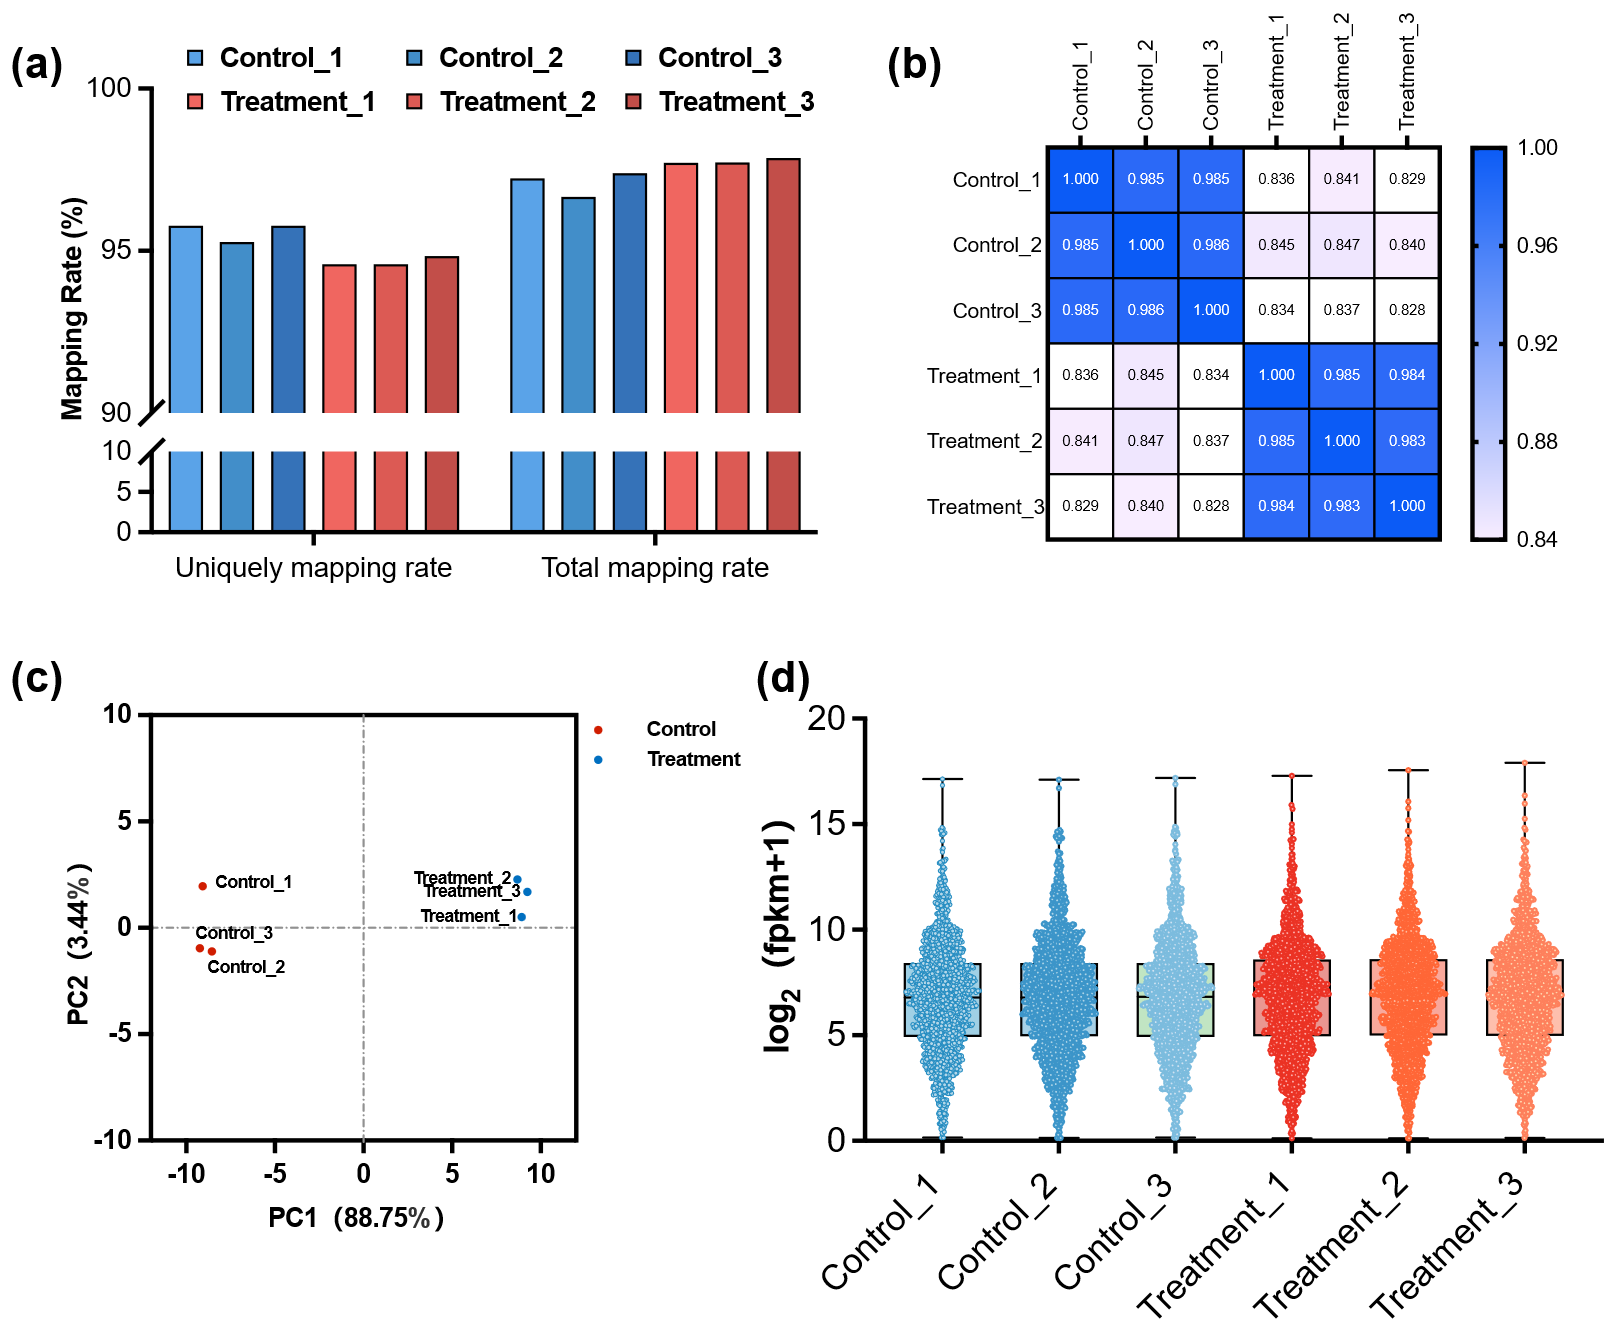
Figure 3. Quality control and expression characteristics of RNA-seq data. (a) Mapping rate of each sample, including unique and total mapping rates, shows consistently high alignment efficiency across all samples. (b) Sample-to-sample expression correlation heatmap presenting Pearson correlation coefficients; color intensity indicates the degree of correlation, demonstrating high within-group reproducibility. (c) Principal component analysis (PCA) plot illustrating global transcriptomic variation between the Control and Treatment groups. Samples within each group cluster tightly, whereas the two groups are clearly separated, indicating distinct expression profiles. (d) Violin plots showing the overall distribution of gene expression levels (log2(FPKM+1)) across samples; colors represent different experimental groups, indicating comparable expression distributions among samples.
A total of 761 differentially expressed genes (DEGs) were identified (|log2FC| ≥ 1, Padj < 0.05), including 423 upregulated and 338 downregulated genes (Figure 4). Transcriptomic shifts revealed distinct molecular adaptation to selenium exposure, particularly in redox regulation, selenium assimilation, and transport control.
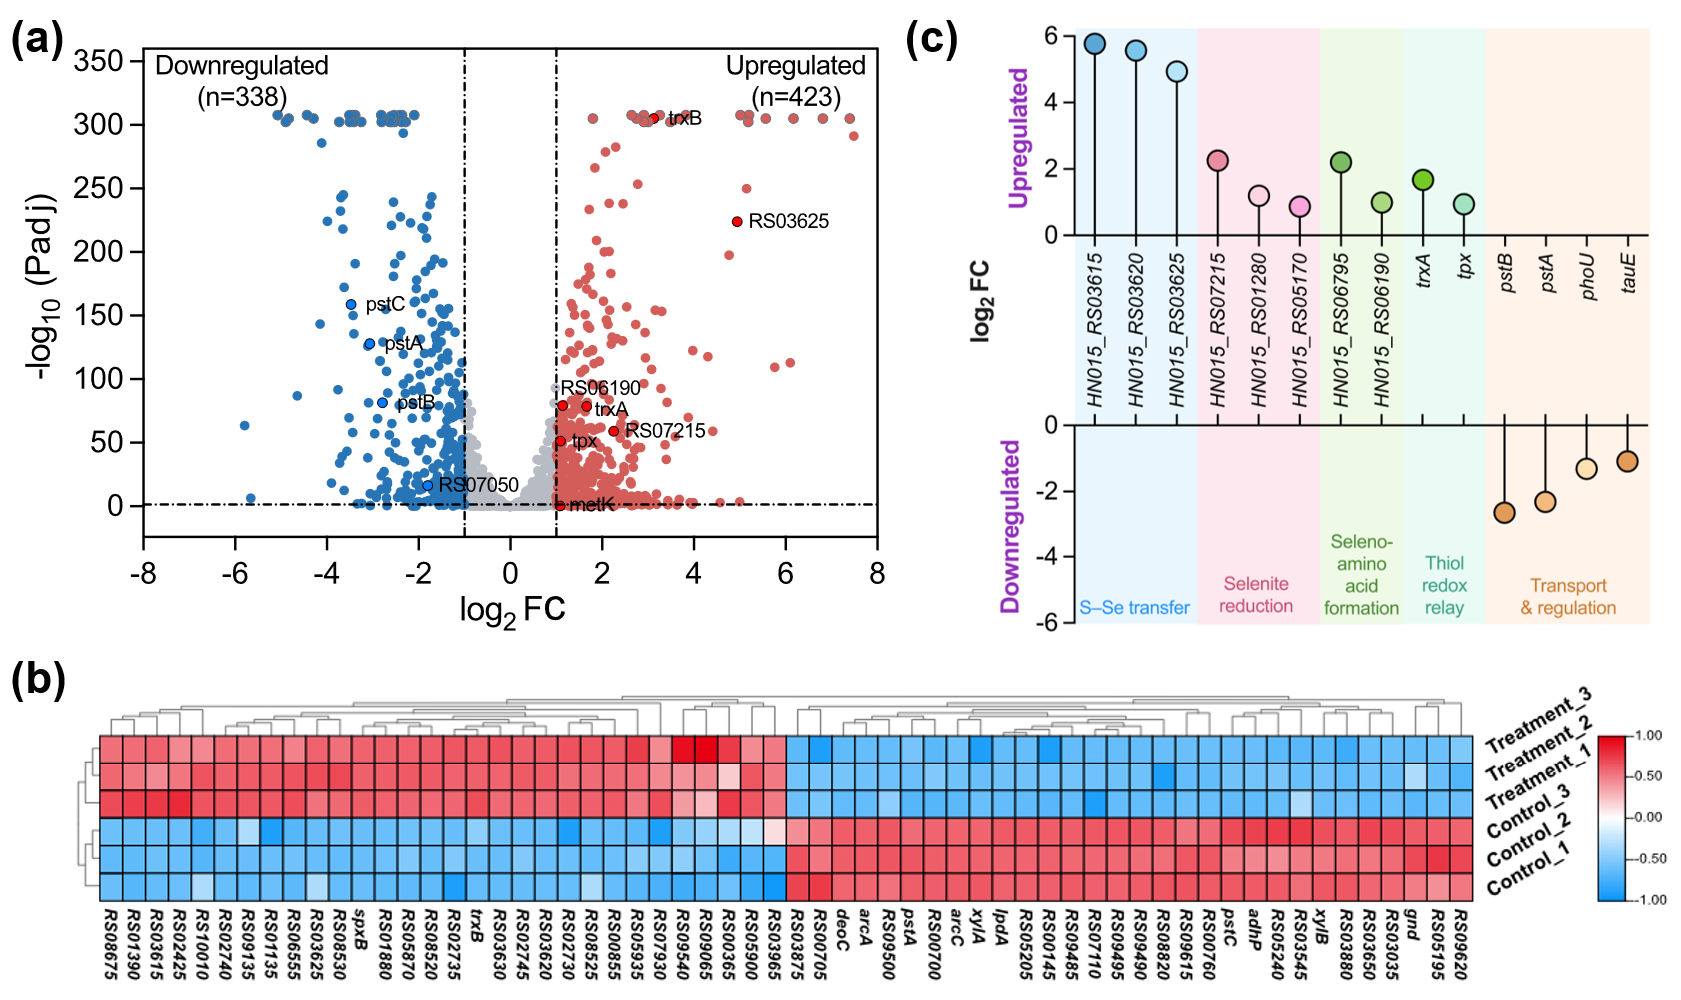
Figure 4. Overview of differential expression and functional representation of key genes involved in selenium metabolism. (a) Volcano plot illustrating the overall distribution of DEGs. Significantly up- and down-regulated genes are shown in red and blue, respectively; non-significant genes are shown in grey. Key genes are highlighted with black circles. The y-axis −log10(Padj) is capped at 305, and values exceeding this threshold are displayed as grey floating dots with slight vertical jitter. (b) Heatmap showing the expression patterns of the top 30 most significantly up- and down-regulated genes (a total of 60 genes) across samples. Color gradients from blue to red indicate low to high expression levels. (c) Lollipop plot showing the significance (y-axis, −log10(Padj)) of fourteen key genes associated with selenium metabolism. Genes positioned in the upper part of the plot represent up-regulation, while those in the lower part represent down-regulation. The five colors denote distinct functional categories of these genes in selenium metabolism, including selenoprotein synthesis, antioxidant defense, redox regulation, selenium transport and utilization, and metabolic adaptation.
3.3.1. Upregulated Genes
A large number of genes associated with redox processes and selenium metabolism were strongly induced. Multiple FMN/FAD-dependent oxidoreductases (e.g., HN015_RS09075, HN015_RS05170, HN015_RS07050, HN015_RS07215) exhibited robust upregulation, indicating an enhanced NAD(P)H-linked electron transfer system for selenite (SeO32−) reduction. Thioredoxin-related redox proteins, including trxA, trxB, and thiol peroxidase (tpx), were also significantly upregulated, consistent with intensified thiol-disulfide cycling to sustain reducing power.
Several rhodanese-like sulfurtransferases (HN015_RS03615, HN015_RS03620, HN015_RS03625, HN015_RS04060) and cysteine desulfurases (HN015_RS06795, HN015_RS06190, HN015_RS02370) were markedly induced. These enzymes are known to mediate sulfur-selenium transfer, suggesting that they convert reduced selenium intermediates (e.g., H2Se) into organic selenium species via sulfur-based pathways.
Selective upregulation was also observed in genes involved in aminoacyl-tRNA biosynthesis and methionine/cysteine metabolism, reflecting enhanced routing of selenium into translational and sulfur amino acid synthesis processes. These responses suggest the activation of machinery for the incorporation of selenium into biomolecules.
3.3.2. Downregulated Genes
Genes responsible for fundamental biosynthetic processes and other energy-demanding functions were broadly repressed. Several ribosomal protein genes (rplL, rpsD, rplP) and DNA replication regulators (dnaA, recF) exhibited marked decreases in expression, suggesting a general reduction in protein synthesis and cell proliferation under selenium stress. Likewise, genes linked to ATP generation (atpA, atpB) and key glycolytic enzymes (eno, pfkA) were downregulated, reflecting a metabolic shift away from growth-oriented pathways.
Notably, the pstABC operon, responsible for phosphate transport and potentially mediating selenite uptake, was repressed. Likewise, TauE/SafE-family transporters were downregulated, suggesting restricted transmembrane flux of inorganic anions. Suppression of iron-sulfur cluster assembly genes (e.g., sufU) and selected cysteine desulfurases during the late exponential phase may reflect a protective reduction of Fe–S cofactor assembly under redox challenge.
3.3.3. Overall Transcriptomic Patterns
Taken together, the effects of pH, substrate type, and selenite concentration depict an integrated adaptive strategy of P. acidilactici 03W under selenium stress: activation of selenium-specific reduction and assimilation pathways, and suppression of core biosynthetic and proliferative programs. Upregulation of redox-active enzymes, sulfurtransferases, and tRNA synthetase machinery supports the conversion of inorganic selenium into stabilized organic forms, while transporter suppression and metabolic downshifts help maintain intracellular redox balance.
3.4. Potential Metabolism Involved in Selenoamino Acid Biosynthesis
To clarify the biological significance of DEGs, GO and KEGG pathway annotations were used to categorize gene functions based on observed transcriptional changes. GO terms were broadly classified into three categories: biological process (BP), molecular function (MF), and cellular component (CC) (Figure 5a). In BP, the key terms included ion transmembrane transport, cell redox homeostasis, and tRNA aminoacylation, consistent with selenium-induced stress responses and redox reprogramming. Stress response and DNA repair processes also appeared among the enriched terms.
For MF, enrichment was seen in oxidoreductase activity, ATPase-coupled transport, aminoacyl-tRNA ligase activity, and sulfur compound binding. These results align with the induction of electron transfer enzymes and sulfur/selenium metabolic enzymes. Transport-related functions, including ABC transporter and ion channel activity, were also represented.
Within the CC category, cytoplasmic and membrane-associated components were the most prominent, consistent with the intracellular nature of selenium-responsive systems, including redox-related enzymes and various transmembrane transport proteins.
KEGG pathway annotation highlighted prominent changes in central redox and selenium-related metabolism (Figure 5b). Upregulated DEGs were associated with sulfur metabolism, selenocompound metabolism, aminoacyl-tRNA biosynthesis, and cysteine/methionine pathways, consistent with active selenium reduction and organic incorporation.
Significant enrichment was also detected in ABC transporter pathways and those involved in phosphate metabolism. In contrast, genes associated with glycolysis, pyruvate utilization, and oxidative phosphorylation were largely downregulated, indicating a decline in energy flux and a metabolic shift toward maintaining redox balance. Pathways related to DNA repair, folate metabolism, and cofactor production showed moderate changes, suggesting their participation in broader cellular stress responses.
GO and KEGG analyses reinforce that selenium exposure prompts a coordinated transcriptional response in P. acidilactici 03W. The main features include enhanced selenium reduction and assimilation via redox enzyme induction, sulfur-transfer activity, and amino acid biosynthesis, alongside dampened growth-related pathways. These results support the mechanistic framework of selenium detoxification through transport restriction, enzymatic reduction, and conversion into organic-bound forms.
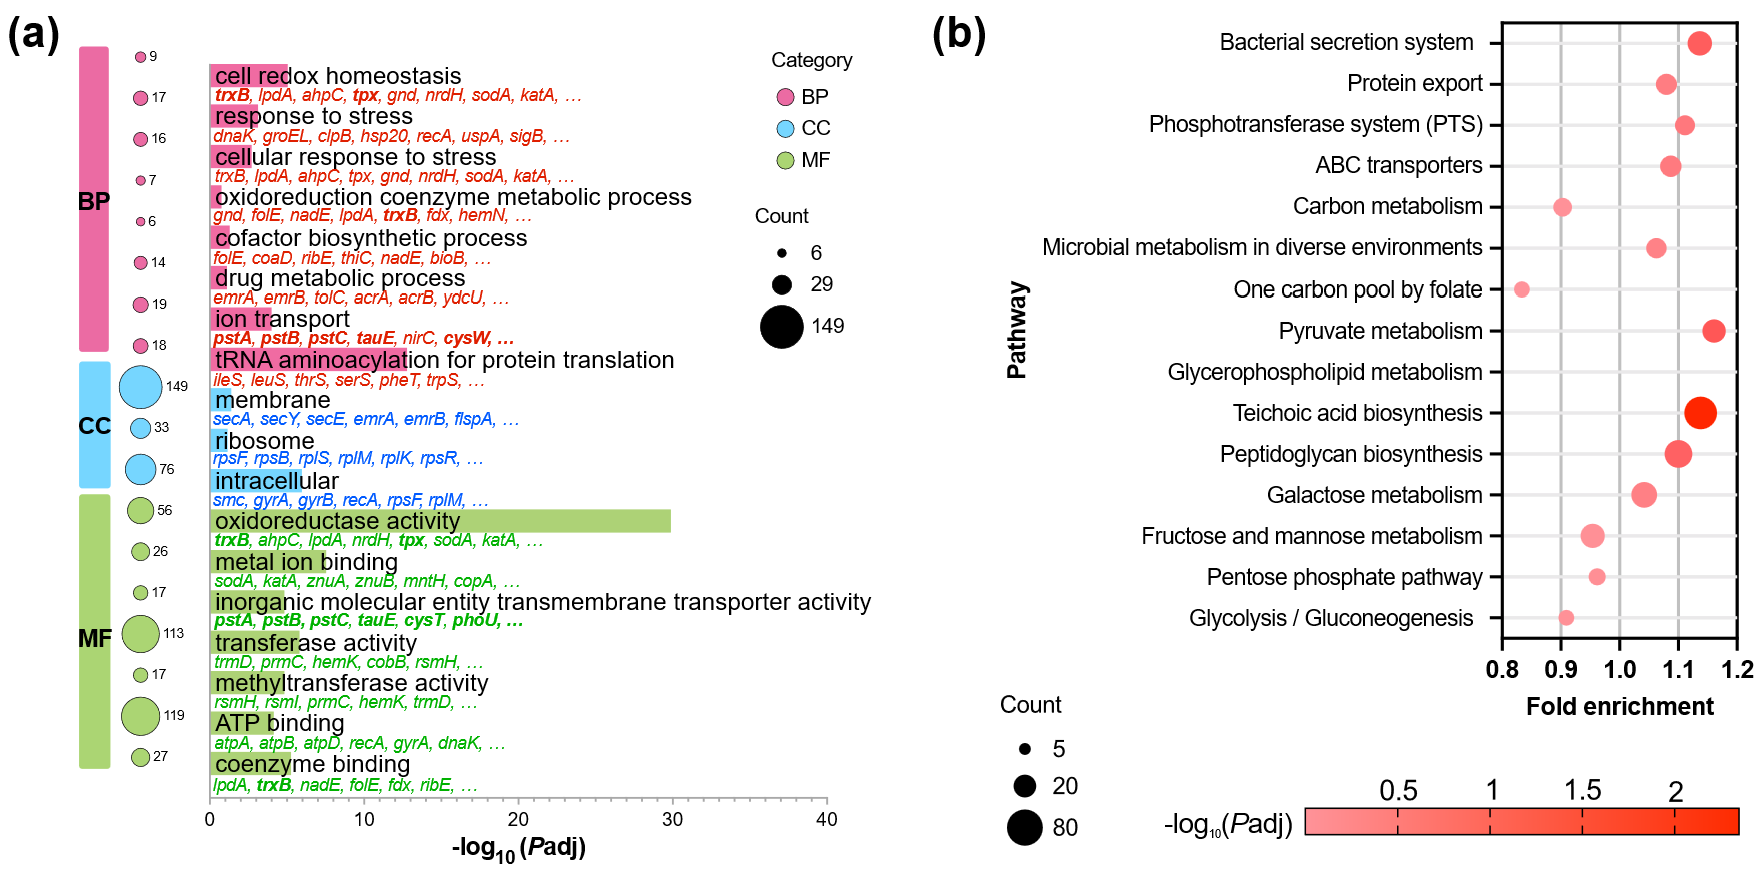
Figure 5. Functional enrichment analysis of differentially expressed genes (DEGs) in Pediococcus acidilactici 03W under selenium stress. (a) GO enrichment analysis. The top significantly enriched GO terms are grouped into three major categories: biological process (BP), cellular component (CC), and molecular function (MF). Bubble size indicates the number of DEGs associated with each GO term, and color intensity corresponds to −log10 Padj. Enriched GO terms were mainly related to metabolic processes, membrane components, and catalytic/redox activities, reflecting adaptive responses to oxidative stress induced by selenium. (b) KEGG pathway enrichment analysis. Bubble plot showing the top enriched metabolic and regulatory pathways in P. acidilactici under sodium selenite stress. The size of each bubble represents the number of DEGs involved in the pathway, while the color gradient reflects the level of statistical significance (−log10 Padj). Pathways related to redox regulation, carbon metabolism (e.g., pentose phosphate and pyruvate metabolism), and membrane adaptation (e.g., ABC transporters, peptidoglycan, and teichoic acid biosynthesis) were prominently enriched, indicating a global reprogramming of metabolic and transport systems in response to selenium exposure.
3.5. RT-qPCR Validation of RNA-Seq Patterns
To validate the reliability of the RNA-seq analysis, we selected six representative genes related to selenium stress response and selenium transformation for RT-qPCR validation. These genes cover the key processes of redox homeostasis maintenance, sulfur metabolism support, membrane transport regulation, and reductive system activation. The selected genes were trxB, tpx, cysS, nrdH, pstS, and pstA. To facilitate comparison with RNA-seq results, RT-qPCR results were presented as −ΔΔCt (i.e., log2(2−ΔΔCt)), allowing intuitive assessment of upregulation and downregulation around a baseline of 0.
As shown in Figure 6, the results indicate that RT-qPCR and RNA-seq maintained consistency in the tendency of expression changes, confirming the overall reliability of the RNA-seq differential expression conclusions. Specifically, trxB showed significant upregulation in RNA-seq (log2FC of 3.123), and RT-qPCR also confirmed stable upregulation with values of 2.193, 2.253, and 1.805 in three biological replicates, suggesting a significant enhancement in the cell’s redox homeostasis under selenium stress. Similarly, nrdH displayed consistent upregulation, indicating that responses related to the reductive system are activated under selenium treatment. In contrast, tpx and cysS showed moderate upregulation: tpx had a log2FC of 0.942 in RNA-seq, while RT-qPCR values were 0.592, 0.605, and 0.455; and cysS showed a log2FC of 0.495 in RNA-seq, with RT-qPCR values of 0.645, 0.764, and 0.455, indicating mild to moderate enhancement of oxidative stress and sulfur metabolism. In terms of membrane transport inhibition, the expression of pstS and pstA was downregulated, indicating suppression of related transport systems, which may help reduce the potential influx load and alleviate subsequent stress.
In summary, the RT-qPCR validation results are consistent with the RNA-seq differential expression patterns, confirming that the response to selenium stress in P. acidilactici 03W is achieved through the coordinated action of multiple modules, including flux control at the membrane, maintenance of redox homeostasis, and enhanced reductive power supply. These results will provide experimental support for the construction of a selenium enrichment mechanism model.
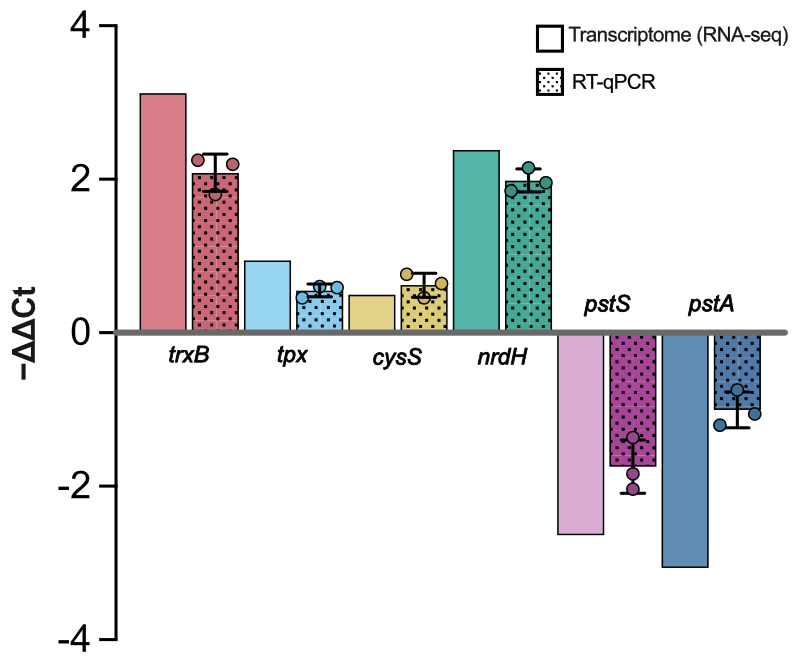
Figure 6. RT-qPCR validation of RNA-seq patterns. Comparison of expression levels of six key genes involved in selenium stress response and selenium transformation (trxB, tpx, cysS, nrdH, pstS, and pstA) under selenium treatment. The y-axis shows relative expression levels calculated using the −ΔΔCt method. Positive values indicate upregulation, while negative values indicate downregulation.
4. Discussion
The physiological optimization experiments, together with transcriptomic evidence, reveal that P. acidilactici 03W possesses remarkable adaptive plasticity to selenium stress. Its growth patterns, selenium bioconversion efficiency, and metabolic flexibility indicate a finely tuned redox regulatory network that enables the bacterium to tolerate, and even benefit from, high levels of sodium selenite. Below, we discuss how P. acidilactici 03W modulates its physiology and metabolism—from growth dynamics to molecular pathways—to cope with selenium and convert inorganic selenite into organic, bioactive forms.
4.1. Adaptive Growth and Selenium Tolerance
P. acidilactici 03W exhibited a biphasic growth response across increasing selenite concentrations. At low to moderate selenium levels (≤1000 µg·mL−1), the strain showed only a brief lag phase followed by rapid exponential growth and higher final biomass than controls. This suggests that under mild selenium stress, the bacterium quickly invokes antioxidant defenses and detoxification mechanisms to restore redox homeostasis. Indeed, transcriptomic data showed enrichment of genes involved in oxidation–reduction processes (GO:0055114) and upregulation of thioredoxin and glutathione-associated enzymes, which can provide reducing equivalents (NADPH/NADH) to convert toxic selenite into less harmful elemental or organoselenium forms [25]. The thioredoxin system (TrxA/TrxB with NADPH) is known to directly reduce selenite and facilitate its assimilation into selenoproteins [25], supporting our observation that P. acidilactici 03W effectively mitigates oxidative stress at moderate selenite doses. By contrast, at higher concentrations (≥1500 µg·mL−1), growth was markedly suppressed and the lag phase extended, indicating that excessive selenium overwhelms the cellular redox buffering capacity [26]. High selenite can rapidly deplete intracellular thiol pools (e.g., glutathione) by forming selenotrisulfide adducts, and the resultant reactive oxygen species (ROS) can damage iron–sulfur enzymes [27]. In our study, the transcriptome of cultures at 1000 µg·mL−1 selenite showed significant downregulation of the cysteine desulfurase iscS (which supplies sulfur for Fe–S cluster assembly), consistent with reports that selenite-generated superoxide impairs Fe–S clusters in enzymes [28]. This dose-dependent duality underscores that selenium acts as both a micronutrient and a stressor: below a threshold, P. acidilactici induces protective mechanisms to detoxify selenite; above that threshold, oxidative damage and metabolic disruption impede growth.
4.2. Carbon Source-Dependent Selenium Biotransformation
The choice of carbon source significantly influences the ability of P. acidilactici 03W to biotransform inorganic selenium into organic selenium species. While hexose sugars (glucose and fructose) are traditionally thought to drive glycolysis and the pentose phosphate pathway (PPP), providing NAD(P)H to facilitate the reduction of selenite into organic selenium, the transcriptomic data from this study indicate a different metabolic strategy under selenium stress.
In this study, we observed that key genes in glycolysis and the PPP, such as pfkA (phosphofructokinase), gapA (glyceraldehyde-3-phosphate dehydrogenase), zwf (glucose-6-phosphate dehydrogenase), and gnd (6-phosphogluconate dehydrogenase), were downregulated under selenium exposure. This suggests that the metabolic flux diverged from the typical pattern through these pathways. Specifically, this downregulation indicates that P. acidilactici 03W does not primarily rely on NAD(P)H generated by these pathways for selenite reduction, which contrasts with the expected selenium biotransformation process.
Despite the downregulation of glycolysis and PPP, P. acidilactici 03W compensates for the reduced redox balance and selenium reduction needs by enhancing other metabolic pathways. Notably, the genes related to redox balance and sulfur-selenium transfer, including trxA and trxB, tpx, and sulfur transferases (such as rhodanese and cysteine desulfurase), were upregulated. These findings suggest that P. acidilactici 03W utilizes sulfur-based redox systems to maintain intracellular reducing equivalents, which are crucial for reducing selenite to elemental selenium or organic selenium (such as selenocysteine and selenomethionine). By activating these redox systems, the cells are able to effectively convert selenium intermediates into stable organic selenium forms, especially when traditional carbon metabolic pathways are suppressed.
When hexose sugars like glucose and fructose are used as carbon sources, P. acidilactici 03W still exhibits efficient selenium conversion, despite the downregulation of glycolysis and the PPP. The key factor may be that these hexose sugars indirectly contribute to redox balance. Even with the downregulation of traditional metabolic pathways, glucose and fructose can be utilized through alternative carbon source pathways, such as fatty acid oxidation and amino acid metabolism, which support NAD(P)H regeneration for selenium reduction.
Interestingly, pentose sugars such as arabinose are poor at supporting selenium assimilation. This is because pentose metabolism produces less NADPH unless it extensively engages the PPP, and NADPH is crucial to the reduction of selenite and its conversion into organic forms. The lower efficiency of pentose sugars is reflected in the growth and selenium accumulation data, highlighting the key role of NADPH in these reactions.
4.3. Influence of pH on Selenium Uptake and Cell Viability
Environmental pH had a profound impact on both the growth of P. acidilactici 03W and its selenium uptake capacity. We observed that mildly acidic conditions (initial pH 5–6) enabled optimal bacterial growth and maximal selenium accumulation in the biomass. In this range, the strain grew rapidly and converted selenite to red elemental Se with high efficiency. By comparison, at alkaline pH (≥9), the cells grew poorly and incorporated over 30× less selenium (e.g., <60 µg·g−1 at pH 9). These results clearly show that P. acidilactici 03W performs selenium biotransformation most effectively in a mildly acidic milieu, whereas it is severely limited in alkaline environments. Notably, lactic acid bacteria in general are adapted to acidic niches: for example, P. acidilactici DSM 20284 was reported to achieve 90% selenite removal at an initial medium pH of 4.5–5.0, while its growth was inhibited at pH values below 4.0 [15]. The superior performance of strain 03W at pH 5–6 is therefore consistent with the notion that fermented-food organisms thrive in slightly acidic conditions typical of their natural habitats.
From a mechanistic perspective, a slightly acidic pH likely improves both transport and enzymatic reduction of selenite [29]. At lower external pH, the proton motive force across the cell membrane is enhanced, which can drive the uptake of selenite via proton-coupled transporters. In addition, many redox enzymes involved in selenite reduction (such as flavoprotein reductases or thioredoxin-dependent enzymes) have optimal activity in the acidic-to-neutral pH range, where essential thiol groups remain protonated and reactive. Our transcriptomic analysis further suggests that a homeostatic “valve” mechanism is at work. Under selenium exposure, we found that high-affinity inorganic anion transporters—notably the phosphate uptake system PstA/PstB/PstC—were actually downregulated in strain 03W at pH 6. This counterintuitive repression may serve as negative feedback to prevent excessive selenite influx once the intracellular selenium pool builds up. In other words, when conditions are ideal for rapid Se reduction (as at pH 5–6), the cell can afford to limit active import of selenite to avoid toxicity. Even with PstABC transporters toned down, residual selenite still enters the cell through lower-affinity routes (e.g., promiscuous MFS-type anion carriers or simple diffusion) and is immediately reduced and assimilated. This balance ensures that net Se uptake remains high at pH 5–6 without overwhelming the cell’s detoxification capacity.
In alkaline conditions, by contrast, multiple factors conspire to diminish selenite uptake and reduction. A higher external pH collapses the proton gradient on which many import systems rely, making it energetically unfavorable to import selenite anions into the cell. At the same time, key thiol-dependent enzymes likely suffer from deprotonation of cysteine residues in their active sites, drastically reducing their catalytic activity. As a result, any selenite that does enter is reduced much more slowly. There is also the possibility that, at high pH, some selenite may convert to forms that are less readily transported or biologically accessible (e.g., ionized species or precipitates). The net outcome is a severe drop in selenium assimilation (to only tens of µg·g−1) accompanied by heightened oxidative stress and lower cell viability at pH ≥ 9.0. This stark difference underscores how pH stress compounds selenium stress: when external conditions are far from the organism’s preferred acidity, its defenses against selenite toxicity falter.
Overall, our findings reinforce that lactic acid bacteria convert selenium most efficiently in mildly acidic environments typical of fermented foods. P. acidilactici 03W is no exception—it requires a narrow pH window around 5–6 to coordinate membrane transport with intracellular reduction optimally. Outside this window, either the selenite import is throttled or the reduction capacity is overwhelmed, leading to suboptimal selenium uptake. By maintaining the culture pH near the optimum (6.0), one can achieve maximal selenium bioaccumulation in this strain. These insights into pH effects, together with the earlier results on substrate and selenite concentration, portray a coherent adaptive response by P. acidilactici 03W. Under favorable conditions (moderate selenite levels, suitable carbon source, and pH 6), the bacterium maximizes Se uptake and rapidly converts selenite to organic or elemental forms. Outside these conditions, it either induces stress mitigation responses or suffers toxicity, limiting selenium incorporation. This understanding sets the stage for exploring the underlying molecular mechanisms, as we next examine transcriptomic insights into the strain’s selenium response.
4.4. Transcriptomic Insights into the Selenium Response
Global RNA-seq profiling indicates that selenium exposure elicits a coordinated reprogramming centered on four modules that together explain the conversion of inorganic selenium into organic/low-toxicity forms: (i) transport and flux control, (ii) an NAD(P)H-driven reductive hub, (iii) sulfur–selenium transfer and organic anchoring, and (iv) an amino acid/tRNA layer that provides the receiving scaffold. This architecture recurs across time points and gene families, suggesting a systems-level adaptation rather than isolated gene effects.
Transport and flux control. The phosphate-type transporter operon pstA/pstB/pstC and TauE/SafE-family exporters are transcriptionally repressed under selenium stress. This pattern supports a flux-throttling (“valve”) model in which high-capacity inorganic anion channels are dialed down to avoid uncontrolled selenite influx and futile efflux cycling when intracellular selenium begins to accumulate [30]. Despite repression of these major ports, net uptake still proceeds through residual, non-specific anion routes (e.g., broad-specificity carriers of the MFS class and basal membrane permeability), ensuring a low-but-processable input that matches downstream reductive capacity.
Reductive hub. A large set of FMN/FAD-dependent oxidoreductases (e.g., HN015_RS09075, HN015_RS05170, HN015_RS07050, HN015_RS07215) is strongly induced, together with the thioredoxin system (trxB, trxA) and thiol peroxidase (tpx). These components form an NAD(P)H-linked electron relay that reduces Se(IV) to elemental selenium (Se0) and hydrogen selenide (H2Se) while maintaining a reduced intracellular thiol pool [25,31]. Functionally, this hub both detoxifies (via Se0 deposition) and generates the reactive donor (H2Se) required for organic incorporation [32].
Sulfur-selenium transfer and organic anchoring. Multiple rhodanese-like sulfurtransferases (e.g., HN015_RS03615/RS03620/RS03625/RS04060) and cysteine desulfurases (e.g., HN015_RS06795/RS06190/
RS02370) are upregulated. These enzymes catalyze sulfur↔selenium exchange through persulfide/perselenide intermediates [33], channeling H2Se onto amino acid or protein acceptors to form selenocysteine/selenomethionine pools and protein-bound selenium [34,35].
Amino acid/tRNA layer. Selective increases in aminoacyl-tRNA biosynthesis and cysteine/methionine metabolism provide the molecular scaffolds and translational context that stabilize organic selenium within macromolecules. Notably, the dataset does not support the presence of the canonical UGA-dependent selenoprotein machinery (selD/selA/selB), consistent with a non-canonical, generalist assimilation route dominated by reduction and sulfur–selenium transfer chemistry [3,36,37].
Collectively, the transcriptome supports a low-influx/high-conversion strategy: entry is constrained by transporter repression, while intracellular reduction and transfer pathways are amplified to convert whatever selenite enters into Se0 and organic, protein-associated forms. However, further dose–response and time-course designs (including late-log-phase or stationary-phase additions of selenite) would provide complementary insights into acute responses.
4.5. Mechanism of Selenium Uptake and Transformation in P. acidilactici 03W
Drawing on these transcriptomic signatures, we propose a three-stage mechanism for selenium assimilation in P. acidilactici 03W (Figure 7).
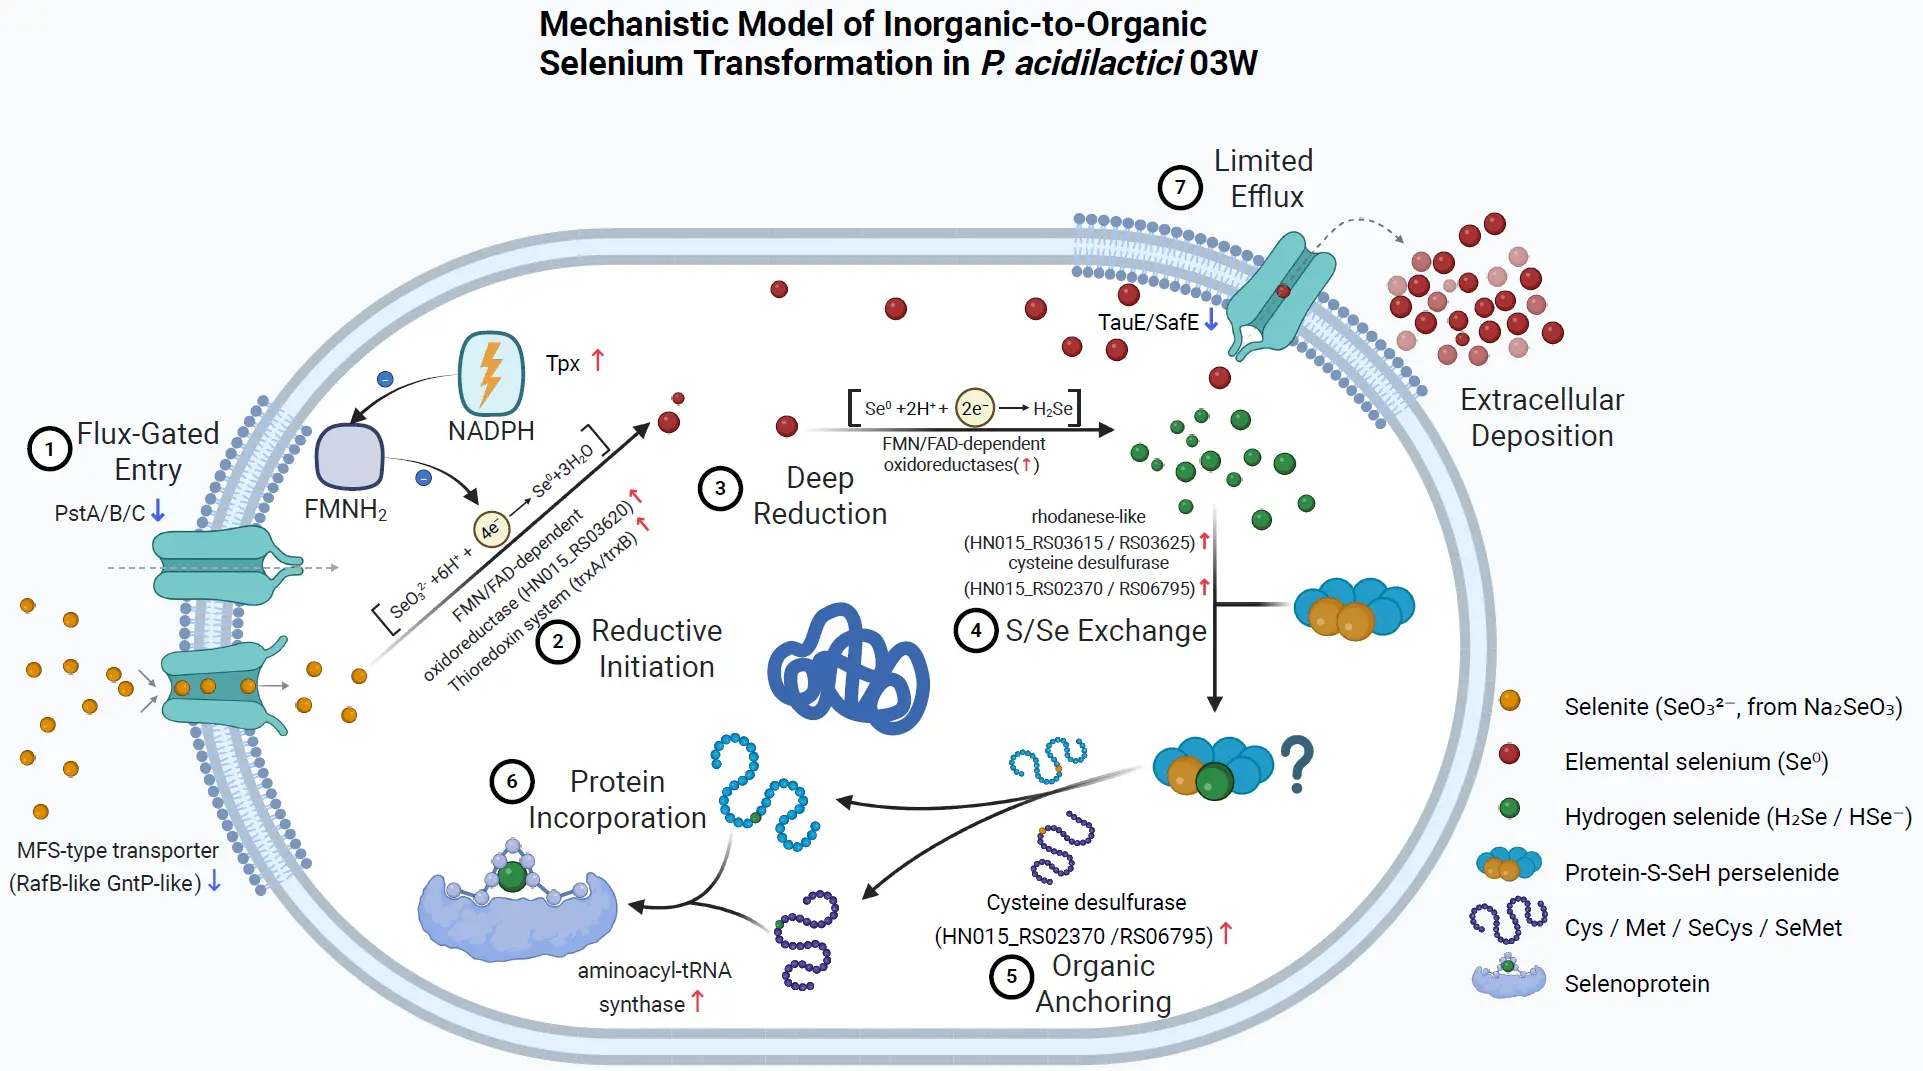
Figure 7. Scheme of the potential mechanism for selenium assimilation in P. acidilactici 03W. The model summarizes a “low-influx / high-conversion” strategy comprising controlled anion entry, NAD(P)H-driven reduction, sulfur–selenium transfer, and incorporation into organic selenium pools and proteins. (1) Flux-gated entry. Selenite (SeO32−) enters the cell mainly via anion transport routes; transcriptomic signals suggest downregulation of high-affinity phosphate uptake components (PstA/B/C ↓) and reduced activity of MFS-type transporters, consistent with throttling net influx to match cellular reductive capacity. (2) Reductive initiation. Intracellular reducing equivalents (e.g., NADPH) and thiol-based redox systems (e.g., thioredoxin/peroxidase axis; Tpx ↑) initiate reduction of selenite and maintain redox homeostasis under selenium stress. (3) Deep reduction. FMN/FAD-dependent oxidoreductases (induced) further reduce Se(IV) toward elemental selenium (Se0) and/or hydrogen selenide (H2Se/HSe-), providing reactive selenium donors for downstream assimilation. (4) S/Se exchange. Rhodanese-like sulfurtransferases and related enzymes mediate sulfur–selenium exchange, generating perselenide/persulfide-type intermediates that channel selenium into organic pathways. (5) Organic anchoring. Cysteine desulfurases (upregulated) and Cys/Met metabolism provide acceptor scaffolds, enabling formation of selenium-containing amino acids (SeCys/SeMet) and protein-bound selenium species. (6) Protein incorporation. Aminoacyl-tRNA synthetase/translation-linked processes support incorporation of selenium into proteins (selenoprotein/protein-bound Se), stabilizing selenium in low-toxicity organic forms. (7) Limited efflux and extracellular deposition. Export systems (e.g., TauE/SafE-type; TauE/SafE ↓) are constrained, favoring intracellular retention/assimilation; meanwhile, a fraction of Se0 may be deposited extracellularly as red particles. Solid arrows indicate proposed primary selenium transformation/assimilation flow; dashed arrows indicate limited or secondary flux (e.g., restricted efflux in step 7). Red ↑/blue ↓ denote genes/proteins up- or down-regulated under Na₂SeO₃ exposure (omics-based comparison). The “?” marks a putative intermediate/step not experimentally confirmed (e.g., the exact identity/chemistry of protein-bound selenium species and/or the transfer route). Cartoons are schematic representations of putative proteins/complexes and are not to scale.
Stage I—Flux throttling at the membrane (Transport “valve”). Major inorganic anion conduits (PstA/PstB/PstC) and TauE/SafE exporters are downregulated, establishing a controlled, low-throughput influx of selenite. Uptake is thereby limited to residual, promiscuous anion pathways (e.g., MFS-type carriers and basal permeability) [38]. This “valve” prevents overload and keeps intracellular selenium within a manageable processing window.
Stage II—NAD(P)H-driven reduction to Se0 and H2Se (Reductive hub). Induced FMN/FAD oxidoreductases (HN015_RS09075/RS05170/RS07050/RS07215) act in concert with TrxA/TrxB and Tpx to channel electrons from NAD(P)H to Se(IV). The pathway yields Se0 (detoxification end-product) and H2Se, the proximate selenium donor for biosynthetic incorporation. The same network sustains thiol redox homeostasis, enabling iterative reduction without excessive oxidative damage [39,40].
Stage III—Sulfur–selenium transfer and organic anchoring. Rhodanese-like sulfurtransferases (HN015_RS03615/RS03620/RS03625/RS04060) and cysteine desulfurases (HN015_RS06795/RS06190/
RS02370) convert H2Se into Se-bearing amino acids and protein-bound selenium via perselenide intermediates, while aminoacyl-tRNA/Cys–Met metabolism provides the receiving scaffolds that stabilize the organic selenium fraction. In parallel, a fraction of selenium is mineralized as Se0 (SeNPs), further lowering toxicity; with TauE/SafE repressed, intracellular retention favors assimilation over rapid efflux.
5. Conclusions and Future Prospects
In summary, P. acidilactici 03W demonstrates strong selenium-transforming capability, converting more than 80% of supplied selenite into organic selenium species under optimized conditions. Through metabolic reconfiguration and stress-response modulation, the strain can tolerate selenium levels that are normally toxic while simultaneously generating valuable seleno-amino acids and elemental Se nanoparticles [39]. Its robustness is supported by the coordinated activation of NADPH-dependent antioxidant defenses, energy-yielding pathways, and genes involved in sulfur and selenium metabolism. These findings deepen our understanding of microbial selenium assimilation and underscore the biotechnological potential of P. acidilactici 03W in functional food development, particularly for producing selenium-enriched probiotics or fermented products intended as dietary supplements. Unlike other general lactic acid bacteria, which often exhibit limited selenium enrichment and transformation capacities, P. acidilactici 03W shows exceptional tolerance to higher concentrations of selenite and efficiently converts inorganic selenium to organic forms such as selenocysteine and selenomethionine. This unique ability of P. acidilactici 03W stems from its finely tuned metabolic regulation, particularly in selenium assimilation and antioxidant responses, distinguishing it from other reported selenium-enriching LAB.
Looking ahead, several avenues merit exploration. Our transcriptomic analysis implicated the glutathione and thioredoxin systems in selenite reduction; however, direct assays of enzyme activity (e.g., glutathione peroxidase or reductase activities) were not conducted in this study. Future work combining proteomics and enzyme kinetics will be important to confirm the roles of specific seleno-enzymes and to identify any novel selenoproteins expressed by P. acidilactici 03W. Also, knocking out or overexpressing the most up/down-regulated genes responsible for selenium transformation (e.g., trxB, tpx, cysS, nrdH, pstS, and pstA) will largely help explain the mechanisms of selenium enriching by integrating with checking the seleno-metabolites concentrations or other Se-related events. Another interesting aspect is the fate of the elemental Se nanoparticles: microscopic observations and extracellular polymer characterization could determine whether the Se0 produced is bound to cell surfaces, sequestered by exopolysaccharides, or actively exported. Such information could inform how to harvest or enhance Se nanoparticle production. Moreover, accurate measurement of SeMet and SeCys2 concentrations will provide additional insights into the biosynthesis of these bioactive molecules before developing P. acidilactici 03W as a potential selenium-enriching LAB. Additionally, while P. acidilactici 03W performs impressively in vitro; its performance in vivo (e.g., in the gut environment) remains to be tested. Evaluating the strain’s stability, safety, and selenium-enrichment capacity in animal models or human trials would be a crucial step toward practical use. If it can retain its ability to biotransform selenium in the gastrointestinal tract, it might improve selenium bioavailability or antioxidant status in the host. Overall, our findings lay a strong foundation for leveraging P. acidilactici 03W in the development of next-generation, selenium-fortified probiotic foods [41]. By bridging the gap between microbial physiology and nutrition, such innovations could lead to safer, more effective dietary selenium supplementation in the future.
Supplementary Materials
The following supporting information can be found at: https://www.sciepublish.com/article/pii/861, Table S1: Composition of MRS basal medium; Table S2: Primers for 16S rRNA gene amplification; Table S3: PCR reaction mixture and thermocycling program for 16S rRNA gene amplification; Table S4: RNA extraction, library preparation, and sequencing; Table S5: Key selenium-related genes highlighted by RNA-seq; Table S6: GO enrichment analysis of selenium-responsive genes (top terms); Table S7: KEGG pathway enrichment of selenium-responsive genes (top 15). Supplementary Data S1: Complete list of differentially expressed genes (DEGs) identified by RNA-seq in response to selenium treatment, including gene annotation and differential expression statistics; Supplementary Data S2: Complete Gene Ontology (GO) enrichment results of selenium-responsive genes, including enriched biological process (BP), molecular function (MF), and cellular component (CC) terms; Supplementary Data S3: Complete KEGG pathway enrichment results of selenium-responsive genes, showing significantly enriched metabolic and signaling pathways.
Author Contributions
Conceptualization: X.L.; Methodology: K.C., X.T.; Investigation: K.C., X.T., G.L.; Formal analysis: K.C., X.T.; Data curation: K.C.; Writing—original draft: K.C.; Writing—review & editing: X.L.; Visualization: K.C.; Supervision: Y.Z., X.L.; Project administration: X.L.; Funding acquisition: X.L.
Ethics Statement
Not applicable.
Informed Consent Statement
Not applicable.
Data Availability Statement
Data will be made available on request.
Funding
This study was supported by the Fundamental Research Funds for the Central Universities (Grant Nos. 30922010305 and 1225011021289).
Declaration of Competing Interest
The authors declare that they have no known competing financial interests or personal relationships that could have appeared to influence the work reported in this paper.
References
-
Rayman MP. Selenium and human health. Lancet 2012, 379, 1256–1268. DOI:10.1016/S0140-6736(11)61452-9 [Google Scholar]
-
Chavatte L, Lange L, Schweizer U, Ohlmann T. Understanding the role of tRNA modifications in UGA recoding as selenocysteine in eukaryotes. J. Mol. Biol. 2025, 437, 169017. DOI:10.1016/j.jmb.2025.169017 [Google Scholar]
-
Turanov AA, Lobanov AV, Hatfield DL, Gladyshev VN. UGA codon position-dependent incorporation of selenocysteine into mammalian selenoproteins. Nucleic Acids Res. 2013, 41, 6952–6959. DOI:10.1093/nar/gkt409 [Google Scholar]
-
Li SJ, Wang AW, Huang KL, Yang Y. Recent Advances on Selenium Nutrition and Keshan Disease. Int. Heart J. 2024, 65, 173–179. DOI:10.1536/ihj.23-628 [Google Scholar]
-
Liao Q, Yan C, Huang N, Li X. Progress in selenium and genetics associated with Keshan disease. J. Trace Elem. Miner. 2024, 7, 100107. DOI:10.1016/j.jtemin.2023.100107 [Google Scholar]
-
Chen H, Du G, Yan X, Ye H, Guo Q, Wang Z, et al. Selenium-Enriched Pediococcus acidilactici MRS-7 Alleviates Patulin-Induced Jejunum Injuries in Mice and Its Possible Mechanisms. J. Agric. Food Chem. 2022, 70, 4755–4764. DOI:10.1021/acs.jafc.2c00949 [Google Scholar]
-
Eswayah AS, Smith TJ, Gardiner PHE. Microbial Transformations of Selenium Species of Relevance to Bioremediation. Appl. Environ. Microbiol. 2016, 82, 4848–4859. DOI:10.1128/AEM.00877-16 [Google Scholar]
-
Trippe RC, Pilon-Smits EAH. Selenium transport and metabolism in plants: Phytoremediation and biofortification implications. J. Hazard. Mater. 2021, 404, 124178. DOI:10.1016/j.jhazmat.2020.124178 [Google Scholar]
-
Chen J, Jia Y, Chensheng H, Feng L, Li Y, Jian T, et al. Study on the Probiotic Properties of Xinjiang-Characteristic Selenium-Enriched Lactic Acid Bacteria and the Distribution of Selenium Element. Foods 2025, 14, 3577. DOI:10.3390/foods14203577 [Google Scholar]
-
Peng M, Li Q, Long B, Li B, Shen Z, Xu N, et al. Selenium-enriched lactic acid bacteria inoculation enhances the quality of Paocai by imparting the microbiome and metabolome. Food Chem. 2025, 486, 144644. DOI:10.1016/j.foodchem.2025.144644 [Google Scholar]
-
Li R, Chen W, Huang S, Jiang D, Zhu Z, Li C, et al. Three bacterial strains efficiently reduce selenite to selenium nanoparticles in cell membranes. BMC Microbiol. 2025, 25, 564. DOI:10.1186/s12866-025-04304-w [Google Scholar]
-
Gökmen GG, Sarıyıldız S, Cholakov R, Nalbantsoy A, Baler B, Aslan E, et al. A novel Lactiplantibacillus plantarum strain: Probiotic properties and optimization of the growth conditions by response surface methodology. World J. Microbiol. Biotechnol. 2024, 40, 66–66. DOI:10.1007/s11274-023-03862-3 [Google Scholar]
-
Pophaly SD, Poonam, Singh P, Kumar H, Tomar SK, Singh R. Selenium enrichment of lactic acid bacteria and bifidobacteria: A functional food perspective. Trends Food Sci. Technol. 2014, 39, 135–145. DOI:10.1016/j.tifs.2014.07.006 [Google Scholar]
-
Stabnikova O, Khonkiv M, Kovshar I, Stabnikov V. Biosynthesis of selenium nanoparticles by lactic acid bacteria and areas of their possible applications. World J. Microbiol. Biotechnol. 2023, 39, 230. DOI:10.1007/s11274-023-03673-6 [Google Scholar]
-
Wang Q, Wang C, Kuang S, Wang D, Shi Y. Biological Selenite Reduction, Characterization and Bioactivities of Selenium Nanoparticles Biosynthesised by Pediococcus acidilactici DSM20284. Molecules 2023, 28, 3793. DOI:10.3390/molecules28093793 [Google Scholar]
-
Chen H, Wang X, Yue Y, Wang X, Zeng X, Guo Q, et al. Enrichment and Distribution of Selenium in Pediococcus acidilactici MRS-7: Impact on Its Biochemical Composition, Microstructure, and Gastrointestinal Survival. J. Agric. Food Chem. 2022, 70, 14877–14885. DOI:10.1021/acs.jafc.2c06765 [Google Scholar]
-
Zhong B, Xu W, Gong M, Xian W, Xie H, Wu Z. Molecular mechanisms of selenite reduction by Lactiplantibacillus plantarum BSe: An integrated genomic and transcriptomic analysis. J. Hazard. Mater. 2024, 468, 133850. DOI:10.1016/j.jhazmat.2024.133850 [Google Scholar]
-
Luo L, Hou X, Yi D, Deng G, Wang Z, Peng M. Selenium-Enriched Microorganisms: Metabolism, Production, and Applications. Microorganisms 2025, 13, 1849–1849. DOI:10.3390/microorganisms13081849 [Google Scholar]
-
Mapelli V, Hillestrøm PR, Patil K, Larsen EH, Olsson L. The interplay between sulphur and selenium metabolism influences the intracellular redox balance in Saccharomyces cerevisiae. FEMS Yeast Res. 2012, 12, 20–32. DOI:10.1111/j.1567-1364.2011.00757.x [Google Scholar]
-
Peng T, Lin J, Xu Y-Z, Zhang Y. Comparative genomics reveals new evolutionary and ecological patterns of selenium utilization in bacteria. ISME J. 2016, 10, 2048–2059. DOI:10.1038/ismej.2015.246 [Google Scholar]
-
Kayrouz CM, Seyedsayamdost MR. Enzymatic strategies for selenium incorporation into biological molecules. Curr. Opin. Chem. Biol. 2024, 81, 102495. DOI:10.1016/j.cbpa.2024.102495 [Google Scholar]
-
Mörschbächer AP, Dullius A, Dullius CH, Bandt CR, Kuhn D, Brietzke DT, et al. Assessment of selenium bioaccumulation in lactic acid bacteria. J. Dairy Sci. 2018, 101, 10626–10635. DOI:10.3168/jds.2018-14852 [Google Scholar]
-
Kousha M, Yeganeh S, Keramat Amirkolaie A. Effect of sodium selenite on the bacteria growth, selenium accumulation, and selenium biotransformation in Pediococcus acidilactici. Food Sci. Biotechnol. 2017, 26, 1013–1018. DOI:10.1007/s10068-017-0142-y [Google Scholar]
-
Zan L, Chen Z, Zhang B, Zou X, Lan A, Zhang W, et al. Screening, Characterization and Probiotic Properties of Selenium-Enriched Lactic Acid Bacteria. Fermentation 2024, 10, 39. DOI:10.3390/fermentation10010039 [Google Scholar]
-
Shimizu A, Tobe R, Aono R, Inoue M, Hagita S, Kiriyama K, et al. Initial Step of Selenite Reduction via Thioredoxin for Bacterial Selenoprotein Biosynthesis. Int. J. Mol. Sci. 2021, 22, 10965. DOI:10.3390/ijms222010965 [Google Scholar]
-
Kolbert Z, Molnár Á, Feigl G, Van Hoewyk D. Plant selenium toxicity: Proteome in the crosshairs. J. Plant Physiol. 2019, 232, 291–300. DOI:10.1016/j.jplph.2018.11.003 [Google Scholar]
-
Fisher B, Yarmolinsky D, Abdel-Ghany S, Pilon M, Pilon-Smits EA, Sagi M, et al. Superoxide generated from the glutathione-mediated reduction of selenite damages the iron-sulfur cluster of chloroplastic ferredoxin. Plant Physiol. Biochem. 2016, 106, 228–235. DOI:10.1016/j.plaphy.2016.05.004 [Google Scholar]
-
Talib EA, Outten CE. Iron-sulfur cluster biogenesis, trafficking, and signaling: Roles for CGFS glutaredoxins and BolA proteins. Biochim. Et Biophys. Acta (BBA)—Mol. Cell Res. 2021, 1868, 118847. DOI:10.1016/j.bbamcr.2020.118847 [Google Scholar]
-
Zhang Y, Liu S, Shi X, Zhang G, Wei Q, Wu C, et al. Metal and pH stress regulate selenite reduction in anaerobic membrane bioreactor: Mechanistic insights into microbial interactions. Int. Biodeterior. Biodegrad. 2025, 204, 106155. DOI:10.1016/j.ibiod.2025.106155 [Google Scholar]
-
Jackson RJ, Binet MRB, Lee LJ, Ma R, Graham AI, McLeod CW, et al. Expression of the PitA phosphate/metal transporter of Escherichia coli is responsive to zinc and inorganic phosphate levels. FEMS Microbiol. Lett. 2008, 289, 219–224. DOI:10.1111/j.1574-6968.2008.01386.x [Google Scholar]
-
Xia X, Wu S, Li N, Wang D, Zheng S, Wang G. Novel bacterial selenite reductase CsrF responsible for Se(IV) and Cr(VI) reduction that produces nanoparticles in Alishewanella sp. WH16-1. J. Hazard. Mater. 2018, 342, 499–509. DOI:10.1016/j.jhazmat.2017.08.051 [Google Scholar]
-
Qiao L, Dou X, Song X, Chang J, Zeng X, Zhu L, et al. Selenite Bioremediation by Food-Grade Probiotic Lactobacillus casei ATCC 393: Insights from Proteomics Analysis. Microbiol. Spectr. 2023, 11, e00659-23. DOI:10.1128/spectrum.00659-23 [Google Scholar]
-
Wang Y, Ye Q, Sun Y, Jiang Y, Meng B, Du J, et al. Selenite Reduction by Proteus sp. YS02: New Insights Revealed by Comparative Transcriptomics and Antibacterial Effectiveness of the Biogenic Se0 Nanoparticles. Front. Microbiol. 2022, 13, 845321. DOI:10.3389/fmicb.2022.845321 [Google Scholar]
-
Chelsea TYJ, Chengzhi Z, Marufa N, Leo OR, Rabeb D, Leah R, et al. Control of Bacterial Sulfite Detoxification by Conserved and Species-Specific Regulatory Circuits. Front. Microbiol. 2019, 10, 960. DOI:10.3389/fmicb.2019.00960 [Google Scholar]
-
Ying Y, Jiawei J, Shuling F, Zhuo C, Yuanyuan Q. Unraveling the molecular mechanisms of selenite reduction: Transcriptomic analysis of Bacillus reveals the key role of sulfur assimilation. Biotechnol. Lett. 2023, 45, 1513–1520. DOI:10.1007/s10529-023-03439-y [Google Scholar]
-
Howard MT, Carlson BA, Anderson CB, Hatfield DL. Translational redefinition of UGA codons is regulated by selenium availability. J. Biol. Chem. 2013, 288, 19401–19413. DOI:10.1074/jbc.M113.481051 [Google Scholar]
-
Manta B, Makarova NE, Mariotti M. The selenophosphate synthetase family: A review. Free. Radic. Biol. Med. 2022, 192, 63–76. DOI:10.1016/j.freeradbiomed.2022.09.007 [Google Scholar]
-
Liao J, Wang C. Factors affecting selenium-enrichment efficiency, metabolic mechanisms and physiological functions of selenium-enriched lactic acid bacteria. J. Future Foods 2022, 2, 285–293. DOI:10.1016/j.jfutfo.2022.08.001 [Google Scholar]
-
Martínez FG, Moreno-Martin G, Pescuma M, Madrid-Albarrán Y, Mozzi F. Biotransformation of Selenium by Lactic Acid Bacteria: Formation of Seleno-Nanoparticles and Seleno-Amino Acids. Front. Bioeng. Biotechnol. 2020, 8, 506. DOI:10.3389/fbioe.2020.00506 [Google Scholar]
-
Krausova G, Kana A, Hyrslova I, Mrvikova I, Kavkova M. Development of Selenized Lactic Acid Bacteria and their Selenium Bioaccummulation Capacity. Fermentation 2020, 6, 91. DOI:10.3390/fermentation6030091 [Google Scholar]
-
Ochi A, Mihara H. Effects of genetic disruption in thioredoxin and glutathione systems on selenium nanoparticle formation, selenite sensitivity, and selenoprotein biosynthesis in Escherichia coli. Met. Res. 2024, 4, reg14–reg20. DOI:10.11299/metallomicsresearch.MR202401 [Google Scholar]