Effect of Aluminum and Aluminum Nitride on Some Thermophysical Properties of Polyamide 6/High-Density Polyethylene and Styrene-Ethylene-Butadiene-Styrene/Polypropylene Blends

Effect of Aluminum and Aluminum Nitride on Some Thermophysical Properties of Polyamide 6/High-Density Polyethylene and Styrene-Ethylene-Butadiene-Styrene/Polypropylene Blends
Received: 31 October 2025 Revised: 02 December 2025 Accepted: 19 January 2026 Published: 02 February 2026

© 2026 The authors. This is an open access article under the Creative Commons Attribution 4.0 International License (https://creativecommons.org/licenses/by/4.0/).
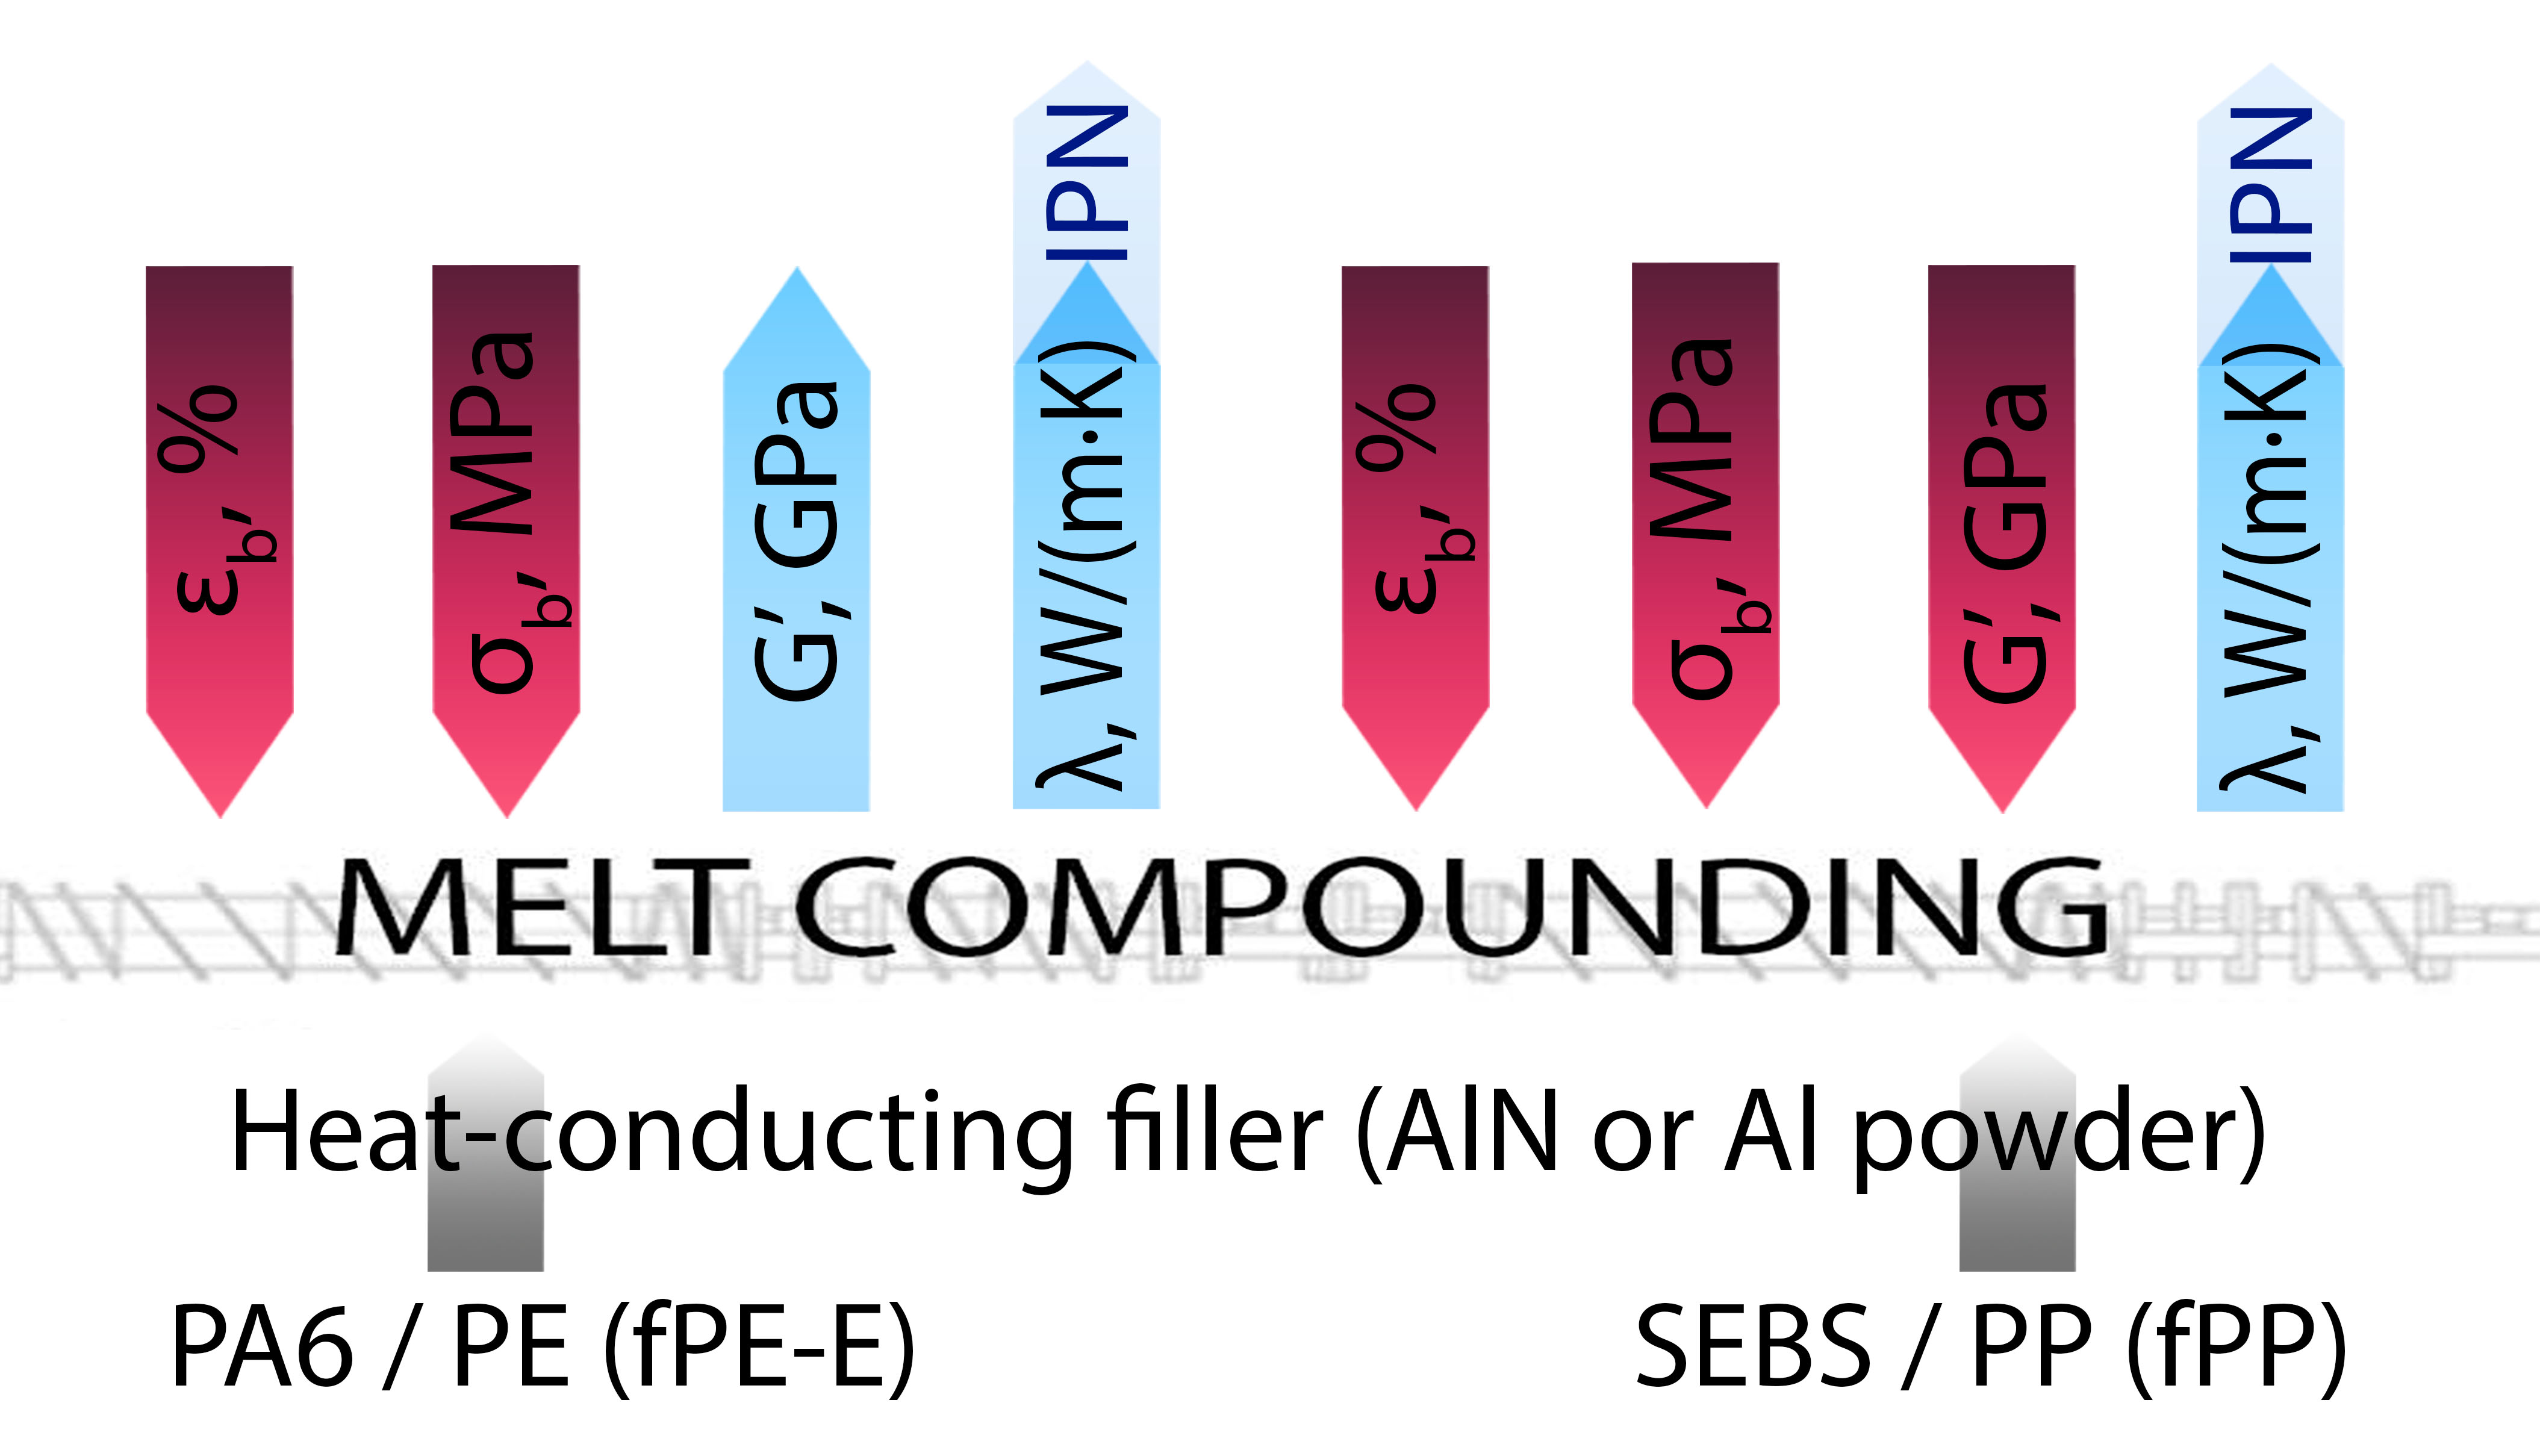
Graphical Abstract
1. Introduction
One of the simplest and most effective ways to regulate the properties of polymers is to physically modify them by introducing fillers with significantly different electrical, thermophysical, mechanical, and other properties into their composition [1,2,3,4,5,6,7,8,9]. Not only does the nature of the filler and the degree of difference in the values of the regulated characteristics have a noticeable effect, but also the aspect ratio of its particles, based on which fillers can be divided into dot-shaped (close to spherical), one-dimensional (needle-type and fiber-like particles), and two-dimensional (shape close to plates) [2,8].
Polymers can be classified as a separate group of modifiers [3,10,11,12]. The shape and size of particles of this type of filler, which forms a dispersed phase when blending melts of different polymers, depend on many factors, including the rheological properties of materials, the intensity of interphase interaction, compounding and subsequent molding modes, etc. It should be noted that, unlike fillers that are in a solid phase during processing, the parameters of the dispersed thermoplastic phase are easily adjustable. One widely used method for this is the introduction of compatibilizing additives into polymer blends [3,10,11,12,13]. The advantage of this approach is that the technology for obtaining the final composite remains practically unchanged and usually does not require adjustment, as do the molding modes. The resulting composite materials have a set of unique properties that are not available to homopolymers individually [3,10,11]. When the required level of compatibility (intensity of interaction between components) is achieved, such a composite can be considered as a single polymer matrix with a collective response to external influences, which, in turn, can be modified with various target fillers [14,15,16,17,18,19,20].
The problem with existing polymer bases for producing materials with increased thermal conductivity is that achieving a practically significant increase in this characteristic requires the introduction of a modifier in an amount exceeding 20 vol.% [16,17]. This, in turn, leads to a sharp embrittlement of materials and a noticeable deterioration in their technological properties. A very promising direction for the creation of composites with increased thermal conductivity for thermal interface components is the use of blend matrices [15,18,20,21,22], in which the polymer components have significantly different thermophysical properties and, if necessary, the level of their interphase interaction can be adjusted [3,11,13], as can the distribution of the filler in the volume of this multipolymer matrix [15,16,19,22,23]. However, despite the promising nature of this study, the effect of heat-conducting fillers on the structure and thermophysical properties of the resulting composites has not been sufficiently investigated.
The above mentioned served as a basis for formulating the aim of the work—to evaluate the influence of the ratio of polymer components in blends and the functionalization of one of them, as well as the type of heat-conducting filler on the structure and some important thermophysical properties of composites based on them.
2. Materials and Methods
2.1. Materials
The components of the blends were: polyamide 6 (PA6) grade 210/310, manufactured by Grodno Azot OJSC (Grodno, Belarus) in accordance with TU 500048054.009-2001 (melting point (Tm) = 220 °C, melt flow index (MFI) = 17.2 g/10 min at temperature (T) = 250 °C, load P = 21.6 N and capillary diameter Dc = 2.095 mm). High-density polyethylene (HDPE) grade 276, manufactured by PJSC “LUKOIL” (Moscow, Russia) according to GOST 16338 (Tm = 125–132 °C, MFI = 5.0–7.0 g/10 min at T = 190 °C, P = 49.0 N and Dc = 2.095 mm). Polyolefin elastomer, ENGAGE 7447 grade, manufactured by Dow Chemical Company (Midlands, MI, USA), to obtain functionalized polyolefin (fPE-E); fPE-E is a blend of HDPE/ENGAGE 7447, functionalized using the technology of the of MPRI of NAS of Belarus (Gomel, Belarus); polypropylene (PP), DR 7032.06 grade, manufactured by Braskem (Kamasari, Brazil), fPP is PP, functionalized using the technology of MPRI of NAS of Belarus (Gomel, Belarus), styrene-ethylene-butylene-styrene block copolymer (SEBS), Masflex 60112NAT9000 grade, manufactured by RUSPLAST (Moscow, Russia).
Aluminum powder (pAl) grade PA-4, manufactured by Uralprokat Plant LLC, Kamensk-Uralsky, Russia (GOST 6058-73, aluminum content not less than 98% by weight, particle size less than 140 μm). Aluminum nitride grade ALN-40 (NAl), manufactured by Timosha LLC, Smolevichi, Belarus (particle size less than 40 μm).
2.2. Production of Composites
From the initial components, mechanical mixtures with the component ratios shown in Table 1 were preliminarily obtained in a blade mixer. Hereinafter in the text of the article, the numbering of the compositions corresponds to the numbering in Table 1.
Table 1. Compositions of test materials.
|
Number of Compound (Composition) |
Components (Hereinafter Concentration in wt.%) |
|||||||
|---|---|---|---|---|---|---|---|---|
|
PA6 |
HDPE |
fPE-E |
SEBS |
PP |
fPP |
pAl |
NAl |
|
|
1 |
75.0 |
25.0 |
- |
- |
- |
- |
- |
- |
|
2 |
52.5 |
17.5 |
- |
- |
- |
- |
30.0 |
- |
|
3 |
52.5 |
17.5 |
- |
- |
- |
- |
- |
30.0 |
|
4 |
75.0 |
- |
25.0 |
- |
- |
- |
- |
- |
|
5 |
52.5 |
- |
17.5 |
- |
- |
- |
30.0 |
- |
|
6 |
52.5 |
- |
17.5 |
- |
- |
- |
- |
30.0 |
|
7 |
50.0 |
- |
50.0 |
- |
- |
- |
- |
- |
|
8 |
35.0 |
- |
35.0 |
- |
- |
- |
30.0 |
- |
|
9 |
- |
- |
- |
75.0 |
25.0 |
- |
- |
|
|
10 |
- |
- |
- |
52.5 |
17.5 |
- |
30.0 |
- |
|
11 |
- |
- |
- |
52.5 |
17.5 |
- |
- |
30.0 |
|
12 |
- |
- |
- |
75.0 |
- |
25.0 |
- |
- |
|
13 |
- |
- |
- |
52.5 |
- |
17.5 |
30.0 |
- |
|
14 |
- |
- |
- |
52.5 |
- |
17.5 |
- |
30.0 |
|
15 |
- |
- |
- |
50.0 |
- |
50.0 |
- |
- |
|
16 |
- |
- |
- |
35.0 |
- |
35.0 |
30.0 |
- |
The content of 25% HDPE, fPHE, and PP, fPP, respectively, in PA6 and SEBS was selected based on preliminary experiments, which showed that the combination of the highest mechanical properties (strain at break on samples with and without junction, impact strength, and stress at break) is achieved at the specified concentration of the polymer modifier [13,24].
As an inhibitor of thermo-oxidative degradation of the polymer matrix during processing, we used the nitrogen-containing sterically hindered phenolic antioxidant Irganox 1098 (BASF, Ludwigshafen, Germany)—N,N′-hexane-1,6-diyl-bis [3-(3,5-di-tert-butyl-4-hydroxyphenyl propionamide)]. This additive was introduced into each of the studied composites in an amount of 0.2%.
Immediately after preparation, the mechanical mixture of components was subjected to melt compounding using extrusion-granulation line based on a TSSK-35/40 twin-screw extruder (Zhangjiagang Jorbin Machinery, Zhangjiagang, China) with co-rotating screws (screw diameter 35 mm, L/D = 40, 10 sections of the material cylinder with independent heating and cooling and precise temperature maintenance in each of them). The temperature in the main mixing sections 4–8 of the material cylinder was maintained for polyamide- and polypropylene-based blends in the range of 190–240 °C and 170–200 °C, respectively. The screw rotation speed was 300 rpm. The duration of the polymer melt in the material cylinder did not exceed 30 s. Gaseous products were removed from the melt naturally through an opening designed for glass roving input and forcibly in the vacuum section. After passing through the material cylinder of the extruder, the melt was extruded through a die in the form of four strands, which were cooled with water and granulated.
2.3. Production of Samples
The composite granules were dried in a Venticell 55 ECO forced ventilation drying oven (BMT Medical Technology s.r.o., Brno-Zabrdovice, Czech Republic) at a temperature of 105 ± 5 °C for 5 h and used to obtain experimental samples by injection molding on a thermoplastic injection molding machine model “EN-30” (“ATECH MACHINERY Co”, Hangzhou, China) with an injection volume of 30 cm3. The temperature of the material cylinder was in the range of 210–240 °C for PA6-based composites and 190–210 °C for SEBS-based composites.
2.4. Methods of Testing
Before testing, all samples were conditioned in a Memmert HPP110 climate chamber (Memmert, Schwabach, Germany) at a temperature of 23 °C and relative humidity of 50% for at least 2 days.
Mechanical tests were performed using a universal testing machine model AGS-X (Shimadzu Corporation, Kyoto, Japan) in accordance with GOST 11262 (based on ISO 527-2:2012). The speed of movement of the movable clamp was 50 mm/min. Type 5 blades with a length of the working part of 50 mm and the cross section of the working part of 3 × 5 mm were used as samples. The blades were produced according to the process of Section 2.3 by injecting melt into the molding cavity through one or two sprues (to obtain a junction area where the melt flows meet).
To obtain the temperature dependences of the mechanical and viscoelastic properties of materials, the dynamic mechanical analysis (DMA) method was used, using the device DMA 8000 (Perkin Elmer, Shelton, WA, USA). The experiments were conducted in a single cantilever bending mode at a frequency of 10 Hz in the temperature range from minus 25 °C to 180 °C for PA6-based composites and from minus 50 °C to 125 °C for SEBS-based composites.
The microstructure of the samples was investigated on chips obtained in liquid nitrogen using a scanning electron microscope (SEM) VEGA II LSH (Tescan, Brno, Czech Republic). Bars measuring 4 × 10 × 80 mm were used as samples for obtaining chips, which were pre-cooled in liquid nitrogen for 30 min.
To determine the thermal diffusivity (α), heat capacity (cp), and thermal conductivity coefficient (λ), the LFA 447 NanoFlash instrument (Netzsch-Geratebau GmbH, Selb, Germany) was used. The measurements were performed in the temperature range from 30 °C to 105 °C for PA6-based composites and from 30 °C to 95 °C for SEBS-based composites according to ISO 22007-4. The samples were disks with a diameter of 25.4 mm and a thickness of 2 mm.
To determine the thermal diffusivity (α), heat capacity (cp), and thermal conductivity coefficient (λ), the LFA 447 NanoFlash instrument (Netzsch-Geratebau GmbH, Selb, Germany) was used. The measurements were performed over the temperature range of 20 °C to 105 °C, according to ISO 22007-4. The samples were disks with a diameter of 25.4 mm and a thickness of 2 mm.
The densities of the obtained composites (ρ) were determined by the immersion method according to ISO1183 (method A) in n-heptane (GOST 25828) on samples cut from the middle part of disks intended for thermophysical tests.
3. Calculation
To determine the density of the studied composites (ρc, g/cm3) by the immersion method, the formula was used:
where mS,A is the apparent mass of the specimen in air, g; mW is the apparent mass of the specimen in the immersion liquid, g; ρIL is the density of the immersion liquid at 23 °C, g/cm3.
To determine the calculated density of the investigated composites (ρcс, g/cm3), the formula was used:
where wpc1 is the weight fraction of the first polymer component of the blend; ρpc1 is the density of the first polymer component of the blend determined by immersion method, g/cm3; wpc2 is the weight fraction of the second polymer component of the blend; ρpc2 is the density of the second polymer component of the blend determined by immersion method, g/cm3; wf is the weight fraction of the filler; ρf is the density of the filler determined by immersion method, g/cm3.
To calculate the coefficient of thermal conductivity (λ, W/(m·K)), the formula was used:
where α is the thermal diffusion, mm2/s; cp is the specific heat capacity, J/(g·K); ρ is the material density, g/cm3; T is the temperature of the sample, °C.
4. Results and Discussion
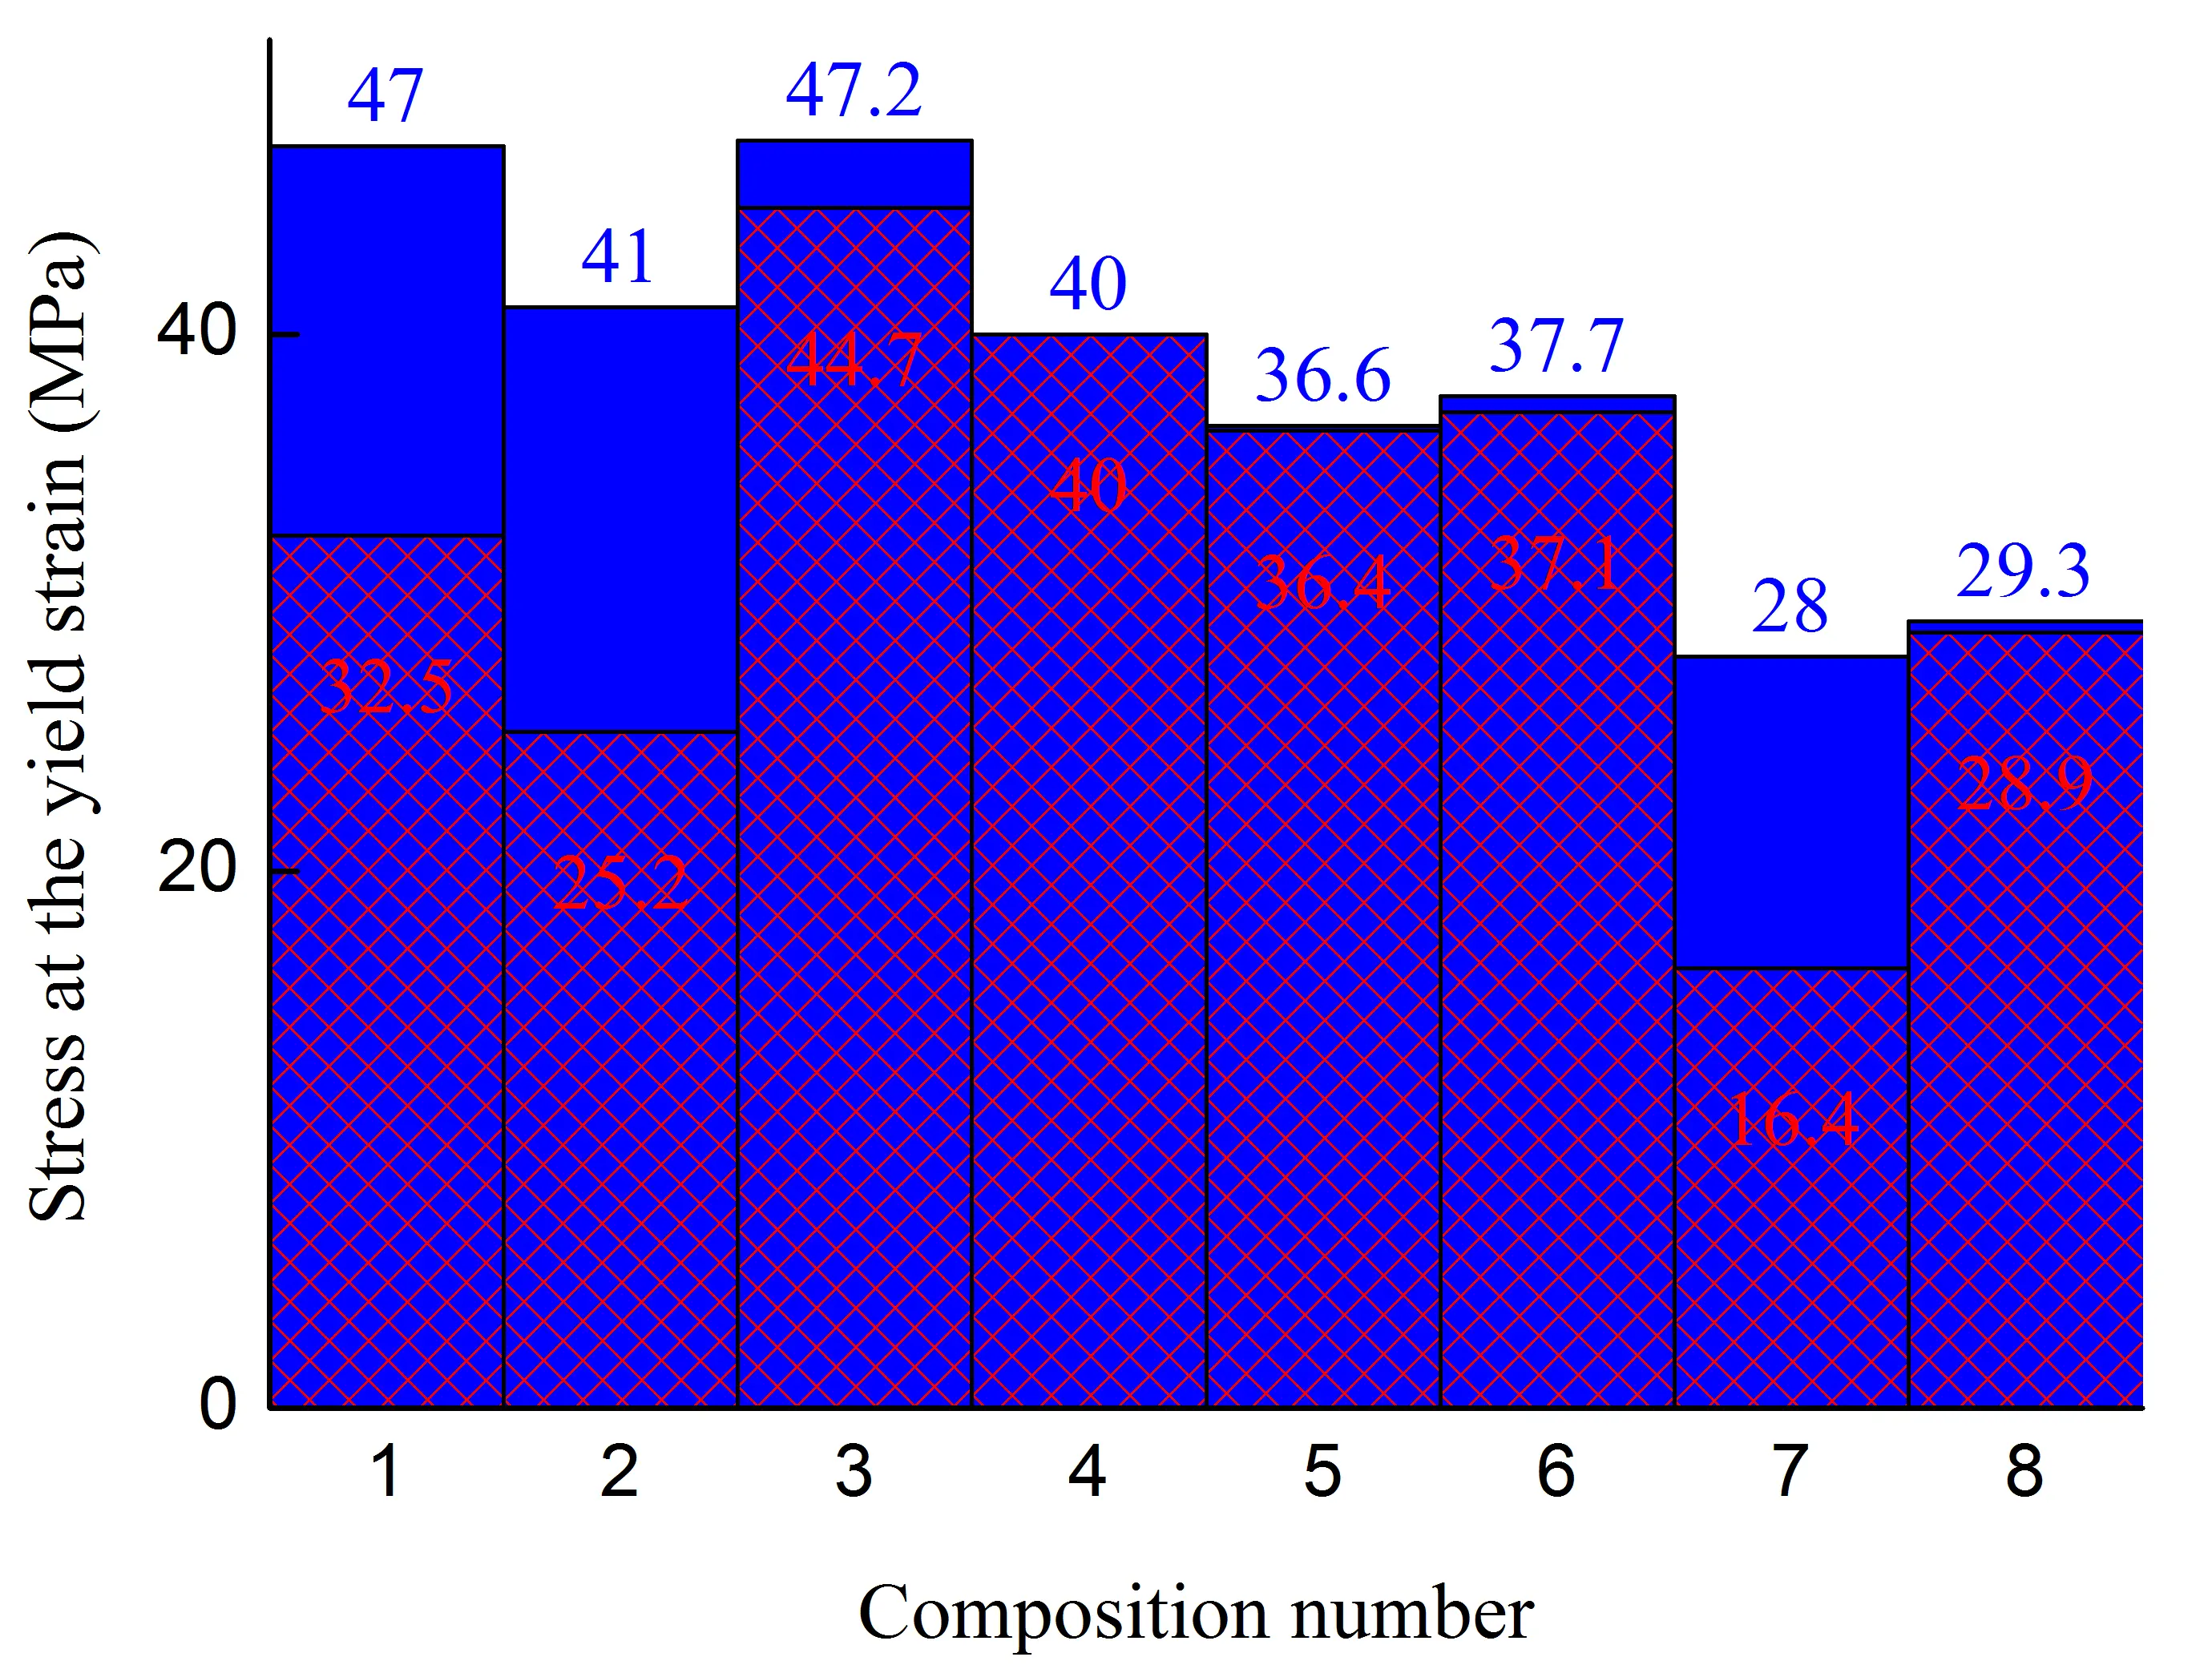
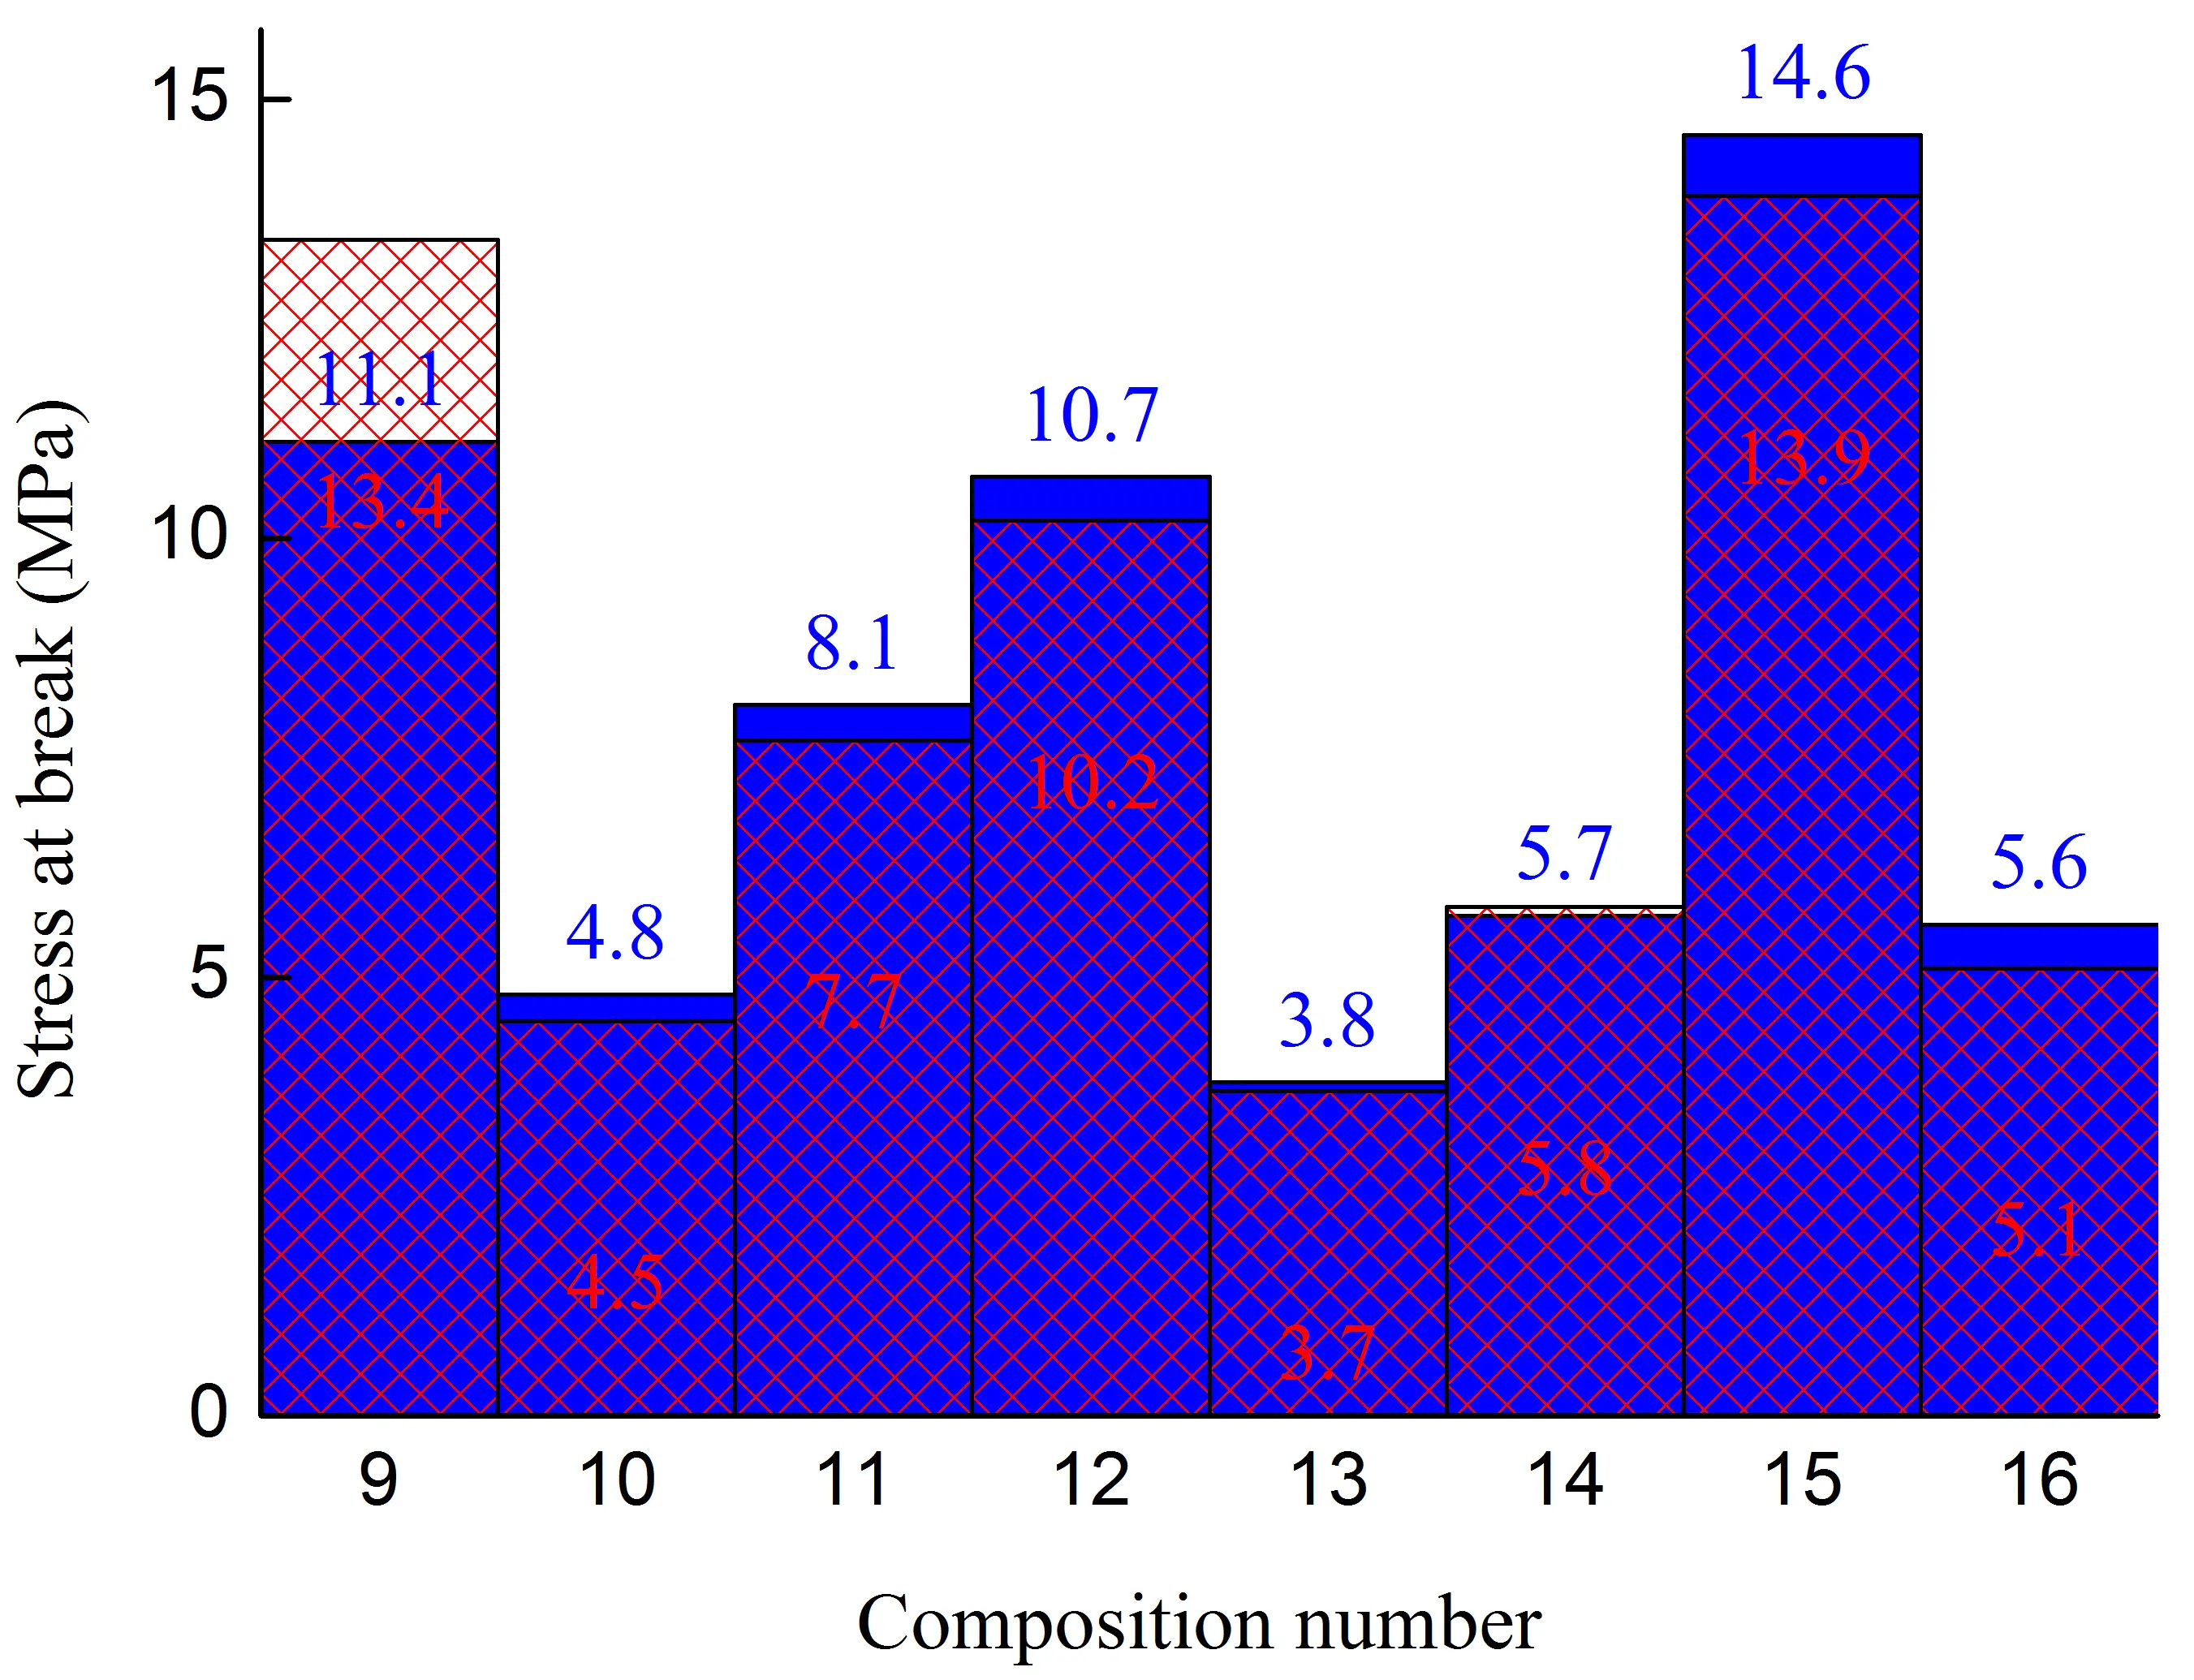
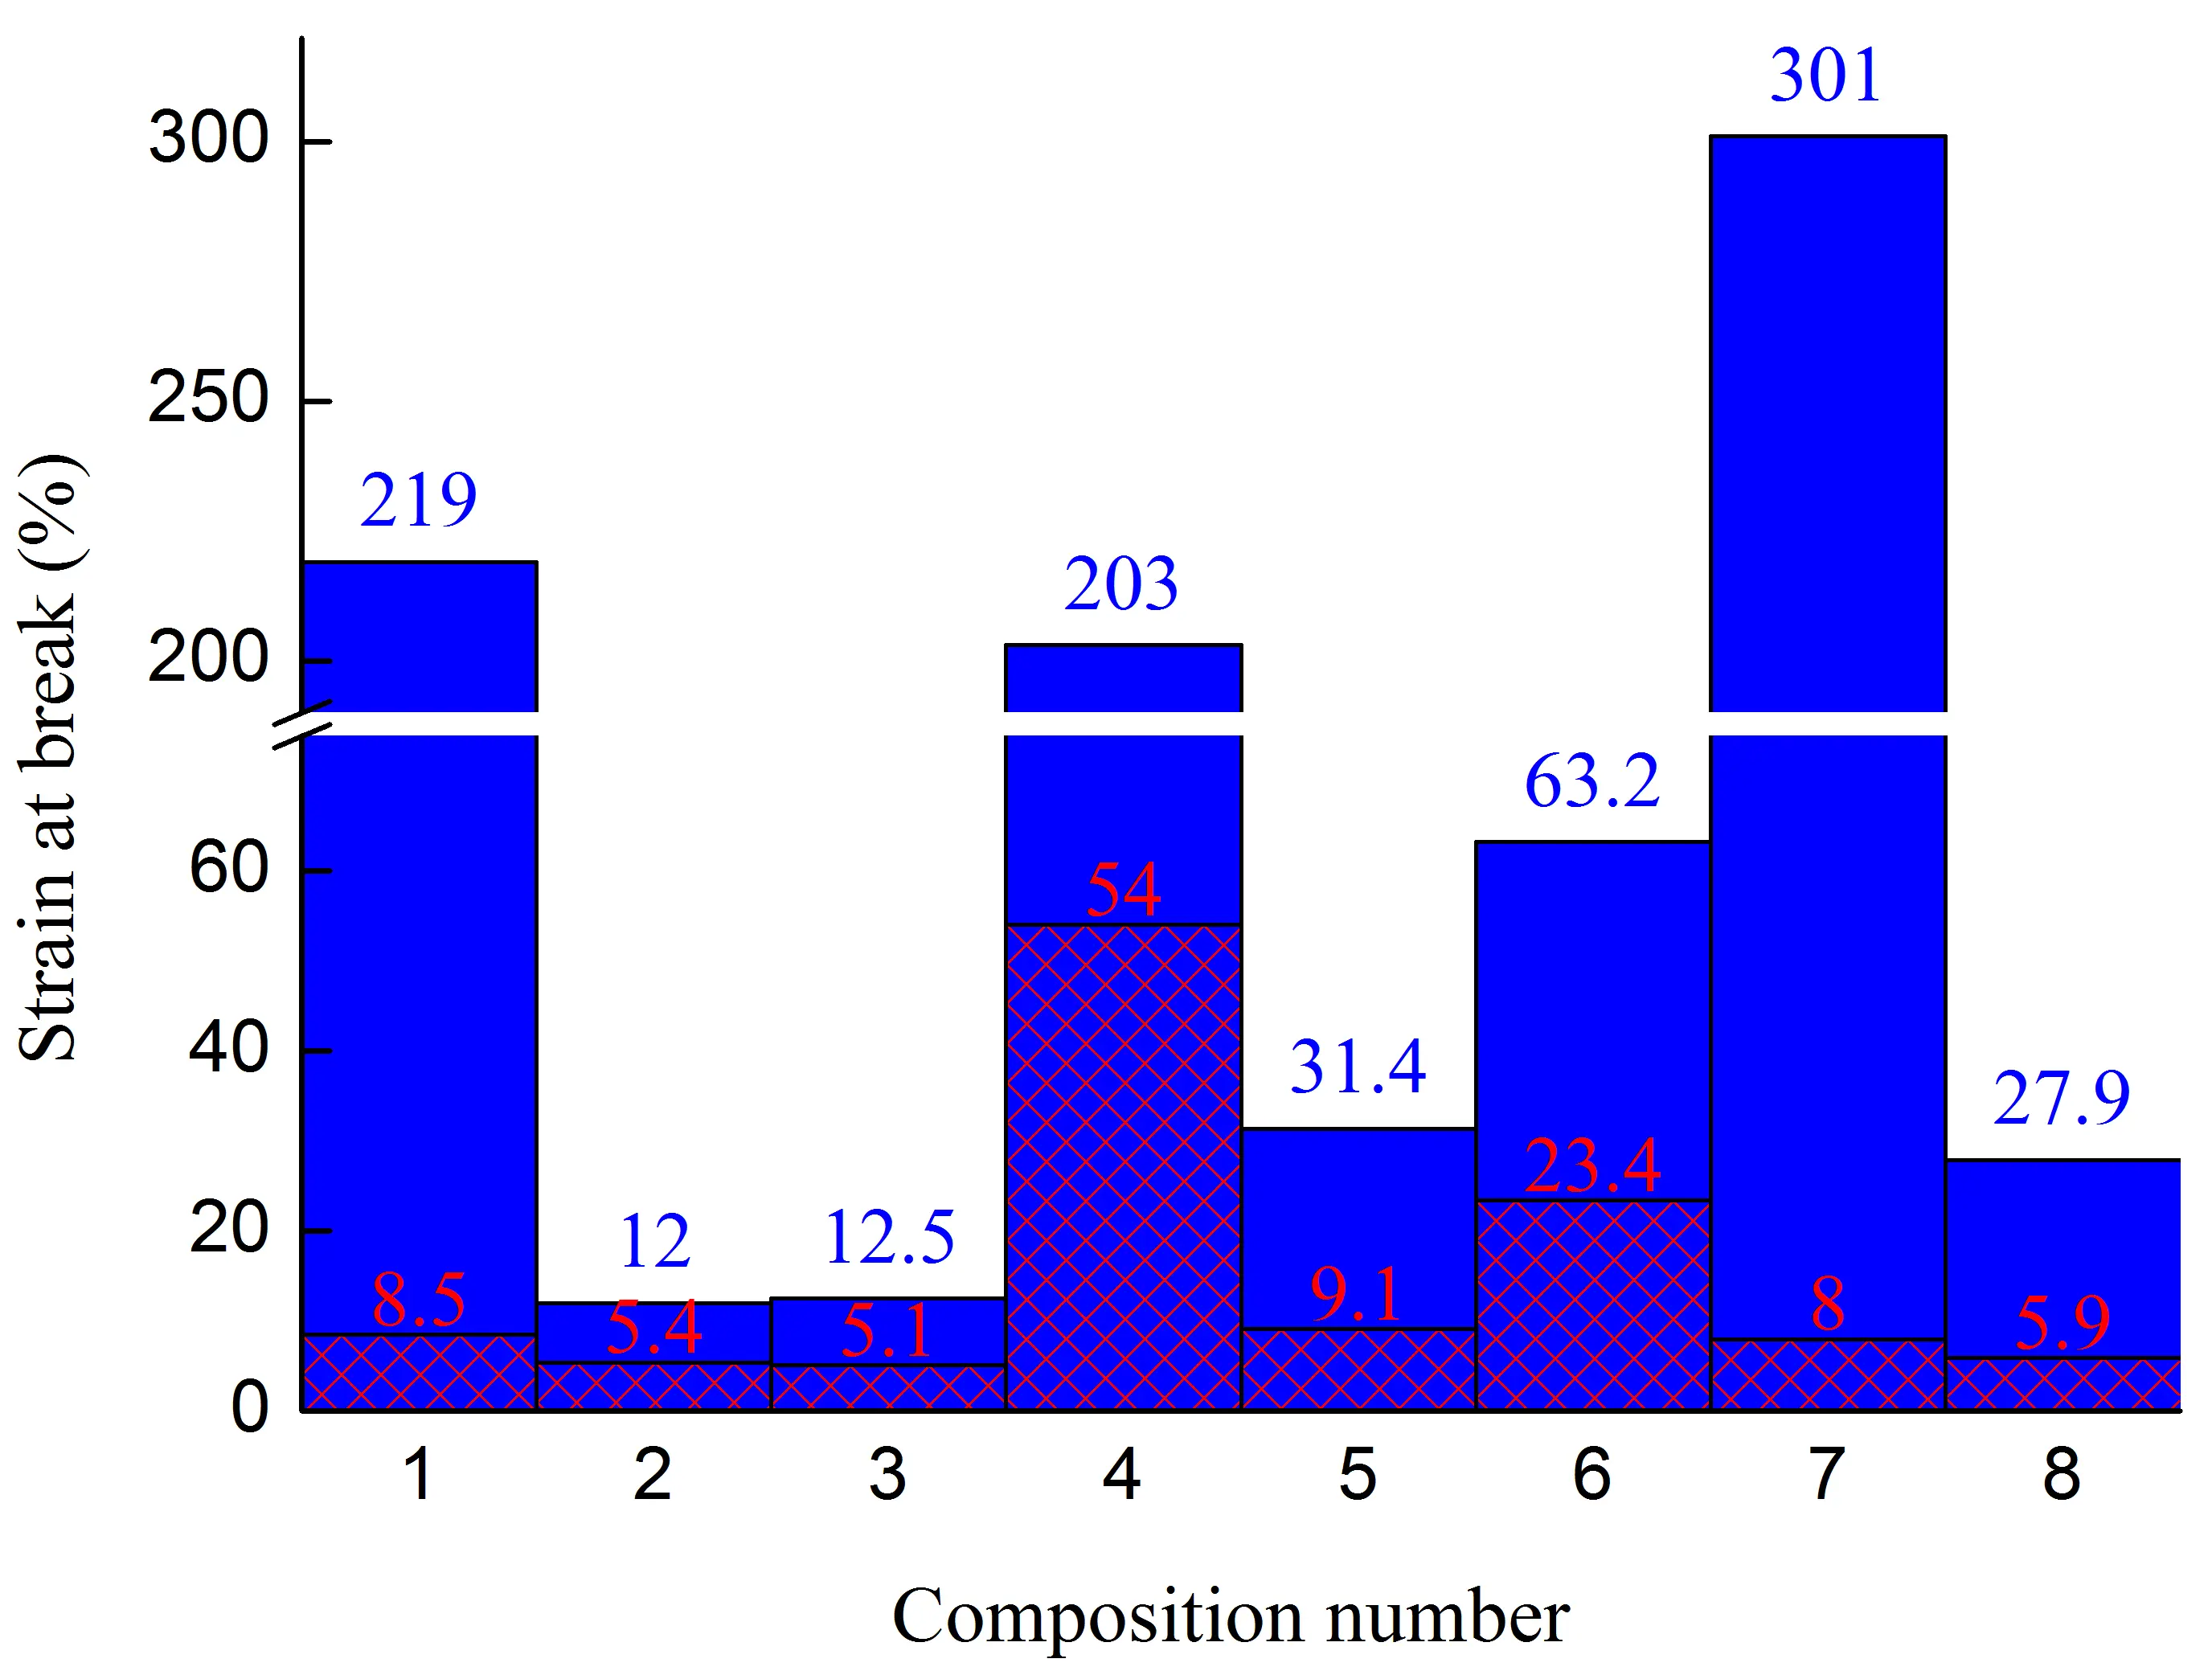
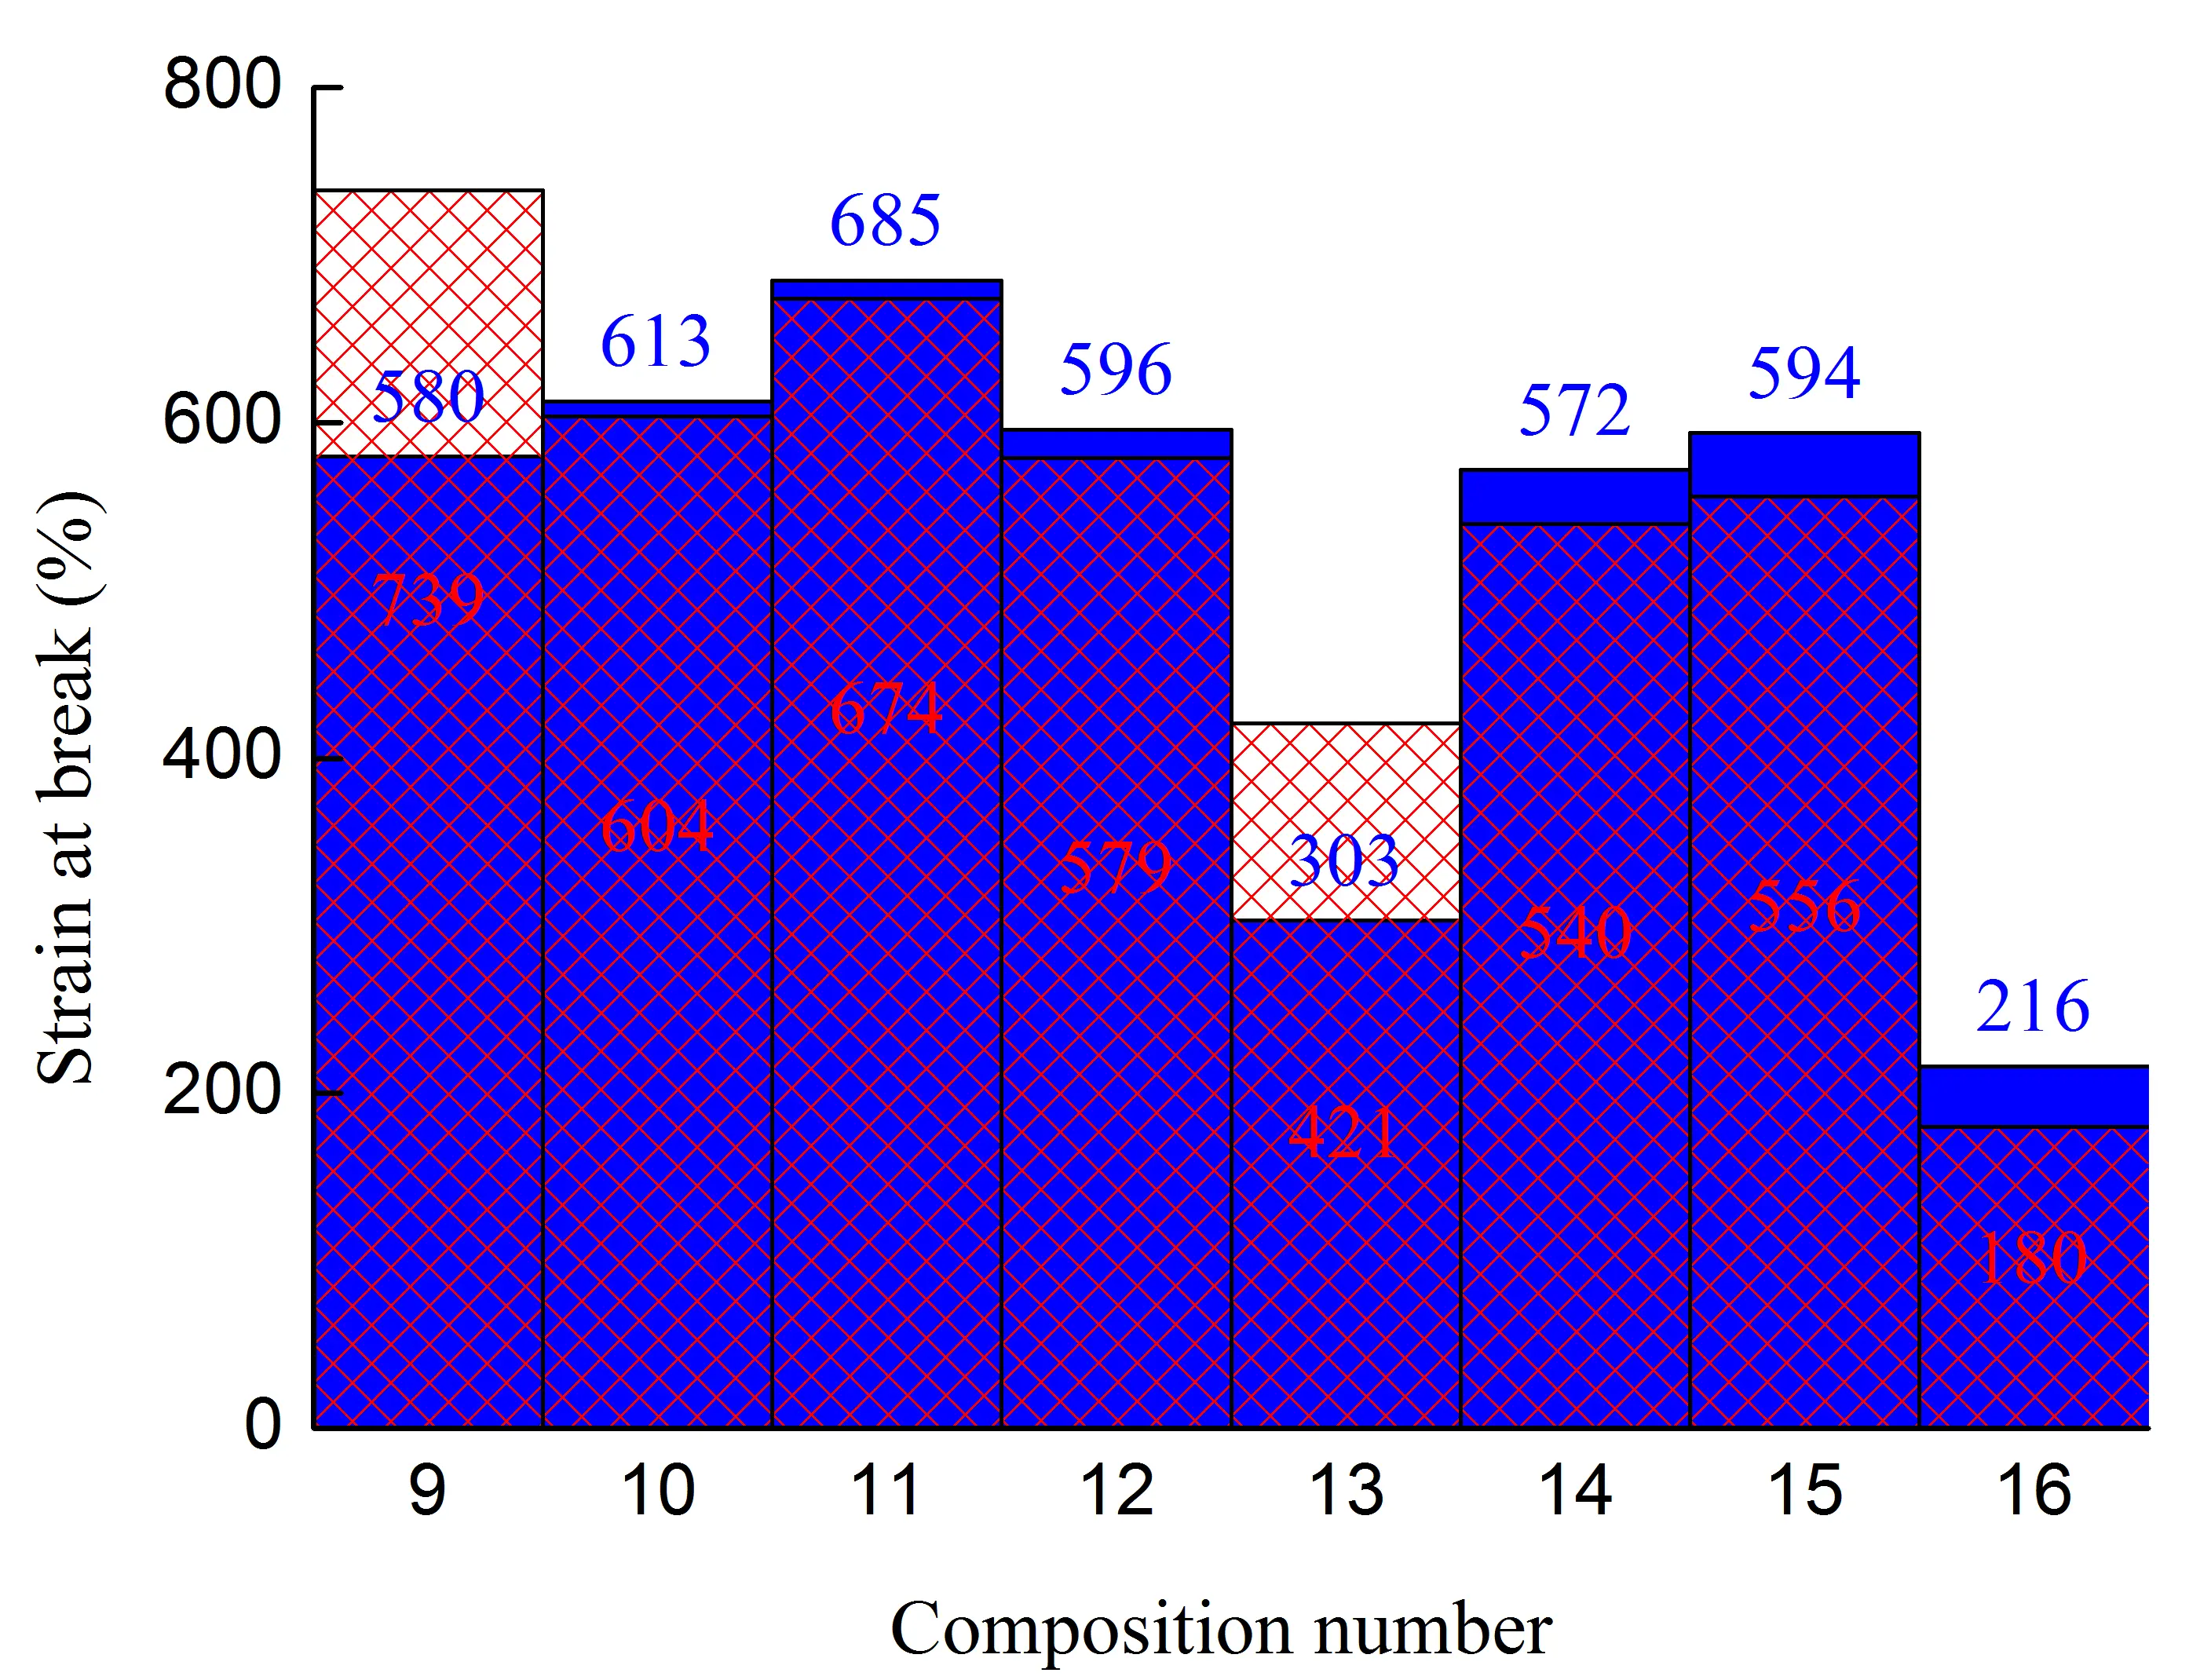
One of the main ways to confirm the success of polymer matrix modification is to evaluate changes in the mechanical properties of the resulting composite. The most important characteristics in this regard include strain at break (εb), stress at the yield strain (σy), and stress at break (σb). In this regard, composite samples were tested, the formulations of which are described in Table 1. The test results are presented in Figure 1.
As can be seen from the data obtained, in the case of PA6-based polymer blends, functionalization of the polyolefin component leads to an increase in strength parameters in samples with junction area, Figure 1a,c,e, compositions 1 and 4, σy by ≈23%, εb by ≈6 times. This indicates an increase in the intensity of interphase interaction between PA6 and polyolefin (PO). It should be noted that the decrease in σy by ≈15% for samples without junction area when using fPE-E instead of HDPE may be associated with the strengthening of the interaction between the components of the blend, as a result of which the functionalized polyolefin (which has significantly lower mechanical properties) participates more actively in the formation of the structure of the polymer matrix that takes the load, thereby reducing its σy.
The introduction of 30% pAl into the composition of PA6/PO–25% leads to a decrease in the parameters of practically all the properties studied in relation to the corresponding unfilled blends, both when using HDPE and fPE-E, Figure 1, compositions 2 and 5. The greatest decrease occurs in composites with non-functionalized polyolefin. This is particularly evident in εb, which falls for samples without and with a junction area by ≈18 and ≈1.6 times, respectively, i.e., the composite almost completely loses its ability to undergo highly elastic deformation. For materials containing fPE-E (compositions 3 and 6), the decrease in the same indicator is ≈6 and ≈5.9 times, respectively. A comparative analysis of composites 2 and 5 shows that the use of fPE-E instead of HDPE allows higher mechanical characteristics to be achieved for a greater number of parameters, Figure 1. Thus, the value of εb for composition 5 for samples with and without junction area is 2.6 and 1.7 times higher, respectively, than for composition 2. Since no improvement in the homogeneity of filler distribution in the polymer was detected by SEM, Figure 2a,c, this effect is probably due to more intense interphase interaction of fPE-E due to grafted polar groups with both PA6 and filler.
 |
 |
| (a) | (b) |
 |
 |
| (c) | (d) |
 |
 |
| (e) |
(f) |
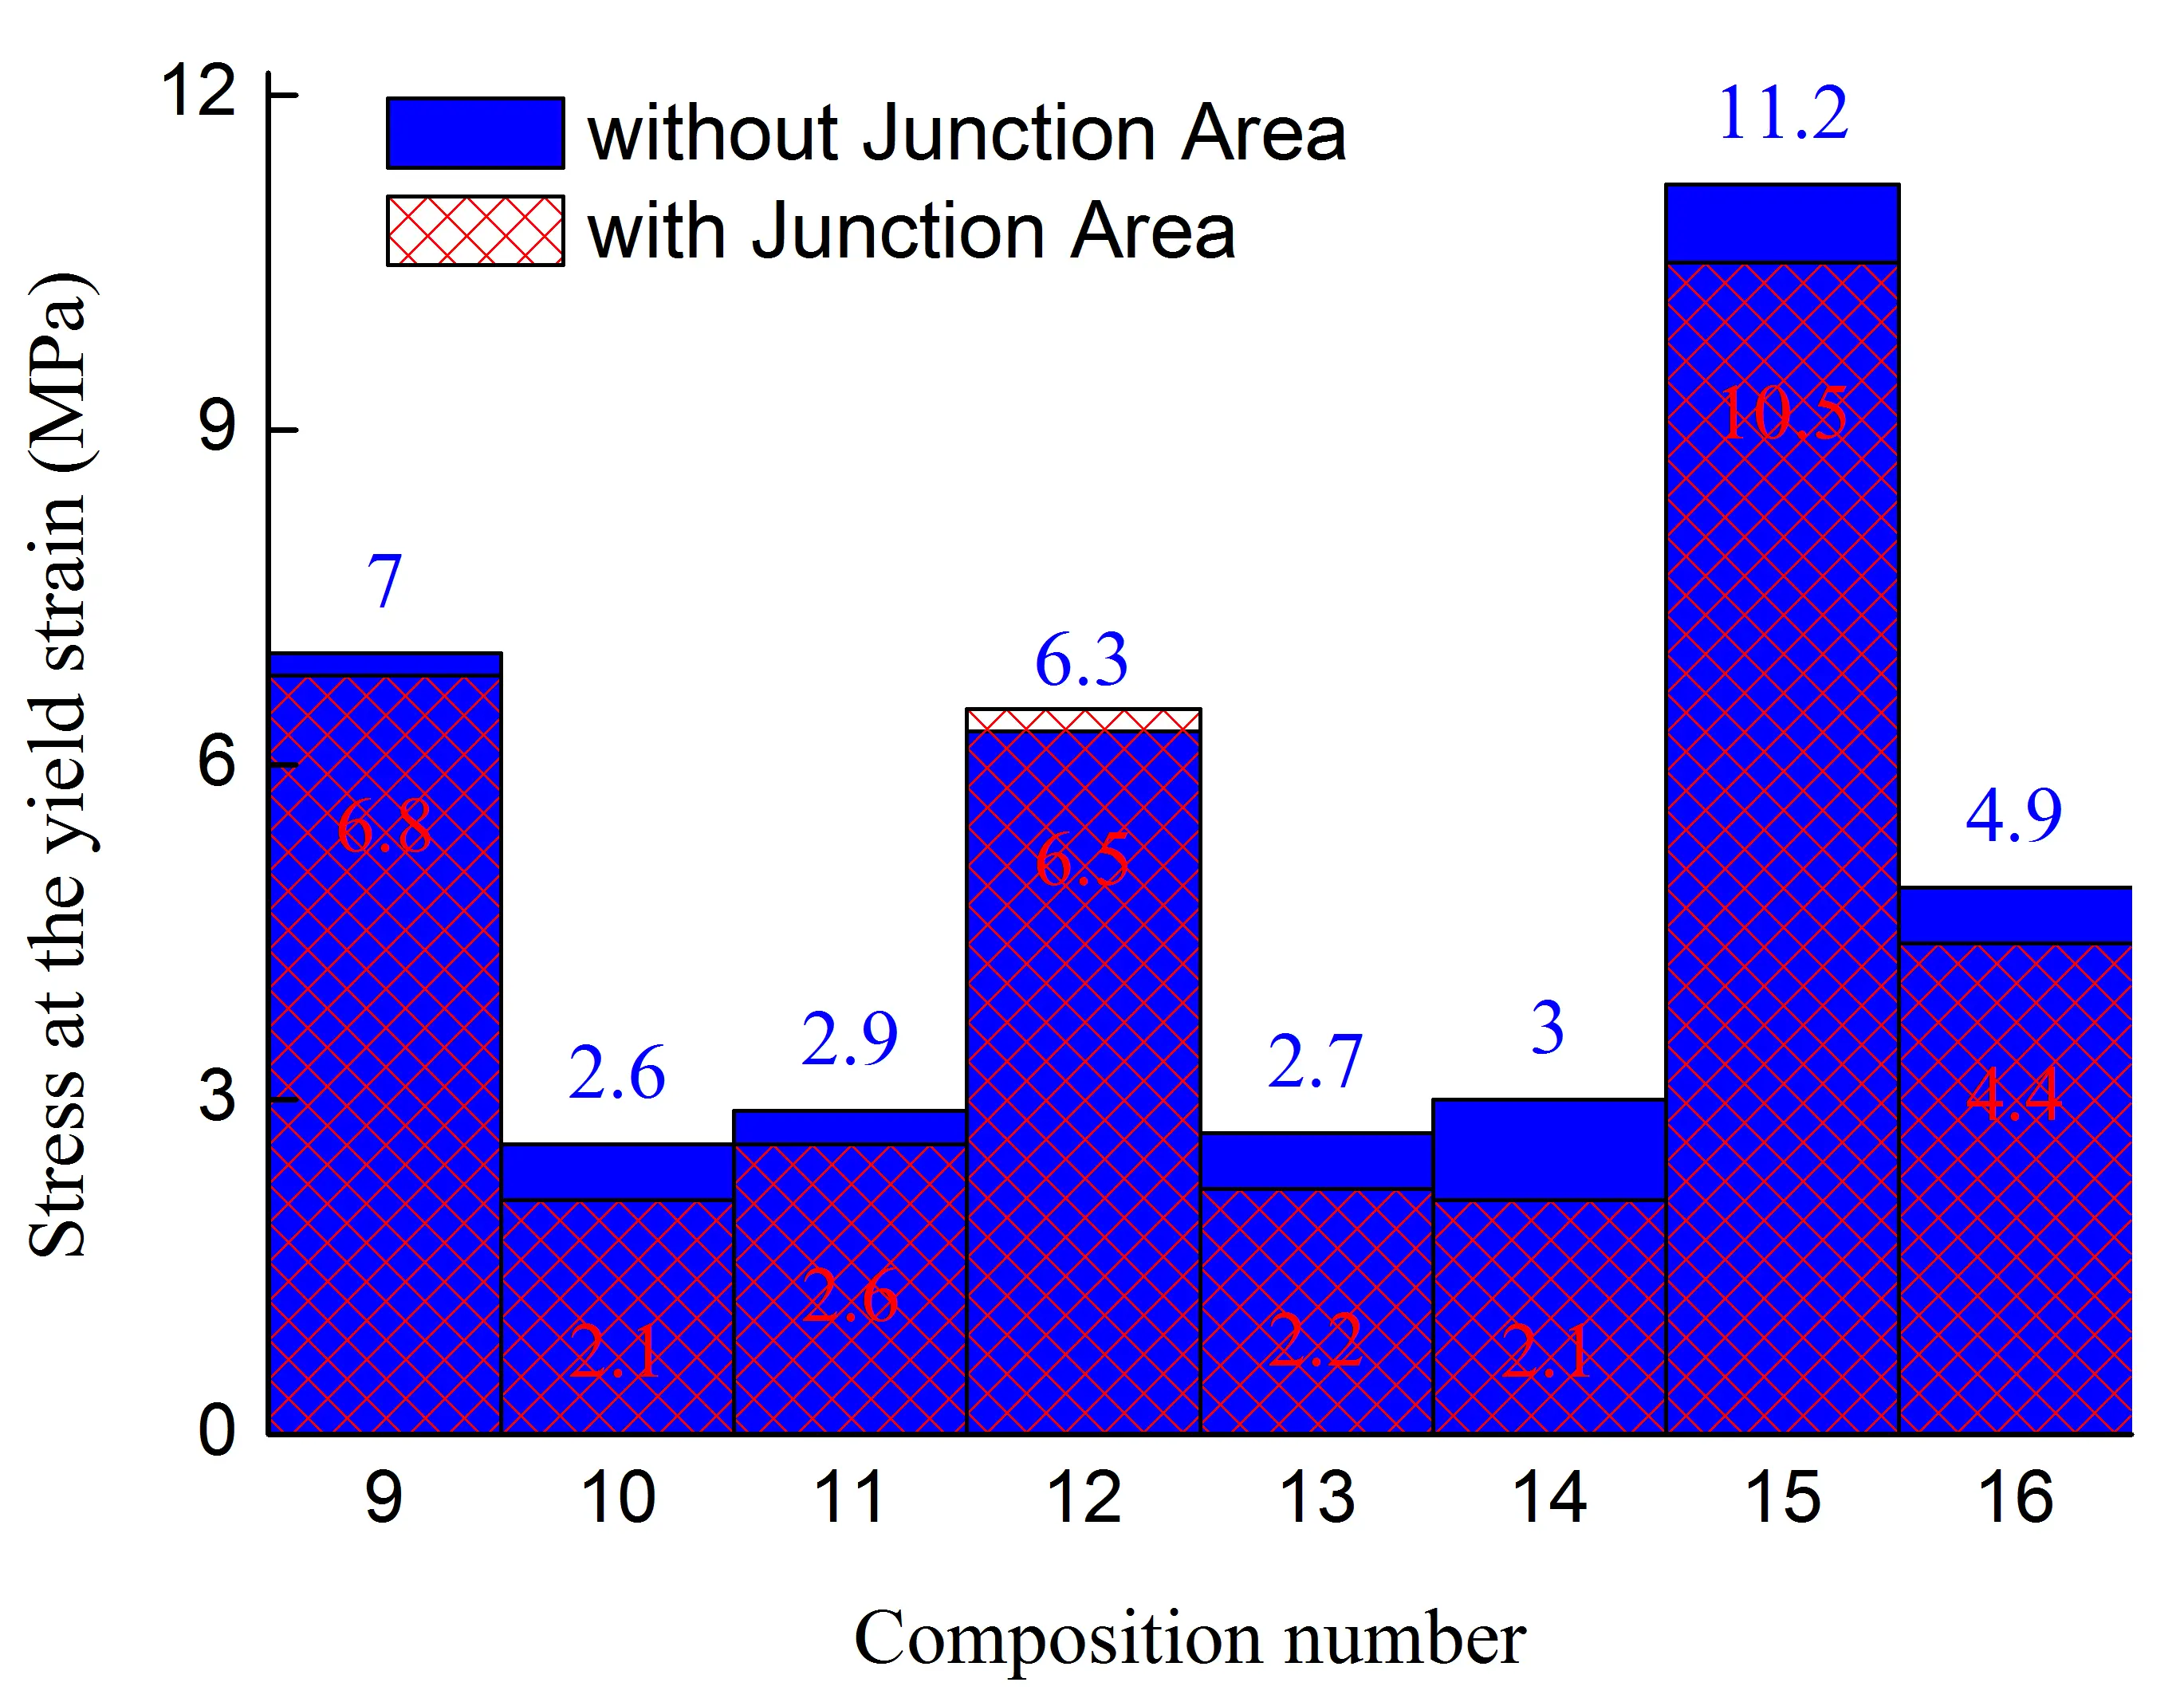
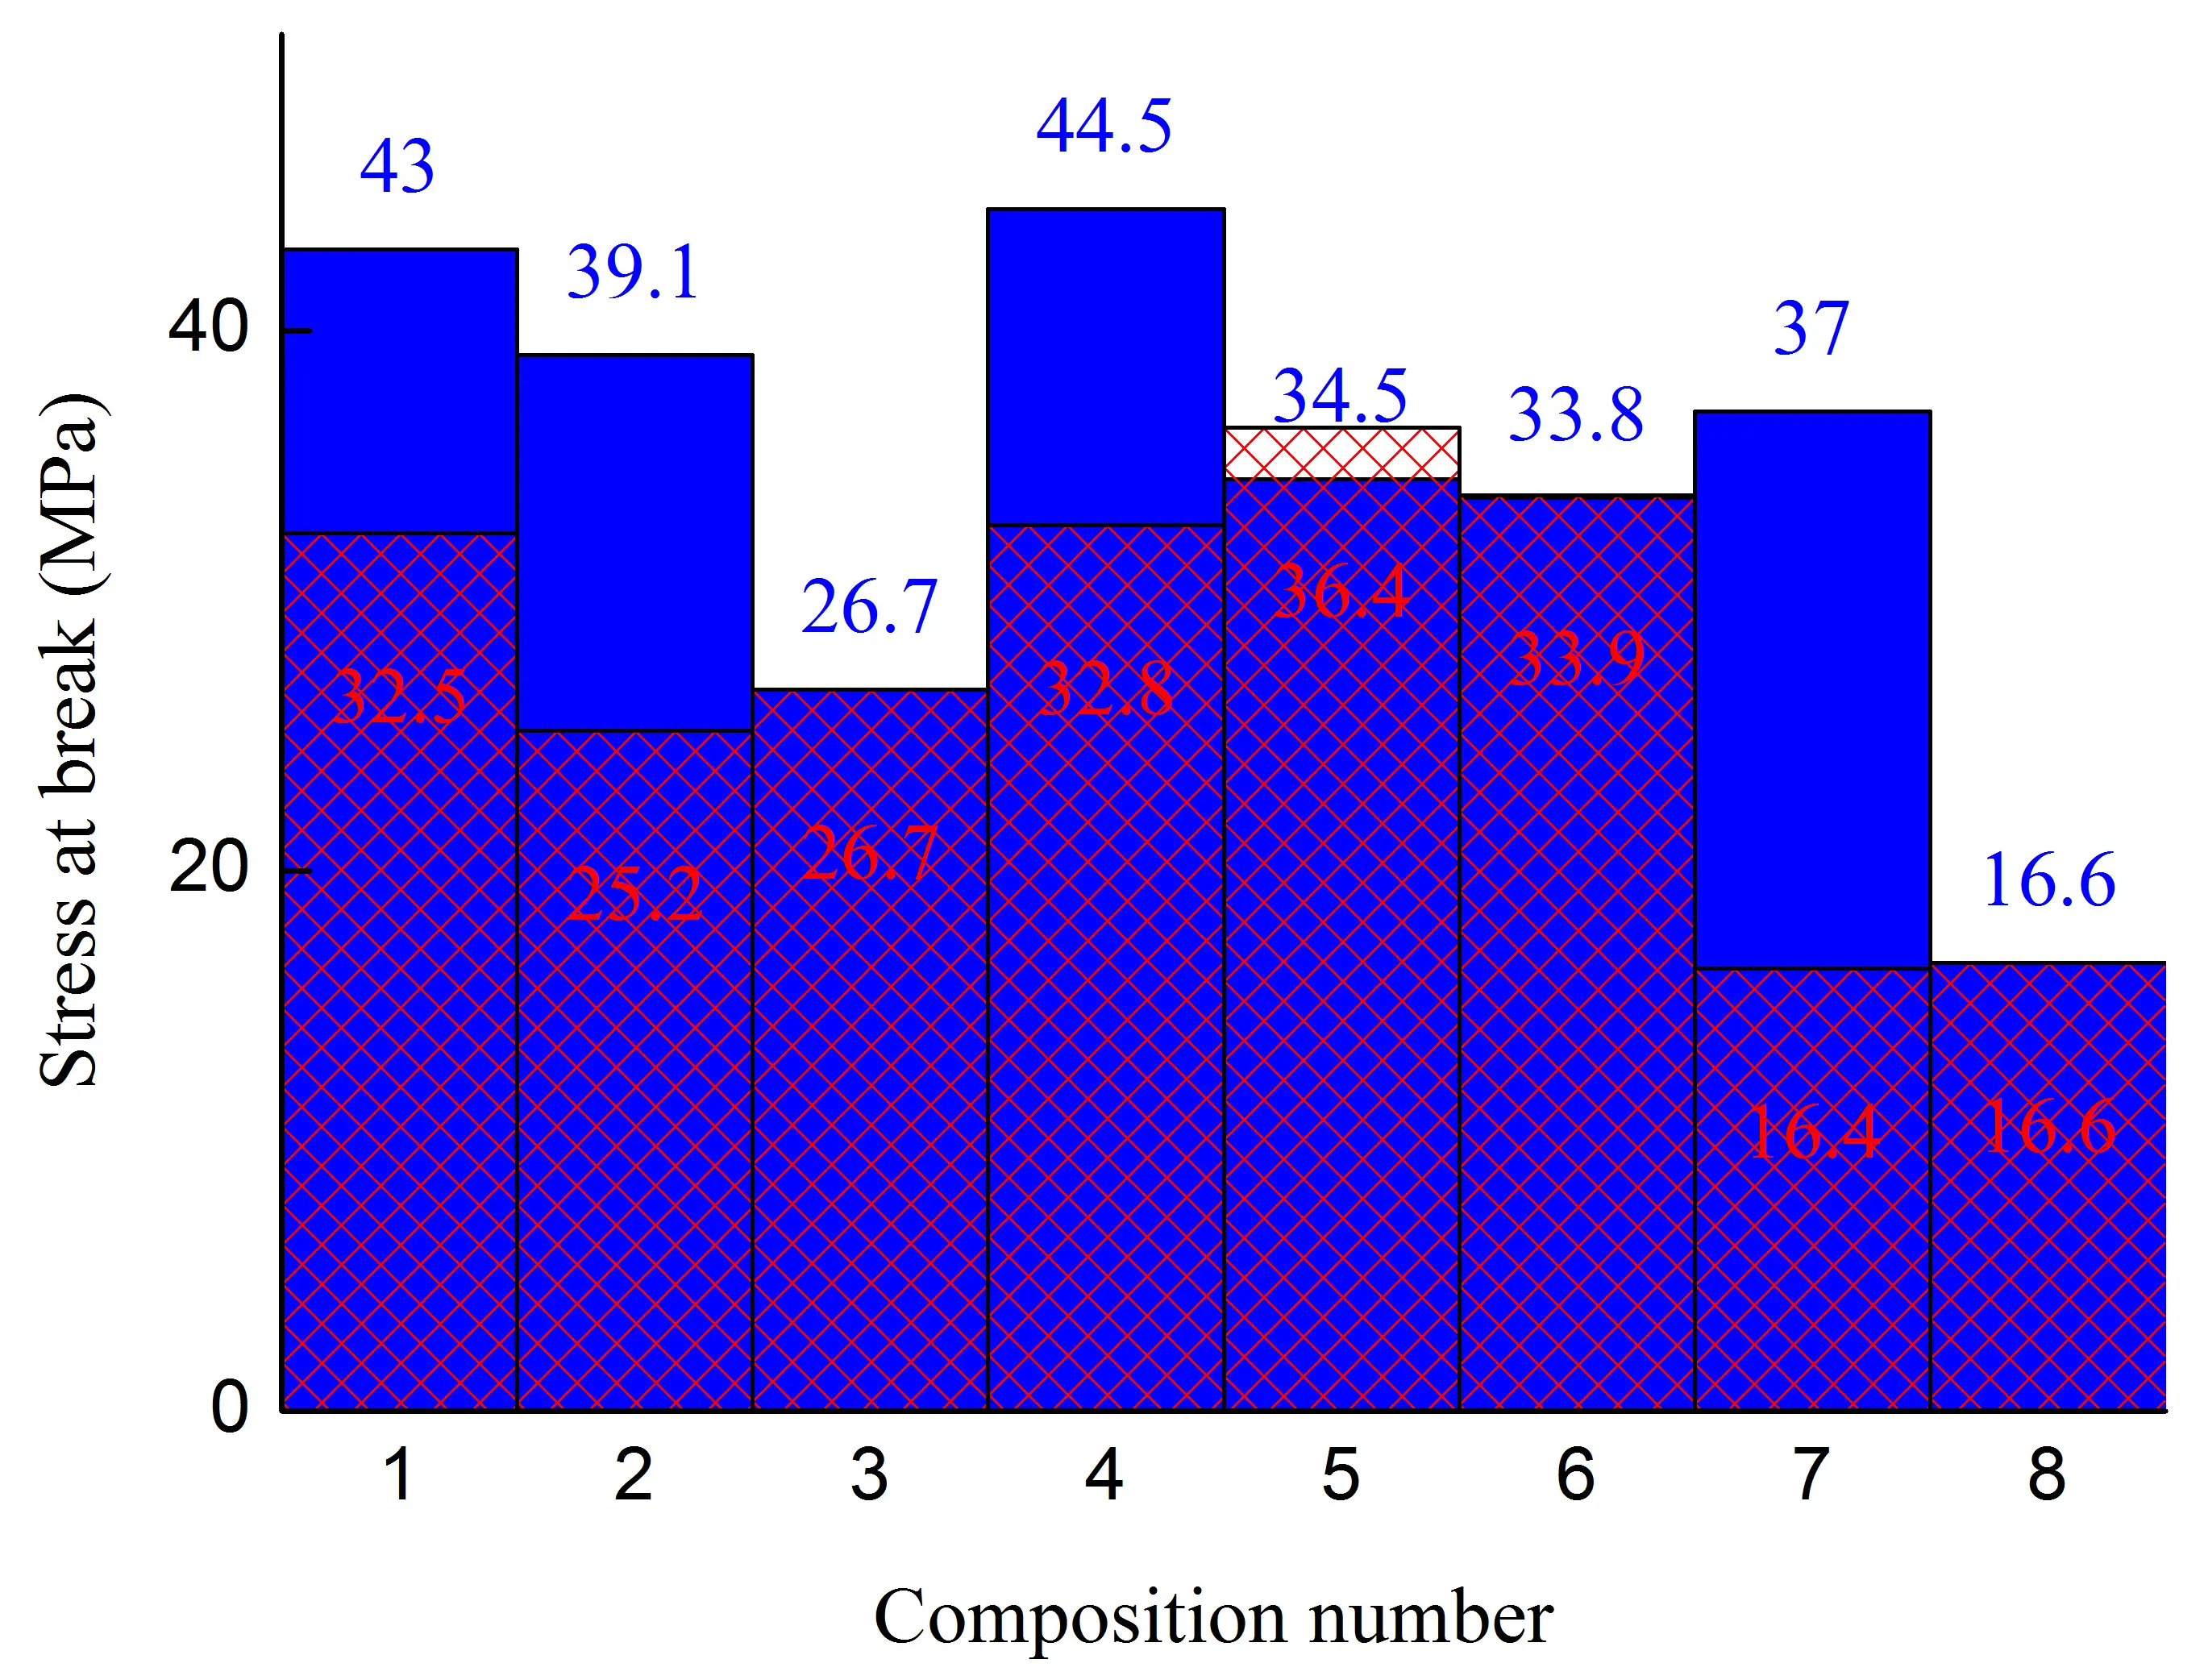
Figure 1. Stress at the yield strain (a,b), stress at break (c,d), strain at break (e,f) of initial blends and composites based on them. The numbering on the x-axis corresponds to the following compositions: 1—PA6/HDPE–25%; 2—PA6/HDPE–17.5%/pAl–30.0; 3—PA6/HDPE–17.5%/NAl–30.0; 4—PA6/fPE-E–25%; 5—PA6/fPE-E–17.5%/pAl–30.0; 6—PA6/fPE-E–17.5%/NAl–30.0; 7—PA6/fPE-E–50%; 8—PA6/fPE-E–35.0%/pAl–30.0%; 9—SEBS/PP–25%; 10—SEBS/PP–17.5%/pAl–30.0; 11—SEBS/PP–17.5%/NAl–30.0; 12—SEBS/fPP–25%; 13—SEBS/fPP–17.5%/pAl–30.0; 14—SEBS/fPP–17.5%/NAl–30.0; 15—SEBS/fPP–50%; 16—SEBS/fPP–35.0%/pAl–30.0%.
The introduction of NAl into the PA6/PO blend, Figure 1, compositions 3 and 6, leads to a less significant decrease in the studied mechanical properties compared to pAl, and in the case of the blend with non-functionalized polyethylene, even to an increase in σy for samples with the junction area of up to ≈1.4 times. This characterizes NAl as a more attractive filler for such matrices. It has been established that the use of fPE-E instead of HDPE in a composite containing NAl, Figure 1, compositions 3 and 6, allows increasing εb of samples with and without a joint by ≈5 and 4.6 times, respectively. The achieved level of εb guarantees the absence of brittleness in the final product and high strength of the junction areas that may form during its injection molding. The most likely reason for the lower σy values of composites 5 and 6 compared to composites 2 and 3, respectively, can be considered, as in the case of unfilled composites 1 and 4, to be the stronger interphase interaction between fPE-E and PA6, which weakens the matrix of the final composite.
The mechanical properties of the PA6/fPE-E–50% blend with and without pAl were evaluated. Due to the proximity of the concentrations of the mixed polymers, this blend forms an interpenetrating network (IPN). This composite is of interest because both polymer components form continuous phases. Thus, only due to the structure of the resulting composite, it is possible to achieve an additional increase in the parameters of some practically important properties, for example, electrical and thermal conductivity. It has been established that composition 7, compared to composition 4, has σy and σb of samples without and with the junction area less by ≈1.4, ≈2.4, and ≈1.2, ≈2 times, respectively. The decrease in these parameters is associated with an increase in the proportion of polyolefin, which has lower σy and σb compared to PA6. It should be noted that there is an ambiguous change in εb during the formation of IPN. For samples without the junction area, it increases by ≈1.5 times, while for samples with the junction area, it decreases by ≈6.8 times.
The introduction of 30% pAl into the PA6/fPE-E–50% blend increases its σb for samples with a junction area by a factor of ≈1.8 and reduces εp for samples without and with the junction area by a factor of ≈11 and ≈1.4, respectively, while keeping the other properties under study practically unchanged. This characterizes pAl as a reinforcing filler, which, however, significantly increases the brittleness of the final composite.
Along with PA6/PO, another promising option for multipolymer matrices for composites with increased thermal conductivity is blends of nonpolar polymers capable of significant deformation without breaking under tension. Their use can significantly reduce the brittleness of the final materials, for example, by preferentially distributing the heat-conducting filler within one of the polymer components. In addition, due to its low moisture absorption, unlike polar polymers, it is possible to obtain materials with more stable characteristics, for example, when operating in conditions of variable humidity. SEBS, which has a contact angle of more than 100° [25], characteristic of hydrophobic polymers, was used as the matrix polymer. PP or fPP was used as the second component of the polymer blend. The idea of using fPP was that, having polar groups in its macromolecules, it would interact more actively with the surface of the filler, which would ensure better wetting of the latter and, as a result, higher mechanical and thermophysical properties would be achieved.
Analysis of the mechanical characteristics of blends of weakly polar polymers SEBS/PO–30% revealed that chemical modification of PP by grafting polar groups onto its macromolecules reduced the mechanical properties in most cases. The maximum decrease was achieved for σy–up to ≈10% (sample without the junction area), σb–up to ≈24% (sample with the junction area), εb up to ≈22% (sample with the junction area), Figure 1b,d,f, compositions 9 and 12. The change in the other property parameters did not exceed 5%. Based on the fact that both components of the blend are nonpolar and can have at least technological compatibility, which is confirmed by the absence of delamination of the blend components during extrusion, as well as the results of studies by other authors [26,27], it can be assumed that the decrease in mechanical properties is due to the destruction of PP macromolecules both during functionalization [28] and subsequent compounding with SEBS.
In order to intensify the interaction between the polymer matrix and pAl and NAl, fPP was used, which contains polar groups in its macromolecules. However, analysis of the results obtained (Figure 1) showed that no improvement in mechanical properties was achieved for compounds 10, 13 (pAl filler) and 11, 14 (NAl filler). Excluding values whose changes were within 5%, the following parameters were found to have decreased: compound 13—σb by ≈1.3 times (for samples with and without the junction area), εb by ≈2 and ≈1.4 times (for samples without and with the junction area, respectively); compound 14—σb by ≈1.2 times (for samples with the junction area), σb by ≈1.4 and ≈1.3 times (for samples without and with the junction area, respectively), εb by ≈1.2 times (for both types of the samples). It should be noted that all composites based on SEBS/PO–30% have a very high deformation capacity, as their εb is more than 300%.
It has been established that the formation of the IPN structure in the SEBS/fPP–50% blend, Figure 1, composition 15, has a positive effect on its basic strength properties, increasing their σy and σb without and with the junction area, respectively, to ≈1.7 and ≈1.4 times compared to composition 12. It should be noted that the high deformability of the material, reaching ≈550%, is maintained. Modification of the specified blend by 30% pAl, Figure 1, composition 16, leads to a sharp decrease in all mechanical properties: σy, σb, and εb for samples with and without the junction area by ≈2.3, ≈2.4, ≈2.6, ≈2.7, ≈2.8, and ≈3.1 times, respectively. Nevertheless, despite the deterioration in properties, their level remains quite high compared to composites based on SEBS/PO–30%, and the value of εb exceeds 180%, which allows the resulting composite to be considered highly plastic.
To study the structure of PA6/PO composites containing pAl and NAl, SEM was used; the results are shown in Figure 2. Analysis of the chip surface of composition 2, Figure 2a, shows that the filler in the polymer matrix is present not only in the form of finely dispersed particles less than 10 μm in size, but also in the form of agglomerates and large particles with sizes of about 120 μm. The distribution of pAl in blends containing both HDPE and fPE-E is approximately the same—uniformly dispersed filler in a polymer matrix. It should be noted that the surface of the chip of the blend containing functionalized polyolefin is significantly smoother and has no small voids, Figure 2a, which look like uniformly distributed dark spots. Voids are formed as a result of the removal of HDPE particles weakly bound to PA6. Since fPE-E has a significantly higher level of interphase adhesion to PA6, such voids are practically absent on the chips of the PA6/fPE-E blend containing pAl, Figure 2c.
The introduction of NAl instead of pAl into the PA6/PO blend does not lead to a significant change in the chip pattern, except that the size of the inclusions does not exceed 20 μm, Figure 2b,d. When the second component of the blend is fPE-E, the surface of the chip is smooth, without voids, and the size of the filler particles is approximately the same as when using HDPE. Thus, the presence or absence of polar groups in the polyolefin component does not have a noticeable effect on the distribution of both metal (pAl) and ceramic (NAl) fillers in the PA6/PO–30% matrix.
The formation of the IPN structure in the PA6/fPE-E blend does not significantly change the distribution pattern of the pAl filler (Figure 2c). The surface of the chip remains fairly smooth, and the metal filler particles and their agglomerates have shapes and sizes similar to those observed at lower fPE-E contents, Figure 2c. The distribution pattern of the filler also remains unchanged.
As a result of SEM analysis of compositions 10 and 13 (Figure 3), it was found that the resulting chip surfaces are smooth and do not contain tears. As in the case of PA6/PO, the use of fPP did not affect the distribution of filler particles in the blend matrix. It should be noted that the particle size reaches ≈120 μm for both types of blends, which, together with similar results obtained for PA6/PO blends, indicates the secondary role of grafted groups in the PO macromolecule in the dispersion of aluminum powder filler.
Interestingly, despite significant differences in rheological and thermophysical properties, as well as different affinities of polymer components of blends to the modifiers used, SEM analysis did not reveal any selective distribution of the fillers between them.
The DMA method was used to evaluate the level of compatibility achieved in blended polymer matrices. It was found that the glass transition temperature (Tg) of PA6, both unmodified and functionalized, remains virtually unchanged when PO is introduced, indicating that these components are not fully compatible. Nevertheless, in the case of fPE-E, the deformation capacity (εb) remains high (Figure 1), indicating good technological compatibility. It should be noted that both pAl and NAl shift the PA6 glass transition peak to a higher temperature range (up to ≈6 °C; Table 2). This confirms the interphase interaction of this polymer with the fillers used.
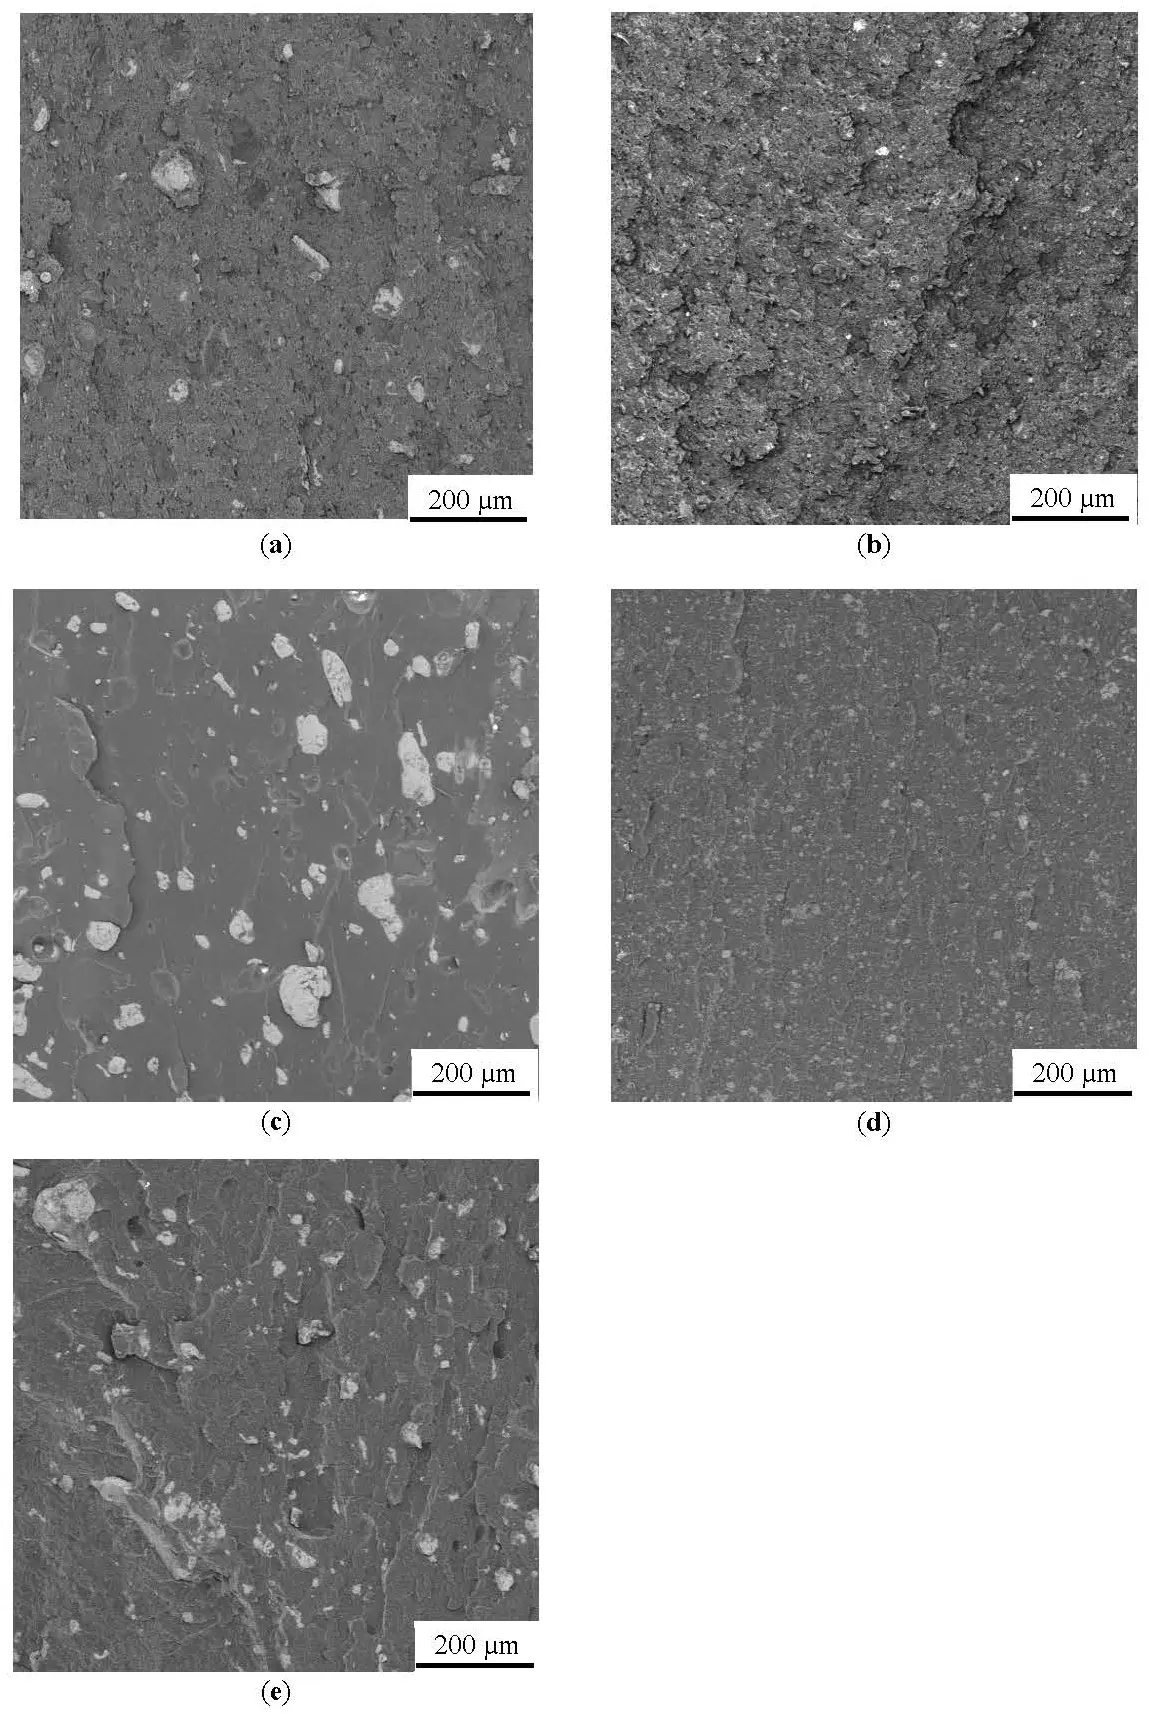
Figure 2. SEM photographs of chips of PA6/PO blends modified with heat-conductive fillers: (a) Composition 2; (b) Composition 3; (c) Composition 5; (d) Composition 6; (e) Composition 8.
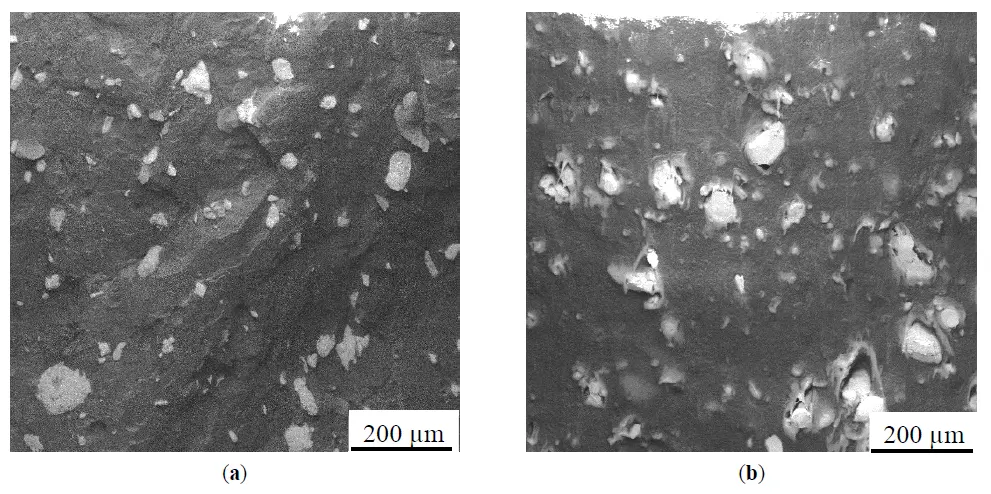
Figure 3. SEM photographs of chips of SEBS/PO blends modified with heat-conductive fillers: (a) Composition 10; (b) Composition 13.
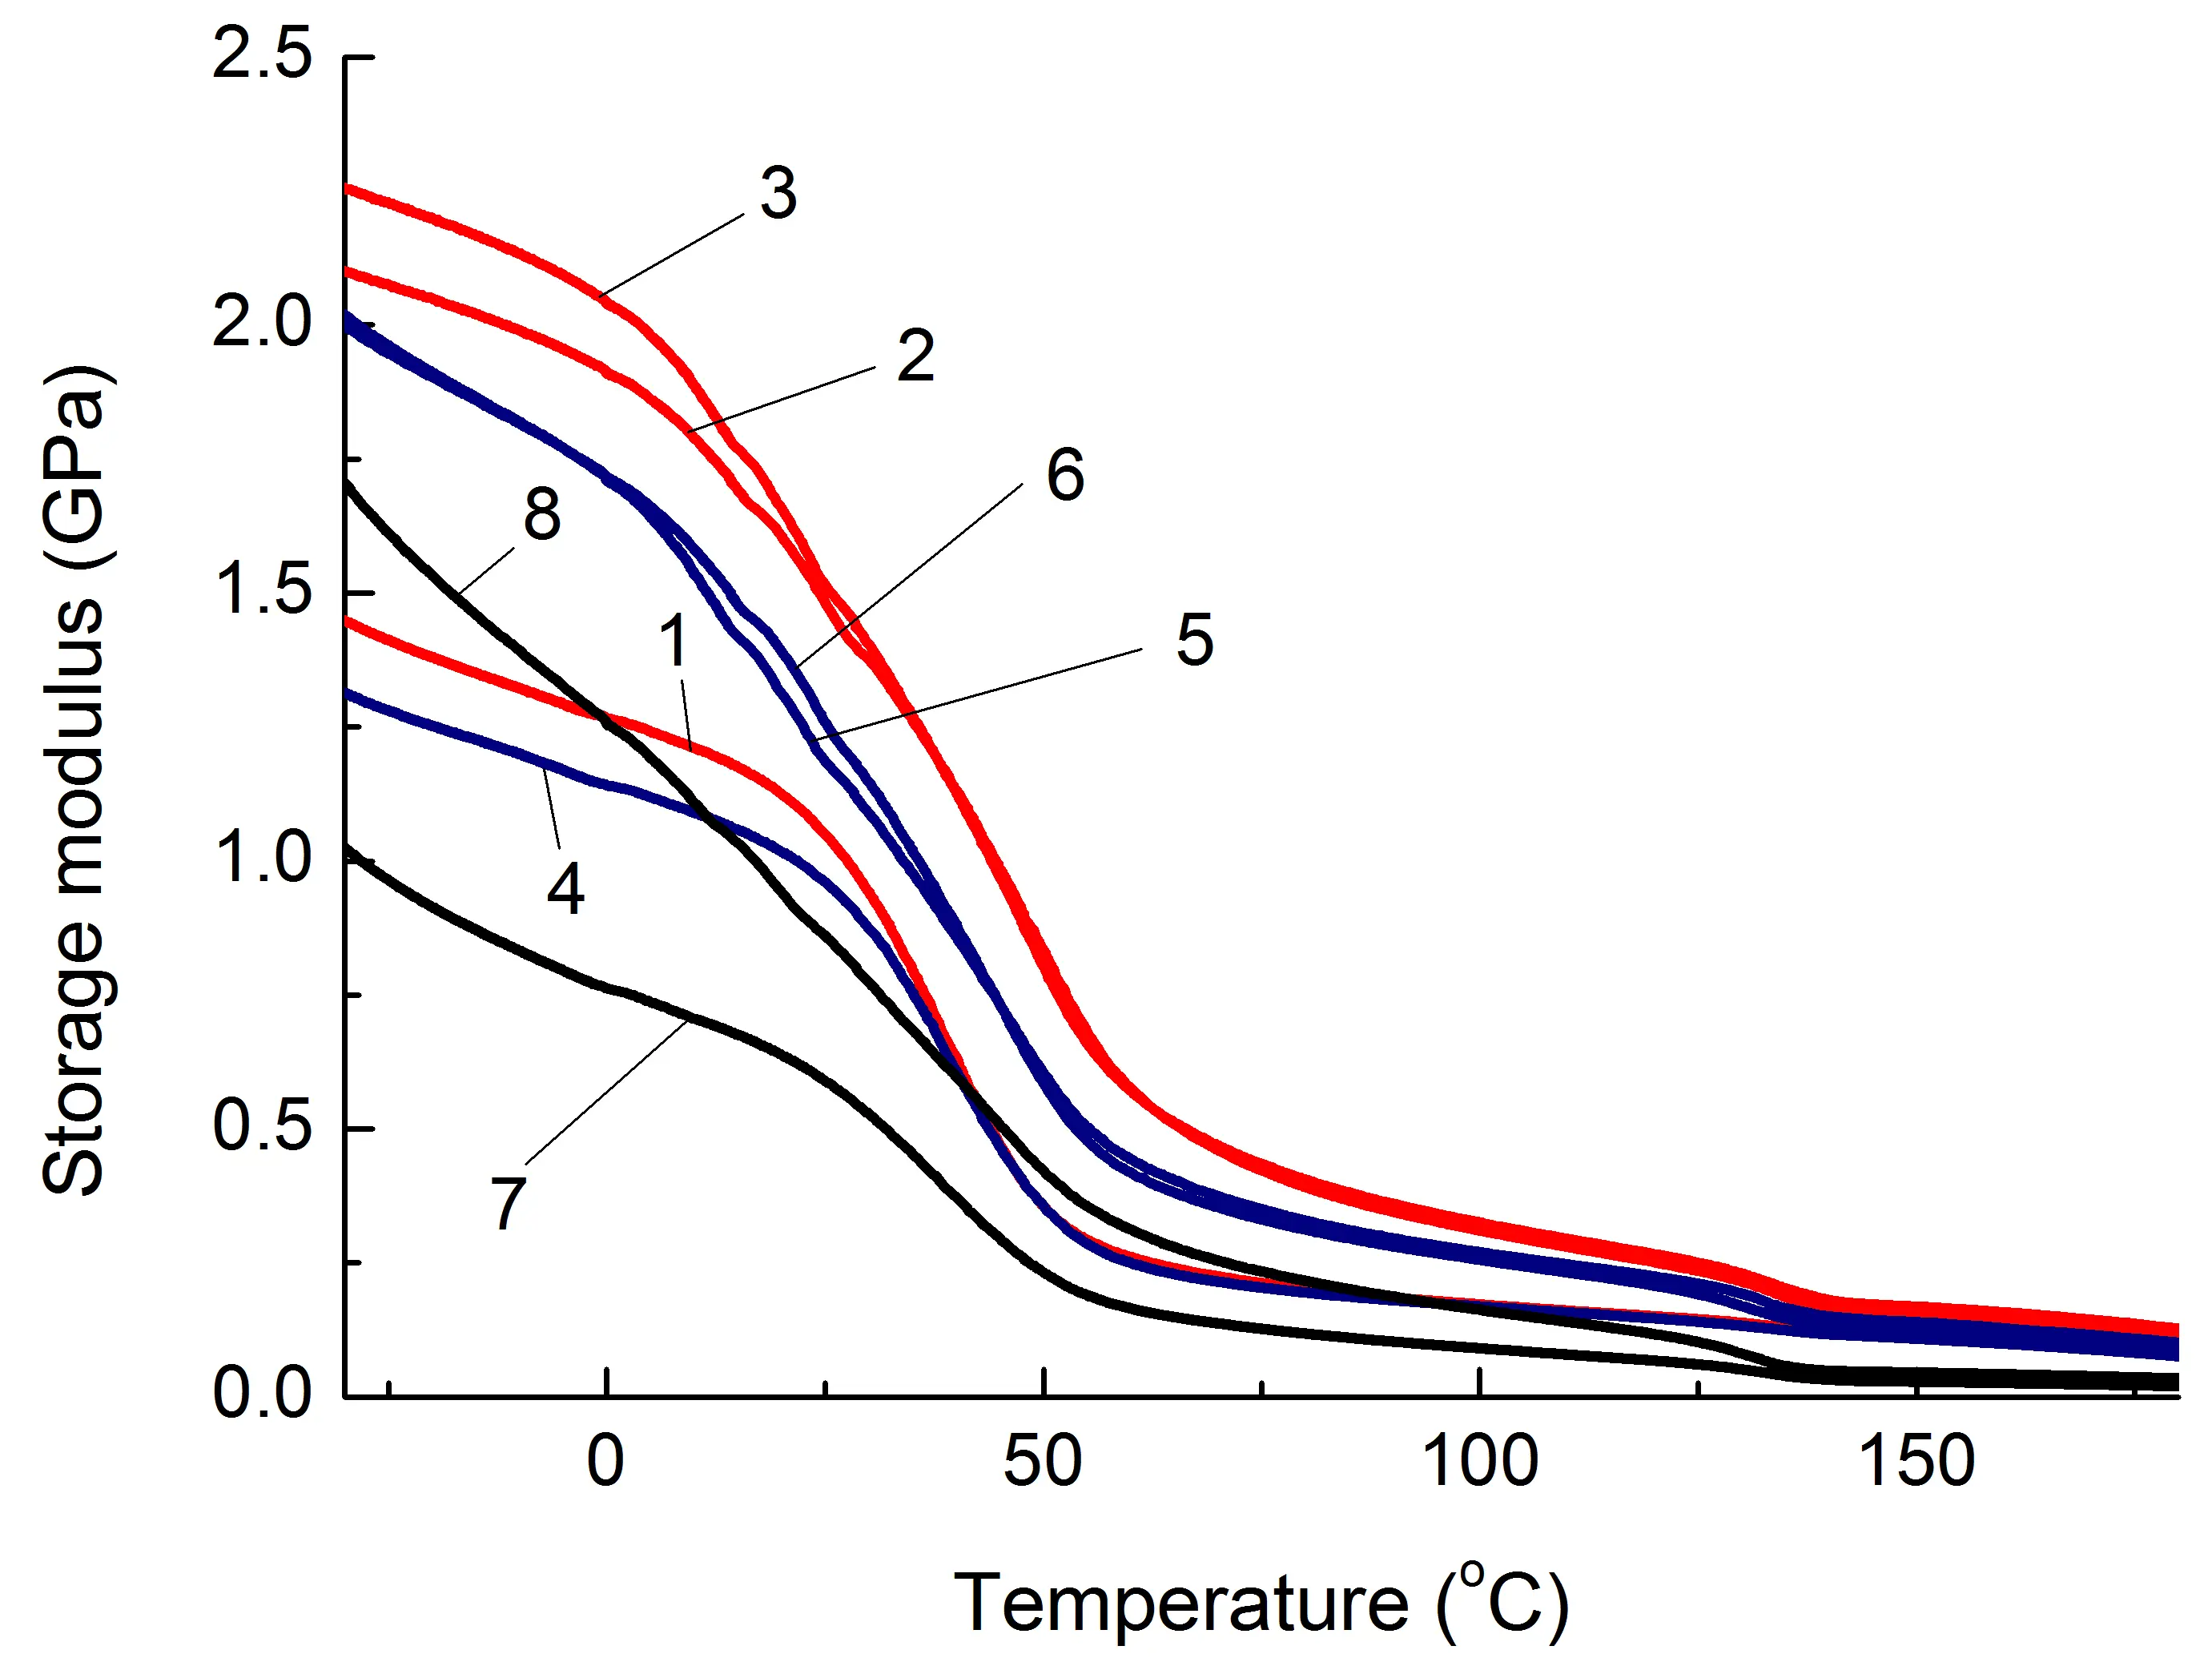
Data on changes in the mechanical properties of composites depending on temperature are of practical importance. One of the key characteristics in this regard is the storage modulus (G′), Figure 4, which is estimated using the DMA method.
 |
 |
| (a) | (b) |
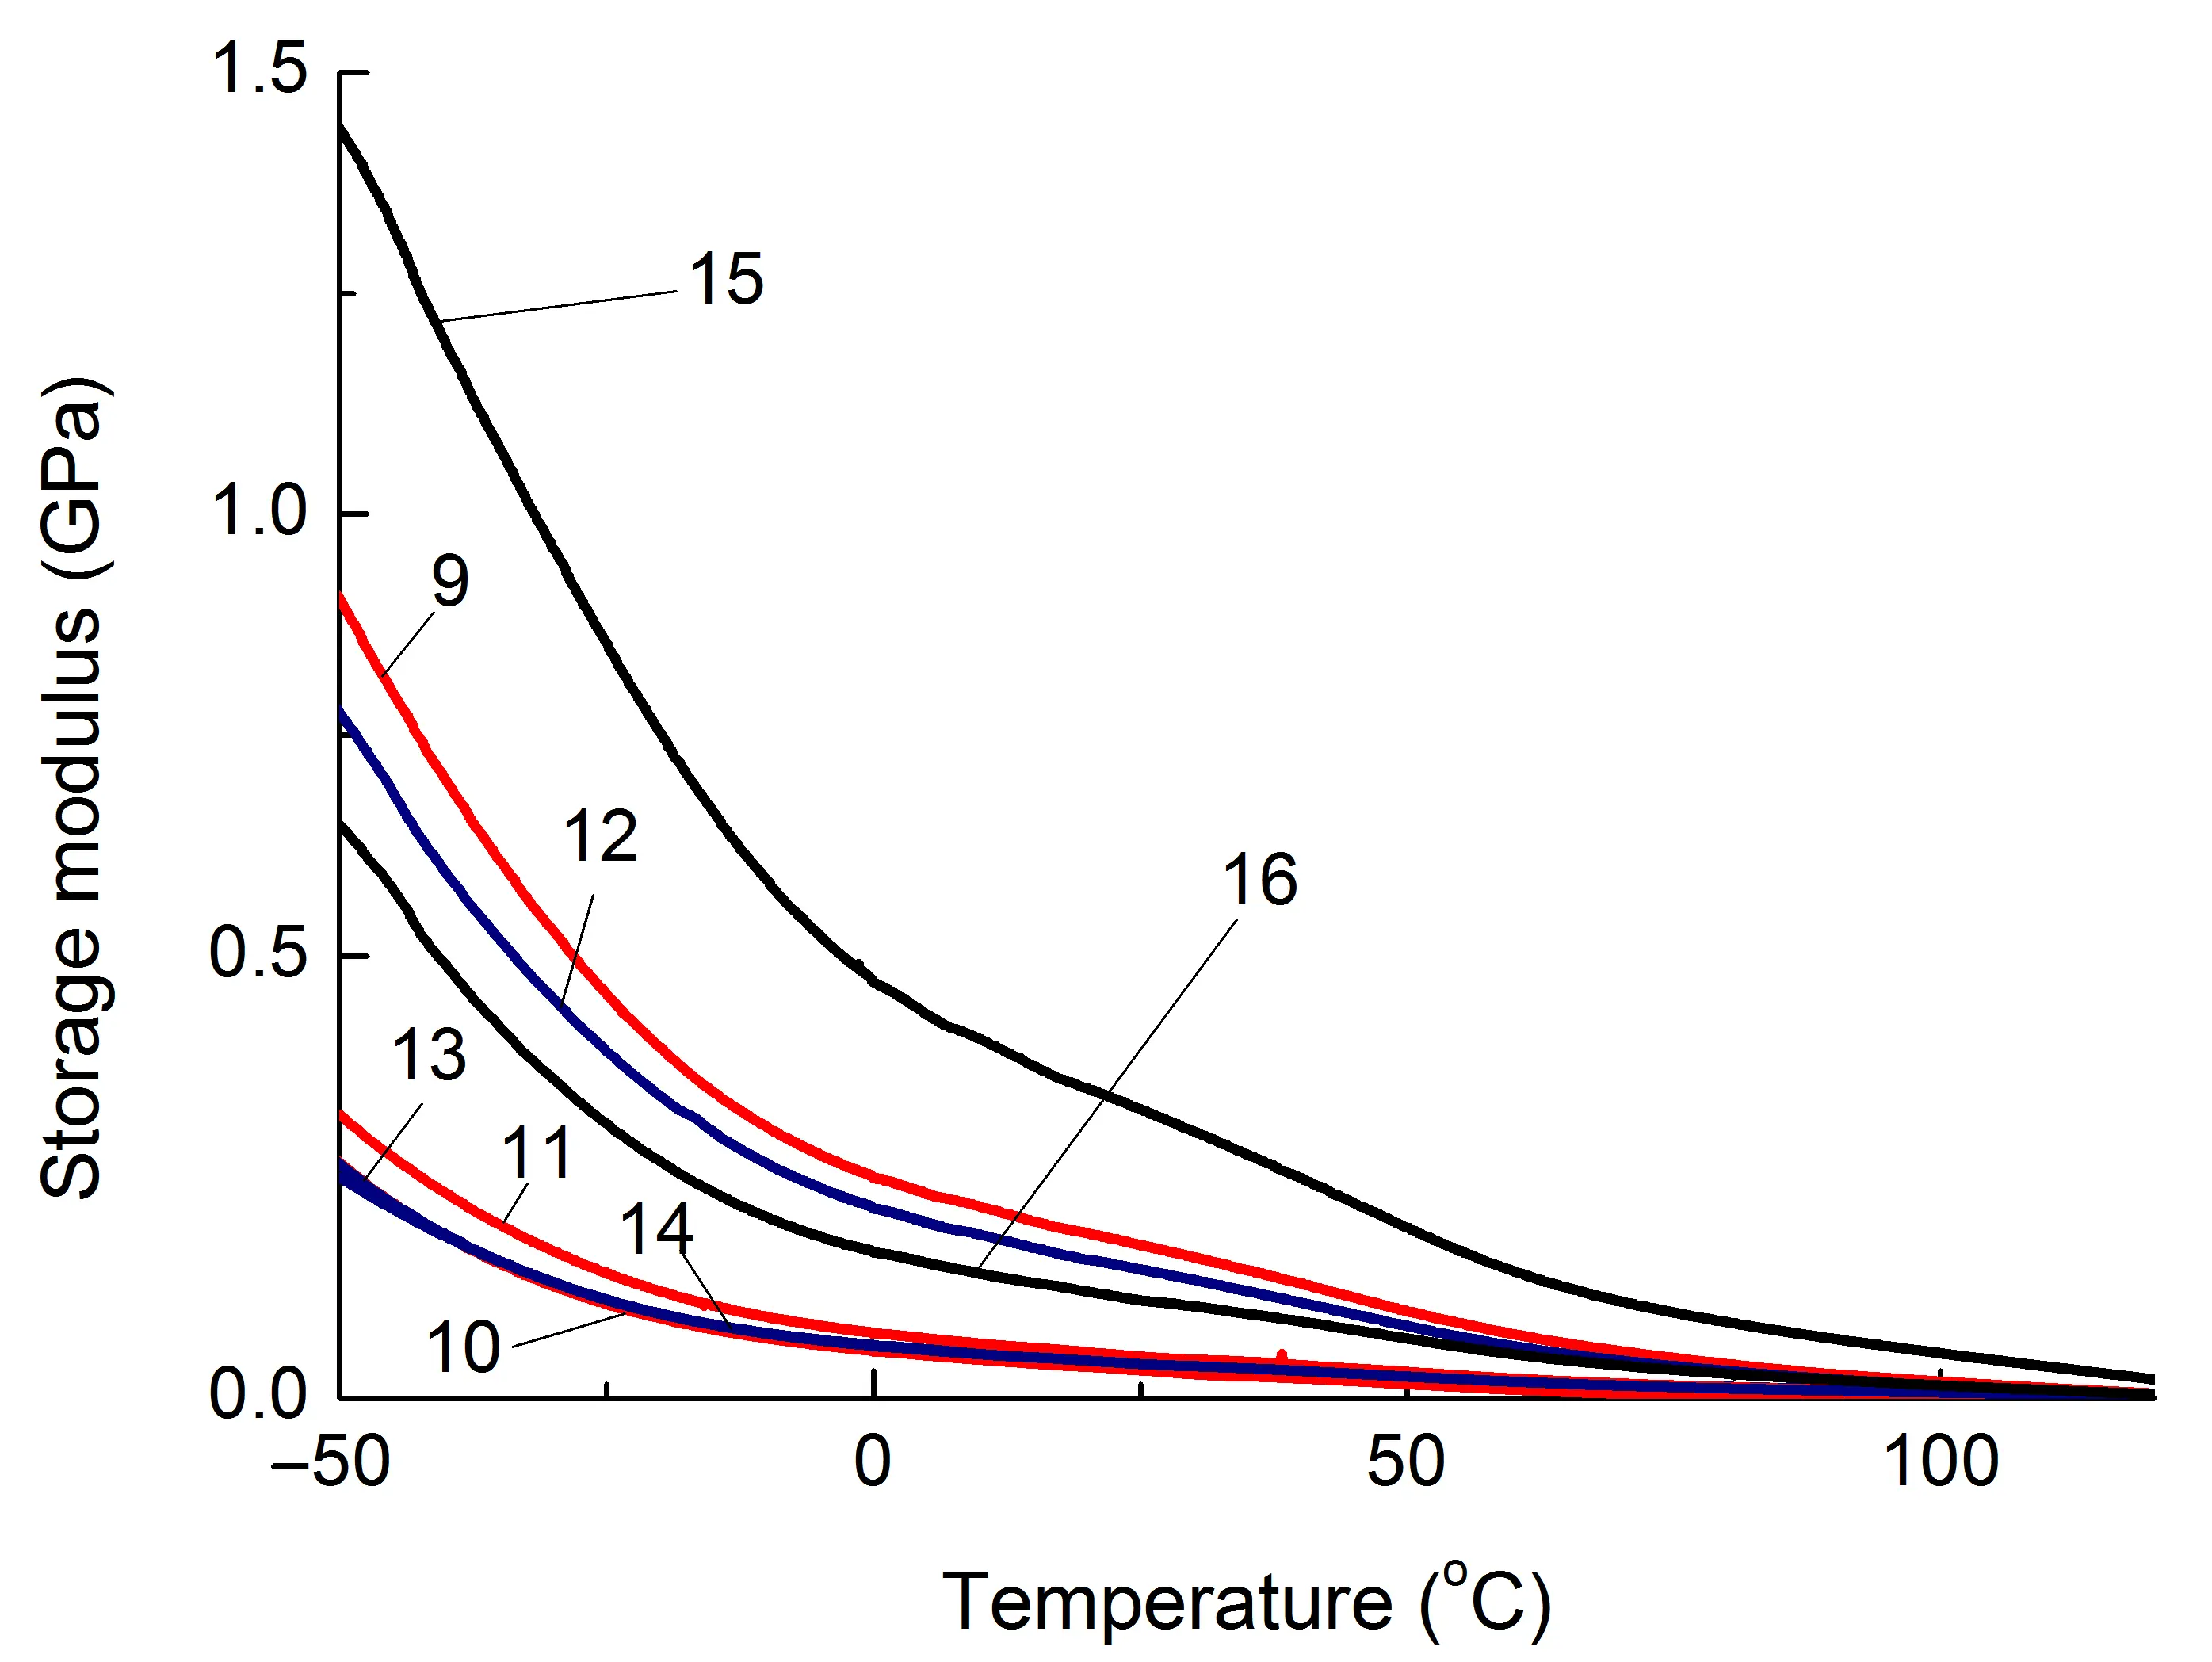
Figure 4. Dependence of the storage modulus (G′) of the studied composites based on PA6 (a) and SEBS (b) on temperature. The numbering of the curves corresponds to the following compositions: 1—PA6/HDPE–25%; 2—PA6/HDPE–17.5%/pAl–30.0; 3—PA6/HDPE–17.5%/NAl–30.0; 4—PA6/fPE-E–25%; 5—PA6/fPE-E–17.5%/pAl–30.0; 6—PA6/fPE-E–17.5%/NAl–30.0; 7—PA6/fPE-E–50%; 8—PA6/fPE-E–35.0%/pAl–30.0%; 9—SEBS/PP–25%; 10—SEBS/PP–17.5%/pAl–30.0; 11—SEBS/PP–17.5%/NAl–30.0; 12—SEBS/fPP–25%; 13—SEBS/fPP–17.5%/pAl–30.0; 14—SEBS/fPP–17.5%/NAl–30.0; 15—SEBS/fPP–50%; 16—SEBS/fPP–35.0%/pAl–30.0%.
It has been established that both pAl and NAl have a reinforcing effect on PA6 containing both HDPE and fPE-E over the whole range of temperatures studied, Figure 4a, Table 2, compositions 2, 3, 5, 6, which appears in the increase in G′, and in the case of NAl, this increase is higher, Figure 4a, curves 5, 6. It should be noted that when using fPE-E, the moduli of composites containing 25% polyolefin component are lower than in the case of HDPE. Based on the fact that the continuous phase in the composite is formed by PA6, and its mechanical properties are significantly higher than those of polyolefin, it is PA6 that will determine the strength characteristics of PA6/PO blends. Since fPE-E interacts significantly more intensively with the PA6 component than HDPE [24], it is expected that the grafted polyolefin component will hinder the formation of the structure typical for PA6 when it is cooled from the melt and, as a result, reduce the G′ of the blend.
For PA6/fPE-E blend–50%, which forms IPN, the reinforcing effect of pAl also occurs, which is maintained throughout the entire temperature range studied, and the increase in G′ reaches 1.7 times, Figure 4, Table 2, composition 8.
Table 2. Values of some dynamic mechanical characteristics of the composites under study *.
| Composition Number, According to Table 1 | T, °C | Component | ||||||
|---|---|---|---|---|---|---|---|---|
| −30 | 0 | 30 | 60 | 100 | PA6 | HDPE | ||
| PA6/PO | ||||||||
| G′, GPa | Тg, °C/Atgδ, rel. un. | |||||||
| 1 | 1.45 | 1.27 | 0.94 | 0.26 | 0.17 | 52.5/6.7 | - | |
| 2 | 2.10 | 1.91 | 1.38 | 0.57 | 0.31 | 58.4/10.4 | - | |
| 3 | 2.26 | 2.04 | 1.40 | 0.58 | 0.33 | 57.2/11.3 | - | |
| 4 | 1.31 | 1.14 | 0.87 | 0.25 | 0.17 | 53.3/6.3 | - | |
| 5 | 2.05 | 1.74 | 1.02 | 0.41 | 0.26 | 55.5/7.9 | - | |
| 6 | 2.00 | 1.72 | 1.15 | 0.41 | 0.26 | 54.3/7.9 | - | |
| 7 | 1.02 | 0.76 | 0.53 | 0.17 | 0.09 | 53.4/9.0 | - | |
| 8 | 1.71 | 1.26 | 0.78 | 0.31 | 0.19 | 56.6/11.8 | - | |
| SEBS/PO | ||||||||
| G′, GPa | SEBS | PP | ||||||
| Soft Block | Rigid Block | |||||||
| 9 | 0.530 | 0.250 | 0.160 | 0.070 | 0.020 | −76.6/0.10 | 65.3/0.3 | −21.8/1.3 |
| 10 | 0.130 | 0.050 | 0.027 | 0.010 | n/d | −68.9/0.57 | 62.1/0.06 | −23.4/0.86 |
| 11 | 0.170 | 0.070 | 0.044 | 0.022 | 0.009 | −69.5/1.00 | 60.7/0.14 | −22.9/0.86 |
| 12 | 0.450 | 0.210 | 0.130 | 0.058 | 0.014 | −76.6/0.02 | 64.2/0.3 | −22.5/1.3 |
| 13 | 0.130 | 0.060 | 0.038 | 0.020 | 0.001 | −69.6/2.29 | 65.8/0.71 | −23.3/0.57 |
| 14 | 0.130 | 0.060 | 0.036 | 0.019 | 0.009 | −69.9/2.43 | 64.3/0.29 | −23.4/0.29 |
| 15 | 0.960 | 0.470 | 0.300 | 0.140 | 0.051 | n/d/- | 61.4/1.35 | −16.9/1.8 |
| 16 | 0.360 | 0.170 | 0.100 | 0.050 | 0.021 | n/d/- | 62.9/0.43 | −24.2/2.14 |
* n/d—not detected; “-”—Tg of HDPE was in the negative temperature range below the measurement limit of the device; “Atgδ”—glass transition peak area, converted to the proportion of the corresponding component.
When 25% fPP is introduced into SEBS instead of PP, no noticeable change in the maximum Tg temperatures of both components of the blend is observed, Table 2, compositions 9 and 12. Thus, the Tg for PP and fPP are −21.8 °C and −22.5 °C, respectively, which do not exceed 1 °C. The shifts in the glass transition temperatures of both soft (≈0 °C) and hard macromolecule blocks of SESB (≈1 °C), Figure 1, compositions 9 and 12, are insignificant. It follows that the presence of polar groups in polyolefin does not lead to an increase in the intensity of interaction between SEBS and PO.
Filling both pAl and NAl leads to a shift in Tg for both the soft block (in the case of the second component of the blend, which is fPP) and both blocks (in the case of PP) of SEBS. The increase in Tg, Table 2, compositions 10, 11, and 13, 14, of the soft block for blends with 30% PO is ≈7.7 °C and 7.1 °C, and for fPP is ≈7.0 °C and ≈6.7 °C, respectively. When any of the fillers is introduced, the Tg of the rigid block for the SEBS/PP blend decreases up to 4.7 °C, and the glass transition temperatures of PP and fPP shift slightly to lower temperatures (towards the glass transition peak of the soft block), to ≈1.6 °C and ≈0.9 °C, respectively.
Using the DMA method, it was not possible to detect the Tg of the soft SEBS block in the blend of SEBS/fPP–50%, which forms the IPN, and the composite based on it. One of the reasons may be a decrease in the power of this process due to a reduction in the proportion of this thermoplastic elastomer and, as a result, a significant weakening of the corresponding peak value, which makes it difficult to identify it clearly. At the same time, a shift in the Tg of the rigid SEBS block to a lower temperature range of 3.9 °C was established, Table 2, compound 15, and for the composite based on it by 2.9 °C, Table 2, compound 16, compared to materials containing the same components but with a lower PO content, Table 2, compounds 12 and 13, respectively. This indicates an increase in the segmental mobility of the SEBS rigid block, accompanied by an increase in fPP content and the formation of an IPN. In turn, the Tg of fPP in the SEBS/fPP blend–50% increases by 5.6 °C. That is, there is a convergence of the glass transition temperatures of the rigid block of SEBS and fPP, which indicates the presence of interaction between these components. Moreover, the presence of a filler prevents this interaction, which is expressed in a decrease in the Tg of fPP to −24.2 °C, which is close to the value of Tg ≈ −23.3 fPP in SEBS/fPP–25%/pAl–30% composite, with a simultaneous increase in the Tg of SEBS by 1.5 °C.
The introduction of pAl and NAl into the SEBS/PO blend in all cases leads to a decrease in G′, which can reach 6 times in the studied temperature range, Table 2 and Figure 4, compositions 10, 11, 13, 14 and 16. During the formation of the IPN, G′ increased significantly to values substantially higher than those of similar unfilled blends and composites, Figure 4, curves 15 and 16. This can be explained by the formation of a continuous phase of a more rigid PO, capable of withstanding the load.
Based on the results of DMA analysis, it can be concluded that in the case of a blend containing a highly polar polymer component (PA6), the fillers used act as reinforcing modifiers, increasing the overall stiffness of the polymer matrix. If both components of the blend are weakly polar (SEBS and PO), the opposite (weakening) action is observed. It has been established that the functionalization of the PO component of the SEBS/PP blend has no noticeable effect on this effect.
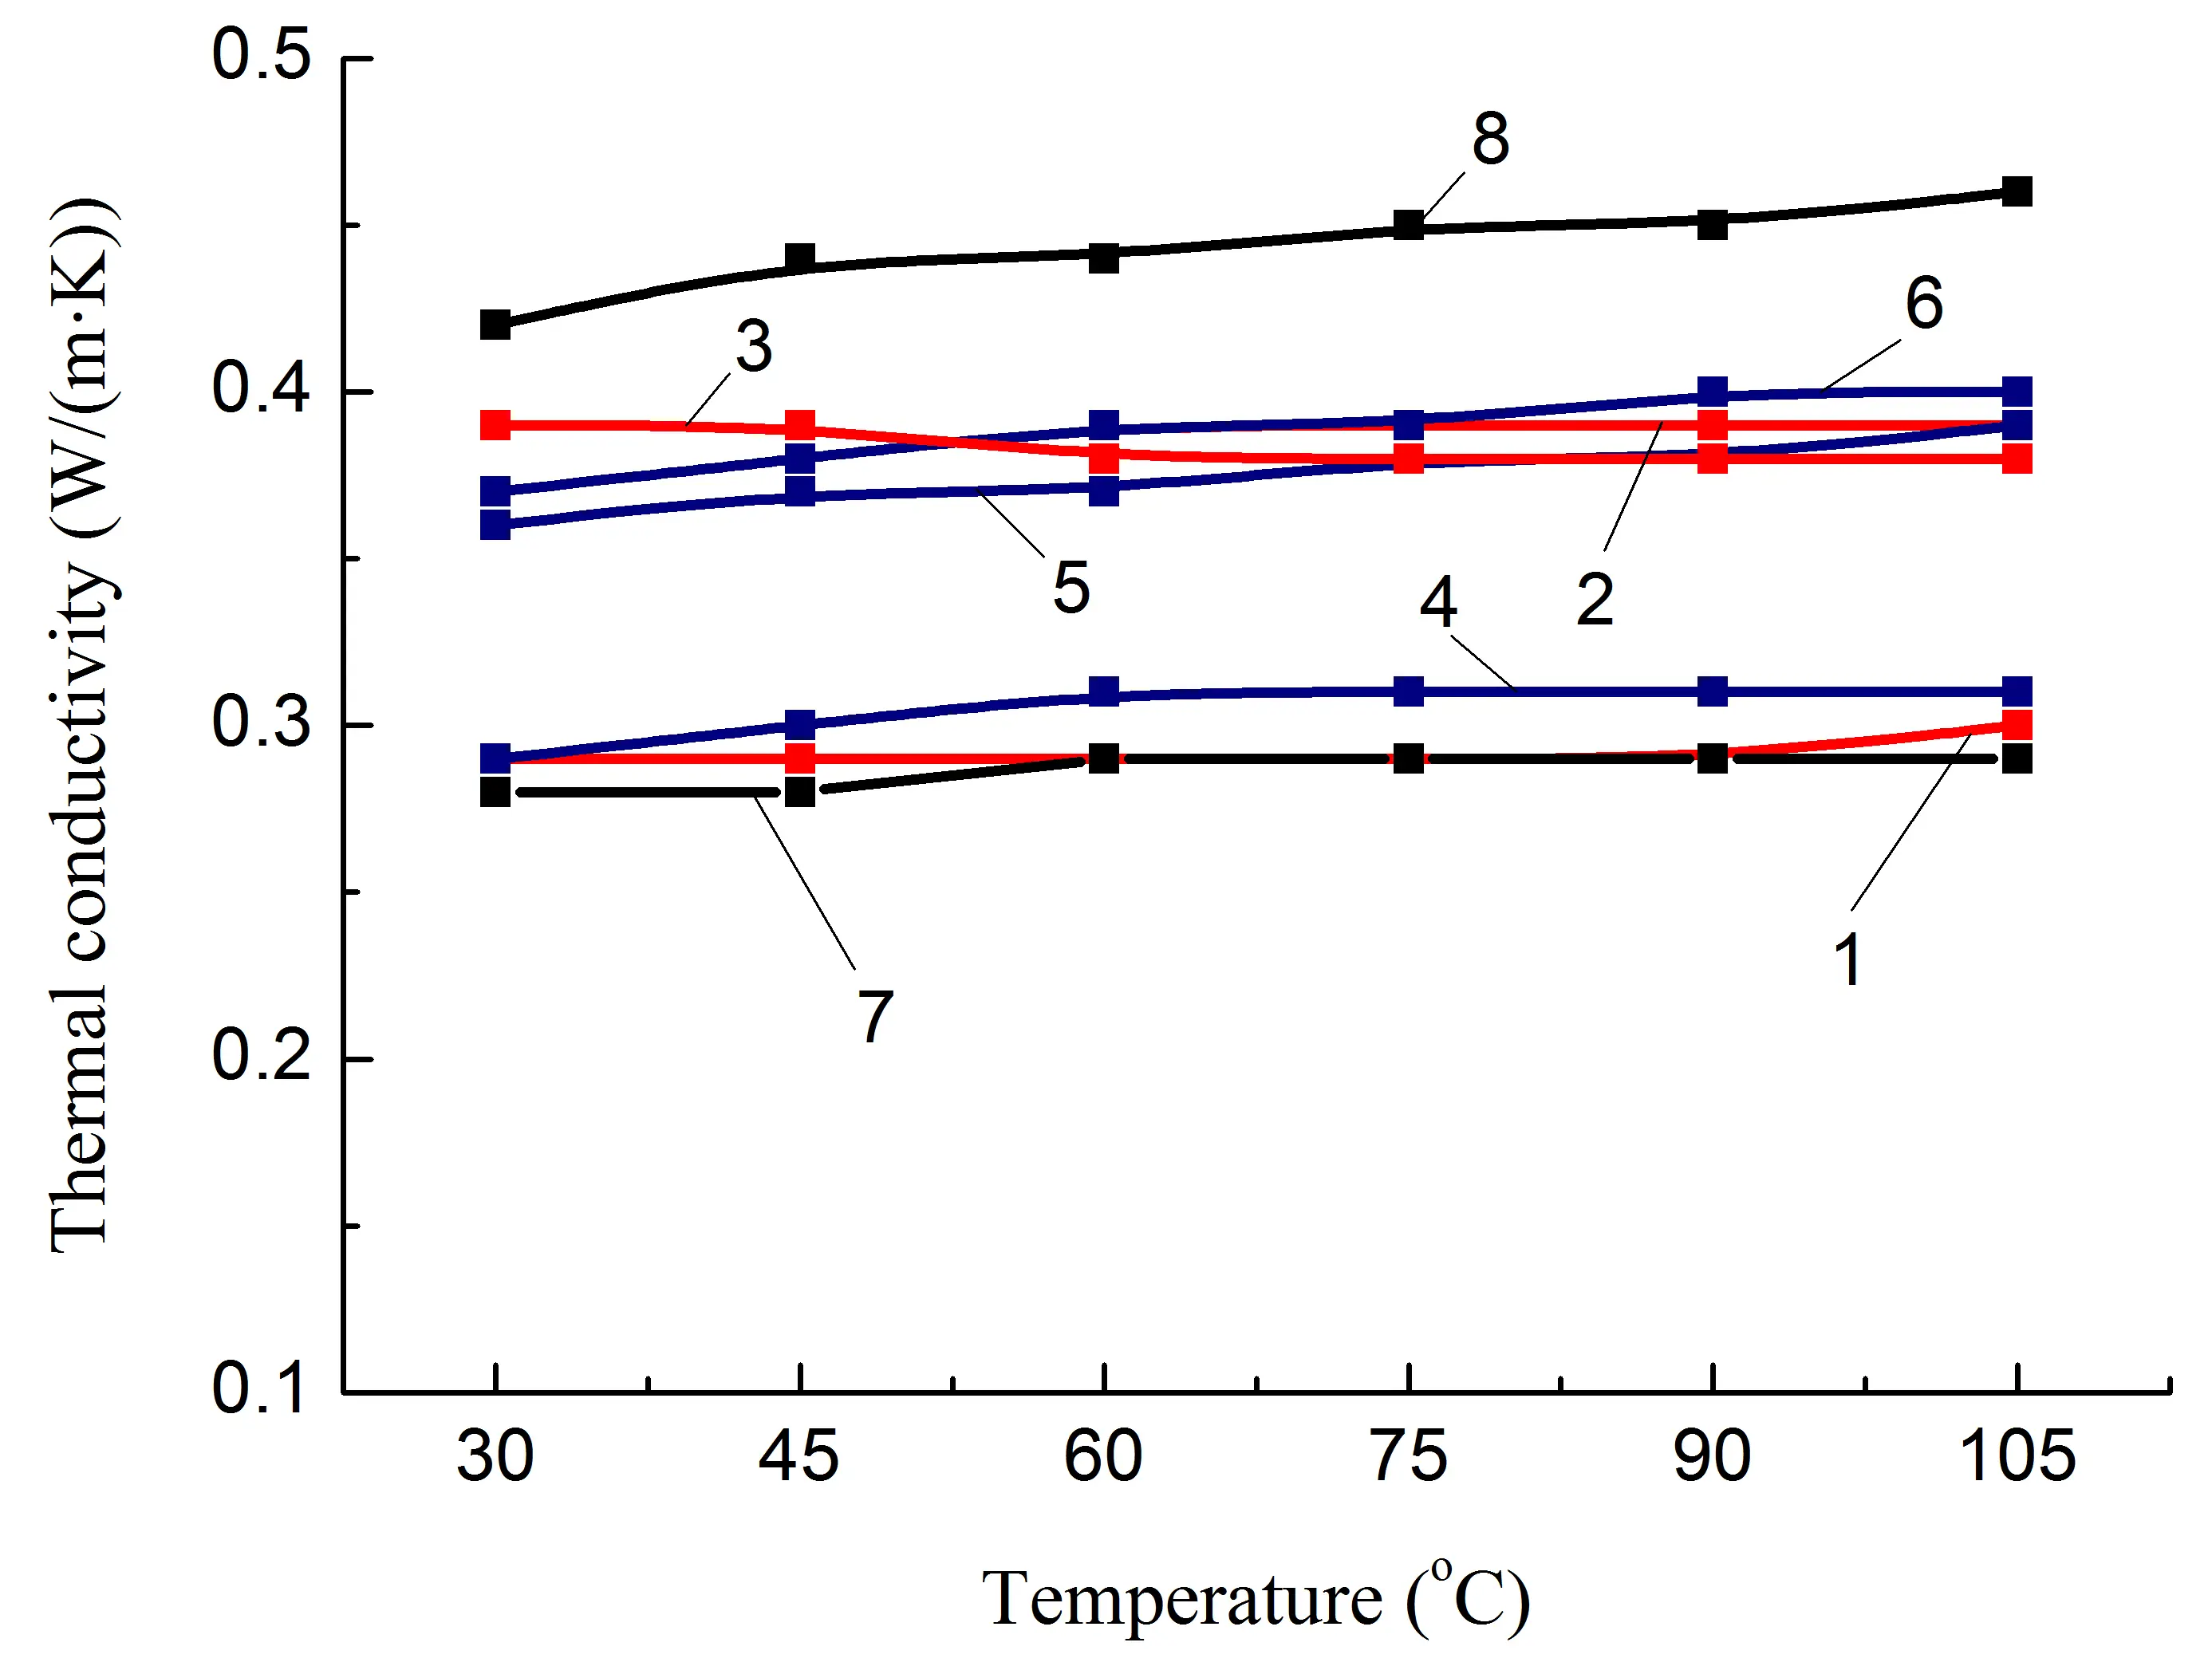
Mechanical tests and DMA confirmed significant changes in both the strength properties of the studied polymer blends and their relaxation characteristics (at the level of segmental mobility of macromolecules), caused by both intermolecular interaction of polymers in the blend and interaction with the filler. It is reasonable to assume that this should also affect the thermophysical properties of these materials. In this regard, a study of the thermal conductivity of the obtained composites was conducted (Figure 5).
It should be noted that the presence of voids in the volume of materials has a significant effect on their thermal conductivity coefficient (λ). The proportion of these voids can be estimated by comparing the calculated (ρcс) and measured (ρс) densities. The densities of the initial components of the blends were as follows: PA6–1.074 g/cm3, HDPE–0.946 g/cm3, fPE-E–0.890 g/cm3, SEBS–1.154 g/cm3, PP–0.910 g/cm3, fPP–0.915 g/cm3, aluminum (pAl)–2.673 g/cm3, NAl–3.244 g/cm3, and the densities of the composites obtained using them are presented in Table 3.
Analysis of the data obtained (Table 3) revealed that PA6/PO-based composites have an insignificant degree of undercompaction, which is comparable to the experimental error. This, in turn, is one of the indications of good wettability of the filler particles. At the same time, SEBS/PO-based composites containing heat-conducting additives have a significantly higher degree of undercompaction (up to ≈18%) than unfilled mixtures (up to ≈0.5%). It is unlikely that the lower actual density of composites compared to the theoretical density is associated with profound changes in the amorphous-crystalline structure of polymers. Most probable is insufficient wetting of the filler by the SEBS/PO polymer matrix.
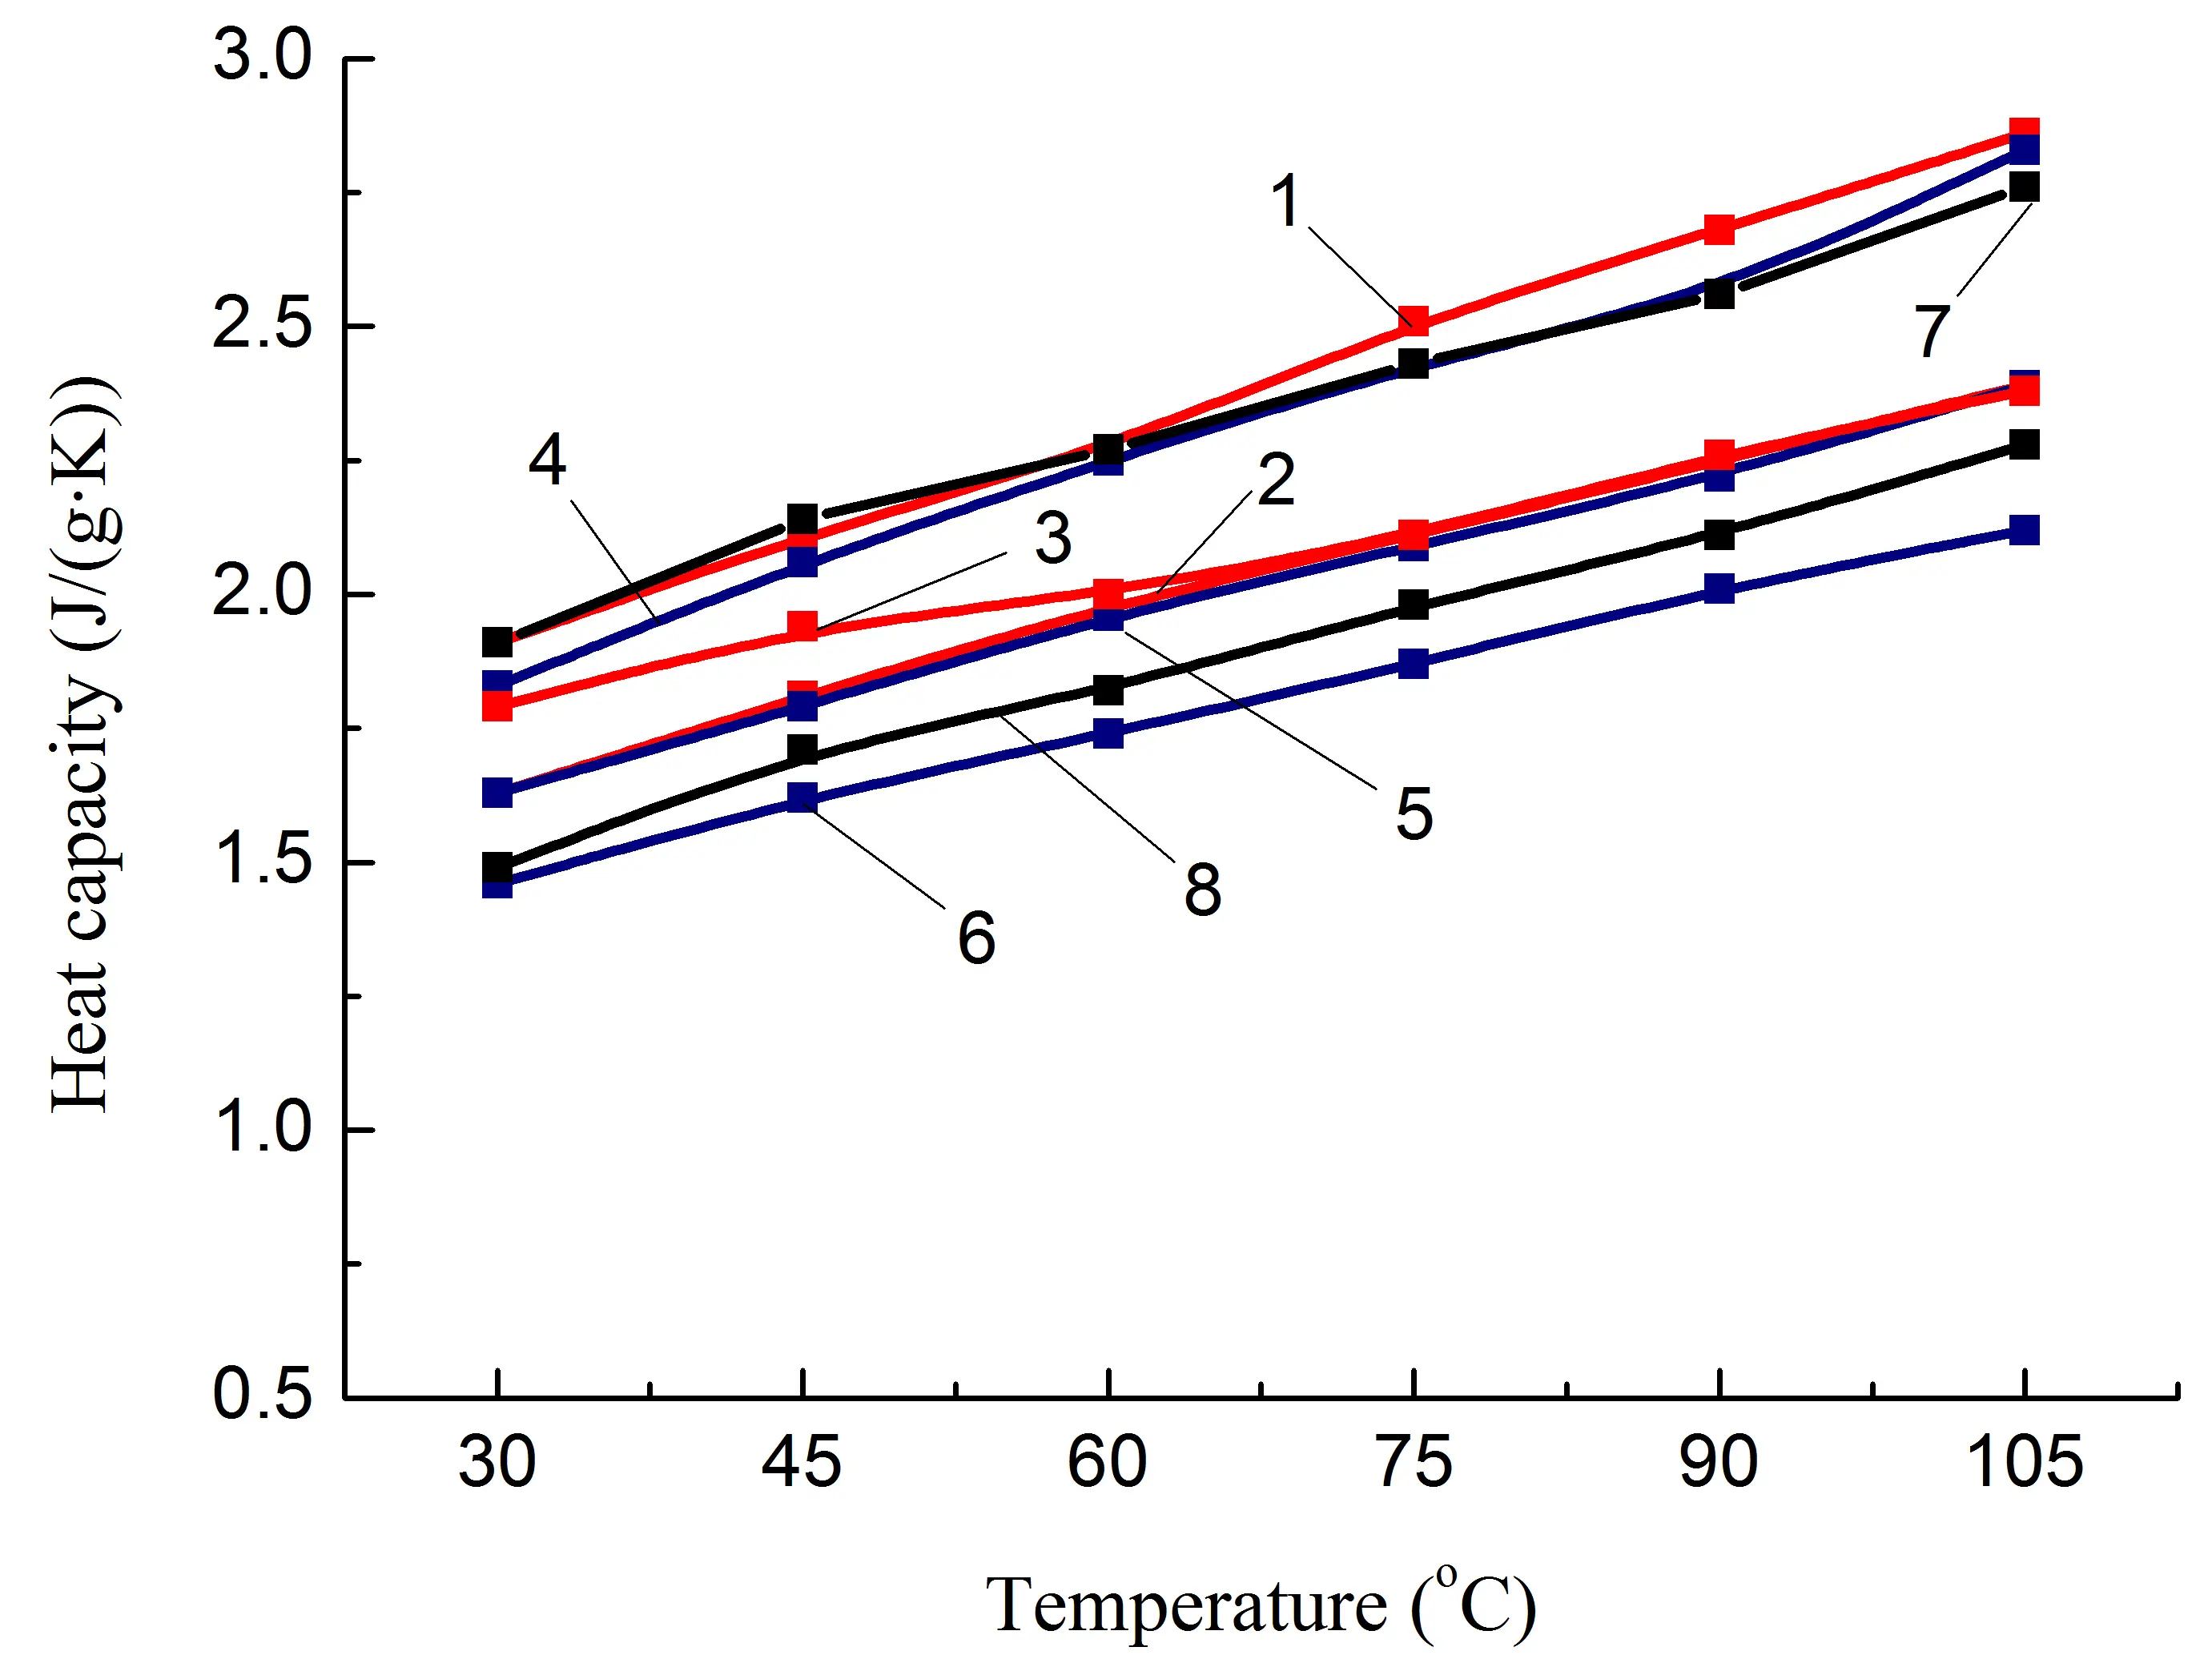
It has been established that regardless of the polyolefin content and the presence of polar groups (fPE-E) in its composition, λ of PA6/PO blends remains approximately at the same level in the temperature range of 30–105 °C, Figure 5a, compositions 1, 4. The introduction of both types of heat-conducting fillers (both pAl and NAl) allows increasing the λ of the PA6/PO blend. Moreover, the increase is almost the same for the studied filler concentration and is about 27%.
Table 3. Calculated (ρcc) and experimentally determined (ρc) by the immersion method density of composites.
|
Composition Number, According to Table 1 |
Parameter Name |
||
|---|---|---|---|
|
ρcc, g/cm3 |
ρc, g/cm3 |
Difference between ρcc and ρc, % |
|
|
1 |
1.039 |
1.026 |
−1.25 |
|
2 |
1.272 |
1.260 |
−0.94 |
|
3 |
1.305 |
1.300 |
−0.38 |
|
4 |
1.021 |
1.004 |
−1.67 |
|
5 |
1.254 |
1.242 |
−0.96 |
|
6 |
1.285 |
1.280 |
−0.39 |
|
7 |
0.973 |
0.969 |
−0.41 |
|
8 |
1.203 |
1.210 |
0.58 |
|
9 |
1.082 |
1.077 |
−0.46 |
|
10 |
1.317 |
1.100 |
−16.48 |
|
11 |
1.352 |
1.110 |
−17.90 |
|
12 |
1.083 |
1.090 |
0.65 |
|
13 |
1.319 |
1.080 |
−18.12 |
|
14 |
1.354 |
1.130 |
−16.54 |
|
15 |
1.021 |
1.023 |
0.20 |
|
16 |
1.285 |
1.130 |
−12.06 |
The formation of IPN and, as a result, longer heat conduction paths due to the PO phase does not lead to a noticeable change in λ, Figure 5a, composition 7, keeping it at the level of blends with a lower PO content, Figure 5a, compositions 1 and 4, which have a dispersed PO phase. Since the thermal conductivity of HDPE is higher than that of PA6 [18], it is reasonable to assume that the main reason for the lack of λ increase is the loss of conductivity in the PA6/PO interphase layer. In addition, an increase in the proportion of the amorphous phase of PA6, as evidenced by the increase in the glass transition peak area of composition 7 compared to that of composition 4 (Table 2), may also have a negative effect on the value of λ.
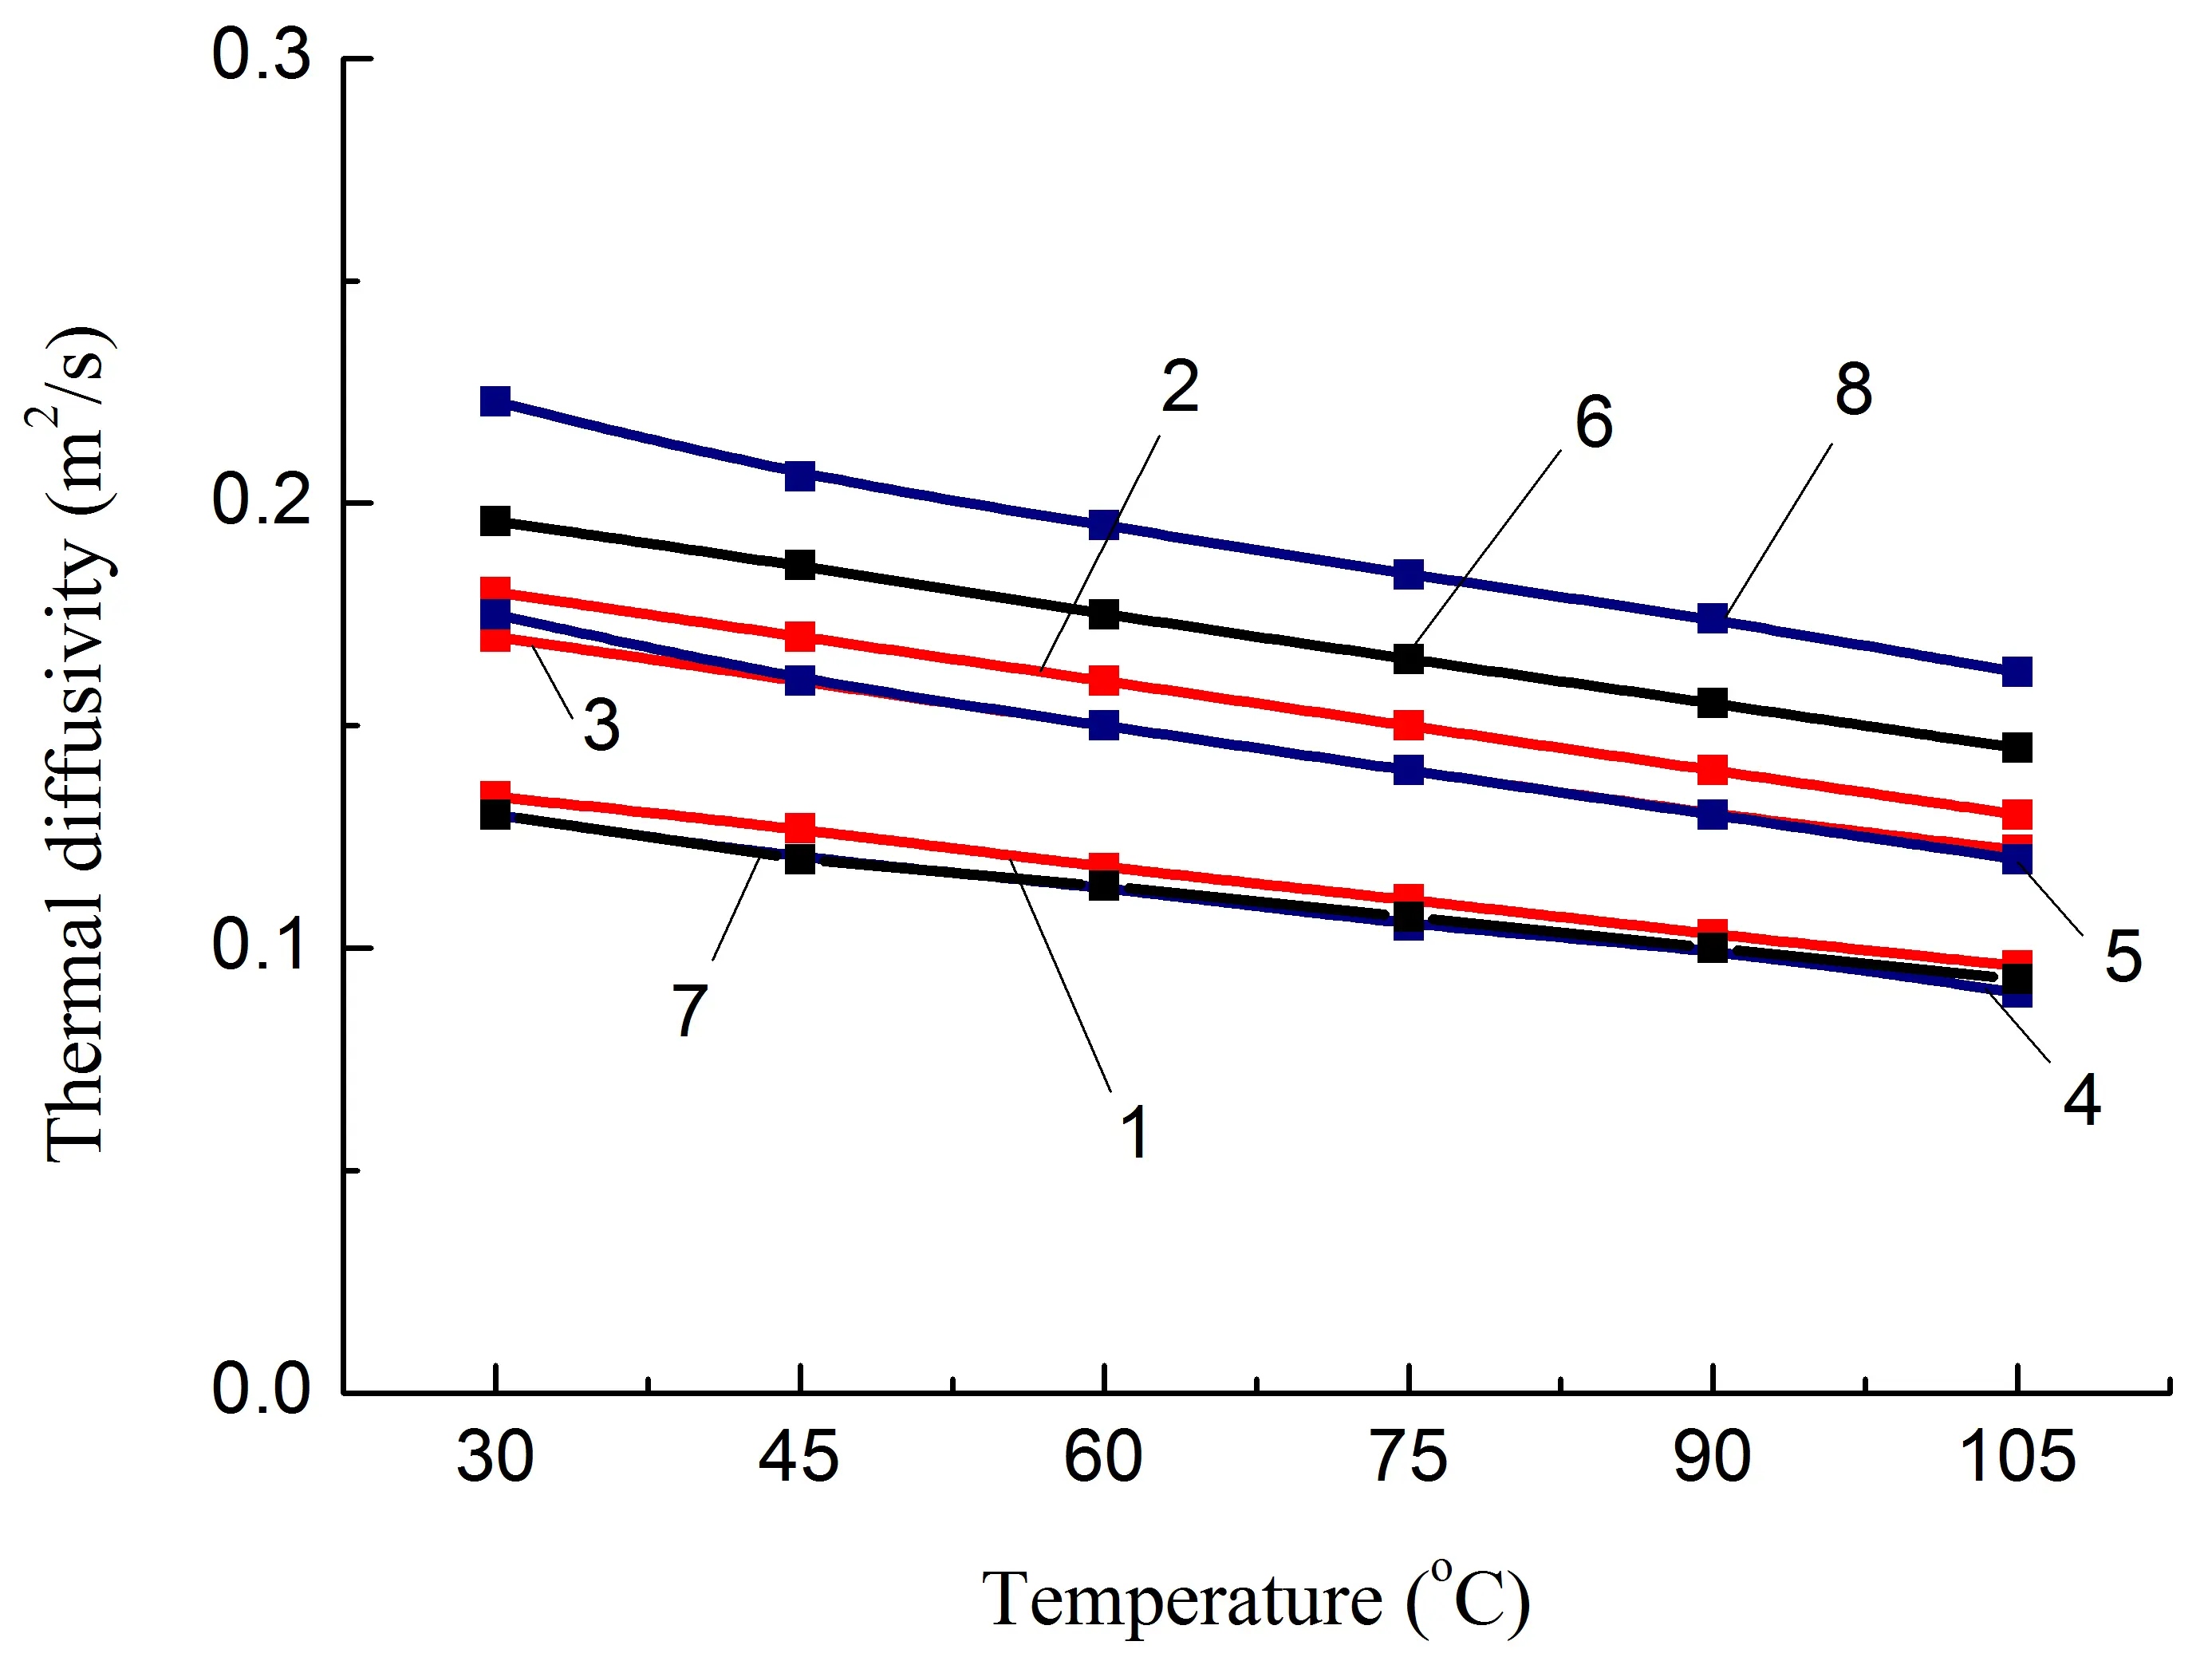
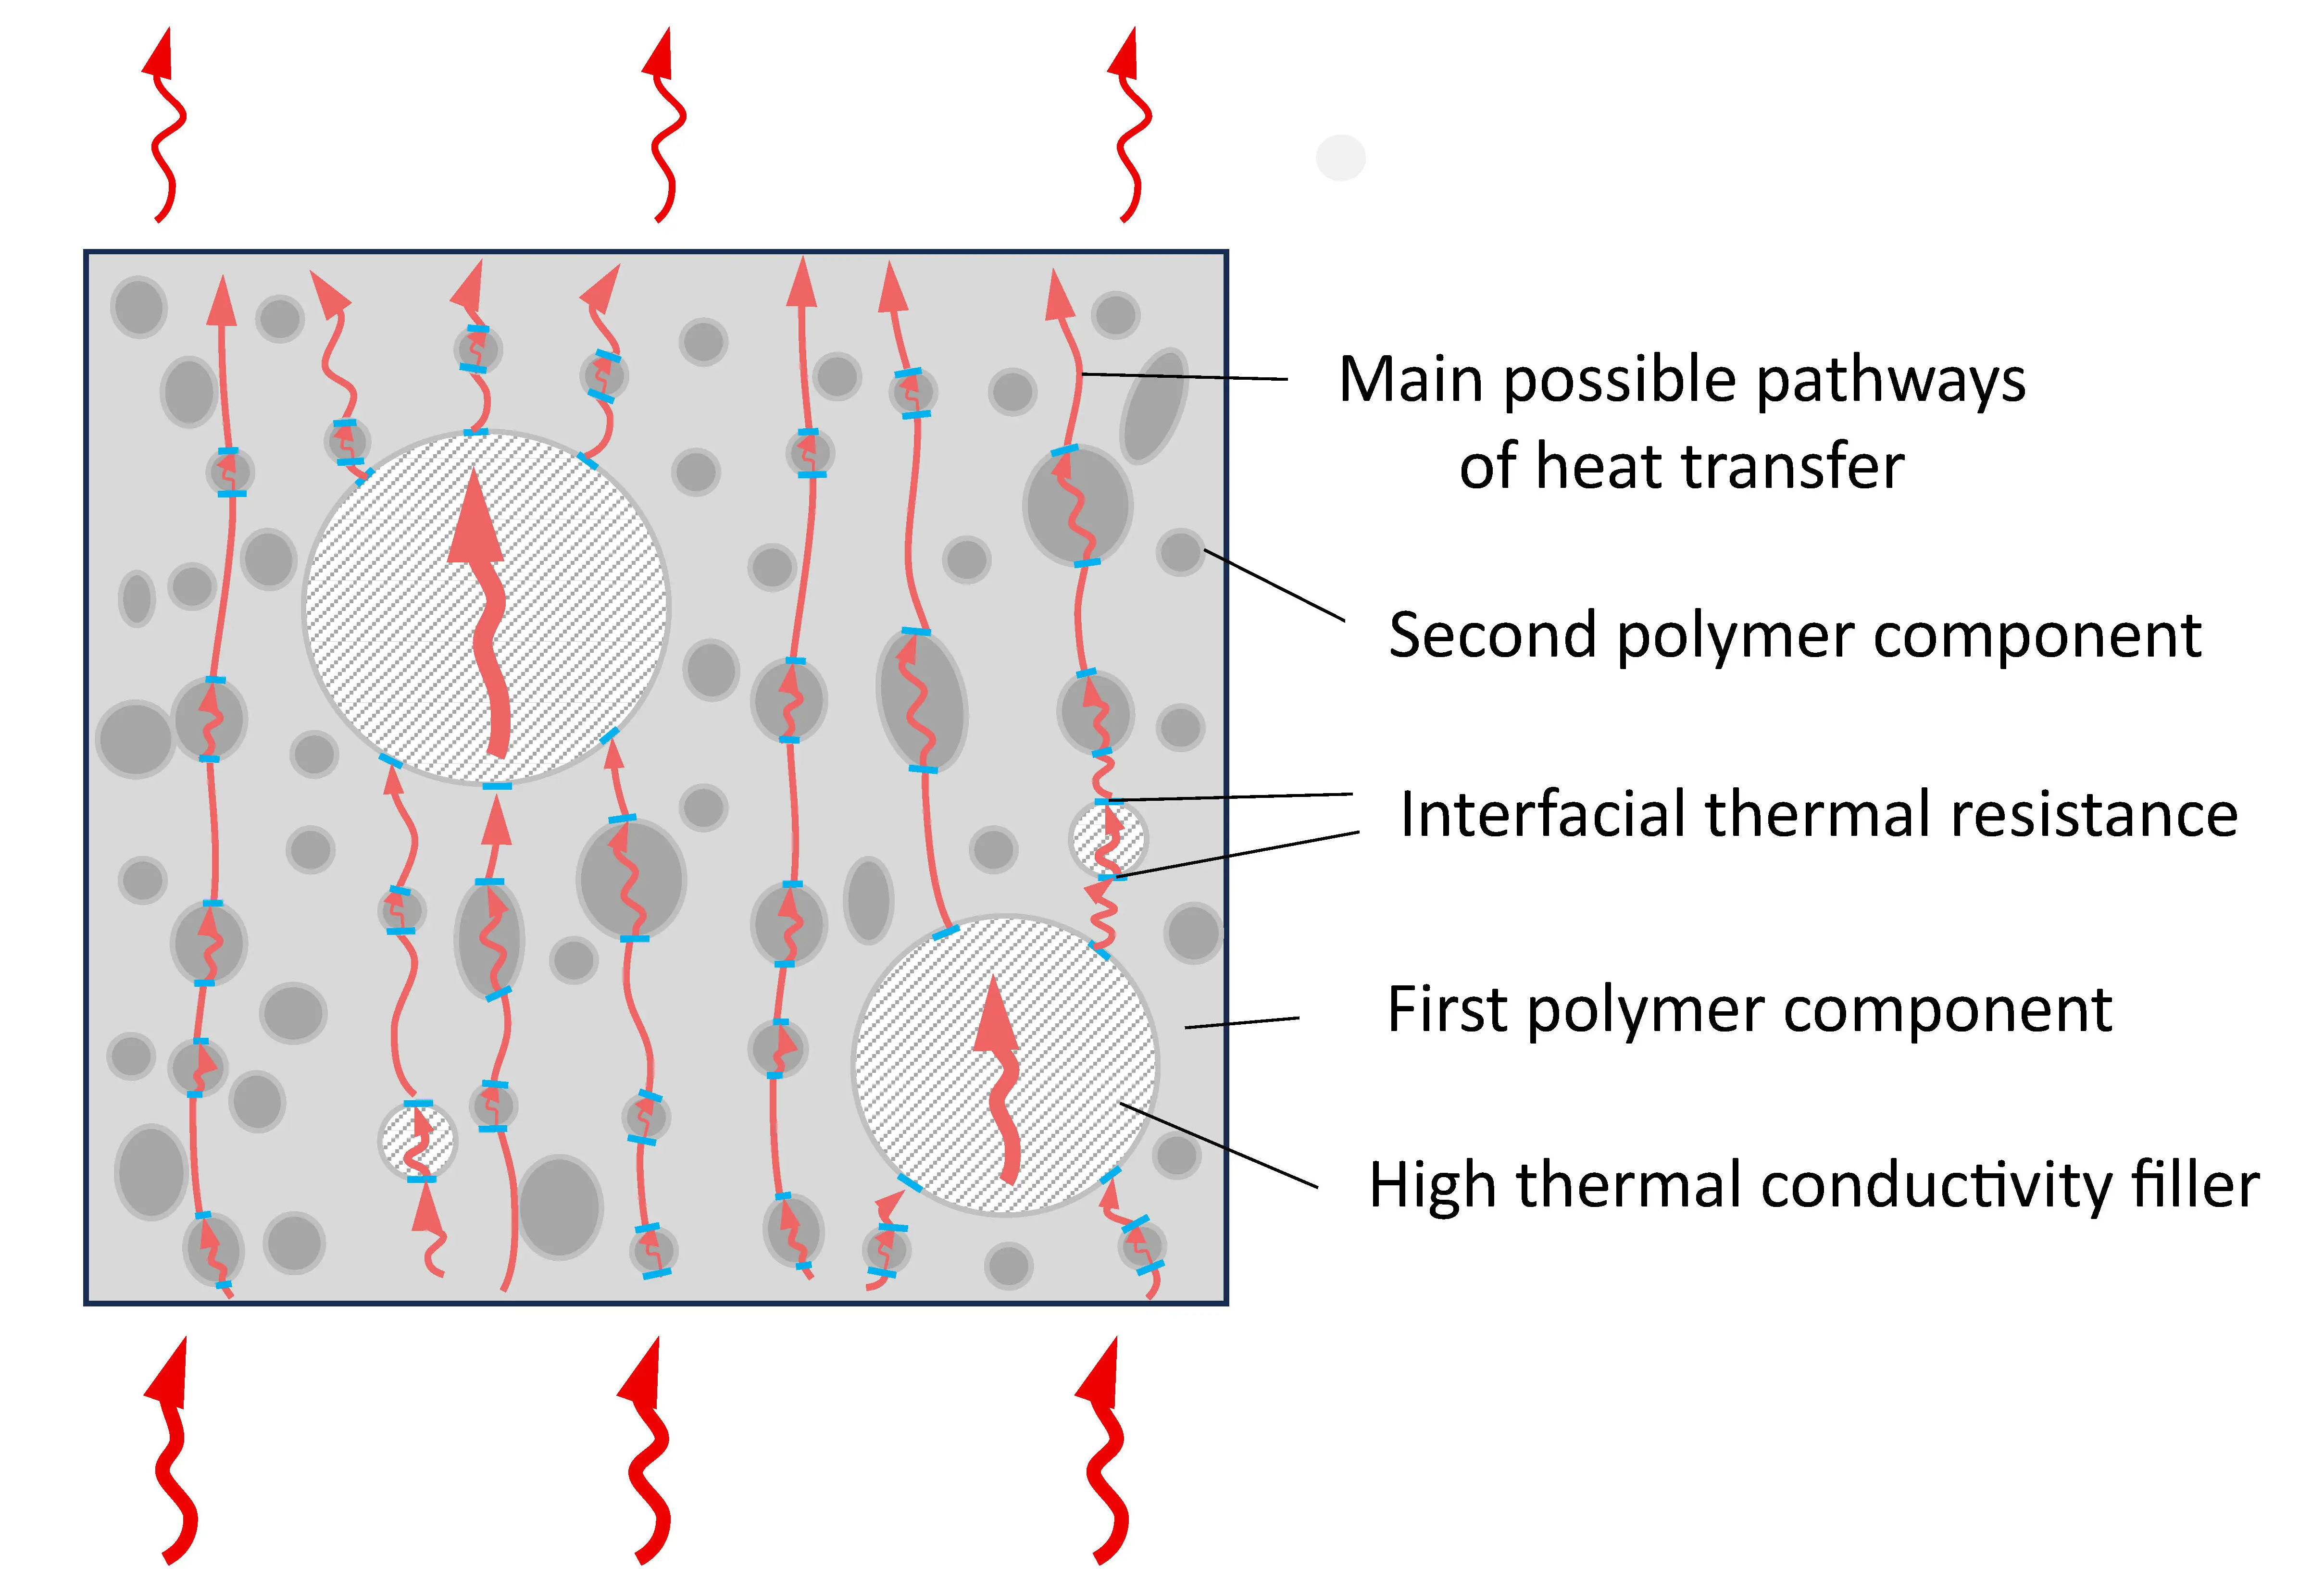
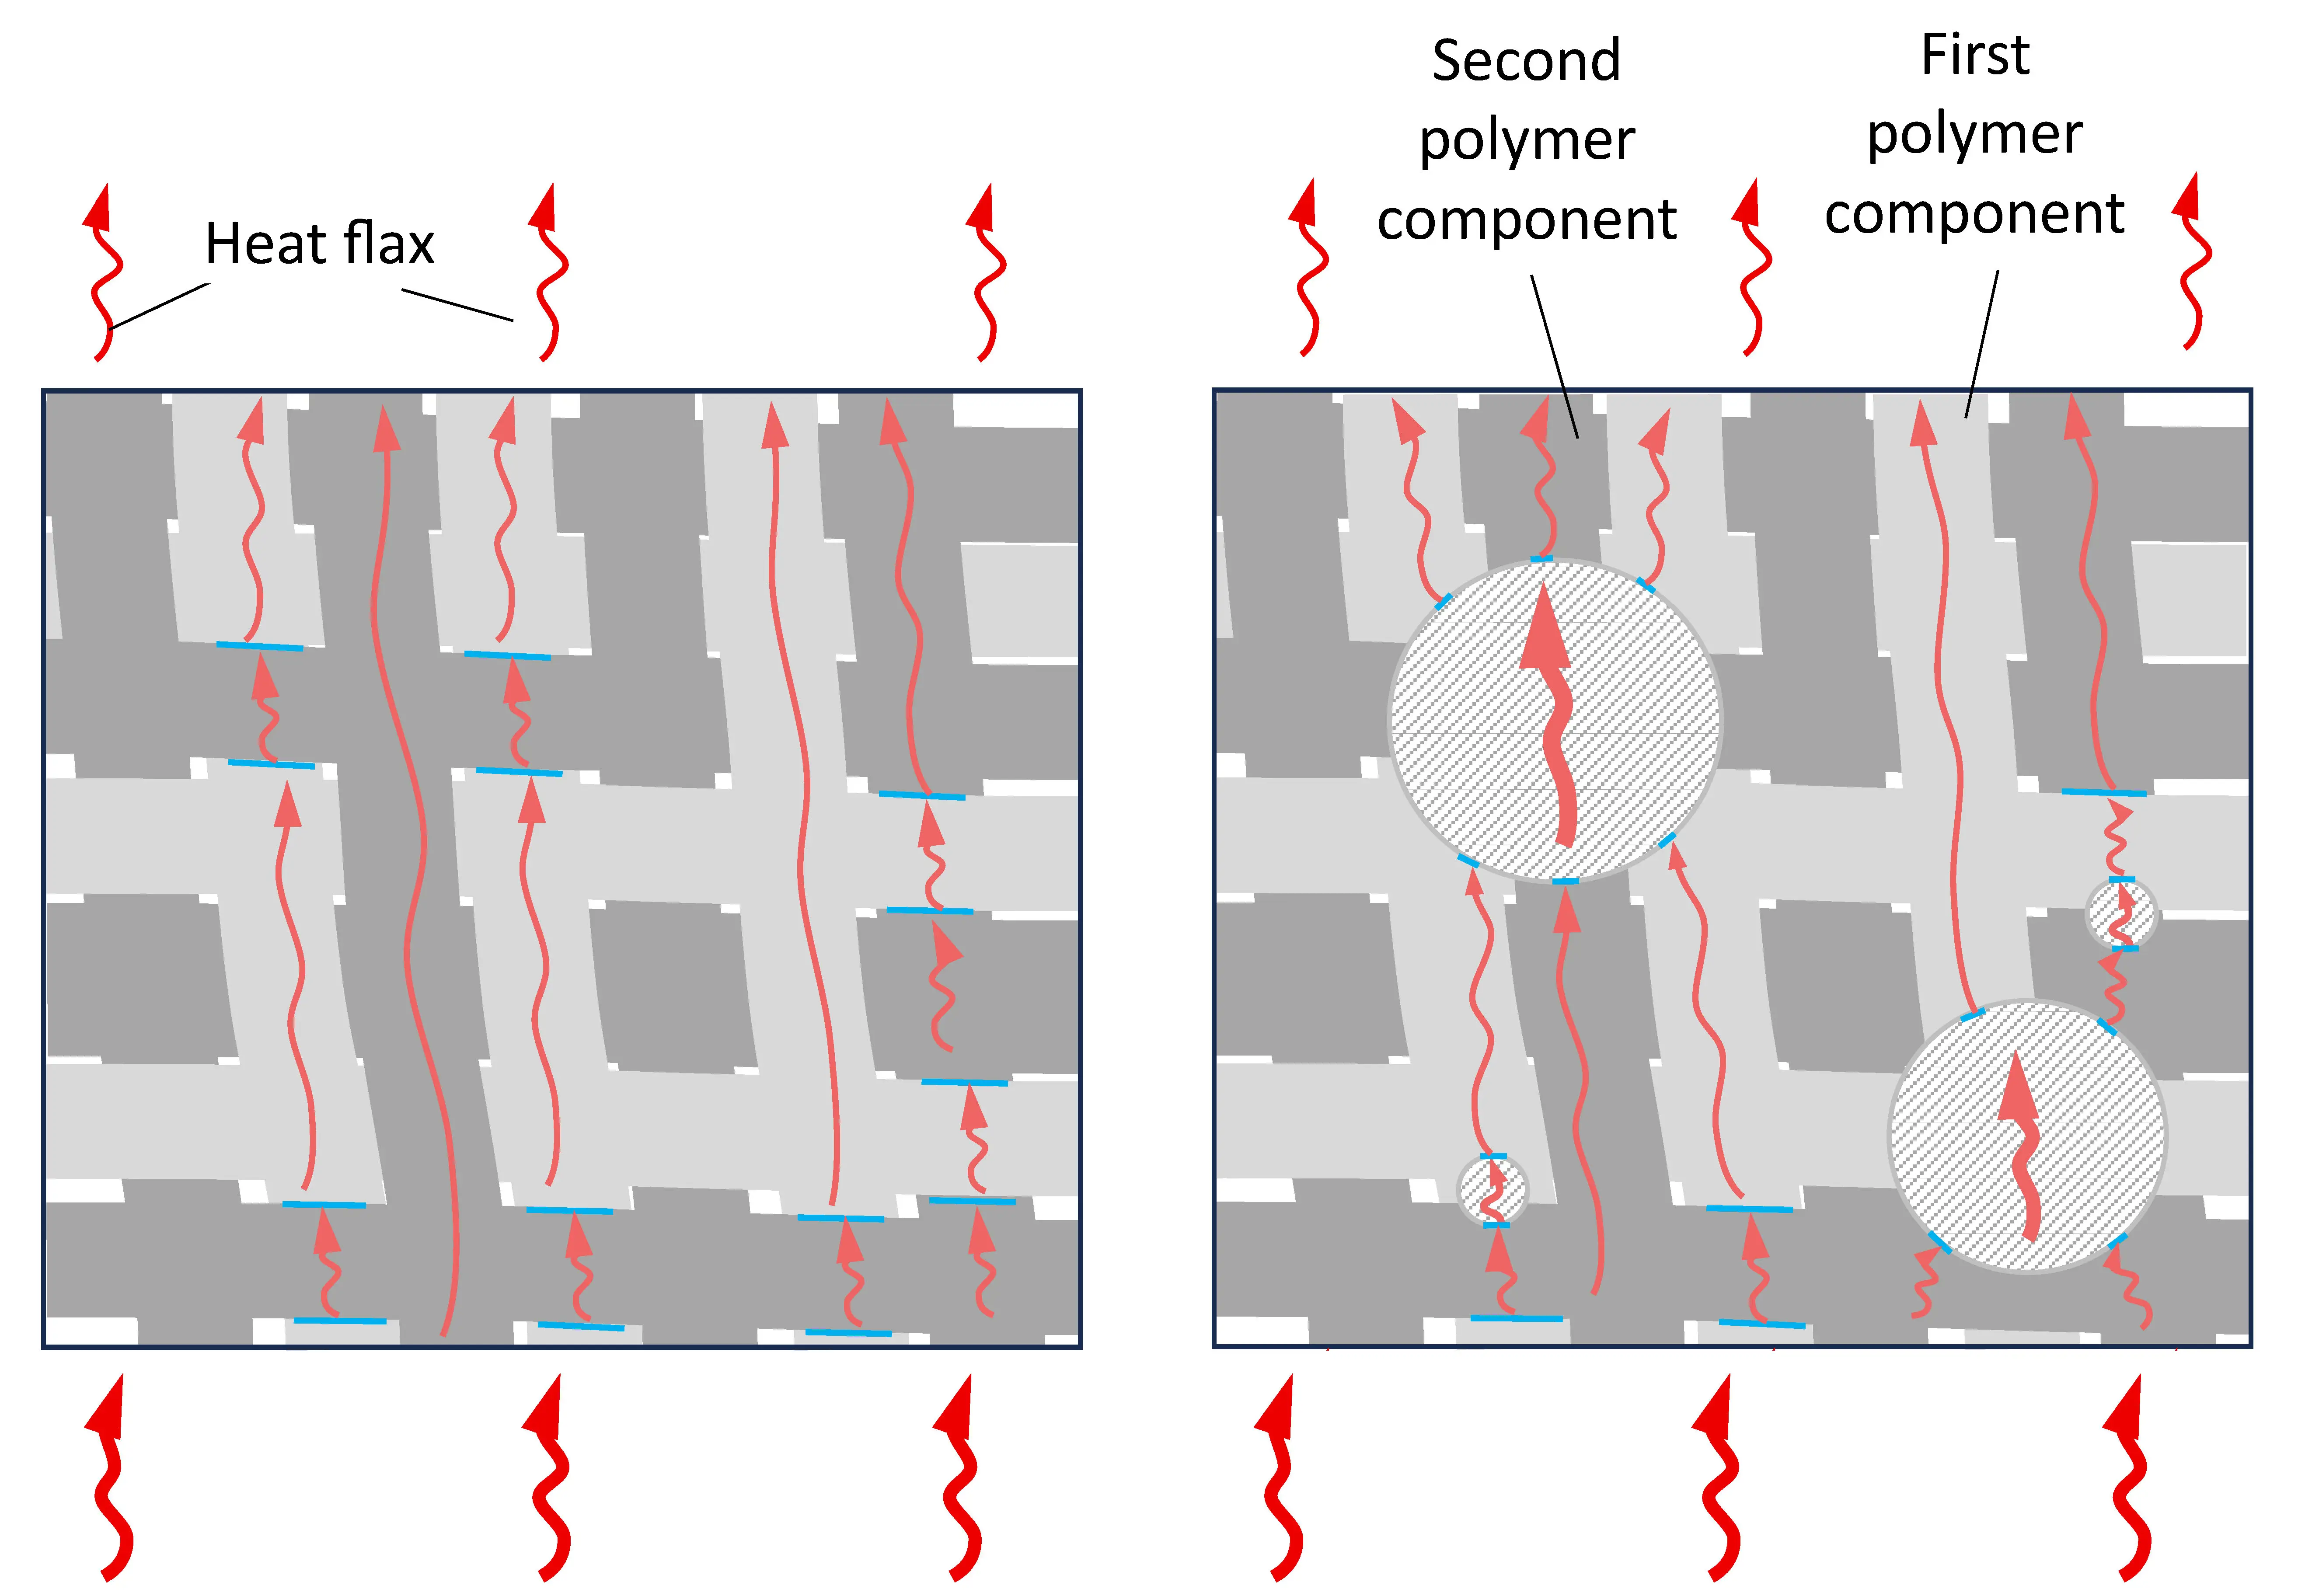
At the same time, it should be noted that the greatest increase in λ, up to ≈50%, was achieved for the blend in which the content of polyamide and polyolefin components was the same, composition 8, Table 1, i.e., in which IPN is formed. Since the densities of similar composites 2, 5, and 8 are close (Table 3), the heat capacity of composite 8 is lower than that of 2 and 5. The only factor that significantly affects the increase in λ is the growth of thermal diffusion, Figure 5e. Taking this into account, as well as the fact that the value of Atgδ increases and the most significant difference between compositions 5 and 7 is the formation of a IPN structure, it is reasonable to assume that the reason for the additional increase in λ is the reduction of heat transfer losses in the PA6/PO interphase layer due to the presence of a heat-conducting filler and the easing of phonon movement, including due to the presence of a second polymer component not in the form of inclusions, but in the form of a continuous phase, Figure 6.
 |
 |
| (a) | (b) |
 |
 |
| (c) | (d) |
 |
 |
| (e) | (f) |
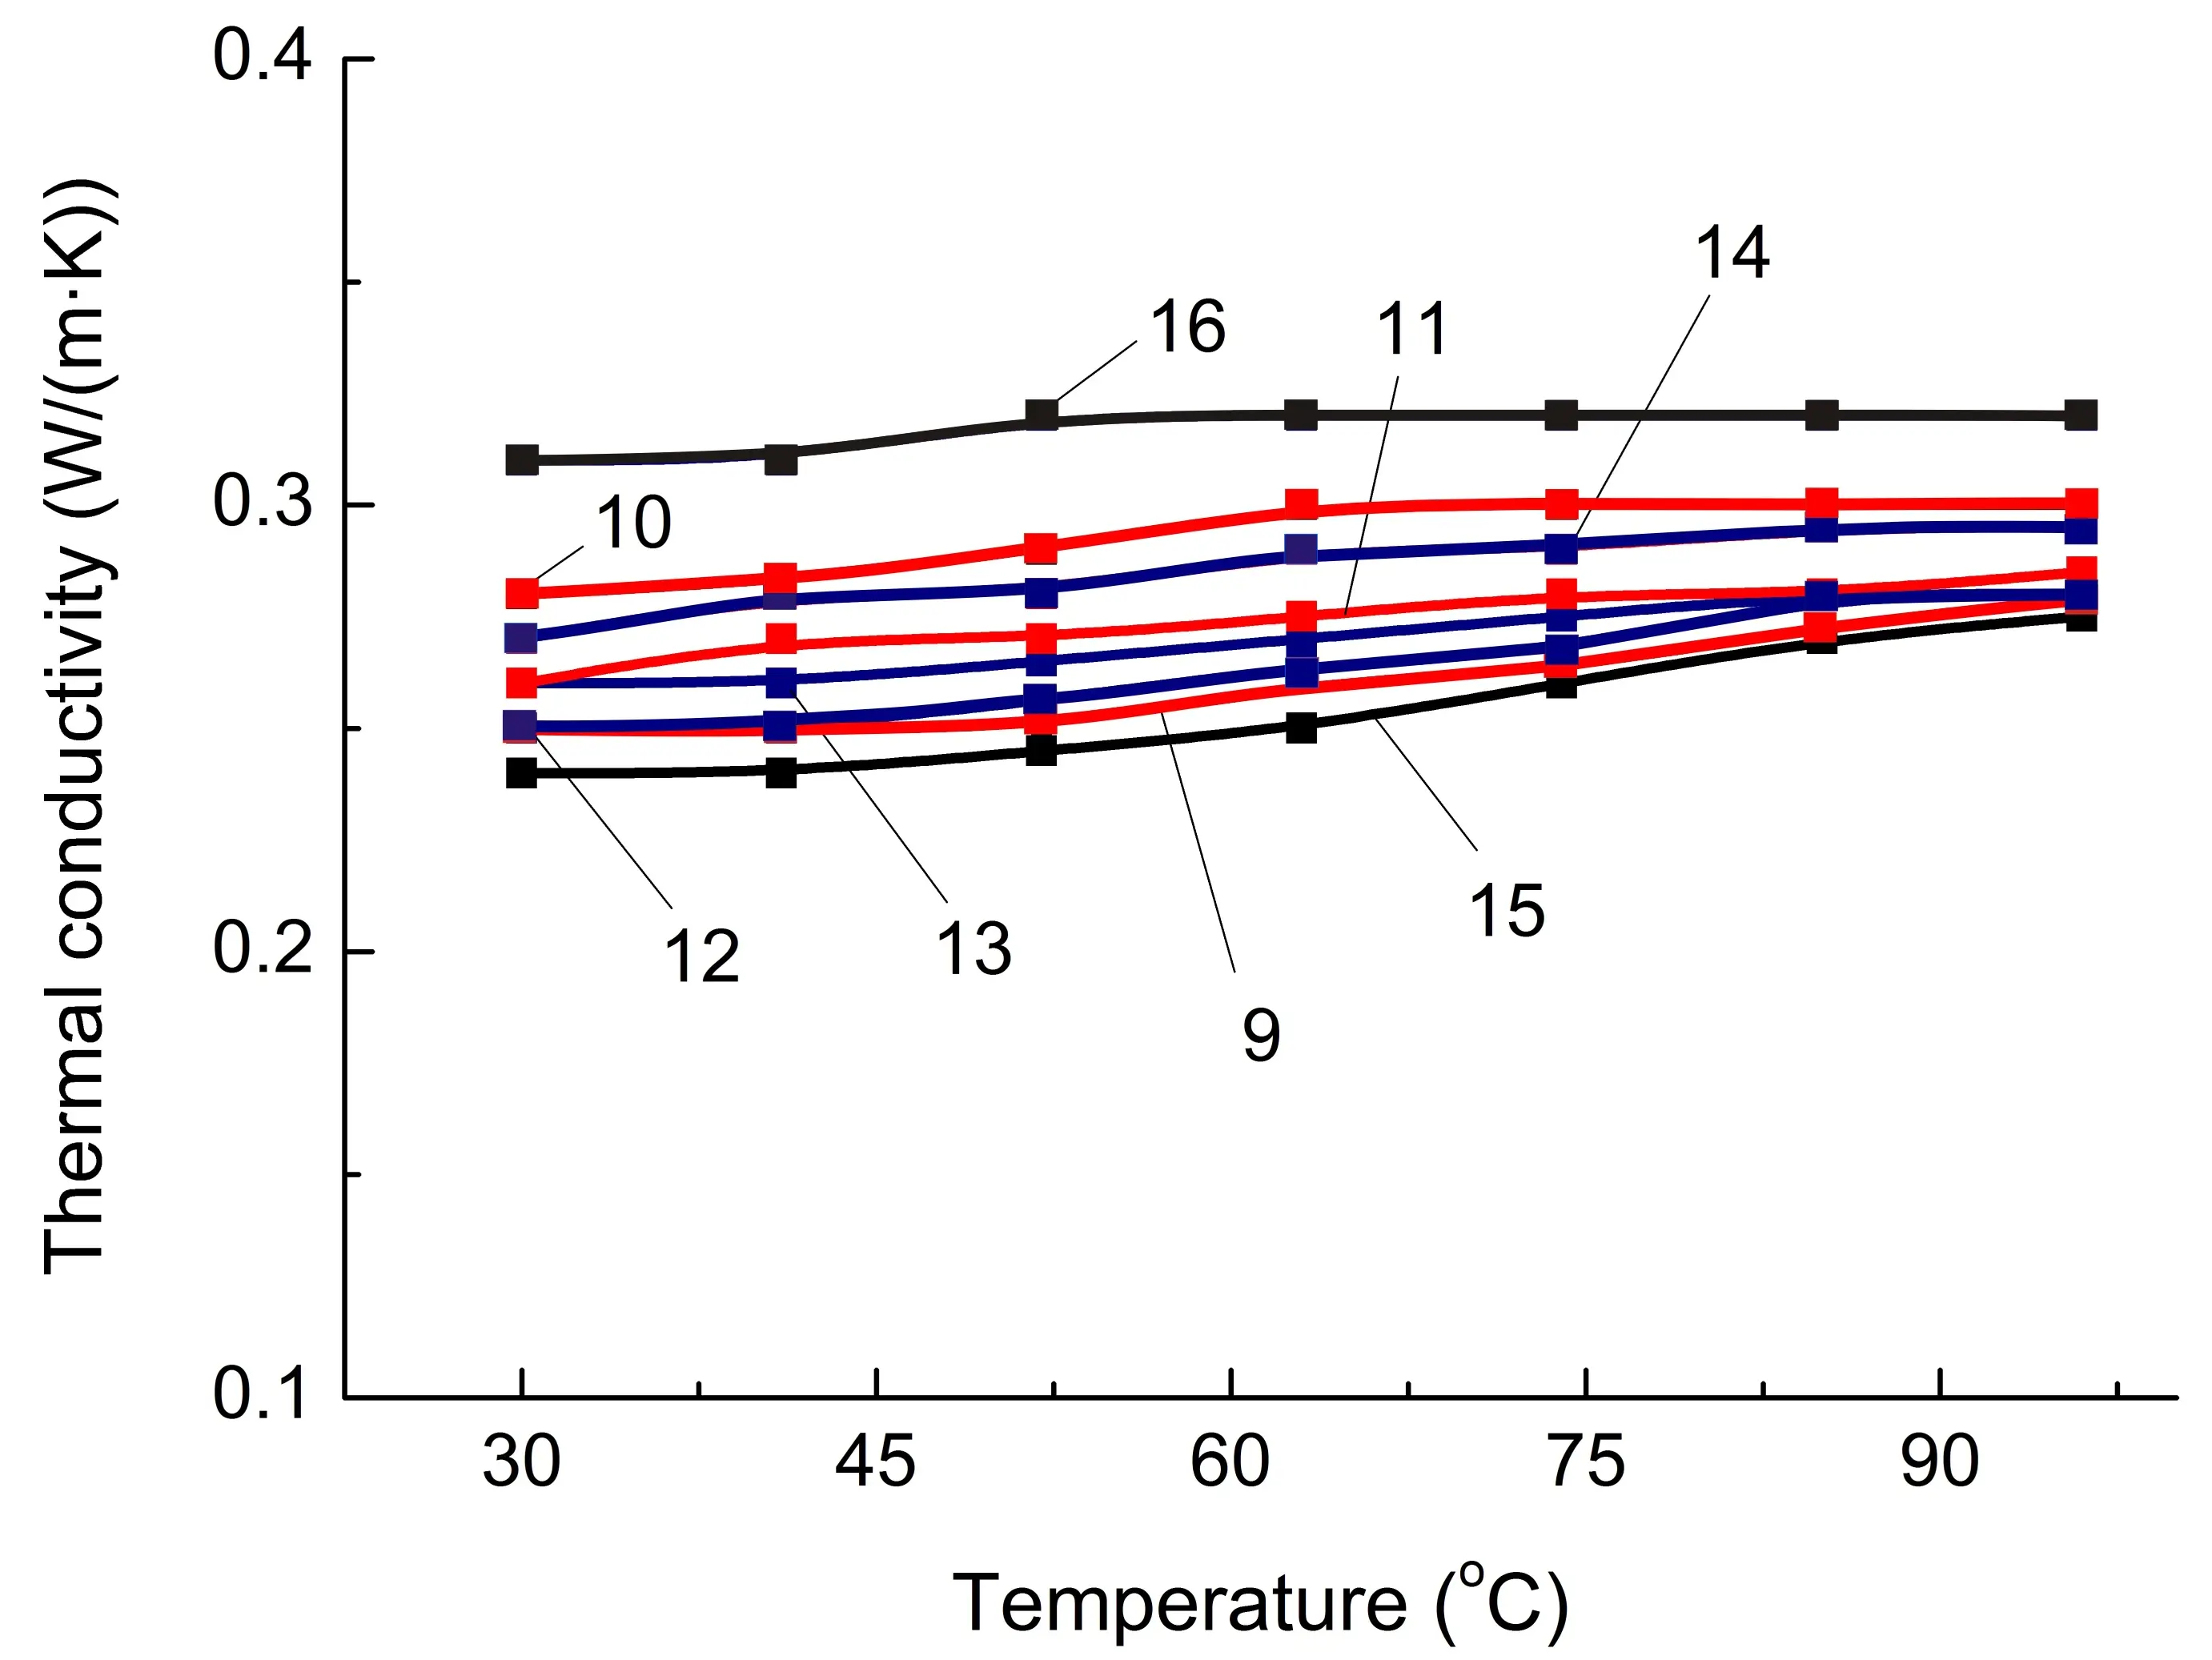
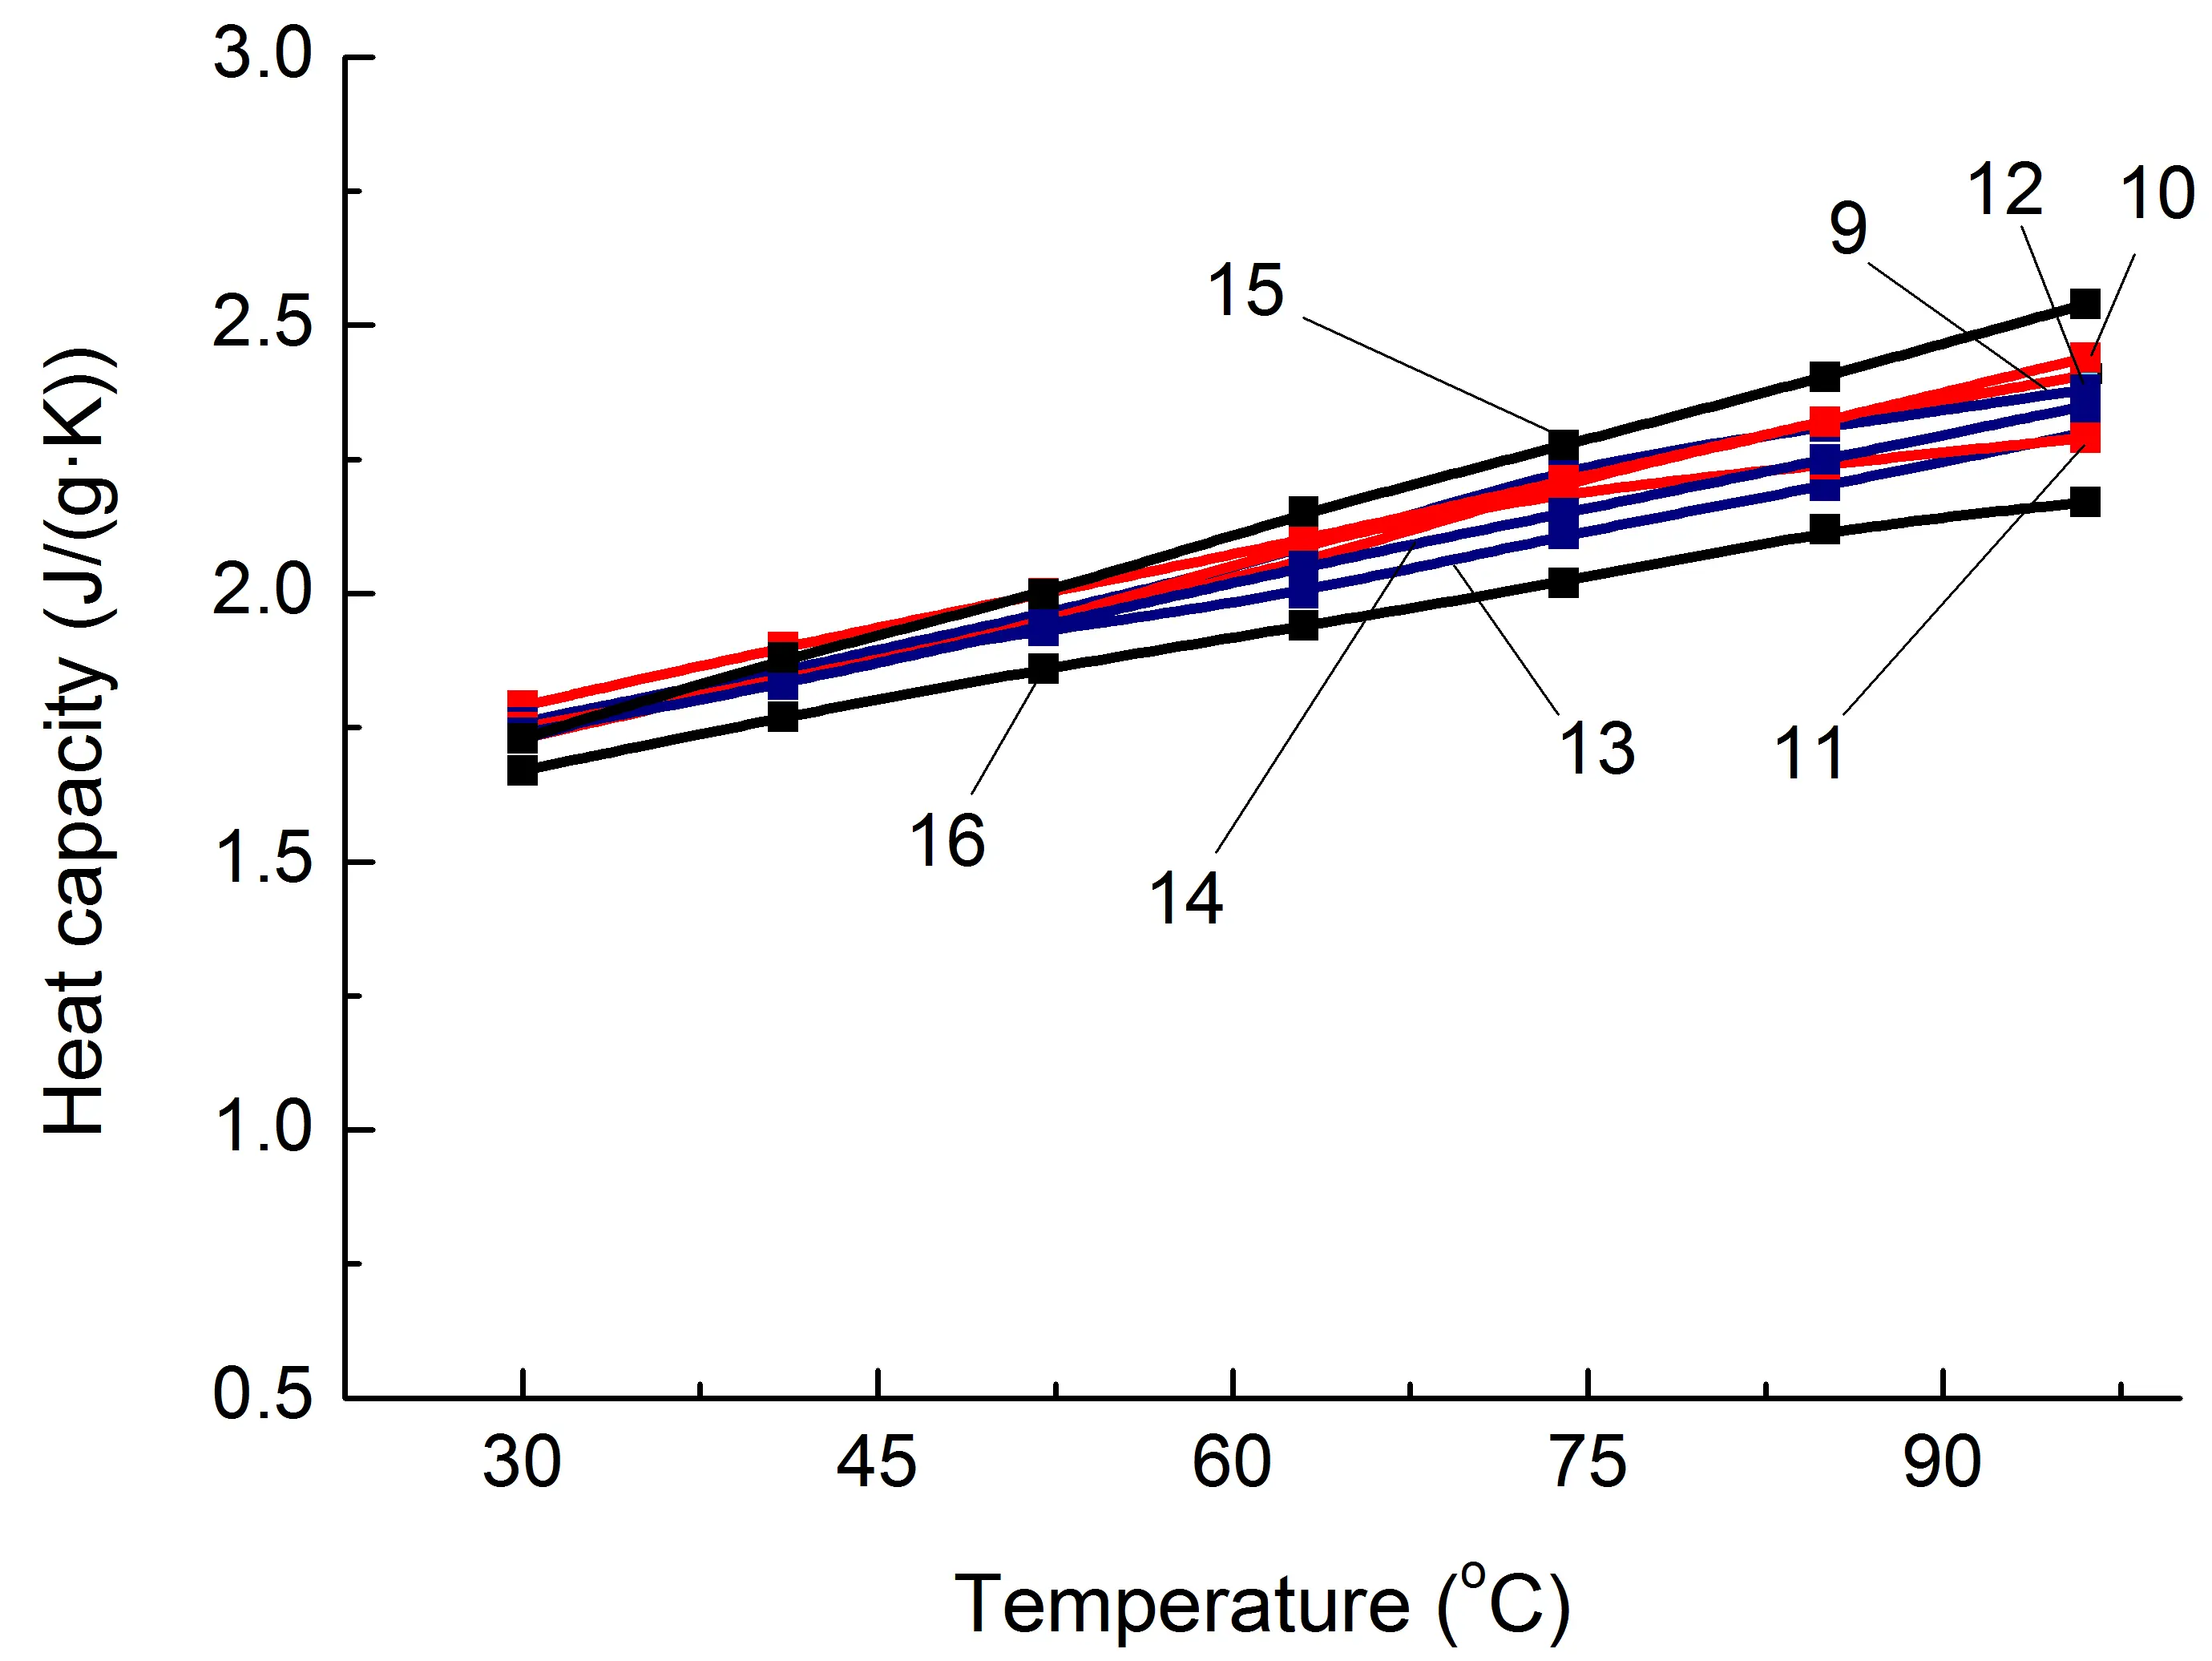
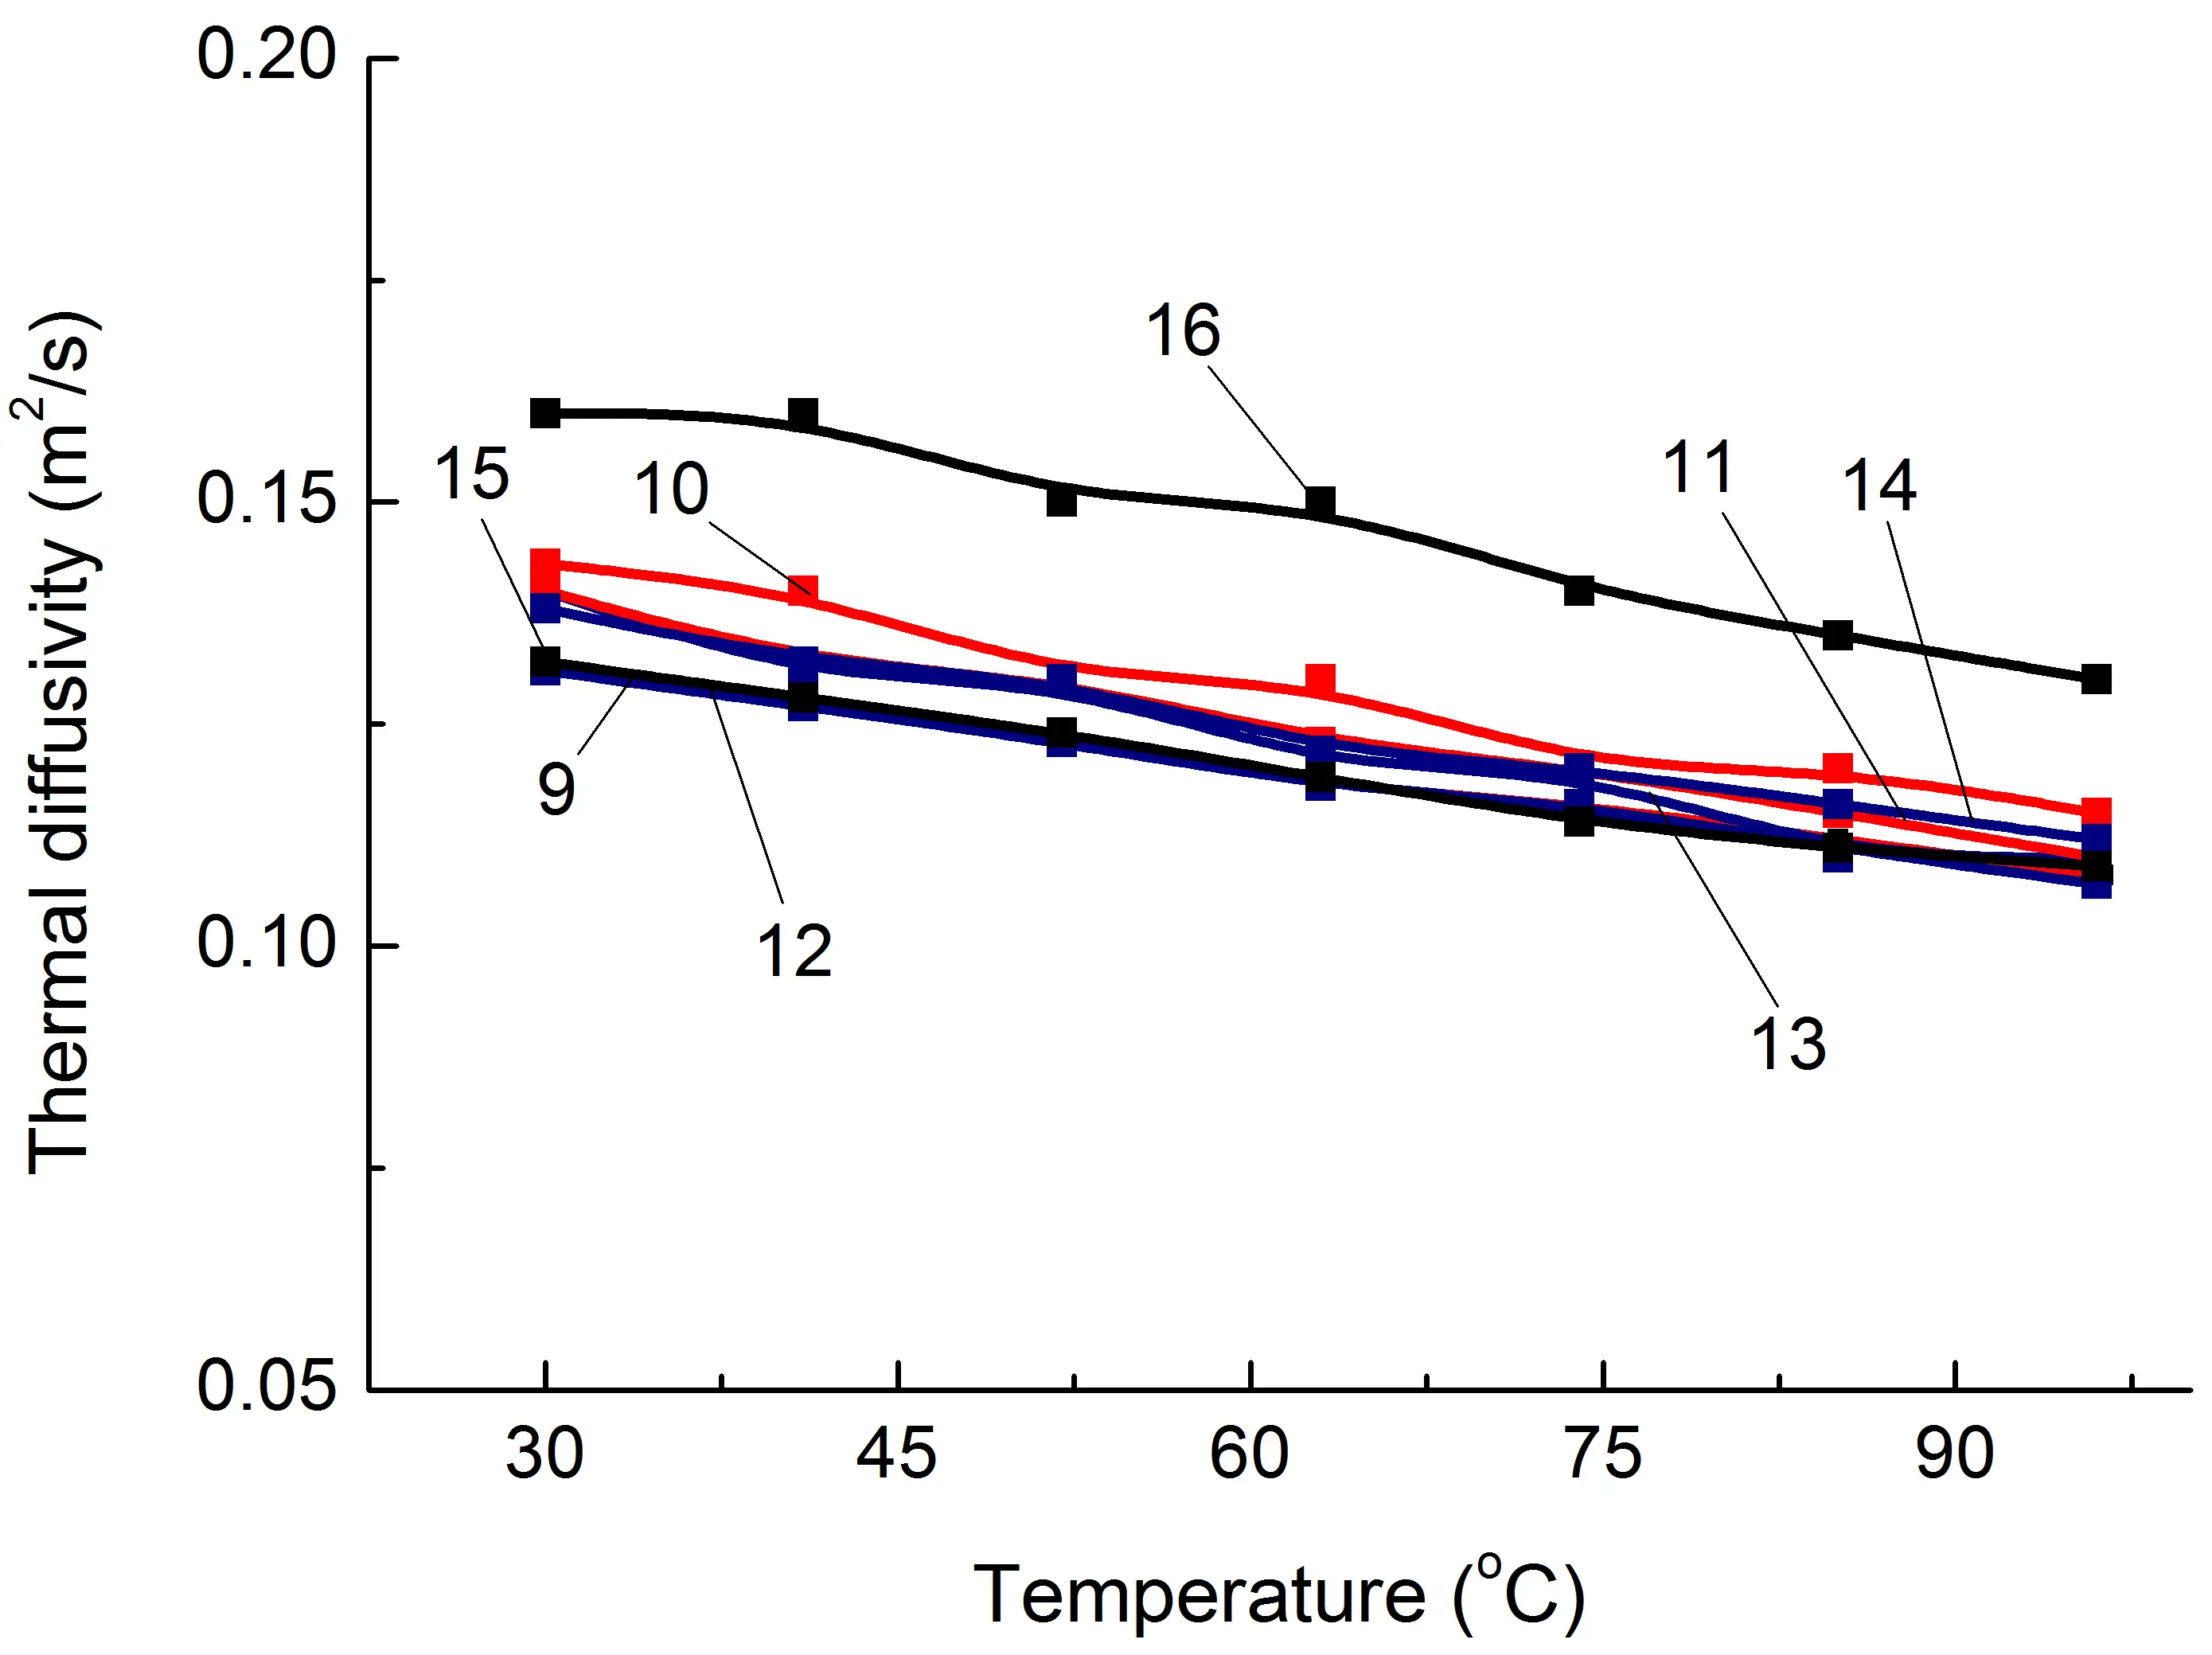
Figure 5. Some thermophysical properties of PA6-based composites (a,c,e) and SEBS-based composites (b,d,f) on temperature. The numbering of the curves corresponds to the following compositions: 1—PA6/HDPE–25%; 2—PA6/HDPE–17.5%/pAl–30.0; 3—PA6/HDPE–17.5%/NAl–30.0; 4—PA6/fPE-E–25%; 5—PA6/fPE-E–17.5%/pAl–30.0; 6—PA6/fPE-E–17.5%/NAl–30.0; 7—PA6/fPE-E–50%; 8—PA6/fPE-E–35.0%/pAl–30.0%; 9—SEBS/PP–25%; 10—SEBS/PP–17.5%/pAl–30.0; 11—SEBS/PP–17.5%/NAl–30.0; 12—SEBS/fPP–25%; 13—SEBS/fPP–17.5%/pAl–30.0; 14—SEBS/fPP–17.5%/NAl–30.0; 15—SEBS/fPP–50%; 16—SEBS/fPP–35.0%/pAl–30.0%.
 |
|
|
(a) |
|
 |
|
|
(b) |
(c) |
Figure 6. Schematic representation of the structure of composite materials without IPN (a), with IPN and without (b) and with thermal conductive filler (c).
Similar studies were conducted for SEBS/PO blends and composites based on them. As a result, it was found that, as in the case of PA6/PO, the specified polymer matrix has approximately one λ level regardless of whether PO is functionalized or not and what its proportion is. On average, when 30% of heat-conducting fillers, pAl and NAl, are introduced, the increase in λ for SEBS/PP and SEBS/fPP blends reaches 5–8%. It should be noted that this is significantly lower than the λ level of PA6/PO-based composites containing similar fillers. Among the main reasons for this are the following: higher undercompaction of SEBS/PO compositions than in PA6/PO-based materials, and higher λ values of matrix polymers in PA6/PO blends.
The absence of a clear correlation between the Аtgδ compositions (Table 2) and their λ (Figure 5a,b) indicates that although the amorphous-crystalline structure of polymers contributes to the value of this indicator, it is not decisive for the materials under study.
As in the case of the PA6/fPE-E–50% blend with IPN structure, there is no significant increase in λ for the SEBS/fPP–50% composition, Figure 5b, which supports the assumption that conductivity losses are primarily due to losses in the polymer/polymer interphase layer, although amorphization of both the PP and SEBS components does occur, as confirmed by the increase in the areas of the corresponding PP glass transition peaks, Table 2, compositions 12 and 15.
At the same time, compound 16 (Table 1), which forms an interpenetrating network of polymer components, shows the greatest increase in λ, reaching 30%, when 30% pAl is introduced. So, the formation of this polymer structure contributes to an additional increase in λ in the SEBS/fPP blend compared to blends without an IPN containing the same amount of a similar heat-conducting filler, compound 10. The main reason for the additional increase in λ, as in the case of composition 9 based on PA6, which contains a similar quantity of modifiers, appears to be a reduction in heat transfer losses in the SEBS/PO interphase layer and easier phonon movement.
5. Conclusions
It has been shown that functionalizing the polyolefin component results in a noticeable increase in some of the most important mechanical properties of PA6-based blends, whereas it has virtually no effect on SEBS-based blends.
It has been established that the introduction of both pAl and NAl reduces a number of mechanical characteristics of both types of polymer matrices PA6/PO and SEBS/PO, with the greatest decrease observed for εb (up to 18 times) in the case of the first matrix and for σb (up to ≈1.3 times) and εb (up to ≈2 times) in the case of the second matrix.
The SEM method did not reveal the selective distribution of aluminum powder and aluminum nitride powder in one of the phases of the two-component polymer matrix when composites were obtained by extrusion compounding from a mechanical mixture of the initial components.
The DMA method revealed that the reinforcing effect of both heat-conducting fillers in a wide temperature range depends on the type of polymer matrix, so the storage modulus increases for PA6/PO-based composites, but decreases in the case of SEBS/PO. It was found that PA6 interacts with the surface of pAl and NAl, which is expressed in an increase in its Tg to ≈6 °C. In addition, it was shown that intermolecular interactions occur between the components of the SEBS/PO blend, which are influenced by the filler.
A relatively high degree of undercompaction of composites based on SEBS/PO has been observed, which may be due to insufficient wetting of the heat-conducting filler surface by the polymer and, as a result, may negatively impact the heat transfer capacity of these materials.
It has been shown that functionalization of PO has practically no effect on the λ level. Filling 30% PA or NAl blend matrices, PA6/PO and SEBS/PO containing 25% PO leads to an increase in their λ to 27% and 8%, respectively. The formation of an interpenetrating network structure in the blend matrix allows for an additional increase in λ while maintaining the proportion of heat-conducting filler, reaching 50% and 30% for PA6/PO and SEBS/PO blends, respectively.
Ethics Statement
Not applicable.
Informed Consent Statement
Not applicable.
Data Availability Statement
Some research data associated with the paper may be obtained by direct request to the author.
Funding
State program of scientific research of the Republic of Belarus “8. Materials science, new materials and technologies” Subprogram “8.4. Multifunctional and composite materials”.
Declaration of Competing Interest
The author declares that he has no known competing financial interests or personal relationships that could have appeared to influence the work reported in this article.
References
- Nikhade R, Jaiswal A. Advancements in Polymer Modification: A Comprehensive Review on Techniques. Int. J. Pharm. Sci. Med. 2025, 10, 50–68. DOI:10.47760/ijpsm.2025.v10i01.005 [Google Scholar]
- Katz HS, Milewski JV. Handbook of Fillers and Reinforcements for Plastics; Van Nostrand Reinhold Company: New York, NY, USA, 1978; p. 736. [Google Scholar]
- Paul D, Newman S. Polymer Blends, 1st ed.; Academic Press: New York, NY, USA, 1978; pp. 1–489. [Google Scholar]
- Khan I, Chohan MM, Mazumder MAJ. Functional Polymers. Polymers and Polymeric Composites: A Reference Series, 1st ed.; Springer: Cham, Switzerland, 2018; p. 823. [Google Scholar]
- Wolfsgruber N, Tanda A, Archodoulaki VM, Burgstaller C. Influence of Filler Type and Content on Thermal Conductivity and Mechanical Properties of Thermoplastic Compounds. Polym. Eng. Sci. 2023, 63, 1094–1105. DOI:10.1002/pen.26266 [Google Scholar]
- Yadav R, Singh M, Shekhawat D, Lee SY, Park SJ. The Role of Fillers to Enhance the Mechanical, Thermal, and Wear Characteristics of Polymer Composite Materials: A Review. Compos. Part A Appl. Sci. Manuf. 2023, 175, 107775. DOI:10.1016/j.compositesa.2023.107775 [Google Scholar]
- Tan J, Zhang Y. Thermal Conductive Polymer Composites: Recent Progress and Applications. Molecules 2024, 29, 3572. DOI:10.3390/molecules29153572 [Google Scholar]
- Lai CQ, Markandan K. Fabrication, Properties and Applications of Polymer Composites Additively Manufactured with Filler Alignment Control: A review. Compos. Part B Eng. 2023, 256, 110661. DOI:10.1016/j.compositesb.2023.110661 [Google Scholar]
- Liu Y, Fang Z, Liu Y, Zhao N. Toward High-Thermal-Conductivity Polymer-Based Materials: Breakthroughs and Barriers. Polym. Compos. 2025, 0, 1–44. DOI:10.1002/pc.70362 [Google Scholar]
- Martuscelli E, Palumbo R, Kryszewski M. Polymer Blends: Processing, Morphology, and Properties; Plenum Press: New York, NY, USA, 1980; p. 510. [Google Scholar]
- Isayev AI. Encyclopedia of Polymer Blends: Volume 3: Structure; Wiley-VCH: Weinheim, Germany, 2016; p. 504. [Google Scholar]
- Utracki LA, Mukhopadhyay P, Gupta RK. Polymer Blends Handbook, 2nd ed.; Springer: Dordrecht, The Netherlands, 2014; p. 2378. [Google Scholar]
- Pesetskii SS, Krivoguz YM, Jurkowski B. Structure and Properties of Polyamide 6 Blends with Low-Density Polyethylene Grafted by Itaconic Acid and with Neutralized Carboxyl Groups. J. Appl. Polym. Sci. 2004, 92, 1702–1708. DOI:10.1002/app.20125 [Google Scholar]
- Mamunya Y. Polymer Blends Filled with Carbon Black: Structure and Electrical Properties. Macromol. Symp. 2001, 170, 257–264. DOI:10.1002/1521-3900(200106)170:1<257::AID-MASY257>3.0.CO;2-J [Google Scholar]
- Sumita M, Sakata K, Asai S, Miyasaka K, Nakagawa H. Dispersion of Fillers and the Electrical Conductivity of Polymer Blends Filled with Carbon Black. Polym. Bull. 1991, 25, 265–271. DOI:10.1007/BF00310802 [Google Scholar]
- Li Z, Sun Y, Hu F, Liu D, Zhang X, Ren J, et al. An Overview of Polymer-Based Thermally Conductive Functional Materials. J. Mater. Sci. Technol. 2025, 218, 191–210. DOI:10.1016/j.jmst.2024.07.053 [Google Scholar]
- Suplicz А, Kovács JG. Development of Thermally Conductive Polymer Materials and Their Investigation. Mater. Sci. Forum 2012, 729, 80–84. DOI:10.4028/www.scientific.net/MSF.729.80 [Google Scholar]
- Bogdanovich SP, Shevchenko VV. Thermophysical Properties of Polyamide 6 and High-Density Polyethylene Blends (Part 1. Without Compatibilization). Sustain. Polym. Energy 2025, 3, 10003. DOI:10.70322/spe.2025.10003 [Google Scholar]
- Shahmir M, Ahmadi S, Arabi H. Improved Thermal Conductivity of Immiscible Polyamide 6 (PA6)/Polyolefin Elastomer (POE) Blend by Controlling Selective Localization of Aluminum Nitride (AlN). Iran. Polym. J. 2025, 34, 55–64. DOI:10.1007/s13726-024-01352-3 [Google Scholar]
- Kim GH, Lee D, Shanker A, Shao L, Kwon MS, Gidley D, et al. High Thermal Conductivity in Amorphous Polymer Blends by Engineered Interchain Interactions. Nat. Mater. 2015, 14, 295–300. DOI:10.1038/nmat4141 [Google Scholar]
- Schulz DN, Glass JE. Polymers as Rheology Modifiers. An Overview; American Chemical Society: Washington, DC, USA, 1991. [Google Scholar]
- Lipatov YS. Phase Separation in Filled Polymer Blends. J. Macromol. Sci. Part B Phys. 2006, 45, 871–888. DOI:10.1080/15583720600824615 [Google Scholar]
- Ramesh M, Rajeshkumar LN, Srinivasan N, Kumar DV, Balaji D. Influence of Filler Material on Properties of Fiber-Reinforced Polymer Composites: A Review. e-Polymers 2022, 22, 898–916. DOI:10.1515/epoly-2022-0080 [Google Scholar]
- Bogdanovich SP, Pesetskii SS. Compatibilization Effect on Thermophysical Properties of Polymeric Blends Polyamide 6/High Density Polyethylene. Polym. Mater. Technol. 2020, 6, 45–53. DOI:10.32864/polymmattech-2020-6-2-45-53 [Google Scholar]
- Xin Z, Du B, Yan S, Du S, Ding J, Yang Z. Surface Modification of Poly(styreneb-(ethylene-co-butylene)-b-styrene) (SEBS) Elastomer via Covalent Immobilization of Nonionic Sugar-Based Gemini Surfactants. J. Biomater. Sci. Polym. Ed. 2014, 25, 1045–1061. DOI:10.1080/09205063.2014.918458 [Google Scholar]
- Luna CBB, Siqueira DD, Araújo EM, Nascimento EP, Melo JBCA. Evaluation of the SEBS Copolymer in the Compatibility of PP/ABS Blends Through Mechanical, Thermal, Thermomechanical Properties, and Morphology. Polym. Adv. Technol. 2022, 33, 111–124. DOI:10.1002/pat.5495 [Google Scholar]
- Murthe SS, Sreekantan S, Mydin RBSMN. Study on the Physical, Thermal and Mechanical Properties of SEBS/PP (Styrene-ethylene-butylene-styrene/Polypropylene) Blend as a Medical Fluid Bag. Polymers 2022, 14, 3267. DOI:10.3390/polym14163267 [Google Scholar]
- Krivoguz YM, Pesetskii SS. Free-Radical Grafting of Methylenebutanedioic Acid to Polypropylene-Polyethylene Blends and Rheological Properties of Melts. Russ. J. Appl. Chem. 2005, 78, 305–310. DOI:10.1007/s11167-005-0280-5 [Google Scholar]