Corrosion Behaviors of Aluminate Coatings on Mg Alloy AE44

Corrosion Behaviors of Aluminate Coatings on Mg Alloy AE44
Received: 01 October 2025 Revised: 05 November 2025 Accepted: 06 January 2026 Published: 09 January 2026

© 2026 The authors. This is an open access article under the Creative Commons Attribution 4.0 International License (https://creativecommons.org/licenses/by/4.0/).
1. Introduction
Magnesium exhibits a high strength-to-weight ratio along with other advantageous properties, such as high thermal conductivity, excellent dimensional stability, and ease of recyclability [1,2,3]. With the increasing demand for lightweight vehicles, the automotive industry has been actively pursuing the use of magnesium and its alloys to reduce overall vehicle weight, thereby lowering fuel consumption in response to both limited fossil fuel reserves and environmental concerns associated with harmful emissions [4,5,6,7,8]. The application of magnesium alloys in automotive components allows for weight reduction without compromising structural integrity [9].
In the past decade, there has been a growing demand for lightweight structural components such as shock towers, subframes, engine cradles, and crossmembers in the automotive industry [1]. These components often endure high mechanical loading at both room and elevated temperatures during service. Among magnesium alloys, AE44 with alloying elements of aluminum, cerium, and lanthanum has become particularly attractive due to its excellent die castability and favorable balance of strength and ductility [2]. It has shown significant potential as a leading magnesium die-casting material, especially for structural automotive applications. Compared with AM and AZ series Mg alloys, AE44 offers a higher eutectic volume, which improves its overall castability. Furthermore, the lamellar structure of its eutectic phase plays a critical role in deflecting crack propagation, thereby enhancing ductility. Despite these superior properties and its application in the production of large-scale automotive structural components, concerns remain regarding the performance of AE44 in corrosive and erosive environments, particularly for exterior automotive parts. This is because magnesium has a high chemical reactivity. Mg alloys, including AE44, suffer from poor corrosion resistance, which significantly restricts its broader use [10,11,12,13]. To address this limitation, it is necessary to apply appropriate surface treatments to produce protective films that serve as barriers between the substrate and its environment. Several coating technologies have been explored for magnesium and its alloys, including electrochemical plating, conversion coatings, anodizing, gas-phase deposition, laser surface alloying, and organic coatings [11]. Among these, chromate-based coatings have historically provided effective corrosion protection [12,13]. Nevertheless, environmental and health concerns associated with hexavalent chromium demand the development of alternative, environmentally friendly technologies.
Plasma electrolytic oxidation (PEO) has emerged as a promising solution to address these challenges and extend the broader use of AE44 in vehicles. In PEO, plasma micro-discharges or sparks generated in an aqueous solution ionize the gaseous medium, enabling plasma-assisted chemical reactions that synthesize complex oxide compounds on the metal surface [12,13]. As a result, PEO coatings have a strong adhesion to the substrate of Mg alloys and enhance their corrosion resistance. However, inherent PEO coatings have a porous structure, which limits their capacity of surface protection for metallic substrates. To surmount this challenge, Kaseem et al. [14,15] generated MoO2 and/or TiO2-containing hybrid PEO coating on Al-Mg-Si alloys to mitigate the porosity content. They incorporated the Co3O4, TiO2, and hydroxyapatite into the PEO coating on Mg alloy AZ31 for enhanced corrosion resistance [16,17,18]. It was suggested that polymers could be used to improve the protection efficiency of PEO coatings on various Mg alloys such as AZ31, AZ91 and WE43 [19]. Xi et al. [20] investigated the wear resistance of AE44 with PEO coatings sealed using a polytetrafluoroethylene (PTFE) polymer layer. Their results showed that due to the higher hardness of the Mg2SiO4 phase compared to Mg3(PO4)2, the Vickers hardness of silicate-based PEO coatings was generally greater than that of phosphate-based coatings on AE44. This finding demonstrated that silicate-based PEO coatings were particularly effective for improving wear resistance. However, publicly available studies on the influence of specific PEO processing parameters on the corrosion resistance of AE44 remain limited, highlighting the need for further investigation in this area.
The present study aims to extend this approach to magnesium alloy AE44 by using PEO technology to deposit protective MgO coatings on magnesium-based substrates with different electrical parameters under an alternating current (AC) power supply. To evaluate the corrosion behaviors of aluminate coatings under different conditions on Mg alloy AE44, potentiodynamic polarization tests were carried out. A comparative assessment of the surface morphology of the different coatings was performed using scanning electron microscopy (SEM), while elemental compositions were examined through energy-dispersive X-ray spectroscopy (EDS). The novelty is evident since the PEO coating would be able to provide an environmentally friendly and cost-effective solution for surface protection of the emerging Mg alloy AE44. The usage of the alloy in the automotive industry can be expanded significantly with the help of the PEO technology.
2. Experiment Procedures
2.1. Materials and Specimen Preparation
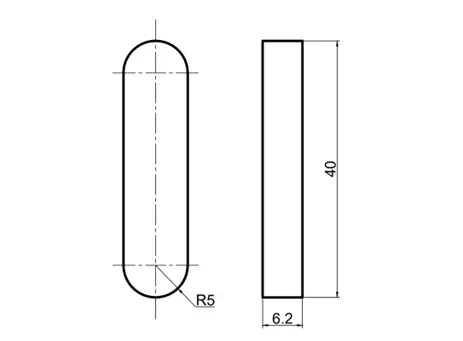
Stadium-shaped bars shown in Figure 1 of magnesium alloy AE44 with the composition of 4 wt% Al, 4 wt% (La+Ce), 0.4 wt% Nd, 0.35 wt% Mn were used as the matrix alloy for the deposition of PEO coatings. Before the PEO process, all samples were prepared from the same area of a cast ingot to reduce variations in their compositional and microstructural characteristics. After polishing the samples to a relatively smooth level, the samples are cleaned with ethanol.
2.2. PEO Treatment
Electrolyte solutions were prepared by dissolving 8 g/L of NaAlO2 and 1 g/L of potassium hydroxide in distilled water. To examine the influence of electrical parameters on the formation of aluminate-based coatings, treatment duration, current, and duty cycle were varied, as summarized in Table 1. Given that the duty cycle directly affects the effective discharge time, an efficiency constant was determined as the product of these four parameters, allowing for meaningful comparison of results. During the PEO treatment, the samples were connected to an AC power supply operating in unipolar pulse mode, with a stainless-steel plate serving as the cathode. Coating experiments were conducted for durations of 10 and 12 min at current densities of 114 and 190 mA/cm2, with duty cycles of 80% and 40% at 1000 Hz, respectively.
Table 1. Experimental parameters of the PEO process.
|
Experiment |
A Treatment Duration (min) |
B Current Density (mA/cm2) |
C NaAlO2 Concentration (g/L) |
D Duty Cycle (%) |
Efficiency Constant (=A × B × C × D) |
|---|---|---|---|---|---|
|
1 |
10 |
114 |
8 |
80 |
729,600 |
|
2 |
12 |
190 |
8 |
40 |
729,600 |
2.3. Potentiodynamic Polarization Tests
To assess experimental outcomes, corrosion resistance was employed as a quality characteristic of the PEO coatings. The quality characteristic was evaluated using potentiodynamic polarization tests conducted with the EC-LAB SP-150 electrochemical device, complemented by data analyses through the EC-LAB software V11.34, at room temperature (25 °C, 298 K). During corrosion tests, a three-electrode cell setup was employed, featuring the samples as the working anode, an Ag/AgCl saturated with KCl as the reference electrode, and a platinum rod serving as the counter electrode. The ratio of the volume of the 3.5 wt% NaCl solution to the surface area of the samples was 350 mL/cm2. Potentiodynamic polarization scans were performed at a scan rate of 10 millivolts per second (mV/s), starting from −0.75 volts relative to the open circuit potential (OCP) in a high direction, and continuing up to −0.15 volts relative to the reference electrode. At the beginning of the corrosion testing, the samples were grounded by SiC paper with fine grade and held in a salt solution, allowing the open circuit potential to settle to a constant value.
The corrosion resistance (Rp) of the samples was calculated using the corrosion potential (Ecorr), corrosion current density (icorr), and the anodic/cathodic Tafel slopes (ba and bc) obtained from the polarization curves. Based on the approximately linear region near the corrosion potential (Ecorr), Rp was determined using the following equation:
|
```latex{\mathrm{R}}_{\mathrm{p}}=\frac{{\mathrm{b}}_{\mathrm{a}}{\mathrm{b}}_{\mathrm{c}}}{2.3{\mathrm{i}}_{\mathrm{c}\mathrm{o}\mathrm{r}\mathrm{r}}\left({\mathrm{b}}_{\mathrm{a}}+{\mathrm{b}}_{\mathrm{c}}\right)}``` |
(1) |
Electrochemical impedance spectroscopy (EIS) was also used, through a frequency response analyzer, which enabled the scan to be generated automatically under computer control. A three-electrode cell with the PEO coated samples as the working electrode, exposing 1.0 cm2 of area to the solution during electrochemical measurements, an Ag/AgCl/sat KCl reference electrode, and platinum as a counter electrode, was used in the experiments. The EIS technique was employed using a 3.5 wt% sodium chloride solution, and the impedance spectra were acquired over the frequency range between 10 mHz and 106 Hz with an AC signal amplitude of ±10 mV with respect to the open circuit potential (OCP).
2.4. Microstructure Examination
The microstructures of the PEO treated samples were examined using a TM3030 scanning electron microscope (SEM) (Hitachi, Tokyo, Japan) equipped with energy-dispersive spectroscopy (EDS) for analyzing elemental composition. An X-ray diffractometer was used with Cu Ka radiation at a glancing angle of 2° for the phase structure analysis. Porosity was measured the SEM images by using ImageJ 1.54p. The thickness of the coatings was measured by using PociTector 6000 (DeFelsko, St Lawrence, New York, NY, USA). The average thickness was calculated from the results of 10 measurements. The roughness of the coating was characterized using a Mitutoyo SJ 210P (Mitutoyo, Sakado, Japan) based on the results of 5 measurements.
3. Results and Discussion
3.1. Process Voltage Characteristics
Figure 2 presents the voltage profiles recorded during PEO treatment under different electrical conditions. Both curves exhibited similar behavior: the voltage rose rapidly at the beginning, then slowed once it reached a relatively high level, eventually showing only minor changes. The critical voltage for both experiments was approximately 450 V. Beyond this point, the voltage continued to increase but at a reduced rate compared to the initial stage. Notably, Experiment 2, which was conducted with a longer treatment duration and higher current density but a lower duty cycle, reached a higher final voltage than Experiment 1, which used a shorter duration and lower current density but a higher duty cycle. Under the same efficiency constant, the operating voltage appeared to be influenced by the current density and duty cycle. This observation suggests that Experiment 2 was conducted at a higher operating voltage, which may have influenced the resulting properties of the aluminate-based coatings.
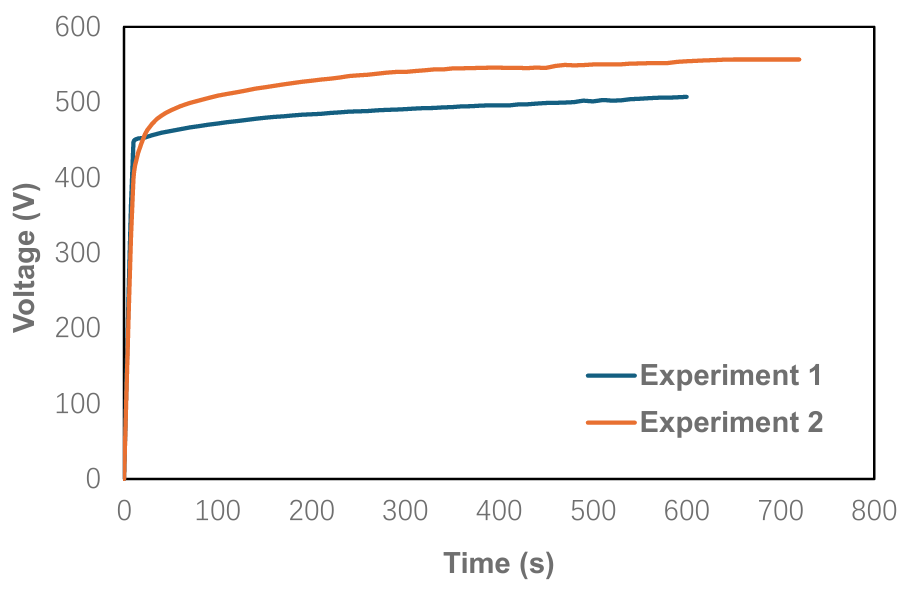
Figure 2. Curves of voltage changes during PEO treatment in electrolytes with different electrical parameters.
3.2. Morphology and Thickness of Coatings
The surface morphologies of the generated PEO coatings on Mg alloy AE44 are shown in Figure 3. Both samples exhibited some craters, with spark discharge channels appearing at their centers in the form of small pores (indicated as A). The average crater diameter for both coatings was approximately 8–12 μm. Nevertheless, a difference in crater density was evident between the two surfaces. The crater amount of Experiment 1 was obviously higher than that of Experiment 2. Given that the efficiency constant of the coatings and the concentration of electrolyte solutions remained the same, the effects of treatment duration, current density, and duty cycle might be regarded as secondary. Consequently, voltage was considered to exert a more significant influence on the observed differences between the two coatings, particularly with respect to morphology parameters (thickness, surface roughness, and porosity).
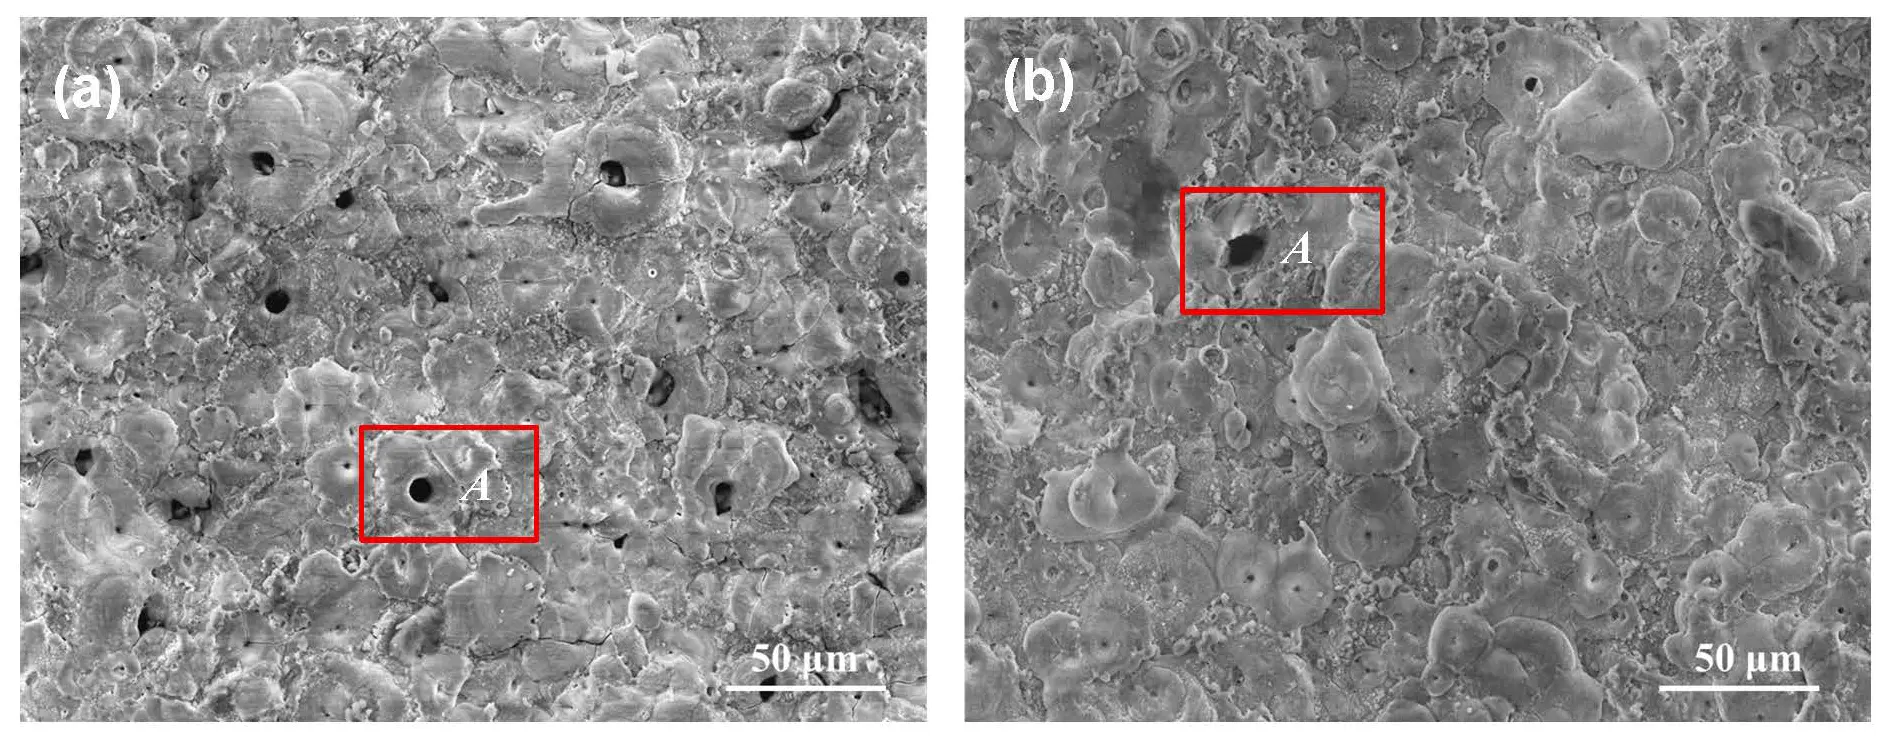
Figure 3. SEM micrographs of the coatings: (a) PEO coating from Experiment 1; (b) PEO coating from Experiment 2.
The cross-sectional images of the PEO oxide films formed in the two experiments are presented in Figure 4. Combined with the cross-sectional images with the measurement results from PociTector 6000, the average thickness of the oxide film from Experiment 1 was about 16.21 ± 0.72 μm, and that from Experiment 2 was about 25.40 ± 1.42 μm. The growth rates of oxide films were ~27.02 nm/s and ~35.28 nm/s, respectively. The oxide film appeared to have two layers, the outer and inner layers (shown in Figure 4). The outer layer was relatively porous, while the inner layer was compact.
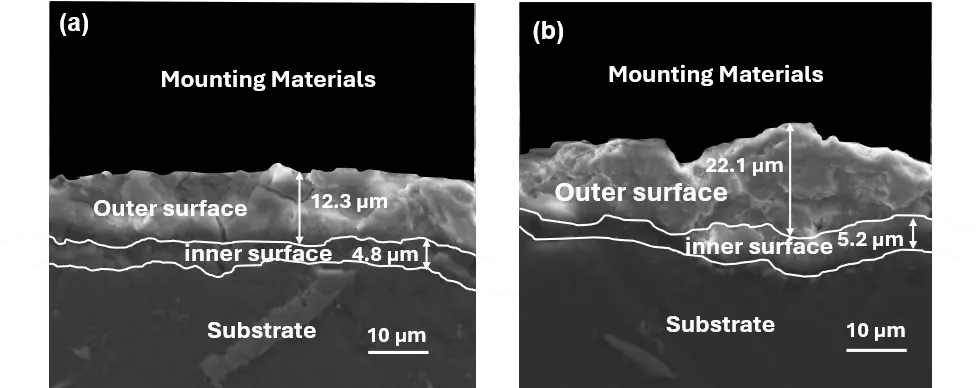
Figure 4. Cross-sectional images showing the outer and inner layers of the oxide films formed on AE44 via PEO in the aluminate electrolyte: (a) from experiment 1; (b) from experiment 2.
The data presented in Table 2 indicated that the coating of Experiment 1 formed at a lower voltage exhibited greater thickness, higher porosity, and lower surface roughness. In contrast, the coating produced in Experiment 2 at a higher voltage showed reduced porosity and increased roughness. This behavior might be attributed to the more intense discharges generated at higher voltage during the PEO process, which romoted the formation of a denser and more compact surface layer.
Table 2. Thickness, porosity and surface roughness of coatings.
|
Experiment |
Thickness (μm) |
Porosity (%) |
Ra (μm) |
Rpk (μm) |
|---|---|---|---|---|
|
1 |
16.21 ± 0.72 |
2.934 ± 0.121 |
1.98 ± 0.08 |
3.75 ± 0.11 |
|
2 |
25.40 ± 1.42 |
1.919 ± 0.063 |
2.79 ± 0.14 |
4.67 ± 0.23 |
Roughness Ra: average roughness; and Roughness Rpk: reduced peak height.
3.3. Chemical and Phase Composition of the Oxide Film
To further verify the elemental composition indicated by EDS, XRD analysis was performed to determine the phase constituents of the oxide films formed in Experiments 1 and 2, as shown in Figure 5. The diffraction patterns revealed that all coatings predominantly consisted of MgAl2O4 and MgO, together with a minor amount of residual Mg. The comparable peak intensities observed for both experiments indicated that their phase compositions were nearly identical, which was likely attributable to the identical electrolyte concentrations used. Previous work by Yang et al. [21] reported that the MgAl2O4 phase played a critical role in enhancing the corrosion resistance of PEO coatings produced in aluminate-based electrolytes. These findings further suggested that aluminate-based coatings on Mg alloys relied largely on the formation of MgAl2O4 to achieve improved corrosion resistance.
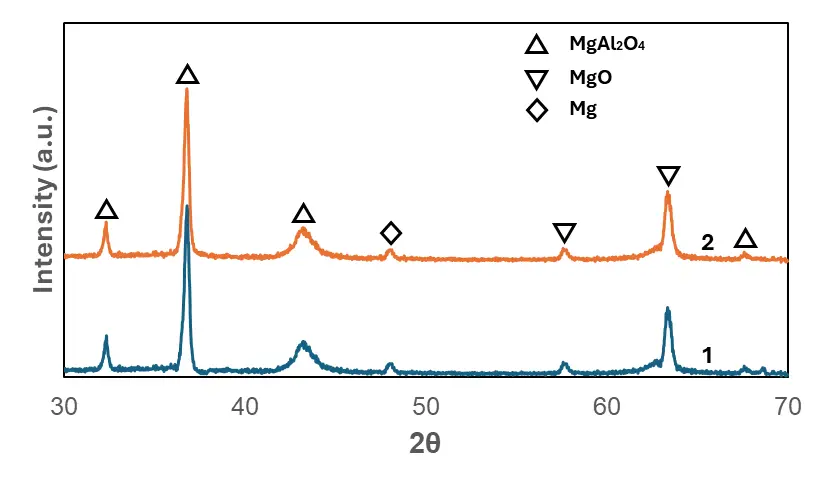
Figure 5. XRD results of the oxide films formed in PEO coatings on AE44 via PEO in Experiments 1 and 2.
3.4. Reaction Mechanism
Figure 6 illustrates the growth mechanism of the PEO coatings and the formation pathways of MgO and MgAl2O4 in aluminate-based coatings on AE44. As shown in Figure 6a, AlO2− anions were uniformly distributed in the electrolyte prior to the application of current. Once the anodic current is applied, magnesium is dissolved into the electrolyte as Mg2+ cations, and a thin, non-conductive MgO layer is formed on the surface, providing initial passivation. As this native oxide layer thickened, the voltage between the substrate and electrolyte increased rapidly, reaching several hundred volts within minutes and triggering numerous short-lived, localized plasma discharges. Concurrently, oxygen diffusion and oxygen evolution occurred at the oxide–electrolyte interface as indicated in Figure 6b.
Meanwhile, AlO2− anions migrated toward the anode surface, where they react to form an aluminum hydroxide (Al(OH)3) layer on the Mg alloy, as depicted in Figure 6c. During the PEO process, various types of plasma discharges were produced. The heat generated within discharge channels promoted metallurgical transformations within the growing oxide layer. Molten oxide was expelled from the coating/substrate interface toward the surface, where it rapidly solidified and recrystallized upon contact with the electrolyte. As a result, Al(OH)3 underwent thermal decomposition, leading to the formation of aluminum oxide (Al2O3) and eventually to the development of complex phases such as MgAl2O4 alongside MgO, as illustrated in Figure 6d. The direction and intensity of these reactions were governed by the discharge density and energy, which were strongly influenced by the evolving thickness of the oxide layer.
%22%20transform%3D%22translate(-268%20-81)%22%3E%3Cuse%20width%3D%22100%25%22%20height%3D%22100%25%22%20xlink%3Ahref%3D%22%23img1%22%20fill%3D%22none%22%20transform%3D%22translate(268%20214)%22%2F%3E%3Cuse%20width%3D%22100%25%22%20height%3D%22100%25%22%20xlink%3Ahref%3D%22%23img2%22%20fill%3D%22none%22%20transform%3D%22translate(268%2081)%22%2F%3E%3Cpath%20d%3D%22M309%20162.5C309%20145.103%20323.103%20131%20340.5%20131%20357.897%20131%20372%20145.103%20372%20162.5%20372%20179.897%20357.897%20194%20340.5%20194%20323.103%20194%20309%20179.897%20309%20162.5Z%22%20fill%3D%22%23215F9A%22%20fill-rule%3D%22evenodd%22%2F%3E%3Ctext%20fill%3D%22%23FFFFFF%22%20font-family%3D%22Cambria%20Math%2CCambria%20Math_MSFontService%2CArial%22%20font-weight%3D%22400%22%20font-size%3D%2216%22%20transform%3D%22translate(321.849%20168)%22%3E%F0%9D%91%A8%F0%9D%92%8D%3C%2Ftext%3E%3Ctext%20fill%3D%22%23FFFFFF%22%20font-family%3D%22Cambria%20Math%2CCambria%20Math_MSFontService%2CArial%22%20font-weight%3D%22400%22%20font-size%3D%2216%22%20transform%3D%22translate(338.515%20168)%22%3E%F0%9D%91%B6%3C%2Ftext%3E%3Ctext%20fill%3D%22%23FFFFFF%22%20font-family%3D%22Cambria%20Math%2CCambria%20Math_MSFontService%2CArial%22%20font-weight%3D%22400%22%20font-size%3D%2212%22%20transform%3D%22translate(350.182%20171)%22%3E%F0%9D%9F%90%3C%2Ftext%3E%3Ctext%20fill%3D%22%23FFFFFF%22%20font-family%3D%22Cambria%20Math%2CCambria%20Math_MSFontService%2CArial%22%20font-weight%3D%22400%22%20font-size%3D%2212%22%20transform%3D%22translate(350.182%20161)%22%3E%E2%88%92%3C%2Ftext%3E%3Cpath%20d%3D%22M370%20213.5C370%20196.103%20384.103%20182%20401.5%20182%20418.897%20182%20433%20196.103%20433%20213.5%20433%20230.897%20418.897%20245%20401.5%20245%20384.103%20245%20370%20230.897%20370%20213.5Z%22%20fill%3D%22%23215F9A%22%20fill-rule%3D%22evenodd%22%2F%3E%3Ctext%20fill%3D%22%23FFFFFF%22%20font-family%3D%22Cambria%20Math%2CCambria%20Math_MSFontService%2CArial%22%20font-weight%3D%22400%22%20font-size%3D%2216%22%20transform%3D%22translate(382.783%20219)%22%3E%F0%9D%91%A8%F0%9D%92%8D%3C%2Ftext%3E%3Ctext%20fill%3D%22%23FFFFFF%22%20font-family%3D%22Cambria%20Math%2CCambria%20Math_MSFontService%2CArial%22%20font-weight%3D%22400%22%20font-size%3D%2216%22%20transform%3D%22translate(399.45%20219)%22%3E%F0%9D%91%B6%3C%2Ftext%3E%3Ctext%20fill%3D%22%23FFFFFF%22%20font-family%3D%22Cambria%20Math%2CCambria%20Math_MSFontService%2CArial%22%20font-weight%3D%22400%22%20font-size%3D%2212%22%20transform%3D%22translate(411.116%20222)%22%3E%F0%9D%9F%90%3C%2Ftext%3E%3Ctext%20fill%3D%22%23FFFFFF%22%20font-family%3D%22Cambria%20Math%2CCambria%20Math_MSFontService%2CArial%22%20font-weight%3D%22400%22%20font-size%3D%2212%22%20transform%3D%22translate(411.116%20212)%22%3E%E2%88%92%3C%2Ftext%3E%3Cpath%20d%3D%22M431%20166.5C431%20149.103%20445.103%20135%20462.5%20135%20479.897%20135%20494%20149.103%20494%20166.5%20494%20183.897%20479.897%20198%20462.5%20198%20445.103%20198%20431%20183.897%20431%20166.5Z%22%20fill%3D%22%23215F9A%22%20fill-rule%3D%22evenodd%22%2F%3E%3Ctext%20fill%3D%22%23FFFFFF%22%20font-family%3D%22Cambria%20Math%2CCambria%20Math_MSFontService%2CArial%22%20font-weight%3D%22400%22%20font-size%3D%2216%22%20transform%3D%22translate(443.876%20172)%22%3E%F0%9D%91%A8%F0%9D%92%8D%3C%2Ftext%3E%3Ctext%20fill%3D%22%23FFFFFF%22%20font-family%3D%22Cambria%20Math%2CCambria%20Math_MSFontService%2CArial%22%20font-weight%3D%22400%22%20font-size%3D%2216%22%20transform%3D%22translate(460.543%20172)%22%3E%F0%9D%91%B6%3C%2Ftext%3E%3Ctext%20fill%3D%22%23FFFFFF%22%20font-family%3D%22Cambria%20Math%2CCambria%20Math_MSFontService%2CArial%22%20font-weight%3D%22400%22%20font-size%3D%2212%22%20transform%3D%22translate(472.21%20176)%22%3E%F0%9D%9F%90%3C%2Ftext%3E%3Ctext%20fill%3D%22%23FFFFFF%22%20font-family%3D%22Cambria%20Math%2CCambria%20Math_MSFontService%2CArial%22%20font-weight%3D%22400%22%20font-size%3D%2212%22%20transform%3D%22translate(472.21%20165)%22%3E%E2%88%92%3C%2Ftext%3E%3Cpath%20d%3D%22M495%20213.5C495%20196.103%20509.103%20182%20526.5%20182%20543.897%20182%20558%20196.103%20558%20213.5%20558%20230.897%20543.897%20245%20526.5%20245%20509.103%20245%20495%20230.897%20495%20213.5Z%22%20fill%3D%22%23215F9A%22%20fill-rule%3D%22evenodd%22%2F%3E%3Ctext%20fill%3D%22%23FFFFFF%22%20font-family%3D%22Cambria%20Math%2CCambria%20Math_MSFontService%2CArial%22%20font-weight%3D%22400%22%20font-size%3D%2216%22%20transform%3D%22translate(507.393%20219)%22%3E%F0%9D%91%A8%F0%9D%92%8D%3C%2Ftext%3E%3Ctext%20fill%3D%22%23FFFFFF%22%20font-family%3D%22Cambria%20Math%2CCambria%20Math_MSFontService%2CArial%22%20font-weight%3D%22400%22%20font-size%3D%2216%22%20transform%3D%22translate(524.06%20219)%22%3E%F0%9D%91%B6%3C%2Ftext%3E%3Ctext%20fill%3D%22%23FFFFFF%22%20font-family%3D%22Cambria%20Math%2CCambria%20Math_MSFontService%2CArial%22%20font-weight%3D%22400%22%20font-size%3D%2212%22%20transform%3D%22translate(535.727%20222)%22%3E%F0%9D%9F%90%3C%2Ftext%3E%3Ctext%20fill%3D%22%23FFFFFF%22%20font-family%3D%22Cambria%20Math%2CCambria%20Math_MSFontService%2CArial%22%20font-weight%3D%22400%22%20font-size%3D%2212%22%20transform%3D%22translate(535.727%20212)%22%3E%E2%88%92%3C%2Ftext%3E%3Cpath%20d%3D%22M555%20162.5C555%20145.103%20569.103%20131%20586.5%20131%20603.897%20131%20618%20145.103%20618%20162.5%20618%20179.897%20603.897%20194%20586.5%20194%20569.103%20194%20555%20179.897%20555%20162.5Z%22%20fill%3D%22%23215F9A%22%20fill-rule%3D%22evenodd%22%2F%3E%3Ctext%20fill%3D%22%23FFFFFF%22%20font-family%3D%22Cambria%20Math%2CCambria%20Math_MSFontService%2CArial%22%20font-weight%3D%22400%22%20font-size%3D%2216%22%20transform%3D%22translate(568.081%20168)%22%3E%F0%9D%91%A8%F0%9D%92%8D%3C%2Ftext%3E%3Ctext%20fill%3D%22%23FFFFFF%22%20font-family%3D%22Cambria%20Math%2CCambria%20Math_MSFontService%2CArial%22%20font-weight%3D%22400%22%20font-size%3D%2216%22%20transform%3D%22translate(584.747%20168)%22%3E%F0%9D%91%B6%3C%2Ftext%3E%3Ctext%20fill%3D%22%23FFFFFF%22%20font-family%3D%22Cambria%20Math%2CCambria%20Math_MSFontService%2CArial%22%20font-weight%3D%22400%22%20font-size%3D%2212%22%20transform%3D%22translate(596.414%20172)%22%3E%F0%9D%9F%90%3C%2Ftext%3E%3Ctext%20fill%3D%22%23FFFFFF%22%20font-family%3D%22Cambria%20Math%2CCambria%20Math_MSFontService%2CArial%22%20font-weight%3D%22400%22%20font-size%3D%2212%22%20transform%3D%22translate(596.414%20162)%22%3E%E2%88%92%3C%2Ftext%3E%3Ctext%20font-family%3D%22Aptos%2CAptos_MSFontService%2CArial%22%20font-weight%3D%22700%22%20font-size%3D%2224%22%20transform%3D%22translate(367.646%20293)%22%3EMg%20Alloy%20Substrate%3C%2Ftext%3E%3Cuse%20width%3D%22100%25%22%20height%3D%22100%25%22%20xlink%3Ahref%3D%22%23img3%22%20fill%3D%22none%22%20transform%3D%22translate(631%20214)%22%2F%3E%3Cpath%20d%3D%22M681%20285.5C681%20274.178%20690.178%20265%20701.5%20265%20712.822%20265%20722%20274.178%20722%20285.5%20722%20296.822%20712.822%20306%20701.5%20306%20690.178%20306%20681%20296.822%20681%20285.5Z%22%20fill%3D%22%23F2E05C%22%20fill-rule%3D%22evenodd%22%2F%3E%3Ctext%20font-family%3D%22Cambria%20Math%2CCambria%20Math_MSFontService%2CArial%22%20font-weight%3D%22400%22%20font-size%3D%2215%22%20transform%3D%22translate(682.726%20290)%22%3E%F0%9D%91%B4%F0%9D%92%88%3C%2Ftext%3E%3Ctext%20font-family%3D%22Cambria%20Math%2CCambria%20Math_MSFontService%2CArial%22%20font-weight%3D%22400%22%20font-size%3D%2211%22%20transform%3D%22translate(706.059%20284)%22%3E%F0%9D%9F%90%3C%2Ftext%3E%3Ctext%20font-family%3D%22Cambria%20Math%2CCambria%20Math_MSFontService%2CArial%22%20font-weight%3D%22400%22%20font-size%3D%2211%22%20transform%3D%22translate(712.392%20284)%22%3E%2B%3C%2Ftext%3E%3Cpath%20d%3D%22M732%20299C732%20287.954%20741.178%20279%20752.5%20279%20763.822%20279%20773%20287.954%20773%20299%20773%20310.046%20763.822%20319%20752.5%20319%20741.178%20319%20732%20310.046%20732%20299Z%22%20fill%3D%22%23F2E05C%22%20fill-rule%3D%22evenodd%22%2F%3E%3Ctext%20font-family%3D%22Cambria%20Math%2CCambria%20Math_MSFontService%2CArial%22%20font-weight%3D%22400%22%20font-size%3D%2215%22%20transform%3D%22translate(733.754%20303)%22%3E%F0%9D%91%B4%F0%9D%92%88%3C%2Ftext%3E%3Ctext%20font-family%3D%22Cambria%20Math%2CCambria%20Math_MSFontService%2CArial%22%20font-weight%3D%22400%22%20font-size%3D%2211%22%20transform%3D%22translate(757.087%20298)%22%3E%F0%9D%9F%90%3C%2Ftext%3E%3Ctext%20font-family%3D%22Cambria%20Math%2CCambria%20Math_MSFontService%2CArial%22%20font-weight%3D%22400%22%20font-size%3D%2211%22%20transform%3D%22translate(763.42%20298)%22%3E%2B%3C%2Ftext%3E%3Cpath%20d%3D%22M785%20284C785%20272.954%20794.402%20264%20806%20264%20817.598%20264%20827%20272.954%20827%20284%20827%20295.046%20817.598%20304%20806%20304%20794.402%20304%20785%20295.046%20785%20284Z%22%20fill%3D%22%23F2E05C%22%20fill-rule%3D%22evenodd%22%2F%3E%3Ctext%20font-family%3D%22Cambria%20Math%2CCambria%20Math_MSFontService%2CArial%22%20font-weight%3D%22400%22%20font-size%3D%2215%22%20transform%3D%22translate(786.999%20288)%22%3E%F0%9D%91%B4%F0%9D%92%88%3C%2Ftext%3E%3Ctext%20font-family%3D%22Cambria%20Math%2CCambria%20Math_MSFontService%2CArial%22%20font-weight%3D%22400%22%20font-size%3D%2211%22%20transform%3D%22translate(810.333%20283)%22%3E%F0%9D%9F%90%3C%2Ftext%3E%3Ctext%20font-family%3D%22Cambria%20Math%2CCambria%20Math_MSFontService%2CArial%22%20font-weight%3D%22400%22%20font-size%3D%2211%22%20transform%3D%22translate(816.666%20283)%22%3E%2B%3C%2Ftext%3E%3Cpath%20d%3D%22M834%20301.5C834%20290.178%20843.402%20281%20855%20281%20866.598%20281%20876%20290.178%20876%20301.5%20876%20312.822%20866.598%20322%20855%20322%20843.402%20322%20834%20312.822%20834%20301.5Z%22%20fill%3D%22%23F2E05C%22%20fill-rule%3D%22evenodd%22%2F%3E%3Ctext%20font-family%3D%22Cambria%20Math%2CCambria%20Math_MSFontService%2CArial%22%20font-weight%3D%22400%22%20font-size%3D%2215%22%20transform%3D%22translate(835.979%20306)%22%3E%F0%9D%91%B4%F0%9D%92%88%3C%2Ftext%3E%3Ctext%20font-family%3D%22Cambria%20Math%2CCambria%20Math_MSFontService%2CArial%22%20font-weight%3D%22400%22%20font-size%3D%2211%22%20transform%3D%22translate(859.312%20300)%22%3E%F0%9D%9F%90%3C%2Ftext%3E%3Ctext%20font-family%3D%22Cambria%20Math%2CCambria%20Math_MSFontService%2CArial%22%20font-weight%3D%22400%22%20font-size%3D%2211%22%20transform%3D%22translate(865.645%20300)%22%3E%2B%3C%2Ftext%3E%3Cpath%20d%3D%22M882%20283C882%20271.954%20891.178%20263%20902.5%20263%20913.822%20263%20923%20271.954%20923%20283%20923%20294.046%20913.822%20303%20902.5%20303%20891.178%20303%20882%20294.046%20882%20283Z%22%20fill%3D%22%23F2E05C%22%20fill-rule%3D%22evenodd%22%2F%3E%3Ctext%20font-family%3D%22Cambria%20Math%2CCambria%20Math_MSFontService%2CArial%22%20font-weight%3D%22400%22%20font-size%3D%2215%22%20transform%3D%22translate(883.85%20287)%22%3E%F0%9D%91%B4%F0%9D%92%88%3C%2Ftext%3E%3Ctext%20font-family%3D%22Cambria%20Math%2CCambria%20Math_MSFontService%2CArial%22%20font-weight%3D%22400%22%20font-size%3D%2211%22%20transform%3D%22translate(907.183%20282)%22%3E%F0%9D%9F%90%3C%2Ftext%3E%3Ctext%20font-family%3D%22Cambria%20Math%2CCambria%20Math_MSFontService%2CArial%22%20font-weight%3D%22400%22%20font-size%3D%2211%22%20transform%3D%22translate(913.517%20282)%22%3E%2B%3C%2Ftext%3E%3Cpath%20d%3D%22M930%20301C930%20289.954%20939.402%20281%20951%20281%20962.598%20281%20972%20289.954%20972%20301%20972%20312.046%20962.598%20321%20951%20321%20939.402%20321%20930%20312.046%20930%20301Z%22%20fill%3D%22%23F2E05C%22%20fill-rule%3D%22evenodd%22%2F%3E%3Ctext%20font-family%3D%22Cambria%20Math%2CCambria%20Math_MSFontService%2CArial%22%20font-weight%3D%22400%22%20font-size%3D%2215%22%20transform%3D%22translate(932.004%20305)%22%3E%F0%9D%91%B4%F0%9D%92%88%3C%2Ftext%3E%3Ctext%20font-family%3D%22Cambria%20Math%2CCambria%20Math_MSFontService%2CArial%22%20font-weight%3D%22400%22%20font-size%3D%2211%22%20transform%3D%22translate(955.337%20300)%22%3E%F0%9D%9F%90%3C%2Ftext%3E%3Ctext%20font-family%3D%22Cambria%20Math%2CCambria%20Math_MSFontService%2CArial%22%20font-weight%3D%22400%22%20font-size%3D%2211%22%20transform%3D%22translate(961.67%20300)%22%3E%2B%3C%2Ftext%3E%3Cpath%20d%3D%22M698%20257.5%20701.5%20254%20705%20257.5%20703.25%20257.5%20703.25%20273%20699.75%20273%20699.75%20257.5Z%22%20fill%3D%22%23FF0000%22%20fill-rule%3D%22evenodd%22%2F%3E%3Cpath%20d%3D%22M749%20270.5%20752.5%20267%20756%20270.5%20754.25%20270.5%20754.25%20287%20750.75%20287%20750.75%20270.5Z%22%20fill%3D%22%23FF0000%22%20fill-rule%3D%22evenodd%22%2F%3E%3Cpath%20d%3D%22M803%20258%20806%20255%20809%20258%20807.5%20258%20807.5%20275%20804.5%20275%20804.5%20258Z%22%20fill%3D%22%23FF0000%22%20fill-rule%3D%22evenodd%22%2F%3E%3Cpath%20d%3D%22M851%20270.5%20854.5%20267%20858%20270.5%20856.25%20270.5%20856.25%20287%20852.75%20287%20852.75%20270.5Z%22%20fill%3D%22%23FF0000%22%20fill-rule%3D%22evenodd%22%2F%3E%3Cpath%20d%3D%22M900%20254.5%20902.5%20252%20905%20254.5%20903.75%20254.5%20903.75%20270%20901.25%20270%20901.25%20254.5Z%22%20fill%3D%22%23FF0000%22%20fill-rule%3D%22evenodd%22%2F%3E%3Cpath%20d%3D%22M946%20270.5%20949.5%20267%20953%20270.5%20951.25%20270.5%20951.25%20287%20947.75%20287%20947.75%20270.5Z%22%20fill%3D%22%23FF0000%22%20fill-rule%3D%22evenodd%22%2F%3E%3Cuse%20width%3D%22100%25%22%20height%3D%22100%25%22%20xlink%3Ahref%3D%22%23img4%22%20fill%3D%22none%22%20transform%3D%22translate(631%20191)%22%2F%3E%3Ctext%20font-family%3D%22Aptos%2CAptos_MSFontService%2CArial%22%20font-weight%3D%22700%22%20font-size%3D%2224%22%20transform%3D%22translate(680.924%20247)%22%3EMgO%20(Passive%20Oxide%20Layer)%3C%2Ftext%3E%3Cuse%20width%3D%22100%25%22%20height%3D%22100%25%22%20xlink%3Ahref%3D%22%23img5%22%20fill%3D%22none%22%20transform%3D%22translate(631%2081)%22%2F%3E%3Cpath%20d%3D%22M670%20150C670%20132.879%20684.103%20119%20701.5%20119%20718.897%20119%20733%20132.879%20733%20150%20733%20167.121%20718.897%20181%20701.5%20181%20684.103%20181%20670%20167.121%20670%20150Z%22%20fill%3D%22%23215F9A%22%20fill-rule%3D%22evenodd%22%2F%3E%3Ctext%20fill%3D%22%23FFFFFF%22%20font-family%3D%22Cambria%20Math%2CCambria%20Math_MSFontService%2CArial%22%20font-weight%3D%22400%22%20font-size%3D%2216%22%20transform%3D%22translate(682.707%20155)%22%3E%F0%9D%91%A8%F0%9D%92%8D%3C%2Ftext%3E%3Ctext%20fill%3D%22%23FFFFFF%22%20font-family%3D%22Cambria%20Math%2CCambria%20Math_MSFontService%2CArial%22%20font-weight%3D%22400%22%20font-size%3D%2216%22%20transform%3D%22translate(699.373%20155)%22%3E%F0%9D%91%B6%3C%2Ftext%3E%3Ctext%20fill%3D%22%23FFFFFF%22%20font-family%3D%22Cambria%20Math%2CCambria%20Math_MSFontService%2CArial%22%20font-weight%3D%22400%22%20font-size%3D%2212%22%20transform%3D%22translate(711.04%20159)%22%3E%F0%9D%9F%90%3C%2Ftext%3E%3Ctext%20fill%3D%22%23FFFFFF%22%20font-family%3D%22Cambria%20Math%2CCambria%20Math_MSFontService%2CArial%22%20font-weight%3D%22400%22%20font-size%3D%2212%22%20transform%3D%22translate(711.04%20149)%22%3E%E2%88%92%3C%2Ftext%3E%3Cpath%20d%3D%22M727%20188.5C727%20171.103%20741.103%20157%20758.5%20157%20775.897%20157%20790%20171.103%20790%20188.5%20790%20205.897%20775.897%20220%20758.5%20220%20741.103%20220%20727%20205.897%20727%20188.5Z%22%20fill%3D%22%23215F9A%22%20fill-rule%3D%22evenodd%22%2F%3E%3Ctext%20fill%3D%22%23FFFFFF%22%20font-family%3D%22Cambria%20Math%2CCambria%20Math_MSFontService%2CArial%22%20font-weight%3D%22400%22%20font-size%3D%2216%22%20transform%3D%22translate(739.549%20194)%22%3E%F0%9D%91%A8%F0%9D%92%8D%3C%2Ftext%3E%3Ctext%20fill%3D%22%23FFFFFF%22%20font-family%3D%22Cambria%20Math%2CCambria%20Math_MSFontService%2CArial%22%20font-weight%3D%22400%22%20font-size%3D%2216%22%20transform%3D%22translate(756.216%20194)%22%3E%F0%9D%91%B6%3C%2Ftext%3E%3Ctext%20fill%3D%22%23FFFFFF%22%20font-family%3D%22Cambria%20Math%2CCambria%20Math_MSFontService%2CArial%22%20font-weight%3D%22400%22%20font-size%3D%2212%22%20transform%3D%22translate(767.882%20198)%22%3E%F0%9D%9F%90%3C%2Ftext%3E%3Ctext%20fill%3D%22%23FFFFFF%22%20font-family%3D%22Cambria%20Math%2CCambria%20Math_MSFontService%2CArial%22%20font-weight%3D%22400%22%20font-size%3D%2212%22%20transform%3D%22translate(767.882%20188)%22%3E%E2%88%92%3C%2Ftext%3E%3Cpath%20d%3D%22M787%20149.5C787%20132.103%20801.103%20118%20818.5%20118%20835.897%20118%20850%20132.103%20850%20149.5%20850%20166.897%20835.897%20181%20818.5%20181%20801.103%20181%20787%20166.897%20787%20149.5Z%22%20fill%3D%22%23215F9A%22%20fill-rule%3D%22evenodd%22%2F%3E%3Ctext%20fill%3D%22%23FFFFFF%22%20font-family%3D%22Cambria%20Math%2CCambria%20Math_MSFontService%2CArial%22%20font-weight%3D%22400%22%20font-size%3D%2216%22%20transform%3D%22translate(799.489%20155)%22%3E%F0%9D%91%A8%F0%9D%92%8D%3C%2Ftext%3E%3Ctext%20fill%3D%22%23FFFFFF%22%20font-family%3D%22Cambria%20Math%2CCambria%20Math_MSFontService%2CArial%22%20font-weight%3D%22400%22%20font-size%3D%2216%22%20transform%3D%22translate(816.155%20155)%22%3E%F0%9D%91%B6%3C%2Ftext%3E%3Ctext%20fill%3D%22%23FFFFFF%22%20font-family%3D%22Cambria%20Math%2CCambria%20Math_MSFontService%2CArial%22%20font-weight%3D%22400%22%20font-size%3D%2212%22%20transform%3D%22translate(827.822%20158)%22%3E%F0%9D%9F%90%3C%2Ftext%3E%3Ctext%20fill%3D%22%23FFFFFF%22%20font-family%3D%22Cambria%20Math%2CCambria%20Math_MSFontService%2CArial%22%20font-weight%3D%22400%22%20font-size%3D%2212%22%20transform%3D%22translate(827.822%20148)%22%3E%E2%88%92%3C%2Ftext%3E%3Cpath%20d%3D%22M851%20190C851%20172.879%20865.103%20159%20882.5%20159%20899.897%20159%20914%20172.879%20914%20190%20914%20207.121%20899.897%20221%20882.5%20221%20865.103%20221%20851%20207.121%20851%20190Z%22%20fill%3D%22%23215F9A%22%20fill-rule%3D%22evenodd%22%2F%3E%3Ctext%20fill%3D%22%23FFFFFF%22%20font-family%3D%22Cambria%20Math%2CCambria%20Math_MSFontService%2CArial%22%20font-weight%3D%22400%22%20font-size%3D%2216%22%20transform%3D%22translate(863.717%20195)%22%3E%F0%9D%91%A8%F0%9D%92%8D%3C%2Ftext%3E%3Ctext%20fill%3D%22%23FFFFFF%22%20font-family%3D%22Cambria%20Math%2CCambria%20Math_MSFontService%2CArial%22%20font-weight%3D%22400%22%20font-size%3D%2216%22%20transform%3D%22translate(880.384%20195)%22%3E%F0%9D%91%B6%3C%2Ftext%3E%3Ctext%20fill%3D%22%23FFFFFF%22%20font-family%3D%22Cambria%20Math%2CCambria%20Math_MSFontService%2CArial%22%20font-weight%3D%22400%22%20font-size%3D%2212%22%20transform%3D%22translate(892.05%20199)%22%3E%F0%9D%9F%90%3C%2Ftext%3E%3Ctext%20fill%3D%22%23FFFFFF%22%20font-family%3D%22Cambria%20Math%2CCambria%20Math_MSFontService%2CArial%22%20font-weight%3D%22400%22%20font-size%3D%2212%22%20transform%3D%22translate(892.05%20189)%22%3E%E2%88%92%3C%2Ftext%3E%3Cpath%20d%3D%22M914%20149C914%20131.879%20928.103%20118%20945.5%20118%20962.897%20118%20977%20131.879%20977%20149%20977%20166.121%20962.897%20180%20945.5%20180%20928.103%20180%20914%20166.121%20914%20149Z%22%20fill%3D%22%23215F9A%22%20fill-rule%3D%22evenodd%22%2F%3E%3Ctext%20fill%3D%22%23FFFFFF%22%20font-family%3D%22Cambria%20Math%2CCambria%20Math_MSFontService%2CArial%22%20font-weight%3D%22400%22%20font-size%3D%2216%22%20transform%3D%22translate(926.949%20155)%22%3E%F0%9D%91%A8%F0%9D%92%8D%3C%2Ftext%3E%3Ctext%20fill%3D%22%23FFFFFF%22%20font-family%3D%22Cambria%20Math%2CCambria%20Math_MSFontService%2CArial%22%20font-weight%3D%22400%22%20font-size%3D%2216%22%20transform%3D%22translate(943.616%20155)%22%3E%F0%9D%91%B6%3C%2Ftext%3E%3Ctext%20fill%3D%22%23FFFFFF%22%20font-family%3D%22Cambria%20Math%2CCambria%20Math_MSFontService%2CArial%22%20font-weight%3D%22400%22%20font-size%3D%2212%22%20transform%3D%22translate(955.283%20158)%22%3E%F0%9D%9F%90%3C%2Ftext%3E%3Ctext%20fill%3D%22%23FFFFFF%22%20font-family%3D%22Cambria%20Math%2CCambria%20Math_MSFontService%2CArial%22%20font-weight%3D%22400%22%20font-size%3D%2212%22%20transform%3D%22translate(955.283%20148)%22%3E%E2%88%92%3C%2Ftext%3E%3Cpath%20d%3D%22M697%20191%20699%20191%20699%20171%20703%20171%20703%20191%20705%20191%20701%20195Z%22%20fill%3D%22%23FF0000%22%20fill-rule%3D%22evenodd%22%2F%3E%3Cpath%20d%3D%22M754%20228%20756%20228%20756%20207%20760%20207%20760%20228%20762%20228%20758%20232Z%22%20fill%3D%22%23FF0000%22%20fill-rule%3D%22evenodd%22%2F%3E%3Cpath%20d%3D%22M815%20189.5%20816.75%20189.5%20816.75%20168%20820.25%20168%20820.25%20189.5%20822%20189.5%20818.5%20193Z%22%20fill%3D%22%23FF0000%22%20fill-rule%3D%22evenodd%22%2F%3E%3Cpath%20d%3D%22M879%20225.5%20880.75%20225.5%20880.75%20205%20884.25%20205%20884.25%20225.5%20886%20225.5%20882.5%20229Z%22%20fill%3D%22%23FF0000%22%20fill-rule%3D%22evenodd%22%2F%3E%3Cpath%20d%3D%22M944%20188%20946%20188%20946%20167%20950%20167%20950%20188%20952%20188%20948%20192Z%22%20fill%3D%22%23FF0000%22%20fill-rule%3D%22evenodd%22%2F%3E%3Cpath%20d%3D%22M668%20220C668%20213.373%20673.373%20208%20680%20208%20686.627%20208%20692%20213.373%20692%20220%20692%20226.627%20686.627%20232%20680%20232%20673.373%20232%20668%20226.627%20668%20220Z%22%20fill%3D%22%2300B050%22%20fill-rule%3D%22evenodd%22%2F%3E%3Cpath%20d%3D%22M777%20219.5C777%20213.149%20782.373%20208%20789%20208%20795.627%20208%20801%20213.149%20801%20219.5%20801%20225.851%20795.627%20231%20789%20231%20782.373%20231%20777%20225.851%20777%20219.5Z%22%20fill%3D%22%2300B050%22%20fill-rule%3D%22evenodd%22%2F%3E%3Cpath%20d%3D%22M836%20219.5C836%20213.149%20841.373%20208%20848%20208%20854.627%20208%20860%20213.149%20860%20219.5%20860%20225.851%20854.627%20231%20848%20231%20841.373%20231%20836%20225.851%20836%20219.5Z%22%20fill%3D%22%2300B050%22%20fill-rule%3D%22evenodd%22%2F%3E%3Cpath%20d%3D%22M913%20218.5C913%20212.149%20918.373%20207%20925%20207%20931.627%20207%20937%20212.149%20937%20218.5%20937%20224.851%20931.627%20230%20925%20230%20918.373%20230%20913%20224.851%20913%20218.5Z%22%20fill%3D%22%2300B050%22%20fill-rule%3D%22evenodd%22%2F%3E%3Cpath%20d%3D%22M741%20135.5C741%20126.94%20747.94%20120%20756.5%20120%20765.06%20120%20772%20126.94%20772%20135.5%20772%20144.06%20765.06%20151%20756.5%20151%20747.94%20151%20741%20144.06%20741%20135.5Z%22%20fill%3D%22%23156082%22%20fill-rule%3D%22evenodd%22%2F%3E%3Ctext%20font-family%3D%22Cambria%20Math%2CCambria%20Math_MSFontService%2CArial%22%20font-weight%3D%22400%22%20font-size%3D%2216%22%20transform%3D%22translate(743.916%20143)%22%3E%F0%9D%91%B6%3C%2Ftext%3E%3Ctext%20font-family%3D%22Cambria%20Math%2CCambria%20Math_MSFontService%2CArial%22%20font-weight%3D%22400%22%20font-size%3D%2212%22%20transform%3D%22translate(755.582%20137)%22%3E%F0%9D%9F%90%3C%2Ftext%3E%3Ctext%20font-family%3D%22Cambria%20Math%2CCambria%20Math_MSFontService%2CArial%22%20font-weight%3D%22400%22%20font-size%3D%2212%22%20transform%3D%22translate(762.582%20137)%22%3E%E2%88%92%3C%2Ftext%3E%3Cpath%20d%3D%22M692%20213C692%20204.716%20699.163%20198%20708%20198%20716.837%20198%20724%20204.716%20724%20213%20724%20221.284%20716.837%20228%20708%20228%20699.163%20228%20692%20221.284%20692%20213Z%22%20fill%3D%22%23156082%22%20fill-rule%3D%22evenodd%22%2F%3E%3Ctext%20font-family%3D%22Cambria%20Math%2CCambria%20Math_MSFontService%2CArial%22%20font-weight%3D%22400%22%20font-size%3D%2216%22%20transform%3D%22translate(695.785%20220)%22%3E%F0%9D%91%B6%3C%2Ftext%3E%3Ctext%20font-family%3D%22Cambria%20Math%2CCambria%20Math_MSFontService%2CArial%22%20font-weight%3D%22400%22%20font-size%3D%2212%22%20transform%3D%22translate(707.451%20214)%22%3E%F0%9D%9F%90%3C%2Ftext%3E%3Ctext%20font-family%3D%22Cambria%20Math%2CCambria%20Math_MSFontService%2CArial%22%20font-weight%3D%22400%22%20font-size%3D%2212%22%20transform%3D%22translate(714.451%20214)%22%3E%E2%88%92%3C%2Ftext%3E%3Cpath%20d%3D%22M802%20212.5C802%20203.94%20808.94%20197%20817.5%20197%20826.06%20197%20833%20203.94%20833%20212.5%20833%20221.06%20826.06%20228%20817.5%20228%20808.94%20228%20802%20221.06%20802%20212.5Z%22%20fill%3D%22%23156082%22%20fill-rule%3D%22evenodd%22%2F%3E%3Ctext%20font-family%3D%22Cambria%20Math%2CCambria%20Math_MSFontService%2CArial%22%20font-weight%3D%22400%22%20font-size%3D%2216%22%20transform%3D%22translate(804.911%20220)%22%3E%F0%9D%91%B6%3C%2Ftext%3E%3Ctext%20font-family%3D%22Cambria%20Math%2CCambria%20Math_MSFontService%2CArial%22%20font-weight%3D%22400%22%20font-size%3D%2212%22%20transform%3D%22translate(816.578%20214)%22%3E%F0%9D%9F%90%3C%2Ftext%3E%3Ctext%20font-family%3D%22Cambria%20Math%2CCambria%20Math_MSFontService%2CArial%22%20font-weight%3D%22400%22%20font-size%3D%2212%22%20transform%3D%22translate(823.578%20214)%22%3E%E2%88%92%3C%2Ftext%3E%3Cpath%20d%3D%22M863%20137.5C863%20128.94%20869.94%20122%20878.5%20122%20887.06%20122%20894%20128.94%20894%20137.5%20894%20146.06%20887.06%20153%20878.5%20153%20869.94%20153%20863%20146.06%20863%20137.5Z%22%20fill%3D%22%23156082%22%20fill-rule%3D%22evenodd%22%2F%3E%3Ctext%20font-family%3D%22Cambria%20Math%2CCambria%20Math_MSFontService%2CArial%22%20font-weight%3D%22400%22%20font-size%3D%2216%22%20transform%3D%22translate(865.952%20145)%22%3E%F0%9D%91%B6%3C%2Ftext%3E%3Ctext%20font-family%3D%22Cambria%20Math%2CCambria%20Math_MSFontService%2CArial%22%20font-weight%3D%22400%22%20font-size%3D%2212%22%20transform%3D%22translate(877.619%20139)%22%3E%F0%9D%9F%90%3C%2Ftext%3E%3Ctext%20font-family%3D%22Cambria%20Math%2CCambria%20Math_MSFontService%2CArial%22%20font-weight%3D%22400%22%20font-size%3D%2212%22%20transform%3D%22translate(884.619%20139)%22%3E%E2%88%92%3C%2Ftext%3E%3Cpath%20d%3D%22M940%20214.5C940%20205.94%20946.94%20199%20955.5%20199%20964.06%20199%20971%20205.94%20971%20214.5%20971%20223.06%20964.06%20230%20955.5%20230%20946.94%20230%20940%20223.06%20940%20214.5Z%22%20fill%3D%22%23156082%22%20fill-rule%3D%22evenodd%22%2F%3E%3Ctext%20font-family%3D%22Cambria%20Math%2CCambria%20Math_MSFontService%2CArial%22%20font-weight%3D%22400%22%20font-size%3D%2216%22%20transform%3D%22translate(943.199%20222)%22%3E%F0%9D%91%B6%3C%2Ftext%3E%3Ctext%20font-family%3D%22Cambria%20Math%2CCambria%20Math_MSFontService%2CArial%22%20font-weight%3D%22400%22%20font-size%3D%2212%22%20transform%3D%22translate(954.866%20216)%22%3E%F0%9D%9F%90%3C%2Ftext%3E%3Ctext%20font-family%3D%22Cambria%20Math%2CCambria%20Math_MSFontService%2CArial%22%20font-weight%3D%22400%22%20font-size%3D%2212%22%20transform%3D%22translate(961.866%20216)%22%3E%E2%88%92%3C%2Ftext%3E%3Cpath%20d%3D%22M753%20153%20755%20153%20755%20145%20759%20145%20759%20153%20761%20153%20757%20157Z%22%20fill%3D%22%23FF0000%22%20fill-rule%3D%22evenodd%22%2F%3E%3Cpath%20d%3D%22M705%20228%20706.5%20228%20706.5%20223%20709.5%20223%20709.5%20228%20711%20228%20708%20231Z%22%20fill%3D%22%23FF0000%22%20fill-rule%3D%22evenodd%22%2F%3E%3Cpath%20d%3D%22M813%20228.5%20814.75%20228.5%20814.75%20224%20818.25%20224%20818.25%20228.5%20820%20228.5%20816.5%20232Z%22%20fill%3D%22%23FF0000%22%20fill-rule%3D%22evenodd%22%2F%3E%3Cpath%20d%3D%22M952%20229.5%20953.75%20229.5%20953.75%20225%20957.25%20225%20957.25%20229.5%20959%20229.5%20955.5%20233Z%22%20fill%3D%22%23FF0000%22%20fill-rule%3D%22evenodd%22%2F%3E%3Cpath%20d%3D%22M875%20152.5%20877.25%20152.5%20877.25%20147%20881.75%20147%20881.75%20152.5%20884%20152.5%20879.5%20157Z%22%20fill%3D%22%23FF0000%22%20fill-rule%3D%22evenodd%22%2F%3E%3Ctext%20font-family%3D%22Cambria%20Math%2CCambria%20Math_MSFontService%2CArial%22%20font-weight%3D%22400%22%20font-size%3D%2216%22%20transform%3D%22translate(671.08%20225)%22%3E%F0%9D%91%B6%3C%2Ftext%3E%3Ctext%20font-family%3D%22Cambria%20Math%2CCambria%20Math_MSFontService%2CArial%22%20font-weight%3D%22400%22%20font-size%3D%2212%22%20transform%3D%22translate(682.746%20228)%22%3E%F0%9D%9F%90%3C%2Ftext%3E%3Ctext%20font-family%3D%22Cambria%20Math%2CCambria%20Math_MSFontService%2CArial%22%20font-weight%3D%22400%22%20font-size%3D%2216%22%20transform%3D%22translate(780.338%20224)%22%3E%F0%9D%91%B6%3C%2Ftext%3E%3Ctext%20font-family%3D%22Cambria%20Math%2CCambria%20Math_MSFontService%2CArial%22%20font-weight%3D%22400%22%20font-size%3D%2212%22%20transform%3D%22translate(792.005%20228)%22%3E%F0%9D%9F%90%3C%2Ftext%3E%3Ctext%20font-family%3D%22Cambria%20Math%2CCambria%20Math_MSFontService%2CArial%22%20font-weight%3D%22400%22%20font-size%3D%2216%22%20transform%3D%22translate(839.908%20224)%22%3E%F0%9D%91%B6%3C%2Ftext%3E%3Ctext%20font-family%3D%22Cambria%20Math%2CCambria%20Math_MSFontService%2CArial%22%20font-weight%3D%22400%22%20font-size%3D%2212%22%20transform%3D%22translate(851.575%20227)%22%3E%F0%9D%9F%90%3C%2Ftext%3E%3Ctext%20font-family%3D%22Cambria%20Math%2CCambria%20Math_MSFontService%2CArial%22%20font-weight%3D%22400%22%20font-size%3D%2216%22%20transform%3D%22translate(916.208%20224)%22%3E%F0%9D%91%B6%3C%2Ftext%3E%3Ctext%20font-family%3D%22Cambria%20Math%2CCambria%20Math_MSFontService%2CArial%22%20font-weight%3D%22400%22%20font-size%3D%2212%22%20transform%3D%22translate(927.874%20227)%22%3E%F0%9D%9F%90%3C%2Ftext%3E%3Cpath%20d%3D%22M920%20201.5%20923.5%20198%20927%20201.5%20925.25%20201.5%20925.25%20210%20921.75%20210%20921.75%20201.5Z%22%20fill%3D%22%23FF0000%22%20fill-rule%3D%22evenodd%22%2F%3E%3Cpath%20d%3D%22M845%20202.5%20848.5%20199%20852%20202.5%20850.25%20202.5%20850.25%20211%20846.75%20211%20846.75%20202.5Z%22%20fill%3D%22%23FF0000%22%20fill-rule%3D%22evenodd%22%2F%3E%3Cpath%20d%3D%22M787%20203.5%20790.5%20200%20794%20203.5%20792.25%20203.5%20792.25%20212%20788.75%20212%20788.75%20203.5Z%22%20fill%3D%22%23FF0000%22%20fill-rule%3D%22evenodd%22%2F%3E%3Cpath%20d%3D%22M676%20204%20680%20200%20684%20204%20682%20204%20682%20212%20678%20212%20678%20204Z%22%20fill%3D%22%23FF0000%22%20fill-rule%3D%22evenodd%22%2F%3E%3Cuse%20width%3D%22100%25%22%20height%3D%22100%25%22%20xlink%3Ahref%3D%22%23img6%22%20fill%3D%22none%22%20transform%3D%22translate(275%20482)%22%2F%3E%3Cuse%20width%3D%22100%25%22%20height%3D%22100%25%22%20xlink%3Ahref%3D%22%23img7%22%20fill%3D%22none%22%20transform%3D%22translate(275%20462)%22%2F%3E%3Cuse%20width%3D%22100%25%22%20height%3D%22100%25%22%20xlink%3Ahref%3D%22%23img8%22%20fill%3D%22none%22%20transform%3D%22translate(275%20440)%22%2F%3E%3Cuse%20width%3D%22100%25%22%20height%3D%22100%25%22%20xlink%3Ahref%3D%22%23img9%22%20fill%3D%22none%22%20transform%3D%22translate(275%20335)%22%2F%3E%3Cpath%20d%3D%22M314%20446.5C314%20429.103%20328.103%20415%20345.5%20415%20362.897%20415%20377%20429.103%20377%20446.5%20377%20463.897%20362.897%20478%20345.5%20478%20328.103%20478%20314%20463.897%20314%20446.5Z%22%20fill%3D%22%23215F9A%22%20fill-rule%3D%22evenodd%22%2F%3E%3Ctext%20fill%3D%22%23FFFFFF%22%20font-family%3D%22Cambria%20Math%2CCambria%20Math_MSFontService%2CArial%22%20font-weight%3D%22400%22%20font-size%3D%2216%22%20transform%3D%22translate(326.235%20452)%22%3E%F0%9D%91%A8%F0%9D%92%8D%3C%2Ftext%3E%3Ctext%20fill%3D%22%23FFFFFF%22%20font-family%3D%22Cambria%20Math%2CCambria%20Math_MSFontService%2CArial%22%20font-weight%3D%22400%22%20font-size%3D%2216%22%20transform%3D%22translate(342.902%20452)%22%3E%F0%9D%91%B6%3C%2Ftext%3E%3Ctext%20fill%3D%22%23FFFFFF%22%20font-family%3D%22Cambria%20Math%2CCambria%20Math_MSFontService%2CArial%22%20font-weight%3D%22400%22%20font-size%3D%2212%22%20transform%3D%22translate(354.569%20456)%22%3E%F0%9D%9F%90%3C%2Ftext%3E%3Ctext%20fill%3D%22%23FFFFFF%22%20font-family%3D%22Cambria%20Math%2CCambria%20Math_MSFontService%2CArial%22%20font-weight%3D%22400%22%20font-size%3D%2212%22%20transform%3D%22translate(354.569%20445)%22%3E%E2%88%92%3C%2Ftext%3E%3Cpath%20d%3D%22M436%20446C436%20428.879%20450.103%20415%20467.5%20415%20484.897%20415%20499%20428.879%20499%20446%20499%20463.121%20484.897%20477%20467.5%20477%20450.103%20477%20436%20463.121%20436%20446Z%22%20fill%3D%22%23215F9A%22%20fill-rule%3D%22evenodd%22%2F%3E%3Ctext%20fill%3D%22%23FFFFFF%22%20font-family%3D%22Cambria%20Math%2CCambria%20Math_MSFontService%2CArial%22%20font-weight%3D%22400%22%20font-size%3D%2216%22%20transform%3D%22translate(448.395%20451)%22%3E%F0%9D%91%A8%F0%9D%92%8D%3C%2Ftext%3E%3Ctext%20fill%3D%22%23FFFFFF%22%20font-family%3D%22Cambria%20Math%2CCambria%20Math_MSFontService%2CArial%22%20font-weight%3D%22400%22%20font-size%3D%2216%22%20transform%3D%22translate(465.062%20451)%22%3E%F0%9D%91%B6%3C%2Ftext%3E%3Ctext%20fill%3D%22%23FFFFFF%22%20font-family%3D%22Cambria%20Math%2CCambria%20Math_MSFontService%2CArial%22%20font-weight%3D%22400%22%20font-size%3D%2212%22%20transform%3D%22translate(476.728%20455)%22%3E%F0%9D%9F%90%3C%2Ftext%3E%3Ctext%20fill%3D%22%23FFFFFF%22%20font-family%3D%22Cambria%20Math%2CCambria%20Math_MSFontService%2CArial%22%20font-weight%3D%22400%22%20font-size%3D%2212%22%20transform%3D%22translate(476.728%20445)%22%3E%E2%88%92%3C%2Ftext%3E%3Cpath%20d%3D%22M565%20447.5C565%20430.103%20579.103%20416%20596.5%20416%20613.897%20416%20628%20430.103%20628%20447.5%20628%20464.897%20613.897%20479%20596.5%20479%20579.103%20479%20565%20464.897%20565%20447.5Z%22%20fill%3D%22%23215F9A%22%20fill-rule%3D%22evenodd%22%2F%3E%3Ctext%20fill%3D%22%23FFFFFF%22%20font-family%3D%22Cambria%20Math%2CCambria%20Math_MSFontService%2CArial%22%20font-weight%3D%22400%22%20font-size%3D%2216%22%20transform%3D%22translate(577.937%20453)%22%3E%F0%9D%91%A8%F0%9D%92%8D%3C%2Ftext%3E%3Ctext%20fill%3D%22%23FFFFFF%22%20font-family%3D%22Cambria%20Math%2CCambria%20Math_MSFontService%2CArial%22%20font-weight%3D%22400%22%20font-size%3D%2216%22%20transform%3D%22translate(594.603%20453)%22%3E%F0%9D%91%B6%3C%2Ftext%3E%3Ctext%20fill%3D%22%23FFFFFF%22%20font-family%3D%22Cambria%20Math%2CCambria%20Math_MSFontService%2CArial%22%20font-weight%3D%22400%22%20font-size%3D%2212%22%20transform%3D%22translate(606.27%20456)%22%3E%F0%9D%9F%90%3C%2Ftext%3E%3Ctext%20fill%3D%22%23FFFFFF%22%20font-family%3D%22Cambria%20Math%2CCambria%20Math_MSFontService%2CArial%22%20font-weight%3D%22400%22%20font-size%3D%2212%22%20transform%3D%22translate(606.27%20446)%22%3E%E2%88%92%3C%2Ftext%3E%3Cpath%20d%3D%22M445%20475.647%20446.848%20472.676%20446.188%20468.971%20449.152%20468.971%20451%20466%20452.848%20468.971%20455.812%20468.971%20455.152%20472.676%20457%20475.647%20454.33%20477.295%20453.67%20481%20451%20479.351%20448.33%20481%20447.67%20477.295Z%22%20stroke%3D%22%23FFC000%22%20stroke-width%3D%222%22%20stroke-miterlimit%3D%228%22%20fill%3D%22%23FFFF00%22%20fill-rule%3D%22evenodd%22%2F%3E%3Cpath%20d%3D%22M461%20481.647%20462.848%20478.676%20462.188%20474.971%20465.152%20474.971%20467%20472%20468.848%20474.971%20471.812%20474.971%20471.152%20478.676%20473%20481.647%20470.33%20483.295%20469.67%20487%20467%20485.351%20464.33%20487%20463.67%20483.295Z%22%20stroke%3D%22%23FFC000%22%20stroke-width%3D%222%22%20stroke-miterlimit%3D%228%22%20fill%3D%22%23FFFF00%22%20fill-rule%3D%22evenodd%22%2F%3E%3Cpath%20d%3D%22M475%20477.29%20477.002%20474.121%20476.287%20470.169%20479.498%20470.169%20481.5%20467%20483.502%20470.169%20486.713%20470.169%20485.998%20474.121%20488%20477.29%20485.107%20479.048%20484.393%20483%20481.5%20481.241%20478.607%20483%20477.893%20479.048Z%22%20stroke%3D%22%23FFC000%22%20stroke-width%3D%222%22%20stroke-miterlimit%3D%228%22%20fill%3D%22%23FFFF00%22%20fill-rule%3D%22evenodd%22%2F%3E%3Cpath%20d%3D%22M0.580623-0.814173%2015.2377%209.63847%2014.0765%2011.2668-0.580623%200.814173ZM15.894%206.42179%2020.0849%2014.3235%2011.2491%2012.9352Z%22%20fill%3D%22%23FF0000%22%20transform%3D%22matrix(1%200%200%20-1%20487%20472.323)%22%2F%3E%3Cpath%20d%3D%22M445.128%20474.074%20430.075%20464.437%20431.154%20462.753%20446.206%20472.39ZM429.581%20467.682%20425%20460%20433.894%20460.945Z%22%20fill%3D%22%23FF0000%22%2F%3E%3Cpath%20d%3D%22M505%20450.5C505%20444.149%20510.373%20439%20517%20439%20523.627%20439%20529%20444.149%20529%20450.5%20529%20456.851%20523.627%20462%20517%20462%20510.373%20462%20505%20456.851%20505%20450.5Z%22%20fill%3D%22%2300B050%22%20fill-rule%3D%22evenodd%22%2F%3E%3Ctext%20font-family%3D%22Cambria%20Math%2CCambria%20Math_MSFontService%2CArial%22%20font-weight%3D%22400%22%20font-size%3D%2216%22%20transform%3D%22translate(508.74%20455)%22%3E%F0%9D%91%B6%3C%2Ftext%3E%3Ctext%20font-family%3D%22Cambria%20Math%2CCambria%20Math_MSFontService%2CArial%22%20font-weight%3D%22400%22%20font-size%3D%2212%22%20transform%3D%22translate(520.407%20458)%22%3E%F0%9D%9F%90%3C%2Ftext%3E%3Cpath%20d%3D%22M408%20450.5C408%20444.149%20413.596%20439%20420.5%20439%20427.404%20439%20433%20444.149%20433%20450.5%20433%20456.851%20427.404%20462%20420.5%20462%20413.596%20462%20408%20456.851%20408%20450.5Z%22%20fill%3D%22%2300B050%22%20fill-rule%3D%22evenodd%22%2F%3E%3Ctext%20font-family%3D%22Cambria%20Math%2CCambria%20Math_MSFontService%2CArial%22%20font-weight%3D%22400%22%20font-size%3D%2216%22%20transform%3D%22translate(412.08%20455)%22%3E%F0%9D%91%B6%3C%2Ftext%3E%3Ctext%20font-family%3D%22Cambria%20Math%2CCambria%20Math_MSFontService%2CArial%22%20font-weight%3D%22400%22%20font-size%3D%2212%22%20transform%3D%22translate(423.747%20458)%22%3E%F0%9D%9F%90%3C%2Ftext%3E%3Ctext%20font-family%3D%22Aptos%2CAptos_MSFontService%2CArial%22%20font-weight%3D%22700%22%20font-size%3D%2224%22%20transform%3D%22translate(328.26%20521)%22%3EMgO%20(Passive%20Oxide%20Layer)%3C%2Ftext%3E%3Ctext%20font-family%3D%22Aptos%2CAptos_MSFontService%2CArial%22%20font-weight%3D%22700%22%20font-size%3D%2224%22%20transform%3D%22translate(360.197%20495)%22%3EAl(OH)%3C%2Ftext%3E%3Ctext%20font-family%3D%22Aptos%2CAptos_MSFontService%2CArial%22%20font-weight%3D%22700%22%20font-size%3D%2215%22%20transform%3D%22translate(431.364%20495)%22%3E3%3C%2Ftext%3E%3Ctext%20font-family%3D%22Aptos%2CAptos_MSFontService%2CArial%22%20font-weight%3D%22700%22%20font-size%3D%2224%22%20transform%3D%22translate(444.031%20495)%22%3E(Oxide%20Layer)%3C%2Ftext%3E%3Ctext%20font-family%3D%22Aptos%2CAptos_MSFontService%2CArial%22%20font-weight%3D%22700%22%20font-size%3D%2224%22%20transform%3D%22translate(368.914%20566)%22%3EMg%20Alloy%20Substrate%3C%2Ftext%3E%3Cpath%20d%3D%22M368%20403.5C368%20386.103%20382.103%20372%20399.5%20372%20416.897%20372%20431%20386.103%20431%20403.5%20431%20420.897%20416.897%20435%20399.5%20435%20382.103%20435%20368%20420.897%20368%20403.5Z%22%20fill%3D%22%23215F9A%22%20fill-rule%3D%22evenodd%22%2F%3E%3Ctext%20fill%3D%22%23FFFFFF%22%20font-family%3D%22Cambria%20Math%2CCambria%20Math_MSFontService%2CArial%22%20font-weight%3D%22400%22%20font-size%3D%2216%22%20transform%3D%22translate(380.849%20409)%22%3E%F0%9D%91%A8%F0%9D%92%8D%3C%2Ftext%3E%3Ctext%20fill%3D%22%23FFFFFF%22%20font-family%3D%22Cambria%20Math%2CCambria%20Math_MSFontService%2CArial%22%20font-weight%3D%22400%22%20font-size%3D%2216%22%20transform%3D%22translate(397.516%20409)%22%3E%F0%9D%91%B6%3C%2Ftext%3E%3Ctext%20fill%3D%22%23FFFFFF%22%20font-family%3D%22Cambria%20Math%2CCambria%20Math_MSFontService%2CArial%22%20font-weight%3D%22400%22%20font-size%3D%2212%22%20transform%3D%22translate(409.182%20413)%22%3E%F0%9D%9F%90%3C%2Ftext%3E%3Ctext%20fill%3D%22%23FFFFFF%22%20font-family%3D%22Cambria%20Math%2CCambria%20Math_MSFontService%2CArial%22%20font-weight%3D%22400%22%20font-size%3D%2212%22%20transform%3D%22translate(409.182%20402)%22%3E%E2%88%92%3C%2Ftext%3E%3Cpath%20d%3D%22M507%20403C507%20385.879%20521.103%20372%20538.5%20372%20555.897%20372%20570%20385.879%20570%20403%20570%20420.121%20555.897%20434%20538.5%20434%20521.103%20434%20507%20420.121%20507%20403Z%22%20fill%3D%22%23215F9A%22%20fill-rule%3D%22evenodd%22%2F%3E%3Ctext%20fill%3D%22%23FFFFFF%22%20font-family%3D%22Cambria%20Math%2CCambria%20Math_MSFontService%2CArial%22%20font-weight%3D%22400%22%20font-size%3D%2216%22%20transform%3D%22translate(519.975%20409)%22%3E%F0%9D%91%A8%F0%9D%92%8D%3C%2Ftext%3E%3Ctext%20fill%3D%22%23FFFFFF%22%20font-family%3D%22Cambria%20Math%2CCambria%20Math_MSFontService%2CArial%22%20font-weight%3D%22400%22%20font-size%3D%2216%22%20transform%3D%22translate(536.642%20409)%22%3E%F0%9D%91%B6%3C%2Ftext%3E%3Ctext%20fill%3D%22%23FFFFFF%22%20font-family%3D%22Cambria%20Math%2CCambria%20Math_MSFontService%2CArial%22%20font-weight%3D%22400%22%20font-size%3D%2212%22%20transform%3D%22translate(548.308%20412)%22%3E%F0%9D%9F%90%3C%2Ftext%3E%3Ctext%20fill%3D%22%23FFFFFF%22%20font-family%3D%22Cambria%20Math%2CCambria%20Math_MSFontService%2CArial%22%20font-weight%3D%22400%22%20font-size%3D%2212%22%20transform%3D%22translate(548.308%20402)%22%3E%E2%88%92%3C%2Ftext%3E%3Cpath%20d%3D%22M535%20443%20537%20443%20537%20422%20541%20422%20541%20443%20543%20443%20539%20447Z%22%20fill%3D%22%23FF0000%22%20fill-rule%3D%22evenodd%22%2F%3E%3Cpath%20d%3D%22M394%20442%20396%20442%20396%20422%20400%20422%20400%20442%20402%20442%20398%20446Z%22%20fill%3D%22%23FF0000%22%20fill-rule%3D%22evenodd%22%2F%3E%3Cpath%20d%3D%22M317.943%20472%20324.647%20489.733%20321.882%20491.825%20330.326%20507.02%20327.561%20509.558%20338%20535%20320.296%20515.502%20323.672%20512.795%20312.672%20500.306%20316.614%20496.448%20305%20483.346Z%22%20fill%3D%22%23FFFF00%22%20fill-rule%3D%22evenodd%22%2F%3E%3Cpath%20d%3D%22M608.59%20469%20614.075%20486.452%20611.812%20488.51%20618.721%20503.465%20616.459%20505.962%20625%20531%20610.515%20511.812%20613.278%20509.148%20604.278%20496.857%20607.503%20493.059%20598%20480.166Z%22%20fill%3D%22%23FFFF00%22%20fill-rule%3D%22evenodd%22%2F%3E%3Cpath%20d%3D%22M335%20394C335%20385.716%20342.163%20379%20351%20379%20359.837%20379%20367%20385.716%20367%20394%20367%20402.284%20359.837%20409%20351%20409%20342.163%20409%20335%20402.284%20335%20394Z%22%20fill%3D%22%23156082%22%20fill-rule%3D%22evenodd%22%2F%3E%3Cpath%20d%3D%22M347%20411.5%20348.75%20411.5%20348.75%20407%20352.25%20407%20352.25%20411.5%20354%20411.5%20350.5%20415Z%22%20fill%3D%22%23FF0000%22%20fill-rule%3D%22evenodd%22%2F%3E%3Ctext%20font-family%3D%22Cambria%20Math%2CCambria%20Math_MSFontService%2CArial%22%20font-weight%3D%22400%22%20font-size%3D%2216%22%20transform%3D%22translate(339.835%20398)%22%3E%F0%9D%91%B6%3C%2Ftext%3E%3Ctext%20font-family%3D%22Cambria%20Math%2CCambria%20Math_MSFontService%2CArial%22%20font-weight%3D%22400%22%20font-size%3D%2212%22%20transform%3D%22translate(351.501%20392)%22%3E%F0%9D%9F%90%3C%2Ftext%3E%3Ctext%20font-family%3D%22Cambria%20Math%2CCambria%20Math_MSFontService%2CArial%22%20font-weight%3D%22400%22%20font-size%3D%2212%22%20transform%3D%22translate(358.501%20392)%22%3E%E2%88%92%3C%2Ftext%3E%3Cpath%20d%3D%22M378%20457.5C378%20448.94%20385.163%20442%20394%20442%20402.837%20442%20410%20448.94%20410%20457.5%20410%20466.06%20402.837%20473%20394%20473%20385.163%20473%20378%20466.06%20378%20457.5Z%22%20fill%3D%22%23156082%22%20fill-rule%3D%22evenodd%22%2F%3E%3Cpath%20d%3D%22M392%20473.5%20393.75%20473.5%20393.75%20469%20397.25%20469%20397.25%20473.5%20399%20473.5%20395.5%20477Z%22%20fill%3D%22%23FF0000%22%20fill-rule%3D%22evenodd%22%2F%3E%3Ctext%20font-family%3D%22Cambria%20Math%2CCambria%20Math_MSFontService%2CArial%22%20font-weight%3D%22400%22%20font-size%3D%2216%22%20transform%3D%22translate(383.027%20464)%22%3E%F0%9D%91%B6%3C%2Ftext%3E%3Ctext%20font-family%3D%22Cambria%20Math%2CCambria%20Math_MSFontService%2CArial%22%20font-weight%3D%22400%22%20font-size%3D%2212%22%20transform%3D%22translate(394.693%20458)%22%3E%F0%9D%9F%90%3C%2Ftext%3E%3Ctext%20font-family%3D%22Cambria%20Math%2CCambria%20Math_MSFontService%2CArial%22%20font-weight%3D%22400%22%20font-size%3D%2212%22%20transform%3D%22translate(401.693%20458)%22%3E%E2%88%92%3C%2Ftext%3E%3Cpath%20d%3D%22M449%20392C449%20383.716%20455.94%20377%20464.5%20377%20473.06%20377%20480%20383.716%20480%20392%20480%20400.284%20473.06%20407%20464.5%20407%20455.94%20407%20449%20400.284%20449%20392Z%22%20fill%3D%22%23156082%22%20fill-rule%3D%22evenodd%22%2F%3E%3Cpath%20d%3D%22M462%20408.5%20463.75%20408.5%20463.75%20404%20467.25%20404%20467.25%20408.5%20469%20408.5%20465.5%20412Z%22%20fill%3D%22%23FF0000%22%20fill-rule%3D%22evenodd%22%2F%3E%3Ctext%20font-family%3D%22Cambria%20Math%2CCambria%20Math_MSFontService%2CArial%22%20font-weight%3D%22400%22%20font-size%3D%2216%22%20transform%3D%22translate(453.286%20398)%22%3E%F0%9D%91%B6%3C%2Ftext%3E%3Ctext%20font-family%3D%22Cambria%20Math%2CCambria%20Math_MSFontService%2CArial%22%20font-weight%3D%22400%22%20font-size%3D%2212%22%20transform%3D%22translate(464.952%20392)%22%3E%F0%9D%9F%90%3C%2Ftext%3E%3Ctext%20font-family%3D%22Cambria%20Math%2CCambria%20Math_MSFontService%2CArial%22%20font-weight%3D%22400%22%20font-size%3D%2212%22%20transform%3D%22translate(471.952%20392)%22%3E%E2%88%92%3C%2Ftext%3E%3Cpath%20d%3D%22M581%20393.5C581%20384.94%20587.94%20378%20596.5%20378%20605.06%20378%20612%20384.94%20612%20393.5%20612%20402.06%20605.06%20409%20596.5%20409%20587.94%20409%20581%20402.06%20581%20393.5Z%22%20fill%3D%22%23156082%22%20fill-rule%3D%22evenodd%22%2F%3E%3Cpath%20d%3D%22M594%20410.5%20595.75%20410.5%20595.75%20405%20599.25%20405%20599.25%20410.5%20601%20410.5%20597.5%20414Z%22%20fill%3D%22%23FF0000%22%20fill-rule%3D%22evenodd%22%2F%3E%3Ctext%20font-family%3D%22Cambria%20Math%2CCambria%20Math_MSFontService%2CArial%22%20font-weight%3D%22400%22%20font-size%3D%2216%22%20transform%3D%22translate(585.283%20400)%22%3E%F0%9D%91%B6%3C%2Ftext%3E%3Ctext%20font-family%3D%22Cambria%20Math%2CCambria%20Math_MSFontService%2CArial%22%20font-weight%3D%22400%22%20font-size%3D%2212%22%20transform%3D%22translate(596.949%20394)%22%3E%F0%9D%9F%90%3C%2Ftext%3E%3Ctext%20font-family%3D%22Cambria%20Math%2CCambria%20Math_MSFontService%2CArial%22%20font-weight%3D%22400%22%20font-size%3D%2212%22%20transform%3D%22translate(603.949%20394)%22%3E%E2%88%92%3C%2Ftext%3E%3Cpath%20d%3D%22M533%20458C533%20449.716%20540.163%20443%20549%20443%20557.837%20443%20565%20449.716%20565%20458%20565%20466.284%20557.837%20473%20549%20473%20540.163%20473%20533%20466.284%20533%20458Z%22%20fill%3D%22%23156082%22%20fill-rule%3D%22evenodd%22%2F%3E%3Cpath%20d%3D%22M547%20474.5%20548.75%20474.5%20548.75%20469%20552.25%20469%20552.25%20474.5%20554%20474.5%20550.5%20478Z%22%20fill%3D%22%23FF0000%22%20fill-rule%3D%22evenodd%22%2F%3E%3Ctext%20font-family%3D%22Cambria%20Math%2CCambria%20Math_MSFontService%2CArial%22%20font-weight%3D%22400%22%20font-size%3D%2216%22%20transform%3D%22translate(538.019%20464)%22%3E%F0%9D%91%B6%3C%2Ftext%3E%3Ctext%20font-family%3D%22Cambria%20Math%2CCambria%20Math_MSFontService%2CArial%22%20font-weight%3D%22400%22%20font-size%3D%2212%22%20transform%3D%22translate(549.685%20458)%22%3E%F0%9D%9F%90%3C%2Ftext%3E%3Ctext%20font-family%3D%22Cambria%20Math%2CCambria%20Math_MSFontService%2CArial%22%20font-weight%3D%22400%22%20font-size%3D%2212%22%20transform%3D%22translate(556.685%20458)%22%3E%E2%88%92%3C%2Ftext%3E%3Cuse%20width%3D%22100%25%22%20height%3D%22100%25%22%20xlink%3Ahref%3D%22%23img10%22%20fill%3D%22none%22%20transform%3D%22translate(637%20497)%22%2F%3E%3Cuse%20width%3D%22100%25%22%20height%3D%22100%25%22%20xlink%3Ahref%3D%22%23img11%22%20fill%3D%22none%22%20transform%3D%22translate(638%20465)%22%2F%3E%3Cuse%20width%3D%22100%25%22%20height%3D%22100%25%22%20xlink%3Ahref%3D%22%23img12%22%20fill%3D%22none%22%20transform%3D%22translate(637%20338)%22%2F%3E%3Cpath%20d%3D%22M674%20470.5C674%20453.103%20688.103%20439%20705.5%20439%20722.897%20439%20737%20453.103%20737%20470.5%20737%20487.897%20722.897%20502%20705.5%20502%20688.103%20502%20674%20487.897%20674%20470.5Z%22%20fill%3D%22%23215F9A%22%20fill-rule%3D%22evenodd%22%2F%3E%3Ctext%20fill%3D%22%23FFFFFF%22%20font-family%3D%22Cambria%20Math%2CCambria%20Math_MSFontService%2CArial%22%20font-weight%3D%22400%22%20font-size%3D%2216%22%20transform%3D%22translate(687.372%20476)%22%3E%F0%9D%91%A8%F0%9D%92%8D%3C%2Ftext%3E%3Ctext%20fill%3D%22%23FFFFFF%22%20font-family%3D%22Cambria%20Math%2CCambria%20Math_MSFontService%2CArial%22%20font-weight%3D%22400%22%20font-size%3D%2216%22%20transform%3D%22translate(704.038%20476)%22%3E%F0%9D%91%B6%3C%2Ftext%3E%3Ctext%20fill%3D%22%23FFFFFF%22%20font-family%3D%22Cambria%20Math%2CCambria%20Math_MSFontService%2CArial%22%20font-weight%3D%22400%22%20font-size%3D%2212%22%20transform%3D%22translate(715.705%20480)%22%3E%F0%9D%9F%90%3C%2Ftext%3E%3Ctext%20fill%3D%22%23FFFFFF%22%20font-family%3D%22Cambria%20Math%2CCambria%20Math_MSFontService%2CArial%22%20font-weight%3D%22400%22%20font-size%3D%2212%22%20transform%3D%22translate(715.705%20469)%22%3E%E2%88%92%3C%2Ftext%3E%3Cpath%20d%3D%22M798%20471C798%20453.879%20812.103%20440%20829.5%20440%20846.897%20440%20861%20453.879%20861%20471%20861%20488.121%20846.897%20502%20829.5%20502%20812.103%20502%20798%20488.121%20798%20471Z%22%20fill%3D%22%23215F9A%22%20fill-rule%3D%22evenodd%22%2F%3E%3Ctext%20fill%3D%22%23FFFFFF%22%20font-family%3D%22Cambria%20Math%2CCambria%20Math_MSFontService%2CArial%22%20font-weight%3D%22400%22%20font-size%3D%2216%22%20transform%3D%22translate(810.442%20476)%22%3E%F0%9D%91%A8%F0%9D%92%8D%3C%2Ftext%3E%3Ctext%20fill%3D%22%23FFFFFF%22%20font-family%3D%22Cambria%20Math%2CCambria%20Math_MSFontService%2CArial%22%20font-weight%3D%22400%22%20font-size%3D%2216%22%20transform%3D%22translate(827.109%20476)%22%3E%F0%9D%91%B6%3C%2Ftext%3E%3Ctext%20fill%3D%22%23FFFFFF%22%20font-family%3D%22Cambria%20Math%2CCambria%20Math_MSFontService%2CArial%22%20font-weight%3D%22400%22%20font-size%3D%2212%22%20transform%3D%22translate(838.775%20480)%22%3E%F0%9D%9F%90%3C%2Ftext%3E%3Ctext%20fill%3D%22%23FFFFFF%22%20font-family%3D%22Cambria%20Math%2CCambria%20Math_MSFontService%2CArial%22%20font-weight%3D%22400%22%20font-size%3D%2212%22%20transform%3D%22translate(838.775%20470)%22%3E%E2%88%92%3C%2Ftext%3E%3Cpath%20d%3D%22M926%20470C926%20452.879%20940.103%20439%20957.5%20439%20974.897%20439%20989%20452.879%20989%20470%20989%20487.121%20974.897%20501%20957.5%20501%20940.103%20501%20926%20487.121%20926%20470Z%22%20fill%3D%22%23215F9A%22%20fill-rule%3D%22evenodd%22%2F%3E%3Ctext%20fill%3D%22%23FFFFFF%22%20font-family%3D%22Cambria%20Math%2CCambria%20Math_MSFontService%2CArial%22%20font-weight%3D%22400%22%20font-size%3D%2216%22%20transform%3D%22translate(940.324%20476)%22%3E%F0%9D%91%A8%F0%9D%92%8D%3C%2Ftext%3E%3Ctext%20fill%3D%22%23FFFFFF%22%20font-family%3D%22Cambria%20Math%2CCambria%20Math_MSFontService%2CArial%22%20font-weight%3D%22400%22%20font-size%3D%2216%22%20transform%3D%22translate(956.991%20476)%22%3E%F0%9D%91%B6%3C%2Ftext%3E%3Ctext%20fill%3D%22%23FFFFFF%22%20font-family%3D%22Cambria%20Math%2CCambria%20Math_MSFontService%2CArial%22%20font-weight%3D%22400%22%20font-size%3D%2212%22%20transform%3D%22translate(968.658%20480)%22%3E%F0%9D%9F%90%3C%2Ftext%3E%3Ctext%20fill%3D%22%23FFFFFF%22%20font-family%3D%22Cambria%20Math%2CCambria%20Math_MSFontService%2CArial%22%20font-weight%3D%22400%22%20font-size%3D%2212%22%20transform%3D%22translate(968.658%20470)%22%3E%E2%88%92%3C%2Ftext%3E%3Cpath%20d%3D%22M807%20501.29%20808.848%20498.121%20808.188%20494.169%20811.152%20494.169%20813%20491%20814.848%20494.169%20817.812%20494.169%20817.152%20498.121%20819%20501.29%20816.33%20503.048%20815.67%20507%20813%20505.241%20810.33%20507%20809.67%20503.048Z%22%20stroke%3D%22%23FFC000%22%20stroke-width%3D%222%22%20stroke-miterlimit%3D%228%22%20fill%3D%22%23FFFF00%22%20fill-rule%3D%22evenodd%22%2F%3E%3Cpath%20d%3D%22M823%20506.647%20824.848%20503.676%20824.188%20499.971%20827.152%20499.971%20829%20497%20830.848%20499.971%20833.812%20499.971%20833.152%20503.676%20835%20506.647%20832.33%20508.295%20831.67%20512%20829%20510.351%20826.33%20512%20825.67%20508.295Z%22%20stroke%3D%22%23FFC000%22%20stroke-width%3D%222%22%20stroke-miterlimit%3D%228%22%20fill%3D%22%23FFFF00%22%20fill-rule%3D%22evenodd%22%2F%3E%3Cpath%20d%3D%22M838%20502.647%20839.848%20499.676%20839.188%20495.971%20842.152%20495.971%20844%20493%20845.848%20495.971%20848.812%20495.971%20848.152%20499.676%20850%20502.647%20847.33%20504.295%20846.67%20508%20844%20506.351%20841.33%20508%20840.67%20504.295Z%22%20stroke%3D%22%23FFC000%22%20stroke-width%3D%222%22%20stroke-miterlimit%3D%228%22%20fill%3D%22%23FFFF00%22%20fill-rule%3D%22evenodd%22%2F%3E%3Cpath%20d%3D%22M0.580623-0.814173%2015.2377%209.63847%2014.0765%2011.2668-0.580623%200.814173ZM15.894%206.42179%2020.0849%2014.3235%2011.2491%2012.9352Z%22%20fill%3D%22%23FF0000%22%20transform%3D%22matrix(1%200%200%20-1%20849%20498.323)%22%2F%3E%3Cpath%20d%3D%22M807.128%20499.074%20792.075%20489.437%20793.154%20487.753%20808.206%20497.39ZM791.581%20492.682%20787%20485%20795.894%20485.945Z%22%20fill%3D%22%23FF0000%22%2F%3E%3Cpath%20d%3D%22M867%20476C867%20469.373%20872.596%20464%20879.5%20464%20886.404%20464%20892%20469.373%20892%20476%20892%20482.627%20886.404%20488%20879.5%20488%20872.596%20488%20867%20482.627%20867%20476Z%22%20fill%3D%22%2300B050%22%20fill-rule%3D%22evenodd%22%2F%3E%3Ctext%20font-family%3D%22Cambria%20Math%2CCambria%20Math_MSFontService%2CArial%22%20font-weight%3D%22400%22%20font-size%3D%2216%22%20transform%3D%22translate(870.787%20480)%22%3E%F0%9D%91%B6%3C%2Ftext%3E%3Ctext%20font-family%3D%22Cambria%20Math%2CCambria%20Math_MSFontService%2CArial%22%20font-weight%3D%22400%22%20font-size%3D%2212%22%20transform%3D%22translate(882.453%20483)%22%3E%F0%9D%9F%90%3C%2Ftext%3E%3Cpath%20d%3D%22M770%20476C770%20469.373%20775.596%20464%20782.5%20464%20789.404%20464%20795%20469.373%20795%20476%20795%20482.627%20789.404%20488%20782.5%20488%20775.596%20488%20770%20482.627%20770%20476Z%22%20fill%3D%22%2300B050%22%20fill-rule%3D%22evenodd%22%2F%3E%3Ctext%20font-family%3D%22Cambria%20Math%2CCambria%20Math_MSFontService%2CArial%22%20font-weight%3D%22400%22%20font-size%3D%2216%22%20transform%3D%22translate(773.609%20479)%22%3E%F0%9D%91%B6%3C%2Ftext%3E%3Ctext%20font-family%3D%22Cambria%20Math%2CCambria%20Math_MSFontService%2CArial%22%20font-weight%3D%22400%22%20font-size%3D%2212%22%20transform%3D%22translate(785.276%20483)%22%3E%F0%9D%9F%90%3C%2Ftext%3E%3Ctext%20font-family%3D%22Aptos%2CAptos_MSFontService%2CArial%22%20font-weight%3D%22700%22%20font-size%3D%2224%22%20transform%3D%22translate(740.85%20568)%22%3EMg%20Alloy%20Substrate%3C%2Ftext%3E%3Cpath%20d%3D%22M726%20408C726%20390.879%20740.103%20377%20757.5%20377%20774.897%20377%20789%20390.879%20789%20408%20789%20425.121%20774.897%20439%20757.5%20439%20740.103%20439%20726%20425.121%20726%20408Z%22%20fill%3D%22%23215F9A%22%20fill-rule%3D%22evenodd%22%2F%3E%3Ctext%20fill%3D%22%23FFFFFF%22%20font-family%3D%22Cambria%20Math%2CCambria%20Math_MSFontService%2CArial%22%20font-weight%3D%22400%22%20font-size%3D%2216%22%20transform%3D%22translate(738.753%20413)%22%3E%F0%9D%91%A8%F0%9D%92%8D%3C%2Ftext%3E%3Ctext%20fill%3D%22%23FFFFFF%22%20font-family%3D%22Cambria%20Math%2CCambria%20Math_MSFontService%2CArial%22%20font-weight%3D%22400%22%20font-size%3D%2216%22%20transform%3D%22translate(755.419%20413)%22%3E%F0%9D%91%B6%3C%2Ftext%3E%3Ctext%20fill%3D%22%23FFFFFF%22%20font-family%3D%22Cambria%20Math%2CCambria%20Math_MSFontService%2CArial%22%20font-weight%3D%22400%22%20font-size%3D%2212%22%20transform%3D%22translate(767.086%20417)%22%3E%F0%9D%9F%90%3C%2Ftext%3E%3Ctext%20fill%3D%22%23FFFFFF%22%20font-family%3D%22Cambria%20Math%2CCambria%20Math_MSFontService%2CArial%22%20font-weight%3D%22400%22%20font-size%3D%2212%22%20transform%3D%22translate(767.086%20407)%22%3E%E2%88%92%3C%2Ftext%3E%3Cpath%20d%3D%22M865%20407.5C865%20390.103%20879.103%20376%20896.5%20376%20913.897%20376%20928%20390.103%20928%20407.5%20928%20424.897%20913.897%20439%20896.5%20439%20879.103%20439%20865%20424.897%20865%20407.5Z%22%20fill%3D%22%23215F9A%22%20fill-rule%3D%22evenodd%22%2F%3E%3Ctext%20fill%3D%22%23FFFFFF%22%20font-family%3D%22Cambria%20Math%2CCambria%20Math_MSFontService%2CArial%22%20font-weight%3D%22400%22%20font-size%3D%2216%22%20transform%3D%22translate(877.879%20413)%22%3E%F0%9D%91%A8%F0%9D%92%8D%3C%2Ftext%3E%3Ctext%20fill%3D%22%23FFFFFF%22%20font-family%3D%22Cambria%20Math%2CCambria%20Math_MSFontService%2CArial%22%20font-weight%3D%22400%22%20font-size%3D%2216%22%20transform%3D%22translate(894.545%20413)%22%3E%F0%9D%91%B6%3C%2Ftext%3E%3Ctext%20fill%3D%22%23FFFFFF%22%20font-family%3D%22Cambria%20Math%2CCambria%20Math_MSFontService%2CArial%22%20font-weight%3D%22400%22%20font-size%3D%2212%22%20transform%3D%22translate(906.212%20417)%22%3E%F0%9D%9F%90%3C%2Ftext%3E%3Ctext%20fill%3D%22%23FFFFFF%22%20font-family%3D%22Cambria%20Math%2CCambria%20Math_MSFontService%2CArial%22%20font-weight%3D%22400%22%20font-size%3D%2212%22%20transform%3D%22translate(906.212%20406)%22%3E%E2%88%92%3C%2Ftext%3E%3Cpath%20d%3D%22M893%20447.5%20894.75%20447.5%20894.75%20427%20898.25%20427%20898.25%20447.5%20900%20447.5%20896.5%20451Z%22%20fill%3D%22%23FF0000%22%20fill-rule%3D%22evenodd%22%2F%3E%3Cpath%20d%3D%22M752%20446%20754%20446%20754%20426%20758%20426%20758%20446%20760%20446%20756%20450Z%22%20fill%3D%22%23FF0000%22%20fill-rule%3D%22evenodd%22%2F%3E%3Ctext%20font-family%3D%22Aptos%2CAptos_MSFontService%2CArial%22%20font-weight%3D%22700%22%20font-size%3D%2224%22%20transform%3D%22translate(692.928%20531)%22%3EMgAl%3C%2Ftext%3E%3Ctext%20font-family%3D%22Aptos%2CAptos_MSFontService%2CArial%22%20font-weight%3D%22700%22%20font-size%3D%2215%22%20transform%3D%22translate(746.928%20531)%22%3E2%3C%2Ftext%3E%3Ctext%20font-family%3D%22Aptos%2CAptos_MSFontService%2CArial%22%20font-weight%3D%22700%22%20font-size%3D%2224%22%20transform%3D%22translate(754.761%20531)%22%3EO%3C%2Ftext%3E%3Ctext%20font-family%3D%22Aptos%2CAptos_MSFontService%2CArial%22%20font-weight%3D%22700%22%20font-size%3D%2215%22%20transform%3D%22translate(772.428%20531)%22%3E4%3C%2Ftext%3E%3Ctext%20font-family%3D%22Aptos%2CAptos_MSFontService%2CArial%22%20font-weight%3D%22700%22%20font-size%3D%2224%22%20transform%3D%22translate(780.261%20531)%22%3E-%3C%2Ftext%3E%3Ctext%20font-family%3D%22Aptos%2CAptos_MSFontService%2CArial%22%20font-weight%3D%22700%22%20font-size%3D%2224%22%20transform%3D%22translate(788.428%20531)%22%3EMgO(Oxide%20Layer)%3C%2Ftext%3E%3Cpath%20d%3D%22M683%20420C683%20411.716%20690.163%20405%20699%20405%20707.837%20405%20715%20411.716%20715%20420%20715%20428.284%20707.837%20435%20699%20435%20690.163%20435%20683%20428.284%20683%20420Z%22%20fill%3D%22%23156082%22%20fill-rule%3D%22evenodd%22%2F%3E%3Cpath%20d%3D%22M698%20437%20699.5%20437%20699.5%20432%20702.5%20432%20702.5%20437%20704%20437%20701%20440Z%22%20fill%3D%22%23FF0000%22%20fill-rule%3D%22evenodd%22%2F%3E%3Ctext%20font-family%3D%22Cambria%20Math%2CCambria%20Math_MSFontService%2CArial%22%20font-weight%3D%22400%22%20font-size%3D%2216%22%20transform%3D%22translate(687.492%20427)%22%3E%F0%9D%91%B6%3C%2Ftext%3E%3Ctext%20font-family%3D%22Cambria%20Math%2CCambria%20Math_MSFontService%2CArial%22%20font-weight%3D%22400%22%20font-size%3D%2212%22%20transform%3D%22translate(699.159%20421)%22%3E%F0%9D%9F%90%3C%2Ftext%3E%3Ctext%20font-family%3D%22Cambria%20Math%2CCambria%20Math_MSFontService%2CArial%22%20font-weight%3D%22400%22%20font-size%3D%2212%22%20transform%3D%22translate(706.159%20421)%22%3E%E2%88%92%3C%2Ftext%3E%3Cpath%20d%3D%22M804%20399.5C804%20390.94%20810.94%20384%20819.5%20384%20828.06%20384%20835%20390.94%20835%20399.5%20835%20408.06%20828.06%20415%20819.5%20415%20810.94%20415%20804%20408.06%20804%20399.5Z%22%20fill%3D%22%23156082%22%20fill-rule%3D%22evenodd%22%2F%3E%3Cpath%20d%3D%22M817%20415.5%20818.75%20415.5%20818.75%20411%20822.25%20411%20822.25%20415.5%20824%20415.5%20820.5%20419Z%22%20fill%3D%22%23FF0000%22%20fill-rule%3D%22evenodd%22%2F%3E%3Ctext%20font-family%3D%22Cambria%20Math%2CCambria%20Math_MSFontService%2CArial%22%20font-weight%3D%22400%22%20font-size%3D%2216%22%20transform%3D%22translate(808.325%20406)%22%3E%F0%9D%91%B6%3C%2Ftext%3E%3Ctext%20font-family%3D%22Cambria%20Math%2CCambria%20Math_MSFontService%2CArial%22%20font-weight%3D%22400%22%20font-size%3D%2212%22%20transform%3D%22translate(819.992%20400)%22%3E%F0%9D%9F%90%3C%2Ftext%3E%3Ctext%20font-family%3D%22Cambria%20Math%2CCambria%20Math_MSFontService%2CArial%22%20font-weight%3D%22400%22%20font-size%3D%2212%22%20transform%3D%22translate(826.992%20400)%22%3E%E2%88%92%3C%2Ftext%3E%3Cpath%20d%3D%22M941%20399C941%20390.716%20948.163%20384%20957%20384%20965.837%20384%20973%20390.716%20973%20399%20973%20407.284%20965.837%20414%20957%20414%20948.163%20414%20941%20407.284%20941%20399Z%22%20fill%3D%22%23156082%22%20fill-rule%3D%22evenodd%22%2F%3E%3Cpath%20d%3D%22M955%20416%20956.5%20416%20956.5%20411%20959.5%20411%20959.5%20416%20961%20416%20958%20419Z%22%20fill%3D%22%23FF0000%22%20fill-rule%3D%22evenodd%22%2F%3E%3Ctext%20font-family%3D%22Cambria%20Math%2CCambria%20Math_MSFontService%2CArial%22%20font-weight%3D%22400%22%20font-size%3D%2216%22%20transform%3D%22translate(945.668%20405)%22%3E%F0%9D%91%B6%3C%2Ftext%3E%3Ctext%20font-family%3D%22Cambria%20Math%2CCambria%20Math_MSFontService%2CArial%22%20font-weight%3D%22400%22%20font-size%3D%2212%22%20transform%3D%22translate(957.335%20399)%22%3E%F0%9D%9F%90%3C%2Ftext%3E%3Ctext%20font-family%3D%22Cambria%20Math%2CCambria%20Math_MSFontService%2CArial%22%20font-weight%3D%22400%22%20font-size%3D%2212%22%20transform%3D%22translate(964.335%20399)%22%3E%E2%88%92%3C%2Ftext%3E%3Cpath%20d%3D%22M677%20502C677.926%20502.515%20677.881%20502.537%20678.994%20502.923%20679.486%20503.094%20679.991%20503.231%20680.489%20503.385%20680.655%20503.436%20680.818%20503.499%20680.987%20503.538%20681.209%20503.59%20681.435%20503.625%20681.652%20503.692%20683.966%20504.407%20682.15%20503.961%20683.646%20504.308%20684.103%20504.255%20684.961%20504.237%20685.473%20504%20685.652%20503.917%20685.806%20503.795%20685.972%20503.692%20687.834%20504.842%20686.475%20503.952%20689.129%20506%20689.16%20506.024%20690.469%20507.005%20690.624%20507.077L691.621%20507.538%20697.27%20507.231C697.66%20507.204%20698.058%20507.184%20698.433%20507.077%20698.788%20506.976%20699.077%20506.724%20699.43%20506.615%20699.749%20506.517%20700.095%20506.52%20700.426%20506.462%20703.815%20505.864%20701.861%20506.089%20704.746%20505.846%20707.46%20506%20710.184%20506.035%20712.887%20506.308%20713.256%20506.345%20713.537%20506.646%20713.884%20506.769%20716.84%20507.822%20712.756%20505.92%20716.875%20508%20718.536%20507.744%20720.237%20507.65%20721.859%20507.231%20722.647%20507.027%20723.288%20506.492%20724.019%20506.154%20724.396%20505.979%20724.805%20505.867%20725.182%20505.692%20729.515%20503.686%20723.889%20506.118%20726.511%20505.077%20726.739%20504.987%20726.933%20504.817%20727.176%20504.769%20727.72%20504.661%20728.284%20504.672%20728.837%20504.615%20730.083%20504.487%20730.041%20504.481%20731.163%20504.308%20731.661%20504.103%20732.155%20503.887%20732.658%20503.692%20734.601%20502.943%20738.079%20503.665%20739.138%20503.692%20739.526%20503.744%20739.917%20503.775%20740.301%20503.846%20740.473%20503.878%20740.628%20503.965%20740.799%20504%20742.145%20504.277%20741.854%20504.004%20743.458%20504.615%20745.853%20505.529%20743.396%20505.069%20745.784%20505.385%20746.116%20505.487%20746.437%20505.629%20746.781%20505.692%20747.272%20505.783%20747.778%20505.792%20748.276%20505.846L749.605%20506C749.993%20506.103%20750.372%20506.239%20750.768%20506.308%20751.261%20506.393%20751.765%20506.407%20752.263%20506.462L753.593%20506.615C756.021%20506.865%20758.465%20506.951%20760.903%20507.077%20761.291%20507.128%20761.676%20507.196%20762.066%20507.231%20762.84%20507.299%20763.623%20507.278%20764.392%20507.385%20764.738%20507.433%20765.042%20507.646%20765.389%20507.692%20766.213%20507.801%20767.05%20507.795%20767.881%20507.846%20768.989%20507.795%20770.104%20507.825%20771.204%20507.692%20771.402%20507.668%20771.524%20507.467%20771.702%20507.385%20771.859%20507.312%20772.034%20507.282%20772.201%20507.231%20772.538%20506.606%20772.627%20506.345%20773.031%20505.846%20773.244%20505.583%20773.423%20505.287%20773.696%20505.077%20774.428%20504.512%20775.088%20503.711%20776.022%20503.538L776.853%20503.385C777.13%20503.282%20777.401%20503.164%20777.683%20503.077%20779.31%20502.575%20781.8%20502.923%20783%20502.923%22%20fill%3D%22%23A6CAEC%22%20fill-rule%3D%22evenodd%22%2F%3E%3Cpath%20d%3D%22M864%20500C864.876%20501.756%20865.199%20502.928%20867.791%20503.577L870.466%20504.248C872.027%20504.173%20873.606%20504.272%20875.149%20504.024%20875.516%20503.966%20875.709%20503.52%20876.041%20503.354%20876.315%20503.216%20876.638%20503.214%20876.933%20503.13%20877.159%20503.065%20877.377%20502.974%20877.602%20502.906%20878.12%20502.751%20878.645%20502.615%20879.163%20502.459%20879.388%20502.392%20879.622%20502.341%20879.832%20502.236%20880.22%20502.041%20880.575%20501.789%20880.947%20501.565%20882.508%20501.714%20884.15%20501.491%20885.629%20502.012%20886.991%20502.492%20889.197%20504.471%20889.197%20504.471%20889.346%20504.695%20889.454%20504.952%20889.643%20505.142%20890.81%20506.313%20892.559%20506.449%20894.103%20506.707L899.455%20506.484C900.422%20506.431%20901.387%20506.327%20902.353%20506.26L905.921%20506.037%20918.854%20506.484C920.147%20506.544%20920%20506.578%20920.861%20507.154%20921.53%20507.005%20922.31%20507.107%20922.868%20506.707%20923.439%20506.299%20923.382%20505.28%20923.983%20504.919%20924.354%20504.695%20924.732%20504.481%20925.098%20504.248%20925.55%20503.959%20925.956%20503.594%20926.436%20503.354%20926.71%20503.216%20927.03%20503.205%20927.328%20503.13%20931.422%20504.042%20927.089%20502.954%20932.01%20504.695%20933.629%20505.268%20935.271%20505.771%20936.916%20506.26%20938.428%20506.709%20941.344%20506.658%20942.268%20506.707L961.667%20506.484C970.921%20506.484%20968.656%20506.236%20974.154%20507.154%20974.377%20507.378%20974.51%20507.788%20974.823%20507.825%20977.989%20508.198%20977.227%20508.007%20978.837%20506.931%20979.198%20506.69%20979.605%20506.521%20979.952%20506.26%20980.204%20506.07%20980.339%20505.731%20980.621%20505.589%20981.252%20505.273%20981.959%20505.142%20982.628%20504.919L983.297%20504.695C983.52%20504.36%20984.022%20503.51%20984.412%20503.354%20984.9%20503.158%20985.452%20503.205%20985.973%20503.13%20986.196%20503.056%20986.421%20502.987%20986.641%20502.906%20987.238%20502.689%20987.818%20502.423%20988.425%20502.236%20988.788%20502.124%20989.162%20502.027%20989.54%20502.012%20991.026%20501.953%20992.513%20502.012%20994%20502.012%22%20fill%3D%22%23A6CAEC%22%20fill-rule%3D%22evenodd%22%2F%3E%3Cpath%20d%3D%22M776%20510C776%20507.239%20779.134%20505%20783%20505%20786.866%20505%20790%20507.239%20790%20510%20790%20512.761%20786.866%20515%20783%20515%20779.134%20515%20776%20512.761%20776%20510Z%22%20fill%3D%22%23D9D9D9%22%20fill-rule%3D%22evenodd%22%2F%3E%3Cpath%20d%3D%22M938%20513C938%20510.239%20941.134%20508%20945%20508%20948.866%20508%20952%20510.239%20952%20513%20952%20515.761%20948.866%20518%20945%20518%20941.134%20518%20938%20515.761%20938%20513Z%22%20fill%3D%22%23D9D9D9%22%20fill-rule%3D%22evenodd%22%2F%3E%3Cpath%20d%3D%22M873%20508C873%20505.791%20876.358%20504%20880.5%20504%20884.642%20504%20888%20505.791%20888%20508%20888%20510.209%20884.642%20512%20880.5%20512%20876.358%20512%20873%20510.209%20873%20508Z%22%20fill%3D%22%23D9D9D9%22%20fill-rule%3D%22evenodd%22%2F%3E%3Cpath%20d%3D%22M679%20513C679%20510.791%20682.358%20509%20686.5%20509%20690.642%20509%20694%20510.791%20694%20513%20694%20515.209%20690.642%20517%20686.5%20517%20682.358%20517%20679%20515.209%20679%20513Z%22%20fill%3D%22%23D9D9D9%22%20fill-rule%3D%22evenodd%22%2F%3E%3Cpath%20d%3D%22M725%20509C725%20506.791%20728.358%20505%20732.5%20505%20736.642%20505%20740%20506.791%20740%20509%20740%20511.209%20736.642%20513%20732.5%20513%20728.358%20513%20725%20511.209%20725%20509Z%22%20fill%3D%22%23D9D9D9%22%20fill-rule%3D%22evenodd%22%2F%3E%3Cpath%20d%3D%22M846%20509C846%20506.239%20849.134%20504%20853%20504%20856.866%20504%20860%20506.239%20860%20509%20860%20511.761%20856.866%20514%20853%20514%20849.134%20514%20846%20511.761%20846%20509Z%22%20fill%3D%22%23D9D9D9%22%20fill-rule%3D%22evenodd%22%2F%3E%3Cpath%20d%3D%22M805%20512C805%20509.239%20808.358%20507%20812.5%20507%20816.642%20507%20820%20509.239%20820%20512%20820%20514.761%20816.642%20517%20812.5%20517%20808.358%20517%20805%20514.761%20805%20512Z%22%20fill%3D%22%23D9D9D9%22%20fill-rule%3D%22evenodd%22%2F%3E%3Cpath%20d%3D%22M903%20511C903%20508.239%20906.358%20506%20910.5%20506%20914.642%20506%20918%20508.239%20918%20511%20918%20513.761%20914.642%20516%20910.5%20516%20906.358%20516%20903%20513.761%20903%20511Z%22%20fill%3D%22%23D9D9D9%22%20fill-rule%3D%22evenodd%22%2F%3E%3Cpath%20d%3D%22M0.552048-0.833812%2012.454%207.04618%2011.3499%208.71381-0.552048%200.833812ZM12.9984%203.80868%2017.4607%2011.5603%208.58199%2010.4792Z%22%20fill%3D%22%23FF0000%22%20transform%3D%22matrix(1%200%200%20-1%20732%20504.56)%22%2F%3E%3Ctext%20font-family%3D%22Aptos%2CAptos_MSFontService%2CArial%22%20font-weight%3D%22700%22%20font-size%3D%2216%22%20transform%3D%22translate(750.435%20500)%22%3EPore%3C%2Ftext%3E%3Ctext%20fill%3D%22%23FFFFFF%22%20font-family%3D%22Aptos%2CAptos_MSFontService%2CArial%22%20font-weight%3D%22700%22%20font-size%3D%2224%22%20transform%3D%22translate(309.938%20139)%22%3E(a)%3C%2Ftext%3E%3Ctext%20fill%3D%22%23FFFFFF%22%20font-family%3D%22Aptos%2CAptos_MSFontService%2CArial%22%20font-weight%3D%22700%22%20font-size%3D%2224%22%20transform%3D%22translate(671.72%20138)%22%3E(b)%3C%2Ftext%3E%3Ctext%20fill%3D%22%23FFFFFF%22%20font-family%3D%22Aptos%2CAptos_MSFontService%2CArial%22%20font-weight%3D%22700%22%20font-size%3D%2224%22%20transform%3D%22translate(312.474%20392)%22%3E(c)%3C%2Ftext%3E%3Ctext%20fill%3D%22%23FFFFFF%22%20font-family%3D%22Aptos%2CAptos_MSFontService%2CArial%22%20font-weight%3D%22700%22%20font-size%3D%2224%22%20transform%3D%22translate(677.217%20396)%22%3E(d)%3C%2Ftext%3E%3C%2Fg%3E%3C%2Fsvg%3E)
Figure 6. Schematic illustration of the aluminate-based PEO coating on AE44: (a) The system before applying current; (b) dissolution of magnesium into the electrolyte, migration of AlO2− anions towards the anode after applying current and formation of MgO passive oxide layer; (c) formation of Al(OH)3 film on the AE44 surface and the initiation of plasma discharge sparks; (d) growth of the MgAl2O4-MgO composite ceramic coating.
3.5. Potentiodynamic Polarization Tests
Figure 7 presents the polarization curves of the substrate (Mg alloy AE44, Curve 1) and the coated specimens prepared under different electrical conditions. The coating from Experiment 1 (Curve 2), produced with a shorter treatment duration, lower current density, and voltage, but a higher duty cycle, exhibited a more negative corrosion potential (−1.4158 V) compared with the substrate (−1.3668 V). In contrast, the coating from Experiment 2 (Curve 3), obtained under longer duration, higher current density, and voltage, but lower duty cycle, showed a corrosion potential of −1.3918 V. Although the corrosion current density of the coating from Experiment 1 (3.93302 × 10⁻⁶ A/cm2) was reduced to less than half that of the substrate (8.62168 × 10⁻⁶ A/cm2), its corrosion potential remained 49 mV lower than that of the substrate. The data presented in Table 3 implied that the coating of Experiment 1 produced under these conditions was relatively thin and incapable of being developed into a compact and protective oxide film.
Table 3. Results of the potentiodynamic corrosion tests in 3.5 wt% NaCl solutions.
|
Samples |
ba (V/Decade) |
bc (V/Decade) |
icorr (μA/cm2) |
Ecorr (V) |
Rp (kΩ/cm2) |
|---|---|---|---|---|---|
|
AE44 |
0.02867 |
0.11692 |
8.62919 |
−1.3668 |
1.161 |
|
Experiment 1 |
0.10567 |
0.09012 |
3.93302 |
−1.4158 |
5.377 |
|
Experiment 2 |
0.23177 |
0.12774 |
3.71510 |
−1.3918 |
9.638 |
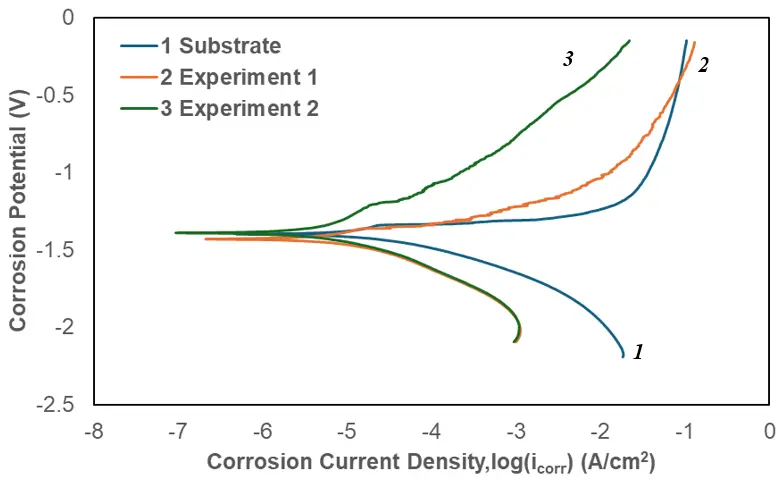
Figure 7. Potentiodynamic polarization curves of the substrate, coating from Experiment 1, and coatings from Experiment 2.
The corrosion potentials, corrosion current density, and anodic/cathodic Tafel slopes (ba and bc) were derived from the test data given in Figure 7. Based on the approximate linear polarization at the corrosion potential (Ecorr), polarization resistance (Rp) values were determined by Equation (1).
A summary of the potentiodynamic corrosion test results is presented in Table 3. The displayed data manifested that the corrosion resistance of the coated Mg alloy AE44 was significantly improved. Both coated samples exhibited lower corrosion current densities and higher polarization resistances compared with the uncoated substrate. Among them, the coating produced under longer treatment durations, higher current densities and voltages, but lower duty cycles, demonstrated the most pronounced enhancement in corrosion resistance. Relative to the AE44 substrate, the coating from Experiment 2 showed approximately an eightfold increase in corrosion resistance, corresponding to an improvement of 8.477 kΩ·cm2, while its corrosion current density was reduced by nearly half (Table 3).
Large corrosion craters were observed on the uncoated magnesium surface after the corrosion test. This degradation should be attributed to the breakdown of the thin, naturally formed magnesium hydroxide film, which serves as the primary protective barrier on the bare magnesium substrate [20,22]. Furthermore, it was observed that, under comparable efficiency conditions, coatings produced at higher voltages exhibited superior corrosion resistance compared with those obtained at lower voltages.
3.6. Electrochemical Impedance Tests
To elucidate the corrosion behavior of the oxide films generated in the two experimental conditions, electrochemical impedance spectroscopy (EIS) measurements were conducted during immersion of the two PEO coated samples in a 3.5 wt% NaCl solution at room temperature. The corresponding Nyquist plots are presented in Figure 8.
%22%20transform%3D%22translate(-382%20-70)%22%3E%3Cg%3E%3Crect%20x%3D%22472.5%22%20y%3D%2298.5001%22%20width%3D%22353%22%20height%3D%22315%22%20stroke%3D%22%23000000%22%20stroke-linejoin%3D%22round%22%20stroke-miterlimit%3D%2210%22%20fill%3D%22none%22%2F%3E%3C%2Fg%3E%3Cg%3E%3Cpath%20d%3D%22M0%200%200.000104987%20315%22%20stroke%3D%22%23000000%22%20stroke-linejoin%3D%22round%22%20stroke-miterlimit%3D%2210%22%20fill%3D%22none%22%20fill-rule%3D%22evenodd%22%20transform%3D%22matrix(1%200%200%20-1%20472.5%20413.5)%22%2F%3E%3C%2Fg%3E%3Cg%3E%3Cpath%20d%3D%22M472.5%20413.5%20825.5%20413.5%22%20stroke%3D%22%23000000%22%20stroke-linejoin%3D%22round%22%20stroke-miterlimit%3D%2210%22%20fill%3D%22none%22%20fill-rule%3D%22evenodd%22%2F%3E%3C%2Fg%3E%3Cg%3E%3Cpath%20d%3D%22M480%20409C480.029%20408.587%20480.05%20408.227%20480.087%20407.762%20480.125%20407.297%20480.166%20406.791%20480.226%20406.208%20480.285%20405.624%20480.35%20404.992%20480.444%20404.261%20480.538%20403.53%20480.641%20402.735%20480.788%20401.822%20480.936%20400.908%20481.098%20399.917%20481.33%20398.781%20481.561%20397.645%20481.815%20396.411%20482.177%20395.005%20482.538%20393.599%20482.939%20392.065%20483.496%20390.346%20484.053%20388.627%20484.674%20386.755%20485.521%20384.69%20486.368%20382.624%20487.315%20380.379%20488.576%20377.95%20489.836%20375.522%20491.269%20372.873%20493.083%20370.118%20494.897%20367.363%20496.97%20364.394%20499.46%20361.421%20501.949%20358.448%20504.784%20355.318%20508.019%20352.28%20511.255%20349.242%20514.983%20346.098%20518.874%20343.193%20522.764%20340.289%20527.059%20337.5%20531.362%20334.851%20535.664%20332.202%20540.233%20329.788%20544.687%20327.301%20549.142%20324.813%20553.782%20322.49%20558.09%20319.926%20562.397%20317.361%20566.455%20314.939%20570.534%20311.912%20574.612%20308.885%20578.467%20305.692%20582.561%20301.765%20586.654%20297.837%20590.505%20293.565%20595.094%20288.348%20599.683%20283.13%20604.412%20277.099%20610.095%20270.46%20615.778%20263.821%20621.623%20256.505%20629.192%20248.514%20636.761%20240.522%20645.206%20231.451%20655.51%20222.509%20665.815%20213.567%20677.103%20203.945%20691.018%20194.86%20704.933%20185.775%20723.006%20176.953%20739%20168%22%20stroke%3D%22%23156082%22%20stroke-width%3D%222%22%20stroke-linecap%3D%22round%22%20stroke-linejoin%3D%22round%22%20stroke-miterlimit%3D%2210%22%20fill%3D%22none%22%2F%3E%3C%2Fg%3E%3Cg%3E%3Cpath%20d%3D%22M480.51%20405.959%20483.51%20411.959%20477.51%20411.959Z%22%20stroke%3D%22%23156082%22%20stroke-linejoin%3D%22round%22%20stroke-miterlimit%3D%2210%22%20fill%3D%22%23156082%22%2F%3E%3Cpath%20d%3D%22M480.51%20404.959%20483.51%20410.959%20477.51%20410.959Z%22%20stroke%3D%22%23156082%22%20stroke-linejoin%3D%22round%22%20stroke-miterlimit%3D%2210%22%20fill%3D%22%23156082%22%2F%3E%3Cpath%20d%3D%22M480.51%20402.959%20483.51%20408.959%20477.51%20408.959Z%22%20stroke%3D%22%23156082%22%20stroke-linejoin%3D%22round%22%20stroke-miterlimit%3D%2210%22%20fill%3D%22%23156082%22%2F%3E%3Cpath%20d%3D%22M480.51%20400.959%20483.51%20406.959%20477.51%20406.959Z%22%20stroke%3D%22%23156082%22%20stroke-linejoin%3D%22round%22%20stroke-miterlimit%3D%2210%22%20fill%3D%22%23156082%22%2F%3E%3Cpath%20d%3D%22M481.51%20398.959%20484.51%20404.959%20478.51%20404.959Z%22%20stroke%3D%22%23156082%22%20stroke-linejoin%3D%22round%22%20stroke-miterlimit%3D%2210%22%20fill%3D%22%23156082%22%2F%3E%3Cpath%20d%3D%22M481.51%20395.959%20484.51%20401.959%20478.51%20401.959Z%22%20stroke%3D%22%23156082%22%20stroke-linejoin%3D%22round%22%20stroke-miterlimit%3D%2210%22%20fill%3D%22%23156082%22%2F%3E%3Cpath%20d%3D%22M482.51%20391.959%20485.51%20397.959%20479.51%20397.959Z%22%20stroke%3D%22%23156082%22%20stroke-linejoin%3D%22round%22%20stroke-miterlimit%3D%2210%22%20fill%3D%22%23156082%22%2F%3E%3Cpath%20d%3D%22M483.51%20386.959%20486.51%20392.959%20480.51%20392.959Z%22%20stroke%3D%22%23156082%22%20stroke-linejoin%3D%22round%22%20stroke-miterlimit%3D%2210%22%20fill%3D%22%23156082%22%2F%3E%3Cpath%20d%3D%22M485.51%20381.959%20488.51%20387.959%20482.51%20387.959Z%22%20stroke%3D%22%23156082%22%20stroke-linejoin%3D%22round%22%20stroke-miterlimit%3D%2210%22%20fill%3D%22%23156082%22%2F%3E%3Cpath%20d%3D%22M488.51%20374.959%20491.51%20380.959%20485.51%20380.959Z%22%20stroke%3D%22%23156082%22%20stroke-linejoin%3D%22round%22%20stroke-miterlimit%3D%2210%22%20fill%3D%22%23156082%22%2F%3E%3Cpath%20d%3D%22M493.51%20366.959%20496.51%20372.959%20490.51%20372.959Z%22%20stroke%3D%22%23156082%22%20stroke-linejoin%3D%22round%22%20stroke-miterlimit%3D%2210%22%20fill%3D%22%23156082%22%2F%3E%3Cpath%20d%3D%22M499.51%20358.959%20502.51%20364.959%20496.51%20364.959Z%22%20stroke%3D%22%23156082%22%20stroke-linejoin%3D%22round%22%20stroke-miterlimit%3D%2210%22%20fill%3D%22%23156082%22%2F%3E%3Cpath%20d%3D%22M508.51%20348.959%20511.51%20354.959%20505.51%20354.959Z%22%20stroke%3D%22%23156082%22%20stroke-linejoin%3D%22round%22%20stroke-miterlimit%3D%2210%22%20fill%3D%22%23156082%22%2F%3E%3Cpath%20d%3D%22M519.51%20339.959%20522.51%20345.959%20516.51%20345.959Z%22%20stroke%3D%22%23156082%22%20stroke-linejoin%3D%22round%22%20stroke-miterlimit%3D%2210%22%20fill%3D%22%23156082%22%2F%3E%3Cpath%20d%3D%22M531.51%20331.959%20534.51%20337.959%20528.51%20337.959Z%22%20stroke%3D%22%23156082%22%20stroke-linejoin%3D%22round%22%20stroke-miterlimit%3D%2210%22%20fill%3D%22%23156082%22%2F%3E%3Cpath%20d%3D%22M544.51%20324.959%20547.51%20330.959%20541.51%20330.959Z%22%20stroke%3D%22%23156082%22%20stroke-linejoin%3D%22round%22%20stroke-miterlimit%3D%2210%22%20fill%3D%22%23156082%22%2F%3E%3Cpath%20d%3D%22M558.51%20316.959%20561.51%20322.959%20555.51%20322.959Z%22%20stroke%3D%22%23156082%22%20stroke-linejoin%3D%22round%22%20stroke-miterlimit%3D%2210%22%20fill%3D%22%23156082%22%2F%3E%3Cpath%20d%3D%22M570.51%20308.959%20573.51%20314.959%20567.51%20314.959Z%22%20stroke%3D%22%23156082%22%20stroke-linejoin%3D%22round%22%20stroke-miterlimit%3D%2210%22%20fill%3D%22%23156082%22%2F%3E%3Cpath%20d%3D%22M582.51%20298.959%20585.51%20304.959%20579.51%20304.959Z%22%20stroke%3D%22%23156082%22%20stroke-linejoin%3D%22round%22%20stroke-miterlimit%3D%2210%22%20fill%3D%22%23156082%22%2F%3E%3Cpath%20d%3D%22M595.51%20285.959%20598.51%20291.959%20592.51%20291.959Z%22%20stroke%3D%22%23156082%22%20stroke-linejoin%3D%22round%22%20stroke-miterlimit%3D%2210%22%20fill%3D%22%23156082%22%2F%3E%3Cpath%20d%3D%22M610.51%20267.959%20613.51%20273.959%20607.51%20273.959Z%22%20stroke%3D%22%23156082%22%20stroke-linejoin%3D%22round%22%20stroke-miterlimit%3D%2210%22%20fill%3D%22%23156082%22%2F%3E%3Cpath%20d%3D%22M629.51%20245.959%20632.51%20251.959%20626.51%20251.959Z%22%20stroke%3D%22%23156082%22%20stroke-linejoin%3D%22round%22%20stroke-miterlimit%3D%2210%22%20fill%3D%22%23156082%22%2F%3E%3Cpath%20d%3D%22M655.51%20219.959%20658.51%20225.959%20652.51%20225.959Z%22%20stroke%3D%22%23156082%22%20stroke-linejoin%3D%22round%22%20stroke-miterlimit%3D%2210%22%20fill%3D%22%23156082%22%2F%3E%3Cpath%20d%3D%22M691.51%20192.959%20694.51%20198.959%20688.51%20198.959Z%22%20stroke%3D%22%23156082%22%20stroke-linejoin%3D%22round%22%20stroke-miterlimit%3D%2210%22%20fill%3D%22%23156082%22%2F%3E%3Cpath%20d%3D%22M739.51%20165.959%20742.51%20171.959%20736.51%20171.959Z%22%20stroke%3D%22%23156082%22%20stroke-linejoin%3D%22round%22%20stroke-miterlimit%3D%2210%22%20fill%3D%22%23156082%22%2F%3E%3C%2Fg%3E%3Cg%3E%3Cpath%20d%3D%22M479%20412C479%20411.931%20479%20411.87%20479.001%20411.792%20479.001%20411.714%20479.001%20411.629%20479.002%20411.531%20479.002%20411.432%20479.003%20411.326%20479.004%20411.202%20479.004%20411.078%20479.005%20410.943%20479.006%20410.788%20479.008%20410.632%20479.009%20410.463%20479.011%20410.267%20479.013%20410.071%20479.015%20409.858%20479.018%20409.61%20479.021%20409.363%20479.024%20409.094%20479.029%20408.782%20479.034%20408.471%20479.04%20408.133%20479.047%20407.741%20479.055%20407.35%20479.064%20406.926%20479.076%20406.433%20479.088%20405.939%20479.102%20405.402%20479.121%20404.781%20479.141%20404.16%20479.162%20403.487%20479.193%20402.708%20479.223%20401.929%20479.256%20401.09%20479.305%20400.107%20479.354%20399.123%20479.408%20398.043%20479.486%20396.808%20479.563%20395.573%20479.646%20394.244%20479.768%20392.695%20479.89%20391.147%20480.021%20389.486%20480.217%20387.517%20480.412%20385.549%20480.633%20383.35%20480.941%20380.885%20481.25%20378.42%20481.583%20375.791%20482.067%20372.728%20482.55%20369.665%20483.084%20366.326%20483.844%20362.509%20484.604%20358.692%20485.422%20354.607%20486.628%20349.828%20487.833%20345.048%20489.201%20339.708%20491.078%20333.833%20492.954%20327.958%20494.982%20321.706%20497.885%20314.577%20500.788%20307.449%20504.075%20299.549%20508.498%20291.062%20512.921%20282.576%20517.728%20273.536%20524.42%20263.658%20531.112%20253.778%20538.982%20242.627%20548.649%20231.788%20558.317%20220.949%20568.833%20209.722%20582.424%20198.622%20596.016%20187.522%20612.215%20175.311%20630.199%20165.187%20648.182%20155.064%20668.192%20145.247%20690.326%20137.883%20712.459%20130.518%20738.775%20126.627%20763%20121%22%20stroke%3D%22%23156082%22%20stroke-width%3D%222%22%20stroke-linecap%3D%22round%22%20stroke-linejoin%3D%22round%22%20stroke-miterlimit%3D%2210%22%20fill%3D%22none%22%2F%3E%3C%2Fg%3E%3Cg%3E%3Cpath%20d%3D%22M483.01%20412.959C483.01%20414.892%20481.443%20416.459%20479.51%20416.459%20477.577%20416.459%20476.01%20414.892%20476.01%20412.959%20476.01%20411.026%20477.577%20409.459%20479.51%20409.459%20481.443%20409.459%20483.01%20411.026%20483.01%20412.959Z%22%20fill%3D%22%23156082%22%2F%3E%3Cpath%20d%3D%22M483.01%20412.959C483.01%20414.892%20481.443%20416.459%20479.51%20416.459%20477.577%20416.459%20476.01%20414.892%20476.01%20412.959%20476.01%20411.026%20477.577%20409.459%20479.51%20409.459%20481.443%20409.459%20483.01%20411.026%20483.01%20412.959Z%22%20fill%3D%22%23156082%22%2F%3E%3Cpath%20d%3D%22M483.01%20412.959C483.01%20414.892%20481.443%20416.459%20479.51%20416.459%20477.577%20416.459%20476.01%20414.892%20476.01%20412.959%20476.01%20411.026%20477.577%20409.459%20479.51%20409.459%20481.443%20409.459%20483.01%20411.026%20483.01%20412.959Z%22%20fill%3D%22%23156082%22%2F%3E%3Cpath%20d%3D%22M483.01%20412.959C483.01%20414.892%20481.443%20416.459%20479.51%20416.459%20477.577%20416.459%20476.01%20414.892%20476.01%20412.959%20476.01%20411.026%20477.577%20409.459%20479.51%20409.459%20481.443%20409.459%20483.01%20411.026%20483.01%20412.959Z%22%20fill%3D%22%23156082%22%2F%3E%3Cpath%20d%3D%22M483.01%20411.959C483.01%20413.892%20481.443%20415.459%20479.51%20415.459%20477.577%20415.459%20476.01%20413.892%20476.01%20411.959%20476.01%20410.026%20477.577%20408.459%20479.51%20408.459%20481.443%20408.459%20483.01%20410.026%20483.01%20411.959Z%22%20fill%3D%22%23156082%22%2F%3E%3Cpath%20d%3D%22M483.01%20411.959C483.01%20413.892%20481.443%20415.459%20479.51%20415.459%20477.577%20415.459%20476.01%20413.892%20476.01%20411.959%20476.01%20410.026%20477.577%20408.459%20479.51%20408.459%20481.443%20408.459%20483.01%20410.026%20483.01%20411.959Z%22%20fill%3D%22%23156082%22%2F%3E%3Cpath%20d%3D%22M483.01%20410.959C483.01%20412.892%20481.443%20414.459%20479.51%20414.459%20477.577%20414.459%20476.01%20412.892%20476.01%20410.959%20476.01%20409.026%20477.577%20407.459%20479.51%20407.459%20481.443%20407.459%20483.01%20409.026%20483.01%20410.959Z%22%20fill%3D%22%23156082%22%2F%3E%3Cpath%20d%3D%22M483.01%20409.959C483.01%20411.892%20481.443%20413.459%20479.51%20413.459%20477.577%20413.459%20476.01%20411.892%20476.01%20409.959%20476.01%20408.026%20477.577%20406.459%20479.51%20406.459%20481.443%20406.459%20483.01%20408.026%20483.01%20409.959Z%22%20fill%3D%22%23156082%22%2F%3E%3Cpath%20d%3D%22M483.01%20408.959C483.01%20410.892%20481.443%20412.459%20479.51%20412.459%20477.577%20412.459%20476.01%20410.892%20476.01%20408.959%20476.01%20407.026%20477.577%20405.459%20479.51%20405.459%20481.443%20405.459%20483.01%20407.026%20483.01%20408.959Z%22%20fill%3D%22%23156082%22%2F%3E%3Cpath%20d%3D%22M483.01%20407.959C483.01%20409.892%20481.443%20411.459%20479.51%20411.459%20477.577%20411.459%20476.01%20409.892%20476.01%20407.959%20476.01%20406.026%20477.577%20404.459%20479.51%20404.459%20481.443%20404.459%20483.01%20406.026%20483.01%20407.959Z%22%20fill%3D%22%23156082%22%2F%3E%3Cpath%20d%3D%22M483.01%20405.959C483.01%20407.892%20481.443%20409.459%20479.51%20409.459%20477.577%20409.459%20476.01%20407.892%20476.01%20405.959%20476.01%20404.026%20477.577%20402.459%20479.51%20402.459%20481.443%20402.459%20483.01%20404.026%20483.01%20405.959Z%22%20fill%3D%22%23156082%22%2F%3E%3Cpath%20d%3D%22M483.01%20403.959C483.01%20405.892%20481.443%20407.459%20479.51%20407.459%20477.577%20407.459%20476.01%20405.892%20476.01%20403.959%20476.01%20402.026%20477.577%20400.459%20479.51%20400.459%20481.443%20400.459%20483.01%20402.026%20483.01%20403.959Z%22%20fill%3D%22%23156082%22%2F%3E%3Cpath%20d%3D%22M483.01%20401.959C483.01%20403.892%20481.443%20405.459%20479.51%20405.459%20477.577%20405.459%20476.01%20403.892%20476.01%20401.959%20476.01%20400.026%20477.577%20398.459%20479.51%20398.459%20481.443%20398.459%20483.01%20400.026%20483.01%20401.959Z%22%20fill%3D%22%23156082%22%2F%3E%3Cpath%20d%3D%22M484.01%20397.959C484.01%20399.892%20482.443%20401.459%20480.51%20401.459%20478.577%20401.459%20477.01%20399.892%20477.01%20397.959%20477.01%20396.026%20478.577%20394.459%20480.51%20394.459%20482.443%20394.459%20484.01%20396.026%20484.01%20397.959Z%22%20fill%3D%22%23156082%22%2F%3E%3Cpath%20d%3D%22M484.01%20393.959C484.01%20395.892%20482.443%20397.459%20480.51%20397.459%20478.577%20397.459%20477.01%20395.892%20477.01%20393.959%20477.01%20392.026%20478.577%20390.459%20480.51%20390.459%20482.443%20390.459%20484.01%20392.026%20484.01%20393.959Z%22%20fill%3D%22%23156082%22%2F%3E%3Cpath%20d%3D%22M484.01%20388.959C484.01%20390.892%20482.443%20392.459%20480.51%20392.459%20478.577%20392.459%20477.01%20390.892%20477.01%20388.959%20477.01%20387.026%20478.577%20385.459%20480.51%20385.459%20482.443%20385.459%20484.01%20387.026%20484.01%20388.959Z%22%20fill%3D%22%23156082%22%2F%3E%3Cpath%20d%3D%22M485.01%20381.959C485.01%20383.892%20483.443%20385.459%20481.51%20385.459%20479.577%20385.459%20478.01%20383.892%20478.01%20381.959%20478.01%20380.026%20479.577%20378.459%20481.51%20378.459%20483.443%20378.459%20485.01%20380.026%20485.01%20381.959Z%22%20fill%3D%22%23156082%22%2F%3E%3Cpath%20d%3D%22M486.01%20373.959C486.01%20375.892%20484.443%20377.459%20482.51%20377.459%20480.577%20377.459%20479.01%20375.892%20479.01%20373.959%20479.01%20372.026%20480.577%20370.459%20482.51%20370.459%20484.443%20370.459%20486.01%20372.026%20486.01%20373.959Z%22%20fill%3D%22%23156082%22%2F%3E%3Cpath%20d%3D%22M488.01%20363.959C488.01%20365.892%20486.443%20367.459%20484.51%20367.459%20482.577%20367.459%20481.01%20365.892%20481.01%20363.959%20481.01%20362.026%20482.577%20360.459%20484.51%20360.459%20486.443%20360.459%20488.01%20362.026%20488.01%20363.959Z%22%20fill%3D%22%23156082%22%2F%3E%3Cpath%20d%3D%22M491.01%20350.959C491.01%20352.892%20489.443%20354.459%20487.51%20354.459%20485.577%20354.459%20484.01%20352.892%20484.01%20350.959%20484.01%20349.026%20485.577%20347.459%20487.51%20347.459%20489.443%20347.459%20491.01%20349.026%20491.01%20350.959Z%22%20fill%3D%22%23156082%22%2F%3E%3Cpath%20d%3D%22M495.01%20334.959C495.01%20336.892%20493.443%20338.459%20491.51%20338.459%20489.577%20338.459%20488.01%20336.892%20488.01%20334.959%20488.01%20333.026%20489.577%20331.459%20491.51%20331.459%20493.443%20331.459%20495.01%20333.026%20495.01%20334.959Z%22%20fill%3D%22%23156082%22%2F%3E%3Cpath%20d%3D%22M502.01%20315.959C502.01%20317.892%20500.443%20319.459%20498.51%20319.459%20496.577%20319.459%20495.01%20317.892%20495.01%20315.959%20495.01%20314.026%20496.577%20312.459%20498.51%20312.459%20500.443%20312.459%20502.01%20314.026%20502.01%20315.959Z%22%20fill%3D%22%23156082%22%2F%3E%3Cpath%20d%3D%22M513.01%20292.959C513.01%20294.892%20511.443%20296.459%20509.51%20296.459%20507.577%20296.459%20506.01%20294.892%20506.01%20292.959%20506.01%20291.026%20507.577%20289.459%20509.51%20289.459%20511.443%20289.459%20513.01%20291.026%20513.01%20292.959Z%22%20fill%3D%22%23156082%22%2F%3E%3Cpath%20d%3D%22M528.01%20264.959C528.01%20266.892%20526.443%20268.459%20524.51%20268.459%20522.577%20268.459%20521.01%20266.892%20521.01%20264.959%20521.01%20263.026%20522.577%20261.459%20524.51%20261.459%20526.443%20261.459%20528.01%20263.026%20528.01%20264.959Z%22%20fill%3D%22%23156082%22%2F%3E%3Cpath%20d%3D%22M553.01%20232.959C553.01%20234.892%20551.443%20236.459%20549.51%20236.459%20547.577%20236.459%20546.01%20234.892%20546.01%20232.959%20546.01%20231.026%20547.577%20229.459%20549.51%20229.459%20551.443%20229.459%20553.01%20231.026%20553.01%20232.959Z%22%20fill%3D%22%23156082%22%2F%3E%3Cpath%20d%3D%22M586.01%20199.959C586.01%20201.892%20584.443%20203.459%20582.51%20203.459%20580.577%20203.459%20579.01%20201.892%20579.01%20199.959%20579.01%20198.026%20580.577%20196.459%20582.51%20196.459%20584.443%20196.459%20586.01%20198.026%20586.01%20199.959Z%22%20fill%3D%22%23156082%22%2F%3E%3Cpath%20d%3D%22M634.01%20166.959C634.01%20168.892%20632.443%20170.459%20630.51%20170.459%20628.577%20170.459%20627.01%20168.892%20627.01%20166.959%20627.01%20165.026%20628.577%20163.459%20630.51%20163.459%20632.443%20163.459%20634.01%20165.026%20634.01%20166.959Z%22%20fill%3D%22%23156082%22%2F%3E%3Cpath%20d%3D%22M694.01%20138.959C694.01%20140.892%20692.443%20142.459%20690.51%20142.459%20688.577%20142.459%20687.01%20140.892%20687.01%20138.959%20687.01%20137.026%20688.577%20135.459%20690.51%20135.459%20692.443%20135.459%20694.01%20137.026%20694.01%20138.959Z%22%20fill%3D%22%23156082%22%2F%3E%3Cpath%20d%3D%22M767.01%20121.959C767.01%20123.892%20765.443%20125.459%20763.51%20125.459%20761.577%20125.459%20760.01%20123.892%20760.01%20121.959%20760.01%20120.026%20761.577%20118.459%20763.51%20118.459%20765.443%20118.459%20767.01%20120.026%20767.01%20121.959Z%22%20fill%3D%22%23156082%22%2F%3E%3C%2Fg%3E%3Cg%3E%3Ctext%20fill%3D%22%23595959%22%20font-family%3D%22Arial%2CArial_MSFontService%2CArial%22%20font-weight%3D%22400%22%20font-size%3D%2216%22%20transform%3D%22translate(450.287%20418)%22%3E0%3C%2Ftext%3E%3C%2Fg%3E%3Cg%3E%3Ctext%20fill%3D%22%23595959%22%20font-family%3D%22Arial%2CArial_MSFontService%2CArial%22%20font-weight%3D%22400%22%20font-size%3D%2216%22%20transform%3D%22translate(410.24%20355)%22%3E20%2C000%3C%2Ftext%3E%3C%2Fg%3E%3Cg%3E%3Ctext%20fill%3D%22%23595959%22%20font-family%3D%22Arial%2CArial_MSFontService%2CArial%22%20font-weight%3D%22400%22%20font-size%3D%2216%22%20transform%3D%22translate(410.24%20292)%22%3E40%2C000%3C%2Ftext%3E%3C%2Fg%3E%3Cg%3E%3Ctext%20fill%3D%22%23595959%22%20font-family%3D%22Arial%2CArial_MSFontService%2CArial%22%20font-weight%3D%22400%22%20font-size%3D%2216%22%20transform%3D%22translate(410.24%20229)%22%3E60%2C000%3C%2Ftext%3E%3C%2Fg%3E%3Cg%3E%3Ctext%20fill%3D%22%23595959%22%20font-family%3D%22Arial%2CArial_MSFontService%2CArial%22%20font-weight%3D%22400%22%20font-size%3D%2216%22%20transform%3D%22translate(410.24%20166)%22%3E80%2C000%3C%2Ftext%3E%3C%2Fg%3E%3Cg%3E%3Ctext%20fill%3D%22%23595959%22%20font-family%3D%22Arial%2CArial_MSFontService%2CArial%22%20font-weight%3D%22400%22%20font-size%3D%2216%22%20transform%3D%22translate(401.34%20103)%22%3E100%2C000%3C%2Ftext%3E%3C%2Fg%3E%3Cg%3E%3Ctext%20fill%3D%22%23595959%22%20font-family%3D%22Arial%2CArial_MSFontService%2CArial%22%20font-weight%3D%22400%22%20font-size%3D%2216%22%20transform%3D%22translate(468.506%20437)%22%3E0%3C%2Ftext%3E%3C%2Fg%3E%3Cg%3E%3Ctext%20fill%3D%22%23595959%22%20font-family%3D%22Arial%2CArial_MSFontService%2CArial%22%20font-weight%3D%22400%22%20font-size%3D%2216%22%20transform%3D%22translate(518.909%20437)%22%3E20%2C000%3C%2Ftext%3E%3C%2Fg%3E%3Cg%3E%3Ctext%20fill%3D%22%23595959%22%20font-family%3D%22Arial%2CArial_MSFontService%2CArial%22%20font-weight%3D%22400%22%20font-size%3D%2216%22%20transform%3D%22translate(589.335%20437)%22%3E40%2C000%3C%2Ftext%3E%3C%2Fg%3E%3Cg%3E%3Ctext%20fill%3D%22%23595959%22%20font-family%3D%22Arial%2CArial_MSFontService%2CArial%22%20font-weight%3D%22400%22%20font-size%3D%2216%22%20transform%3D%22translate(659.761%20437)%22%3E60%2C000%3C%2Ftext%3E%3C%2Fg%3E%3Cg%3E%3Ctext%20fill%3D%22%23595959%22%20font-family%3D%22Arial%2CArial_MSFontService%2CArial%22%20font-weight%3D%22400%22%20font-size%3D%2216%22%20transform%3D%22translate(730.187%20437)%22%3E80%2C000%3C%2Ftext%3E%3C%2Fg%3E%3Cg%3E%3Ctext%20fill%3D%22%23595959%22%20font-family%3D%22Arial%2CArial_MSFontService%2CArial%22%20font-weight%3D%22400%22%20font-size%3D%2216%22%20transform%3D%22translate(796.164%20437)%22%3E100%2C000%3C%2Ftext%3E%3C%2Fg%3E%3Cg%3E%3Ctext%20fill%3D%22%23595959%22%20font-family%3D%22Arial%2CArial_MSFontService%2CArial%22%20font-weight%3D%22400%22%20font-size%3D%2219%22%20transform%3D%22matrix(6.12323e-17%20-1%201%206.12323e-17%20404.677%20312)%22%3E%E2%88%92%3C%2Ftext%3E%3C%2Fg%3E%3Cg%3E%3Ctext%20fill%3D%22%23595959%22%20font-family%3D%22Arial%2CArial_MSFontService%2CArial%22%20font-weight%3D%22700%22%20font-size%3D%2219%22%20transform%3D%22matrix(6.12323e-17%20-1%201%206.12323e-17%20404.677%20301)%22%3EZ%E2%80%99%E2%80%99%20(%3C%2Ftext%3E%3C%2Fg%3E%3Cg%3E%3Ctext%20fill%3D%22%23595959%22%20font-family%3D%22Arial%2CArial_MSFontService%2CArial%22%20font-weight%3D%22700%22%20font-size%3D%2219%22%20transform%3D%22matrix(6.12323e-17%20-1%201%206.12323e-17%20404.677%20269)%22%3E%CE%A9%C2%B7cm%C2%B2)%3C%2Ftext%3E%3C%2Fg%3E%3Cg%3E%3Ctext%20fill%3D%22%23595959%22%20font-family%3D%22Arial%2CArial_MSFontService%2CArial%22%20font-weight%3D%22700%22%20font-size%3D%2219%22%20transform%3D%22translate(605.248%20463)%22%3EZ%E2%80%99%20(%3C%2Ftext%3E%3C%2Fg%3E%3Cg%3E%3Ctext%20fill%3D%22%23595959%22%20font-family%3D%22Arial%2CArial_MSFontService%2CArial%22%20font-weight%3D%22700%22%20font-size%3D%2219%22%20transform%3D%22translate(632.208%20463)%22%3E%CE%A9%C2%B7cm%C2%B2)%3C%2Ftext%3E%3C%2Fg%3E%3Cpath%20d%3D%22M662%20335C662%20331.134%20665.358%20328%20669.5%20328%20673.642%20328%20677%20331.134%20677%20335%20677%20338.866%20673.642%20342%20669.5%20342%20665.358%20342%20662%20338.866%20662%20335Z%22%20fill%3D%22%23156082%22%20fill-rule%3D%22evenodd%22%2F%3E%3Cpath%20d%3D%22M662%20366%20669.5%20352%20677%20366Z%22%20fill%3D%22%23156082%22%20fill-rule%3D%22evenodd%22%2F%3E%3Ctext%20font-family%3D%22Arial%2CArial_MSFontService%2CArial%22%20font-weight%3D%22700%22%20font-size%3D%2215%22%20transform%3D%22translate(687.934%20340)%22%3EE%3C%2Ftext%3E%3Ctext%20font-family%3D%22Arial%2CArial_MSFontService%2CArial%22%20font-weight%3D%22700%22%20font-size%3D%2215%22%20transform%3D%22translate(697.768%20340)%22%3Experiment%202%3C%2Ftext%3E%3Ctext%20font-family%3D%22Arial%2CArial_MSFontService%2CArial%22%20font-weight%3D%22700%22%20font-size%3D%2215%22%20transform%3D%22translate(687.934%20362)%22%3EE%3C%2Ftext%3E%3Ctext%20font-family%3D%22Arial%2CArial_MSFontService%2CArial%22%20font-weight%3D%22700%22%20font-size%3D%2215%22%20transform%3D%22translate(697.768%20362)%22%3Experiment%201%3C%2Ftext%3E%3Cpath%20d%3D%22M659%20381%20679.316%20381%22%20stroke%3D%22%23156082%22%20stroke-width%3D%222%22%20stroke-miterlimit%3D%228%22%20fill%3D%22none%22%20fill-rule%3D%22evenodd%22%2F%3E%3Ctext%20font-family%3D%22Arial%2CArial_MSFontService%2CArial%22%20font-weight%3D%22700%22%20font-size%3D%2215%22%20transform%3D%22translate(688.095%20385)%22%3EF%3C%2Ftext%3E%3Ctext%20font-family%3D%22Arial%2CArial_MSFontService%2CArial%22%20font-weight%3D%22700%22%20font-size%3D%2215%22%20transform%3D%22translate(697.095%20385)%22%3Eitting%3C%2Ftext%3E%3C%2Fg%3E%3C%2Fsvg%3E)
Figure 8. Nyquist plots of the oxide films formed on AE44 from experiments 1 and 2 in 3.5 wt% NaCl solution, and the fitting results of the electrochemical plots based on the equivalent circuit model considering the role of the interface.
The electrochemical response of the oxide films was consistent with the trends observed in the potentiodynamic polarization measurements. To quantitatively interpret the impedance behavior, the equivalent circuit model illustrated in Figure 9 was employed to simulate the EIS data. In this model, R0 represents the solution resistance, while R1 and R2 correspond to the resistances of the outer and inner layers, respectively, each arranged in parallel with their associated constant phase elements (CPE1 and CPE2).
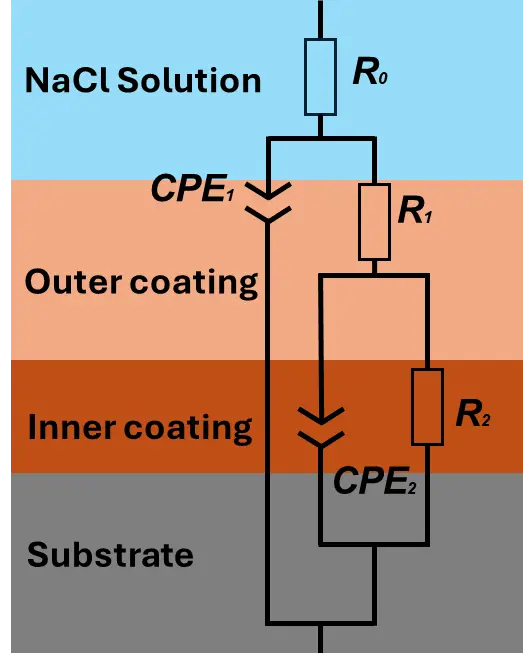
Figure 9. An equivalent circuit model to analyze the electrochemical impedance data of the oxide films formed on AE44 from experiments 1 and 2.
The impedance of the CPE is expressed by the following equation:
|
```latex\mathrm{Z_{\mathrm{CPE}} = 1/[Y(\mathrm{j}\omega)^n]}``` |
(2) |
In this model, j denotes the imaginary unit, ω is the angular frequency, and n and Y are the defining parameters of the CPE. The exponent n varies between 0 and 1, where n = 0 corresponds to purely resistive behavior and n = 1 represents an ideal capacitor. The fitted parameters obtained from the equivalent circuit analysis for the oxide films produced in the two experiments are summarized in Table 4. Notably, the resistances R1 and R2, corresponding to the outer porous layer and inner compact layer, respectively, were higher for the aluminate-based oxide films generated in Experiment 2 than for those from Experiment 1, indicating that the corrosion resistance of the coating formed in Experiment 2 surpassed that of Experiment 1. These findings were consistent with the potentiodynamic polarization results obtained in 3.5 wt% NaCl solution.
Table 4. Results of the electrochemical impedance tests of the oxide films immersed in 3.5 wt% NaCl solution in Experiments 1 and 2.
|
R0 (Ω·cm2) |
R1 (Ω·cm2) |
n1 |
Y1 (F/cm2·s1−n) |
R2 (Ω·cm2) |
n2 |
Y2 (F/cm2·s1−n) |
|
|---|---|---|---|---|---|---|---|
|
AE44 |
7.19 × 101 |
- |
- |
- |
1.89 × 10³ |
0.78 |
2.01 × 10⁻⁶ |
|
Experiment 1 |
1.11 × 10² |
2.35 × 10⁴ |
0.72 |
2.09 × 10⁻⁷ |
1.91 × 10⁵ |
0.61 |
2.99 × 10⁻⁷ |
|
Experiment 2 |
1.67 × 10² |
4.51 × 10⁴ |
0.91 |
5.47 × 10⁻⁷ |
2.72 × 10⁵ |
0.73 |
5.95 × 10⁻⁷ |
3.7. SEM and EDS Analysis
Figure 10 presents SEM micrographs of the AE44 substrate and the coatings produced at low and high voltages, both before and after corrosion testing. As shown in Figure 10b, the surface morphology of the bare AE44 substrate (Figure 10a) was severely degraded after corrosion, with the tested region almost completely destroyed and covered with extensive corrosion craters. In contrast, under the same magnification, the coated surfaces exhibited significantly improved integrity compared with that of the substrate. The coating from Experiment 1 (Figure 10d), prepared with lower treatment duration, current density, and voltage but a higher duty cycle, displayed only localized damage. By comparison, the coating from Experiment 2 (Figure 10f) showed minimal surface deterioration, with nearly no visible breakdown. These SEM observations clearly demonstrate that PEO coatings effectively protect the substrate against corrosion and enhance its corrosion resistance, with the coating obtained in Experiment 2 exhibiting superior performance compared to that of Experiment 1.
Figure 11 presents the EDS spectra of the uncoated AE44 substrate and the coatings from Experiments 1 and 2, both before and after corrosion testing. To highlight the variation in the principal alloying elements of AE44, only magnesium and aluminum were considered, as the contents of other elements were negligible. Compared with the uncorroded substrate (Figure 11a), the corroded substrate (Figure 11b) revealed the presence of oxygen, sodium, and chlorine on the surface. In contrast, since the two coatings were prepared from the solution of NaAlO2, the coatings already contained oxygen and sodium prior to corrosion (Figure 11c,e). After corrosion, only chlorine was additionally detected on the coated surfaces (Figure 11d,f).
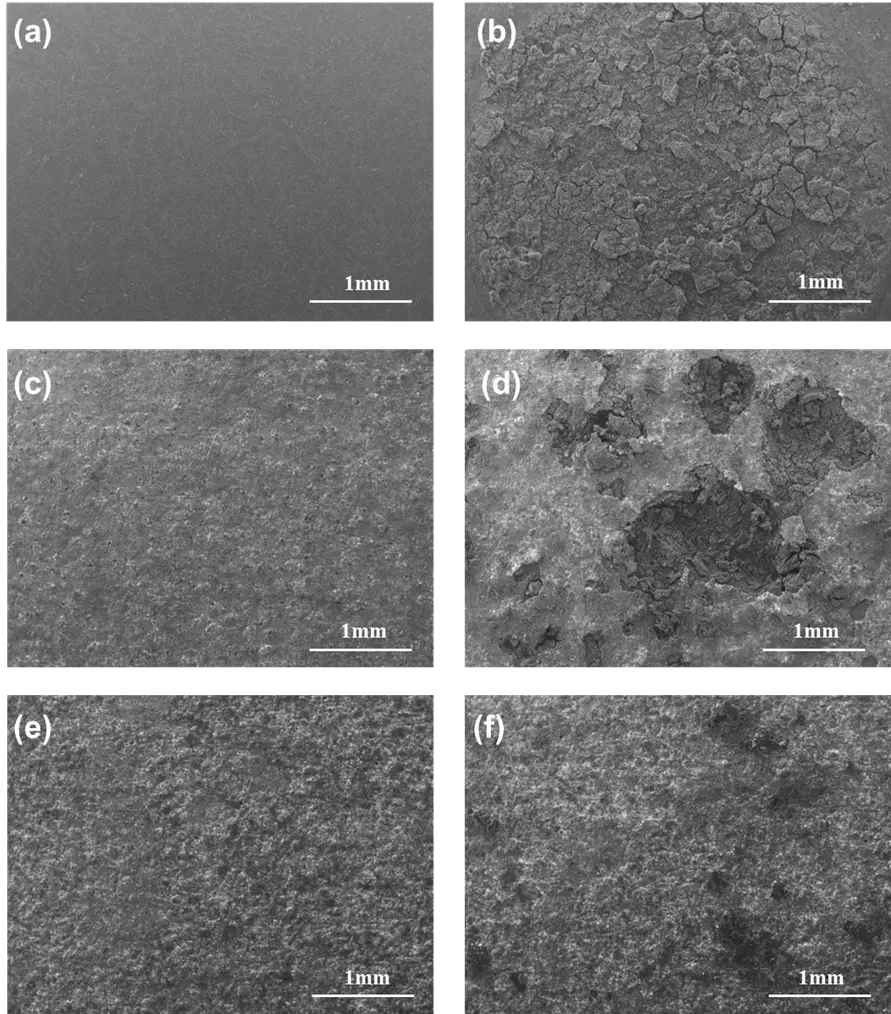
Figure 10. SEM micrographs of the coatings and AE44 substrate before and after corrosion testing: (a) AE44 substrate before corrosion testing; (b) AE44 substrate after corrosion testing; (c) PEO coating from Experiment 1 before corrosion testing; (d) PEO coating from Experiment 1 after corrosion testing; (e) PEO coating from Experiment 2 before corrosion testing; (f) PEO coating from Experiment 2 after corrosion testing.
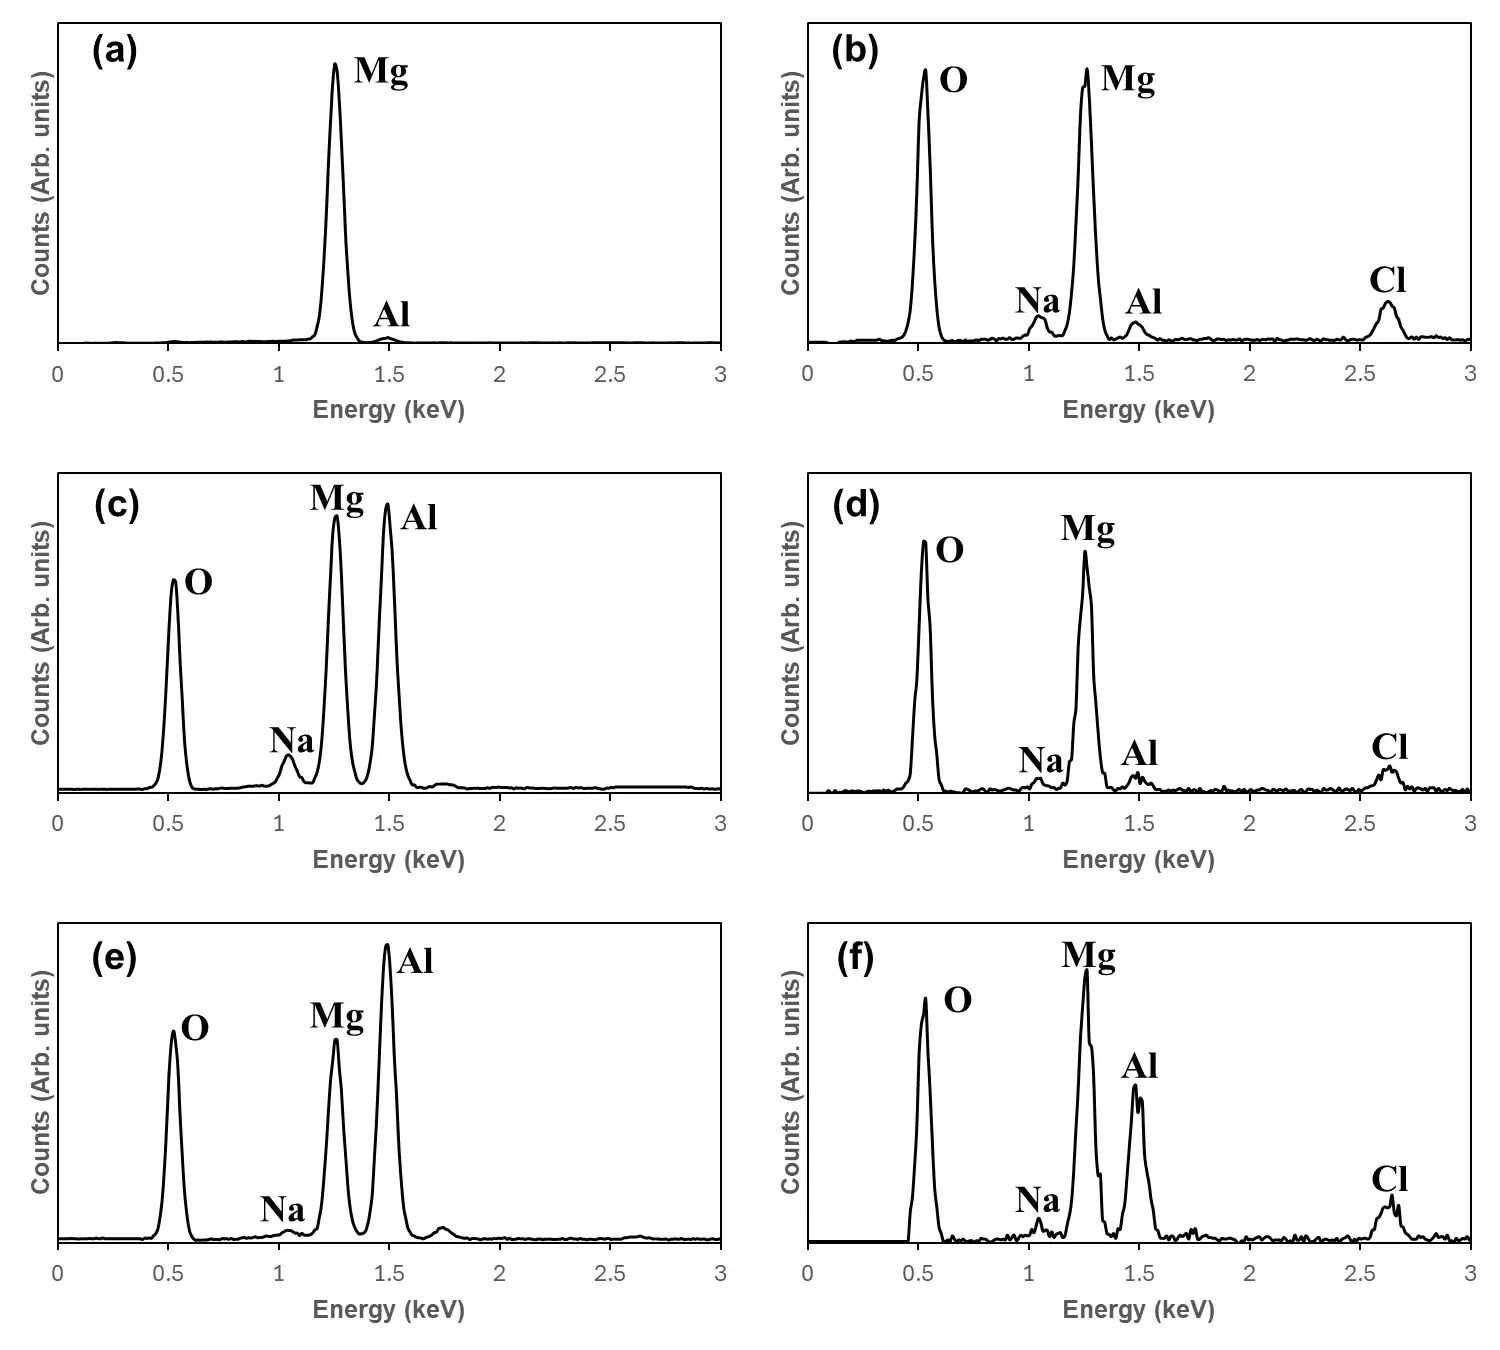
Figure 11. EDS spectra for the uncoated AE44 and coatings before and after corrosion testing: (a) AE44 substrate before corrosion testing; (b) AE44 substrate after corrosion testing; (c) PEO coating from experiment 1 before corrosion testing; (d) PEO coating from Experiment 1 after corrosion testing; (e) PEO coating from Experiment 2 before corrosion testing; (f) PEO coating from Experiment 2 after corrosion testing. The EDS spectra correspond to the SEM micrographs in Figure 10.
Table 5 summarizes the atomic percentages of five elements (O, Al, Mg, Na, and Cl) in the AE44 substrate and in the coatings from Experiments 1 and 2, both before and after corrosion testing. For the AE44 substrate, a pronounced reduction in Mg content was observed after corrosion, with the atomic percentage dropping to 72.8 at% (95.77–22.97 at%). Simultaneously, oxygen increased markedly by 69.3 at%, becoming the most abundant element, while the contributions of other elements remained minor. A significant reduction in the magnesium and a considerable increase in oxygen inferred that substantial dissolution of Mg occurred during corrosion.
Table 5. Variation of chemical elements for AE44 substrate and coatings before and after corrosion testing.
|
Samples |
Oxygen (at%) |
Aluminum (at%) |
Magnesium (at%) |
Sodium (at%) |
Chlorine (at%) |
|---|---|---|---|---|---|
|
Substrate (before) |
0 |
4.23 |
95.77 |
0 |
0 |
|
Substrate (after) |
69.3 |
1.57 |
22.97 |
2.39 |
3.25 |
|
Coating 1 (before) |
58.28 |
21.16 |
20.11 |
0.45 |
0 |
|
Coating 1 (after) |
71.41 |
1.76 |
23.39 |
1.59 |
1.84 |
|
Coating 2 (before) |
60.43 |
21.00 |
18.08 |
0.49 |
0 |
|
Coating 2 (after) |
63.66 |
12.72 |
19.52 |
1.49 |
2.62 |
For the coating from Experiment 1, the initial composition consisted of 58.28 at% O, 21.16 at% Al, 20.11 at% Mg, and 0.45 at% Na, which was comparable to that of the coating from Experiment 2 under the same efficiency constant and aluminate solution concentration. After corrosion, the coating from Experiment 1 exhibited increases in O and Na, a significant decrease in Al, and a minor change in Mg. The reduction of Al suggested that Al dissolution might contribute to the formation of corrosion craters on the coating surface. Furthermore, the elemental composition of the corroded region in the coating of Experiment 1 closely resembled that of the corroded AE44 substrate, implying that some parts of the coating were broken away, exposing the underlying substrate.
In contrast, the elemental composition of the coating produced in Experiment 2 remained largely stable after corrosion. The only notable change was a decrease in Al from 21.00 at% to 12.72 at%. Consistent with the microstructural observations in Figure 10f, the surface showed minimal visible degradation. Compared to the significant Al loss and breakdown observed in the coating of Experiment 1, the relative chemical stability of the coating obtained from Experiment 2 showed that limited Al depletion took place during corrosion testing due to the presence of a strong aluminated-based PEO coating on the AE44 substrate. The relatively small change in Al content rationalized the almost intact surface morphology of the coating in Experiment 2, whereas the coating in Experiment 1 experienced localized failure.
4. Conclusions
Two sets of electrical parameters were applied to fabricate PEO coatings on Mg alloy AE44 under a constant efficiency. In Experiment 1, the treatment was carried out at a lower current density and shorter duration but with a higher duty cycle, while Experiment 2 employed a higher current density and longer duration with a lower duty cycle. The two conditions produced coatings with distinct voltage responses, surface morphologies, and properties. Experiment 1 operated at a lower voltage, whereas Experiment 2 reached higher voltages during processing. Despite the identical efficiency, the coatings from Experiment 2 exhibited superior performance, characterized by greater thickness, lower porosity, and better corrosion resistance than those of Experiment 1. These findings indicated that higher voltage promoted the growth of denser, thicker, and more compact coatings with improved protective capability under the same efficiency constant and the same concentration of electrolyte solutions. Furthermore, the EDS analysis revealed that the aluminum content served as a critical indicator of coating degradation on the AE44 substrate in aluminate-based PEO systems.
Author Contributions
Conceptualization, T.Z. and H.H.; Methodology, T.Z. and R.C.; Validation, T.Z. and H.H.; Formal Analysis, T.Z.; Investigation, T.Z., Y.Z. and R.C.; Resources, H.H. and X.N.; Data Curation, T.Z.; Writing—Original Draft Preparation, T.Z.; Writing—Review & Editing, H.H. and X.N.; Visualization, T.Z.; Supervision, H.H. and X.N.; Project Administration, H.H. and X.N.; Funding Acquisition, H.H. and X.N. All authors have read and agreed to the published version of the manuscript.
Ethics Statement
Not applicable.
Informed Consent Statement
Not applicable.
Data Availability Statement
All data generated or analyzed during this study are available from the corresponding author upon reasonable request.
Funding
This research was financially supported by the Natural Science and Engineering Research Council of Canada, the Canada Foundation for Innovation, and the University of Windsor.
Declaration of Competing Interest
The authors declare that they have no known competing financial interests or personal relationships that could have appeared to influence the work reported in this paper.
References
- Wang GG, Weiler JP. Recent developments in high-pressure die-cast magnesium alloys for automotive and future applications. J. Magnes. Alloys 2023, 11, 78-87. DOI:10.1016/j.jma.2022.10.001 [Google Scholar]
- Li T, Song J, Zhang A, You G, Yang Y, Jiang B, et al. Progress and prospects in Mg-alloy super-sized high pressure die casting for automotive structural components. J. Magnes. Alloys 2023, 11, 4166–4180. DOI:10.1016/j.jma.2023.11.003 [Google Scholar]
- Yang Y, Xiong X, Chen J, Peng X, Chen D, Pan F. Research advances of magnesium and magnesium alloys worldwide in 2022. J. Magnes. Alloys 2023, 11, 2611–2654. DOI:10.1016/j.jma.2023.07.011 [Google Scholar]
- Zhang J, Miao J, Balasubramani N, Cho DH, Avey T, Chang CY, et al. Magnesium research and applications: Past, present and future. J. Magnes. Alloys 2023, 11, 3867–3895. DOI:10.1016/j.jma.2023.11.007 [Google Scholar]
- Zhang Z, Yu J, Xue Y, Dong B, Zhao X, Wang Q. Recent research and development on forming for large magnesium alloy components with high mechanical properties. J. Magnes. Alloys 2023, 11, 4054–4081. DOI:10.1016/j.jma.2023.09.038 [Google Scholar]
- Xu T, Yang Y, Peng X, Song J, Pan F. Overview of advancement and development trend on magnesium alloy. J. Magnes. Alloys 2019, 7, 536–544. DOI:10.1016/j.jma.2019.08.001 [Google Scholar]
- Yang Y, Xiong X, Chen J, Peng X, Chen D, Pan F. Research advances in magnesium and magnesium alloys worldwide in 2020. J. Magnes. Alloys 2021, 9, 705–747. DOI:10.1016/j.jma.2021.04.001 [Google Scholar]
- Park SH, Kim YJ, Kim HJ, Jin SC, Lee JU, Komissarov A, et al. Recent research progress on magnesium alloys in Korea: A review. J. Magnes. Alloys 2023, 11, 3545–3584. DOI:10.1016/j.jma.2023.08.007 [Google Scholar]
- Liu B, Yang J, Zhang X, Yang Q, Zhang J, Li X. Development and application of magnesium alloy parts for automotive OEMs: A review. J. Magnes. Alloys 2023, 11, 15–47. DOI:10.1016/j.jma.2022.12.015 [Google Scholar]
- Johari NA, Alias J, Zanurin A, Mohamed NS, Alang NA, Zain MZM. Anti-corrosive coatings of magnesium: A review. Mater. Today Proc. 2022, 48, 1842–1848. DOI:10.1016/j.matpr.2021.09.192 [Google Scholar]
- Wu T, Zhang K. Corrosion and protection of magnesium alloys: Recent advances and future perspectives. Coatings 2023, 13, 1533. DOI:10.3390/coatings13091533 [Google Scholar]
- Hu H, Nie X, Ma Y. Corrosion and surface treatment of magnesium alloys. In Magnesium Alloys: Properties in Solid and Liquid States; Czerwinski F, Ed.; InTech: Rijeka, Croatia, 2014; pp. 67–108. [Google Scholar]
- Sikdar S, Menezes PV, Maccione R, Jacob T, Menezes PL. Plasma Electrolytic Oxidation (PEO) process-processing, properties, and applications. Nanomaterials 2021, 11, 1375. DOI:10.3390/nano11061375 [Google Scholar]
- Kaseem M, Kamil MP, Ko YG. Electrochemical response of MoO2-Al2O3 oxide films via plasma electrolytic oxidation. Surf. Coat. Technol. 2017, 322, 163–173. DOI:10.1016/j.surfcoat.2017.05.051 [Google Scholar]
- Kaseem M, Min JH, Ko YG. Corrosion behavior of Al-1wt% Mg-0.85wt%Si alloy coated by micro-arc-oxidation using TiO2 and Na2MoO4 additives: Role of current density. J. Alloys Compd. 2017, 723, 448–455. DOI:10.1016/j.jallcom.2017.06.275 [Google Scholar]
- Kaseem M, Zehra T, Hussain T, Ko YG, Fattah-alhosseini A. Electrochemical response of MgO/Co3O4 oxide layers produced by plasma electrolytic oxidation and post treatment using cobalt nitrate. J. Magnes. Alloys 2023, 11, 1057–1073. DOI:10.1016/j.jma.2022.08.008 [Google Scholar]
- Keyvani A, Kamkar N, Chaharmahali R, Bahamirian M, Kaseem M, Fattah-alhosseini A. Improving anti-corrosion properties AZ31 Mg alloy corrosion behavior in a simulated body fluid using plasma electrolytic oxidation coating containing hydroxyapatite nanoparticles. Inorg. Chem. Commun. 2023, 158, 111470. DOI:10.1016/j.inoche.2023.111470 [Google Scholar]
- Mozafarnia H, Fattah-Alhosseini A, Chaharmahali R, Nouri M, Keshavarz MK, Kaseem M. Corrosion, Wear, and Antibacterial Behaviors of Hydroxyapatite/MgO Composite PEO Coatings on AZ31 Mg Alloy by Incorporation of TiO2 Nanoparticles. Coatings 2022, 12, 1967. DOI:10.3390/coatings12121967 [Google Scholar]
- Zehra T, Kaseem M. Recent advances in surface modification of plasma electrolytic oxidation coatings treated by non-biodegradable polymers. J. Mol. Liq. 2022, 365, 120091. DOI:10.1016/j.molliq.2022.120091 [Google Scholar]
- Dong X, Xia M, Wang F, Yang H, Ji G, Nyberg EA, et al. A super wear-resistant coating for Mg alloys achieved by plasma electrolytic oxidation and discontinuous deposition. J. Magnes. Alloys 2023, 11, 2939–2952. DOI:10.1016/j.jma.2023.08.003 [Google Scholar]
- Yang C, Chen P, Wu W, Sheng L, Zheng Y, Chu PK. A review of corrosion-resistant PEO coating on Mg alloy. Coatings 2024, 14, 451. DOI:10.3390/coatings14040451 [Google Scholar]
- Ma Y, Nie X, Northwood DO, Hu H. Corrosion and erosion properties of silicate and phosphate coatings on magnesium. Thin Solid Films 2004, 469–470, 472–477. DOI:10.1016/j.tsf.2004.06.168 [Google Scholar]