Modafinil Suppresses Hypertrophic Scar Formation by Inhibiting Adenosine Deaminase and Activating Adenosine Signaling

Modafinil Suppresses Hypertrophic Scar Formation by Inhibiting Adenosine Deaminase and Activating Adenosine Signaling
Shinkyu Choi 1 Ji-Aee Kim 1 Kwan-Change Kim 2,* Suk-Hyo Suh 1,*
Received: 22 December 2025 Revised: 07 January 2026 Accepted: 15 January 2026 Published: 20 January 2026

© 2026 The authors. This is an open access article under the Creative Commons Attribution 4.0 International License (https://creativecommons.org/licenses/by/4.0/).
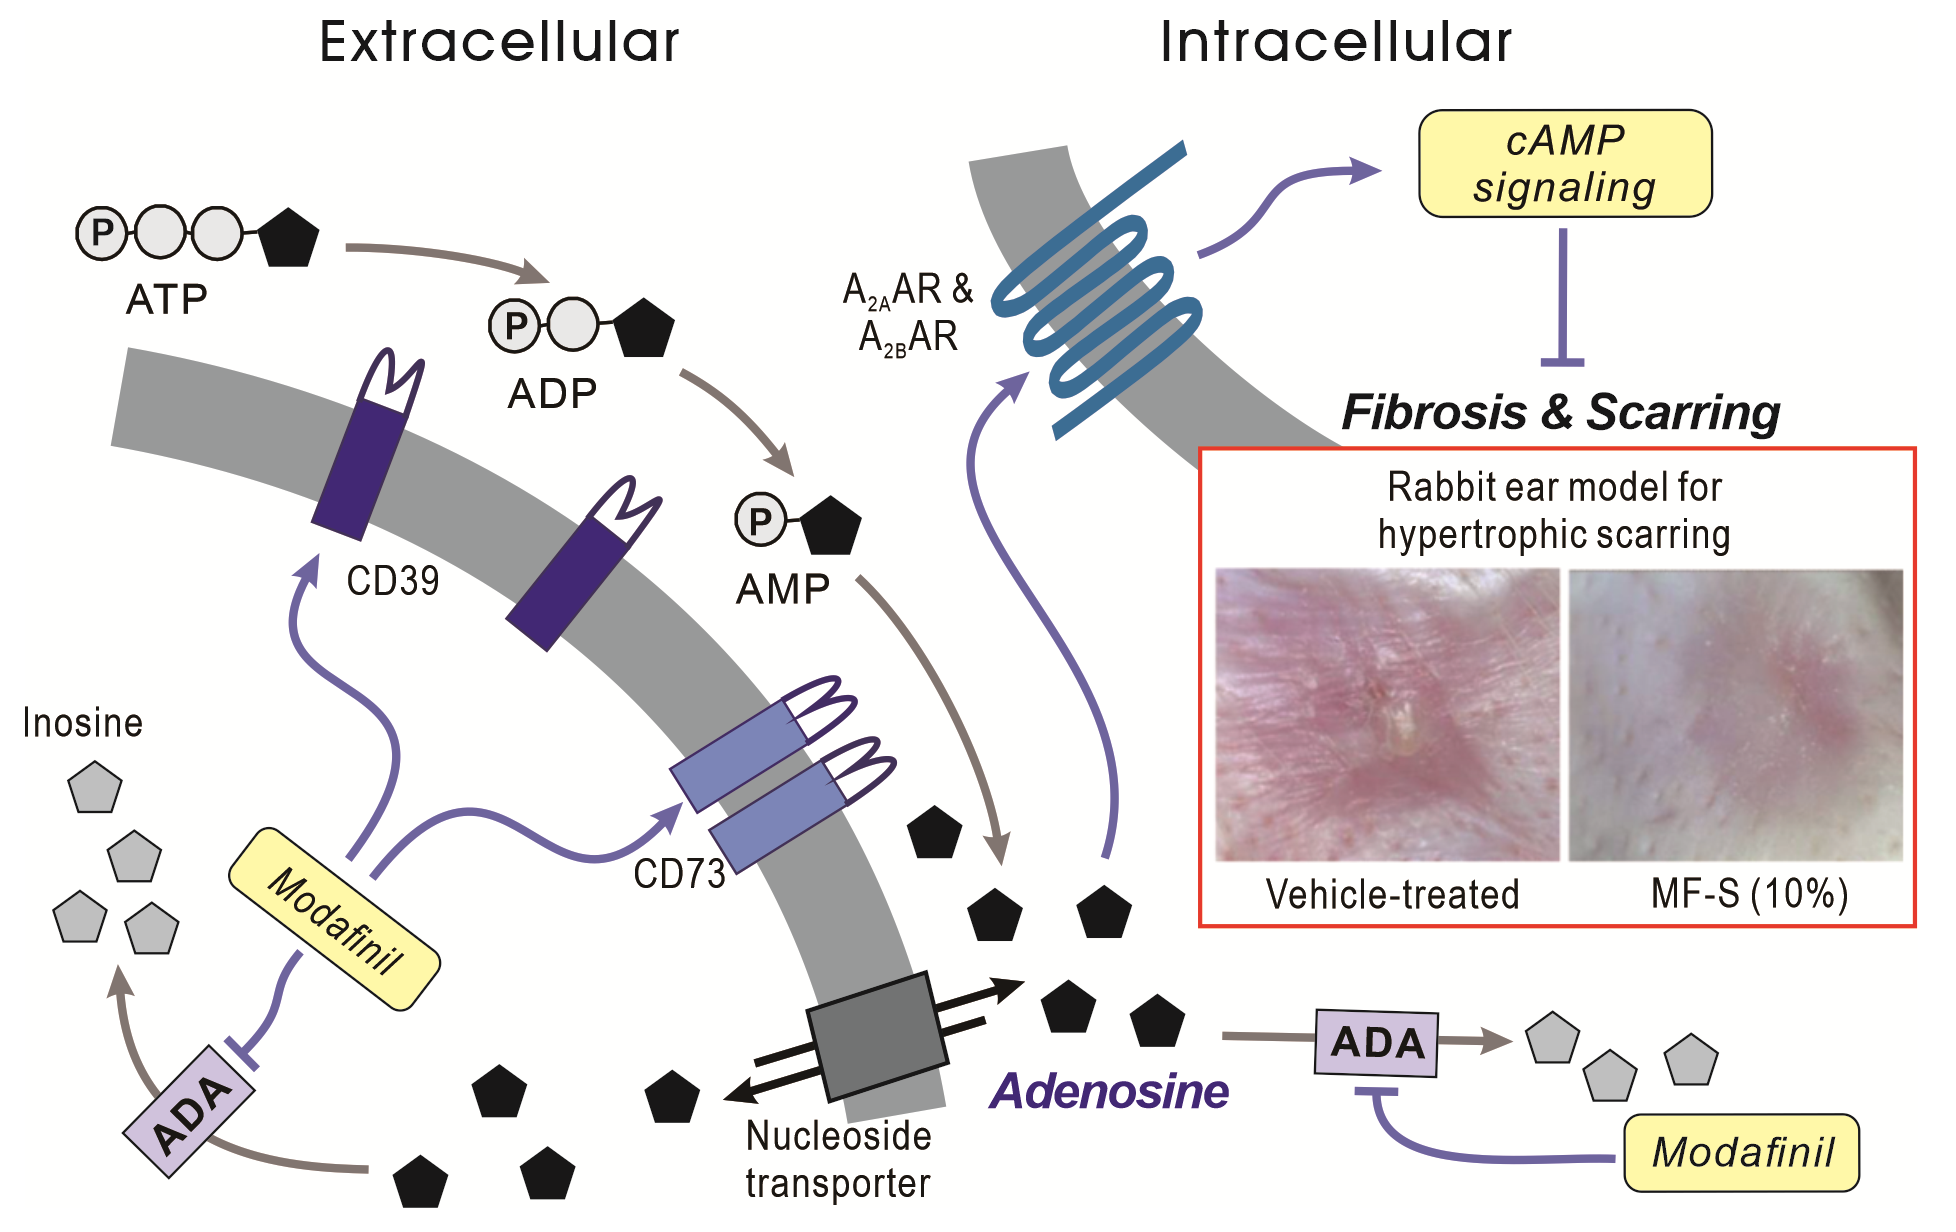
Graphical Abstract
1. Introduction
Modafinil (MF) is a widely used wake-promoting compound initially developed for the management of sleep-wake disorders such as narcolepsy [1]. Its clinical utility has since expanded to conditions including chronic fatigue syndrome, attention deficit hyperactivity disorder, cocaine dependence, and obesity [2,3,4,5,6]. MF is also recognized for enhancing attention, learning, and other cognitive domains, and exhibits notable neuroprotective properties [1,5,7,8].
Recent work has highlighted an additional biological profile of MF: robust anti-inflammatory and anti-fibrotic activity across diverse experimental systems [9,10,11,12]. MF has been shown to limit ischemia–reperfusion injury [13,14,15] and reduce inflammation in models of testicular torsion [16], inflammatory bowel disease [17], multiple sclerosis [18], and inflammatory liver disease [11]. In clinical settings, prolonged MF administration (three years or more) has been associated with slower disability progression in patients with multiple sclerosis [19]. Mechanistically, MF diminishes immune cell infiltration [11,18] and reduces circulating pro-inflammatory cytokines, including interleukin 1β, interleukin 6, and tissue necrosis factors [11,14,17,20]. Beyond immunomodulation, MF suppresses fibrogenic pathways such as hepatic stellate cell activation in liver fibrosis [11] and fibroblast activation in pulmonary fibrosis models [10]. Collectively, these findings indicate that MF regulates fibroblast and immune cell activation, proliferation, infiltration, and their production of inflammatory and fibrogenic mediators. Despite these broad actions, the primary molecular target(s) responsible for MF’s anti-inflammatory and anti-fibrotic effects remain incompletely defined.
Current evidence indicates that MF is associated with increased cAMP signaling involving the A2A and A2B adenosine receptor (A2AAR and A2BAR) [10,21,22]. The cAMP cascade serves as a key endogenous regulator of inflammation and fibrosis through its downstream effectors, exchange protein directly activated by cAMP (Epac) and protein kinase A (PKA) [23,24,25,26,27]. MF has been shown to inhibit KCa3.1 currents via PKA [22] and to reduce expression of KCa3.1 and KCa2.3 through Epac–dependent mechanisms [11]. Alterations in these channels closely align with fibrotic phenotypes, as decreased Epac signaling and subsequent increases in KCa3.1 expression have been documented in various human and experimental fibrotic conditions, including transforming growth factor-β (TGFβ)-stimulated human hepatic stellate cells [11,28]. Conversely, activation of Epac or inhibition of KCa3.1 attenuates inflammatory and fibrotic responses [11,28,29,30]. Although these data strongly implicate cAMP signaling in MF’s therapeutic actions, the upstream trigger responsible for MF-induced cAMP elevation and AR engagement remains unresolved. To address this gap, we examined the hypothesis that MF increases local adenosine availability by inhibiting adenosine deaminase (ADA), thereby initiating A2AAR/A2BAR–dependent cAMP signaling in fibroblasts and immune cells.
2. Materials and Methods
2.1. Chemicals
The S- and R-isomers of MF (MF-S and MF-R) were synthesized by Cellion Biomed Inc. (Daejeon, Republic of Korea) according to a previously described protocol [31]. The PKA inhibitor H-89, the KCa3.1 channel blocker TRAM-34, and TGFβ were purchased from Sigma-Aldrich (St. Louis, MO, USA). The KCa3.1 channel activator 1-ethyl-2-benzimidazolinone (1-EBIO) and the non-selective AR agonist 5′-N-Ethylcarboxamidoadenosine (NECA) were obtained from Tocris Bioscience (Minneapolis, MN, USA). The CD73 inhibitor AB680 was purchased from MedChemExpress (Monmouth Junction, NJ, USA). Contractubex® Gel was obtained from Merz Therapeutics (Frankfurt, Germany). Unless otherwise specified, all other reagents were obtained from Sigma-Aldrich. MF-S, MF-R, TRAM-34, and 1-EBIO were initially dissolved in dimethyl sulfoxide (DMSO), and working solutions were prepared in distilled water with a final DMSO concentration of 0.5%.
2.2. Cell Culture and Treatment
Primary human lung fibroblasts from a normal adult (NHLFs) were purchased from Lonza (Basel, Switzerland). HFL-1 human fibroblast cell line from human fetal lung tissue (CCL-153), NIH-3T3 murine fibroblasts (CRL-2795), and Jurkat T cells (clone E6-1) were obtained from the American Type Culture Collection (ATCC; Manassas, VA, USA). NHLFs and HFL-1 cells were maintained in FGM-2 (Lonza, CC-3131) and F-12K medium (ATCC 30-2004), respectively. NIH-3T3 cells were cultured in DMEM (Hyclone, Logan, UT, USA) supplemented with 10% fetal bovine serum (FBS), 100 U/mL penicillin, and 100 μg/mL streptomycin. Jurkat T cells were maintained in DMEM/F12 medium (Thermo Fisher Scientific, Seoul, Republic of Korea) with 10% FBS and 80 U/mL penicillin and 80 μg/mL streptomycin. All cell lines were incubated at 37 °C in a humidified 5% CO2 atmosphere. Medium was replaced twice weekly, and cells were subcultured every 7 days.
2.3. MF-S Ointment Preparation
MF-S dissolved in DMSO was incorporated into ointment formulations consisting of pure petroleum jelly and liquid paraffin at ratios of 1:7:2, 0.5:7.5:2, 0.1:7.9:2, and 0.03:7.97:2. The ointment base (petroleum jelly:liquid paraffin = 8:2) served as the placebo control.
2.4. Hypertrophic Scar Model with New Zealand White Rabbits
New Zealand White rabbits (n = 10; 2.6–3.0 kg) were obtained from Koatech (Pyeongtaek-si, Republic of Korea) and maintained under controlled environmental conditions (16–22 °C, 40–60% humidity, <60 dB noise, positive pressure, 12-h light/dark cycle). Animals were anesthetized with intramuscular administration of alfaxan (6 mg/kg) and Rompun (5 mg/kg). Hypertrophic scars were induced by generating full-thickness excisional wounds (8-mm biopsy punch) extending through the epidermis, dermis, and perichondrium on the ventral surface of each ear (four wounds per ear). After postoperative disinfection, wounds were left to heal spontaneously for 4 weeks.
Scar maturation and re-epithelialization were confirmed by gross inspection. Scars were allocated to eight groups (six scars per group): one placebo, four MF-S (0.3%, 1%, 5%, 10%), one Contractubex (positive control), and one negative control. Treatments were applied topically once daily for 4 weeks (0.05 mL per scar). At the end of treatment, rabbits were euthanized, and scar tissues were harvested, fixed in 10% neutral-buffered formalin, and processed for histological evaluation.
2.5. Macroscopic Assessment of Hypertrophic Scarring
Macroscopic imaging of each scar site was performed at baseline (initiation of treatment) and week 4 using a dermatoscope (Folliscope PS, Lead M, Seoul, Republic of Korea). Hypertrophic scar severity was graded according to the following criteria (Table 1).
Table 1. Hypertrophic Scar Grading Criteria.
|
Score |
Skin Response Description |
|---|---|
|
0 |
Normal, pliable scar |
|
1 |
Slightly elevated and mildly firm |
|
2 |
Moderately raised with noticeable firmness |
|
3 |
Markedly raised and firm |
2.6. Histopathology
Formalin-fixed tissues were dehydrated, embedded in paraffin, and sectioned at 3-μm slices. Sections were stained with hematoxylin and eosin (H&E) or Masson’s Trichrome (DAKO, Santa Clara, CA, USA). Measurements were performed using the Zeiss ZEN microscope software (version 2.1; Carl Zeiss AG, Oberkochen, Germany). Measurements included epidermis-to-cartilage distance at the thickest point of each scar, epidermal thickness, and the corresponding distance in adjacent normal skin. The scar elevation index was calculated as the ratio of the epidermis-to-cartilage distance at the thickest point of the scar to that of normal skin. Collagen deposition was quantified from 400× images using ImageJ (version 1.54k; National Institutes of Health, Bethesda, MD, USA) by measuring the proportion of blue-stained collagen.
2.7. Measurement of cAMP, Adenosine, and ADA Activity
Cells were treated with MF-S for 10 min prior to analysis. Intracellular cAMP levels were measured using a cAMP assay kit (R&D Systems, Minneapolis, MN, USA). Extracellular and intracellular adenosine concentrations were determined using a human adenosine ELISA kit (MyBioSource, San Diego, CA, USA). Purified ADA from calf intestine or cultured cells was treated with MF-S, and ADA enzymatic activity was subsequently measured using an ADA activity assay kit (Abcam, Cambridge, UK). ADA activity was determined using an ADA activity assay kit (Abcam, Cambridge, UK). Purified ADA from calf intestine was incubated with MF-S at the indicated concentrations prior to enzymatic analysis. For cellular measurements, cells were treated with MF-S for 10 min, lysed, and ADA activity was measured in the cell lysates.
2.8. Western Blotting
Cells were rinsed with ice-cold PBS and lysed in protein extraction buffer containing protease inhibitors. Protein concentrations were determined using the Bradford assay. Lysates (30 μg protein) were separated by SDS-PAGE and transferred to nitrocellulose membranes. After blocking with 5% bovine serum albumin in TBST for 1 h, membranes were incubated overnight at 4 °C with primary antibodies and for 1 h with HRP-conjugated secondary antibodies. Primary antibodies included Epac1 (sc-28366), Epac2 (sc-28326), and GAPDH (sc-25778) from Santa Cruz Biotechnology (Santa Cruz, CA, USA); collagen 1α (Col1, #66948) from Cell Signaling Technology (Danvers, MA, USA); CD39 (PA5-86969) and CD73 (PA5-29750) from Thermo Fisher Scientific; and Smad4 (ab40759) from Abcam. Signals were detected by chemiluminescence, and band intensities were analyzed using LAS-4000 mini and IMAGE GAUGE software (version 1.2; Fuji Film, Minato-ku, Tokyo, Japan).
2.9. Electrophysiology
Whole-cell patch-clamp recordings were performed on NIH-3T3 cells using an EPC-9 amplifier (HEKA Elektronik, Lambrecht, Germany). Cells were voltage-clamped at 0 mV, and 650-ms voltage ramps from −100 to +100 mV were applied every 10 s. The extracellular solution contained (in mM): 150 NaCl, 6 KCl, 1.5 CaCl2, 1 MgCl2, 10 HEPES, and 10 glucose, with the pH adjusted to 7.4 using NaOH. The pipette solution contained (in mM): 40 KCl, 100 K-aspartate, 2 MgCl2, 0.1 EGTA, 4 Na2ATP, and 10 HEPES, with the pH adjusted to 7.2 using KOH. KCa3.1 currents were activated by loading 1 μM Ca2+ through the patch pipette and adding 1-EBIO (100 μM) to the bath solution.
2.10. AR Binding Assay
Competitive radioligand binding assays were used to evaluate MF binding to A1, A2A, A2B, and A3 ARs, using membrane preparations and subtype-specific [3H] radioligands. MF was serially diluted (8-point, 4-fold series) starting at 2 mM. Reference ligands were similarly prepared. After incubation (1 h for A1/A3; 2 h for A2A/A2B), samples were filtered through pre-treated GF/C plates, washed, dried, and analyzed using a MicroBeta2 counter. Percent inhibition was calculated relative to background-corrected high-control values. The half-maximal inhibitory concentration (IC50) values were determined by nonlinear regression and subsequently converted to Ki according to the Cheng–Prusoff equation [32].
2.11. Statistical Analysis
Data are presented as mean ± standard error of the mean (SEM). Statistical differences were evaluated using one-way ANOVA followed by Bonferroni’s post hoc test or a two-tailed Student’s t-test. A p-value < 0.05 was considered statistically significant.
3. Results
3.1. MF Isomers Activate cAMP Signaling in Cells
Previous studies have shown that racemic modafinil (MF) increases intracellular cAMP levels in fibroblasts, vascular smooth muscle cells, and osteoblasts [21,22]. Based on these findings, we investigated whether the individual enantiomers, MF-S and MF-R, similarly elevate cAMP levels in fibroblasts, and we compared the effect of MF-S with that of NECA, a potent, non-selective AR agonist. Treatment of primary human lung fibroblasts (NHLFs) with MF-S for 10 min resulted in a concentration–dependent increase in intracellular cAMP levels (Figure 1A, left panel). NECA (Figure 1A, middle panel) and MF-R (Figure 1A, right panel) induced comparable increases in cAMP. At a concentration of 100 nM, MF-S did not differ significantly from either NECA or MF-R in its capacity to elevate intracellular cAMP levels. Because cAMP signaling inhibits KCa3.1 activity via PKA activation, we next examined whether MF-S and MF-R suppress KCa3.1 currents in NIH-3T3 fibroblasts (Figure 1B–D). Outward currents were elicited by intracellular application of 1 μM Ca2+ via the patch pipette and subsequent stimulation with 100 μM 1-EBIO in the bath solution. These currents were markedly reduced by the selective KCa3.1 blocker TRAM-34 (10 μM) (Figure 1D), confirming their identity as KCa3.1–mediated currents. Both MF-S and MF-R inhibited KCa3.1 currents in a concentration–dependent manner (Figure 1B,C). The IC50 values were 5.5 ± 0.6 nM for MF-S and 11.1 ± 1.5 nM for MF-R. Importantly, pretreatment with the PKA inhibitor H-89 abolished the inhibitory effect of MF-S on KCa3.1 currents (Figure 1C), indicating that MF-S–induced KCa3.1 inhibition is mediated through a PKA–dependent mechanism.
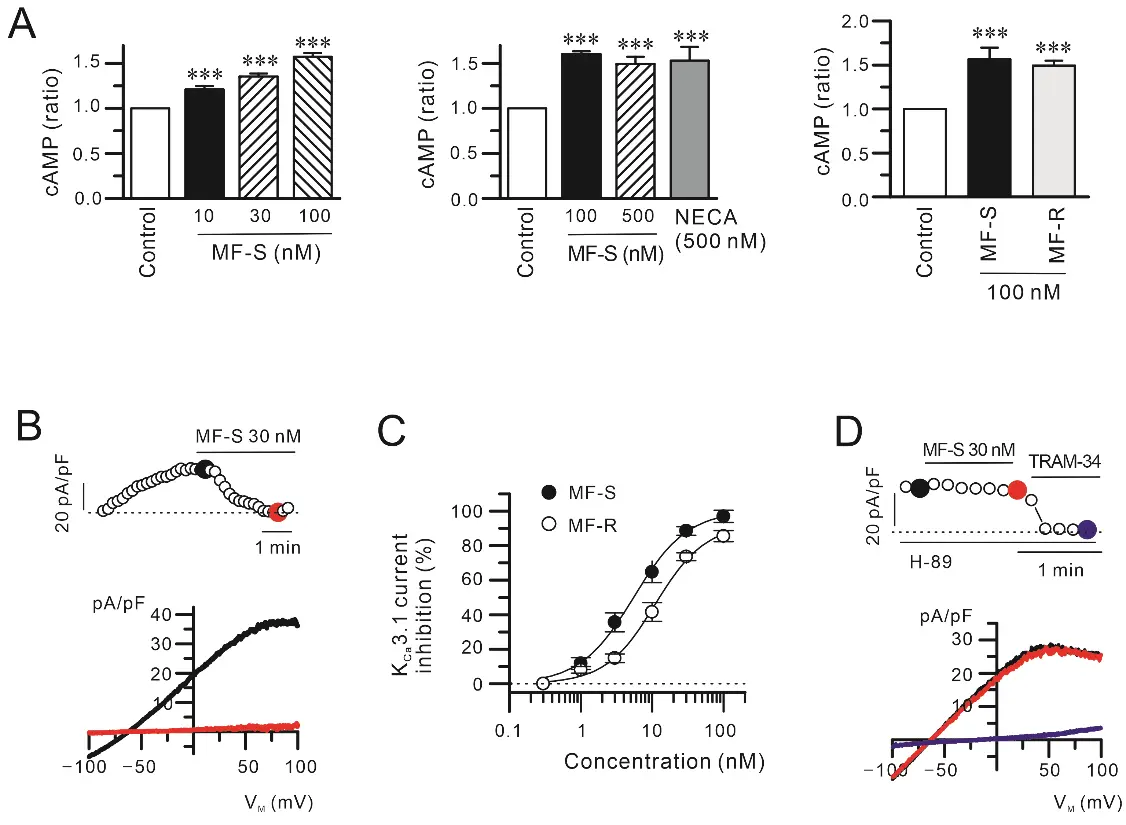
Figure 1. MF isomers stimulate cAMP signaling and suppress KCa3.1 channel activity in fibroblasts. (A) The MF isomers MF-S and MF-R significantly elevated intracellular cAMP levels in primary human lung fibroblasts (NHLFs). Cells were treated with MF for 10 min in incomplete media. The magnitude of cAMP induction by MF isomers was comparable to that elicited by the non-selective adenosine receptor agonist NECA. (B–D) KCa3.1 currents were recorded in NIH-3T3 fibroblasts following intracellular Ca2+ loading (1 μM) and stimulation with 1-EBIO (100 μM). (B) Application of MF-S or MF-R markedly reduced KCa3.1 current amplitudes. The upper panels show time–dependent current density measured at +50 mV during repeated voltage ramps, while the corresponding current–voltage (I–V) relationships obtained at the indicated time points are displayed in the lower panels. (C) Concentration–response analysis demonstrating concentration–dependent inhibition of KCa3.1 currents by MF-S and MF-R, expressed as a percentage of the initial current density measured at +50 mV. (D) Pretreatment with the PKA inhibitor H-89 abolished MF-S–mediated suppression of KCa3.1 currents, indicating a cAMP/PKA–dependent mechanism. Each point represents the mean ± SEM of 5–8 separate experiments (n = 5–8). *** p < 0.001 vs. control.
3.2. MF Isomers Do Not Directly Interact with Adenosine Receptors
Previous reports have suggested that MF and MF-S activate cAMP signaling via A2AAR and A2BAR [10,21]. To determine whether MF-S and MF-R directly engage ARs, we performed competitive radioligand binding assays using membrane preparations from HEK293 or CHO-K1 cells stably expressing individual human AR subtypes (HEK293/A1AR/Gα15, CHO/A2AAR/Gα15, HEK293/A2BAR/Gα15, CHO/A3AR/Gα15). These assays revealed that both MF-S and MF-R exhibit very low or undetectable binding affinity for all tested AR subtypes (Table 2). These findings indicate that the cAMP-elevating effects of MF-S and MF-R are unlikely to be attributable to direct agonistic interactions with ARs.
Table 2. Summary of AR binding assay.
|
A1AR |
A2AAR |
A2BAR |
A3AR |
|||||
|---|---|---|---|---|---|---|---|---|
|
IC50 (nM) |
Ki (nM) |
IC50 (nM) |
Ki (nM) |
IC50 (nM) |
Ki (nM) |
IC50 (nM) |
Ki (nM) |
|
|
MF-R |
>10,000 |
>6163.4 |
>10,000 |
>8878.9 |
>10,000 |
>8999.4 |
>10,000 |
>8059.8 |
|
MF-S |
>10,000 |
>6163.4 |
>10,000 |
>8878.9 |
>10,000 |
>8999.4 |
>10,000 |
>8059.8 |
|
CGS15943 |
2.928 |
1.805 |
1.726 |
1.533 |
8.325 |
7.492 |
57.60 |
46.424 |
MF-R, R-isomer of modafinil; MF-S, S-isomer of modafinil; AR, adenosine receptor; A1AR, A1 adenosine receptor; A2AAR, A2A adenosine receptor; A2BAR, A2B adenosine receptor; A3AR, A3 adenosine receptor. The non-selective AR antagonist CGS15943 was used as a positive control.
3.3. MF-S Activates Adenosine–cAMP Signaling
Adenosine increases intracellular cAMP through activation of A2AAR and A2BAR. Extracellular adenosine is generated from ATP via the sequential enzymatic actions of the ectonucleotidases CD39 and CD73 [33], whose expression and activity are known to be positively regulated by cAMP [34,35]. On this basis, we investigated whether MF-S modulates CD39 and CD73 expression. Exposure of human lung fibroblasts (NHLFs and HLF-1) to MF-S (100 nM) for 24 h resulted in a marked increase in the protein expression of CD39 (Figure 2A) and CD73 (Figure 2B).
Because extracellular adenosine is subsequently transported into cells via nucleoside transporters [36], we examined intracellular adenosine levels following MF-S treatment. Short-term exposure (10 min) to MF-S significantly increased intracellular adenosine concentrations in both NHLFs and Jurkat T cells (Figure 3). Kinetic analysis using Hill’s equation revealed that the concentration required to elicit the half-maximal effective concentration (EC50) for MF-S–induced adenosine elevation was 18.37 ± 15.17 nM in NHLFs and 12.9 ± 5.9 nM in Jurkat cells (Figure 3, right panels). MF-S also increased adenosine levels in Jurkat cell supernatant (data not shown).
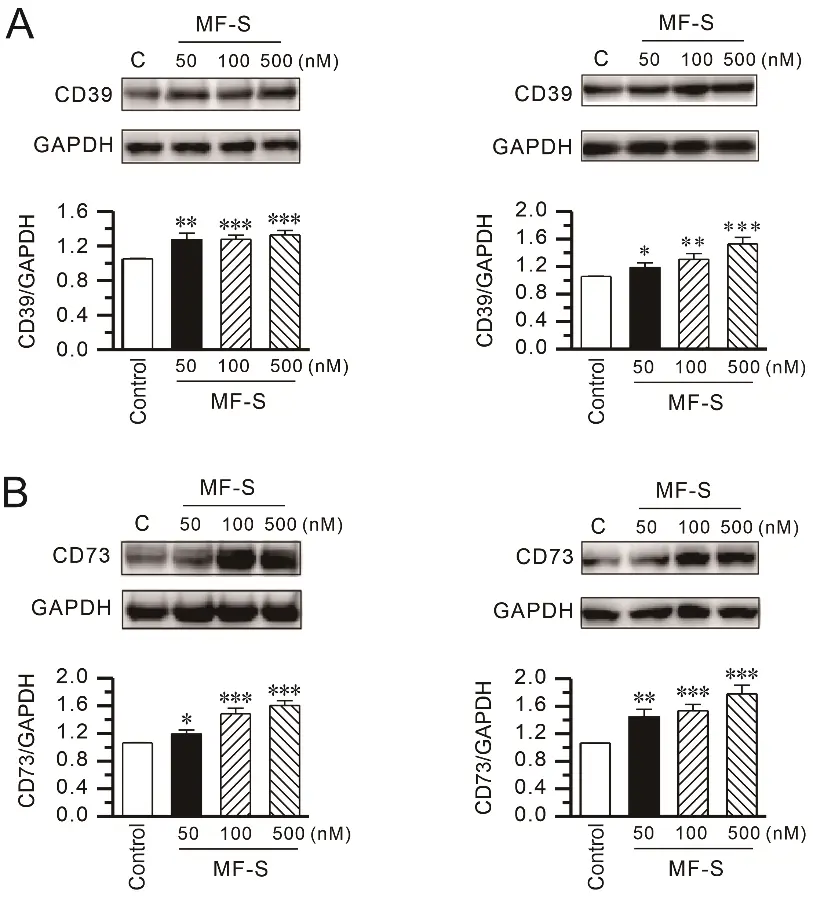
Figure 2. MF-S enhances CD39 and CD73 protein expression in lung fibroblasts. (A,B) Protein expression of the ectonucleotidases CD39 (A) and CD73 (B) was examined by Western blot analysis in primary normal human lung fibroblasts (NHLFs; left panels) and human fibroblast cell line HFL-1 cells (right panels) following treatment with MF-S at the indicated concentrations. MF-S increased CD39 and CD73 protein levels in a concentration–dependent manner in both fibroblast types. Densitometric values were normalized to GAPDH and expressed relative to the control. Each point represents the mean ± SEM of 5–9 separate experiments (n = 5–9). * p < 0.05, ** p < 0.01, *** p < 0.001 vs. control.
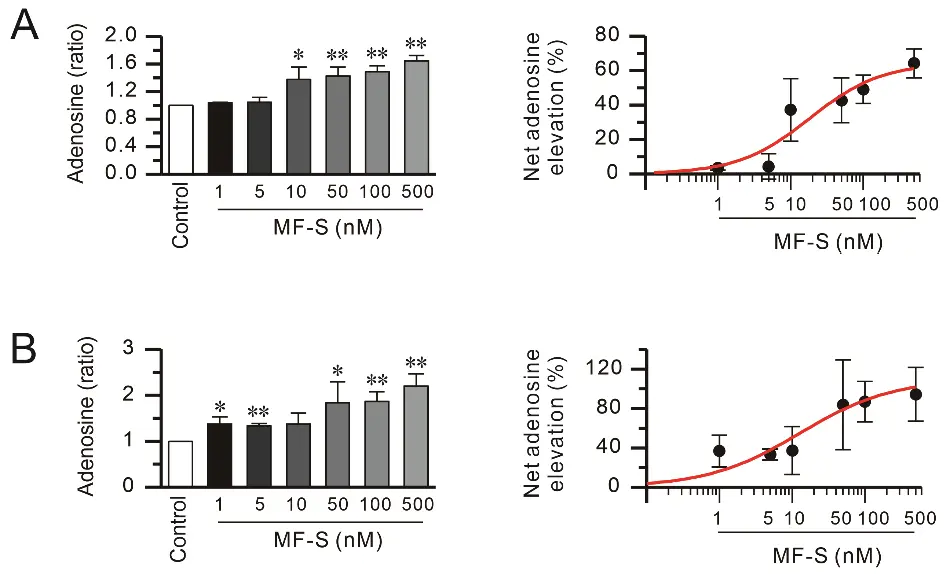
Figure 3. MF-S increases intracellular adenosine levels in fibroblasts and immune cells. Intracellular adenosine content was quantified in cell lysates from NHLFs (A) and Jurkat T cells (B) following treatment with MF-S at the indicated concentrations. Short-term exposure to MF-S (10 min) under serum-reduced conditions resulted in a significant, concentration–dependent elevation of intracellular adenosine levels in both cell types. Left panels show intracellular adenosine levels expressed as fold change relative to control, while right panels depict the net increase in adenosine, calculated as the percentage change from baseline. Data are expressed as the mean ± SEM from 3–8 independent experiments (n = 3–8). * p < 0.05, ** p < 0.01 vs. control.
To determine whether adenosine generation is required for MF-S–induced cAMP signaling, we examined the effect of the selective CD73 blocker AB680 on MF-S–mediated cAMP signaling. AB680 (1 nM) alone did not alter intracellular cAMP levels or Epac1 and Epac2 expression, whereas MF-S (100 nM) treatment significantly increased all three parameters. Notably, co-treatment with AB680 effectively abolished MF-S–induced increases in cAMP, Epac1, and Epac2 (Figure 4A,B). In addition, MF-S reversed TGFβ–induced Col1 upregulation in NHLFs (Figure 4C), an effect that was also blocked by AB680. These findings indicate that MF-S activates cAMP signaling predominantly through enhanced adenosine production.
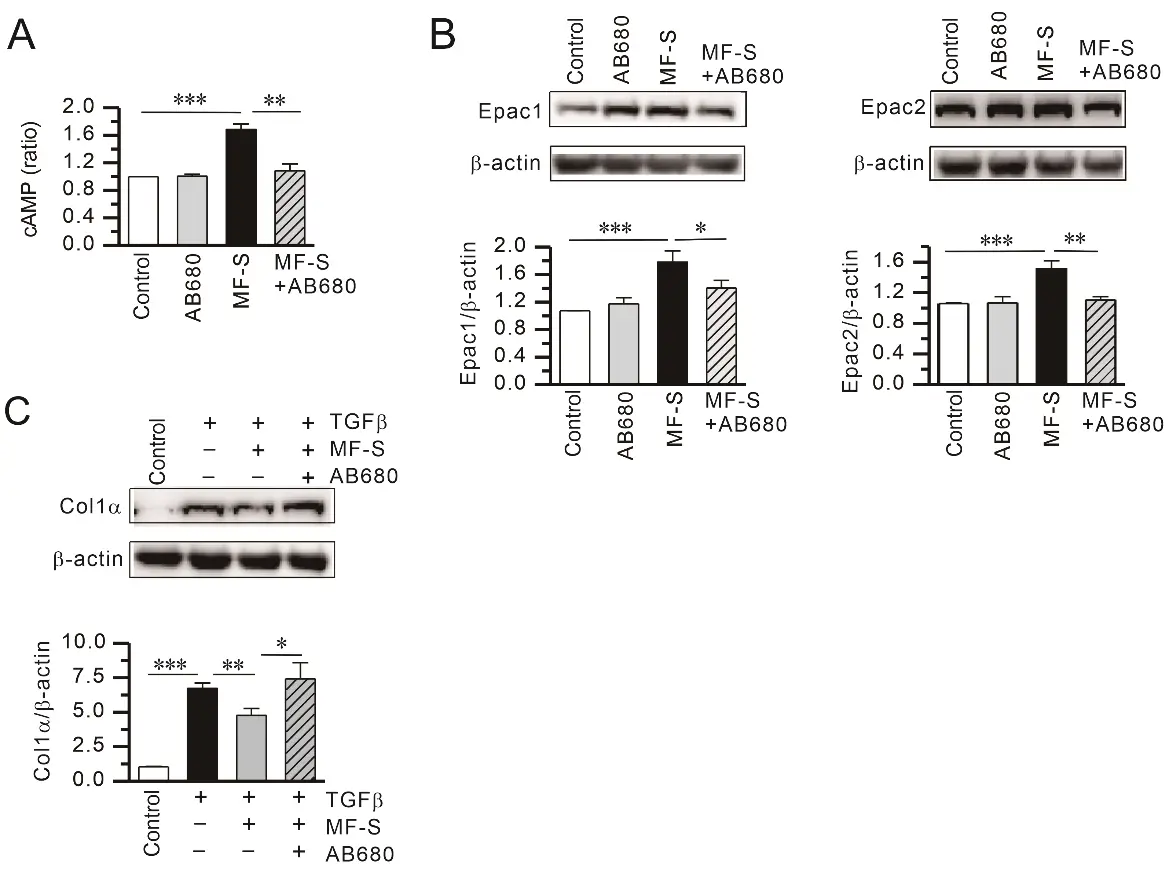
Figure 4. Inhibition of CD73–dependent adenosine production attenuates MF-S–mediated cAMP signaling and anti-fibrotic responses. (A) MF-S significantly increased intracellular cAMP levels, an effect that was abolished by co-treatment with the CD73 inhibitor AB680. (B) MF-S enhanced protein expression of the cAMP downstream effectors Epac1 and Epac2, whereas pharmacological blockade of CD73 with AB680 markedly reduced these responses. (C) MF-S suppressed TGFβ–induced Col1 production, and this inhibitory effect was reversed in the presence of AB680. Representative immunoblots are shown, with quantitative densitometric analyses normalized to β-actin. Data are presented as mean ± SEM from 4–9 independent experiments (n = 4–9). Data are presented as the mean ± SEM values. * p < 0.05, ** p < 0.01, *** p < 0.001 vs. the respective group compared.
Because Smad4 is a central mediator of TGFβ–driven fibrotic signaling [37], we next examined its expression. TGFβ treatment for 24 h increased Smad4 protein levels, whereas co-treatment with MF-S markedly attenuated this effect (Supplementary Figure S1). These results suggest that MF-S suppresses profibrotic signaling downstream of TGFβ. We therefore evaluated the anti-fibrotic effects of MF-S in an in vivo model.
3.4. MF-S Attenuates Hypertrophic Scarring in a Rabbit Ear Model
Given our previous findings that MF or MF-S suppresses fibrosis in murine models of liver and lung fibrosis, we assessed the therapeutic efficacy of MF-S in a rabbit ear model of hypertrophic scarring. Unlike murine fibrosis models, this model allows pharmacological intervention after the inflammatory phase has largely subsided. Topical administration of MF-S significantly reduced scar formation. Macroscopic scar scores, scar elevation indices, epidermal thickness, and collagen density were all markedly increased in untreated scars but were significantly attenuated by MF-S treatment (Figure 5). The anti-scar effects of MF-S were comparable to those observed with Contractubex, a clinically used positive control.
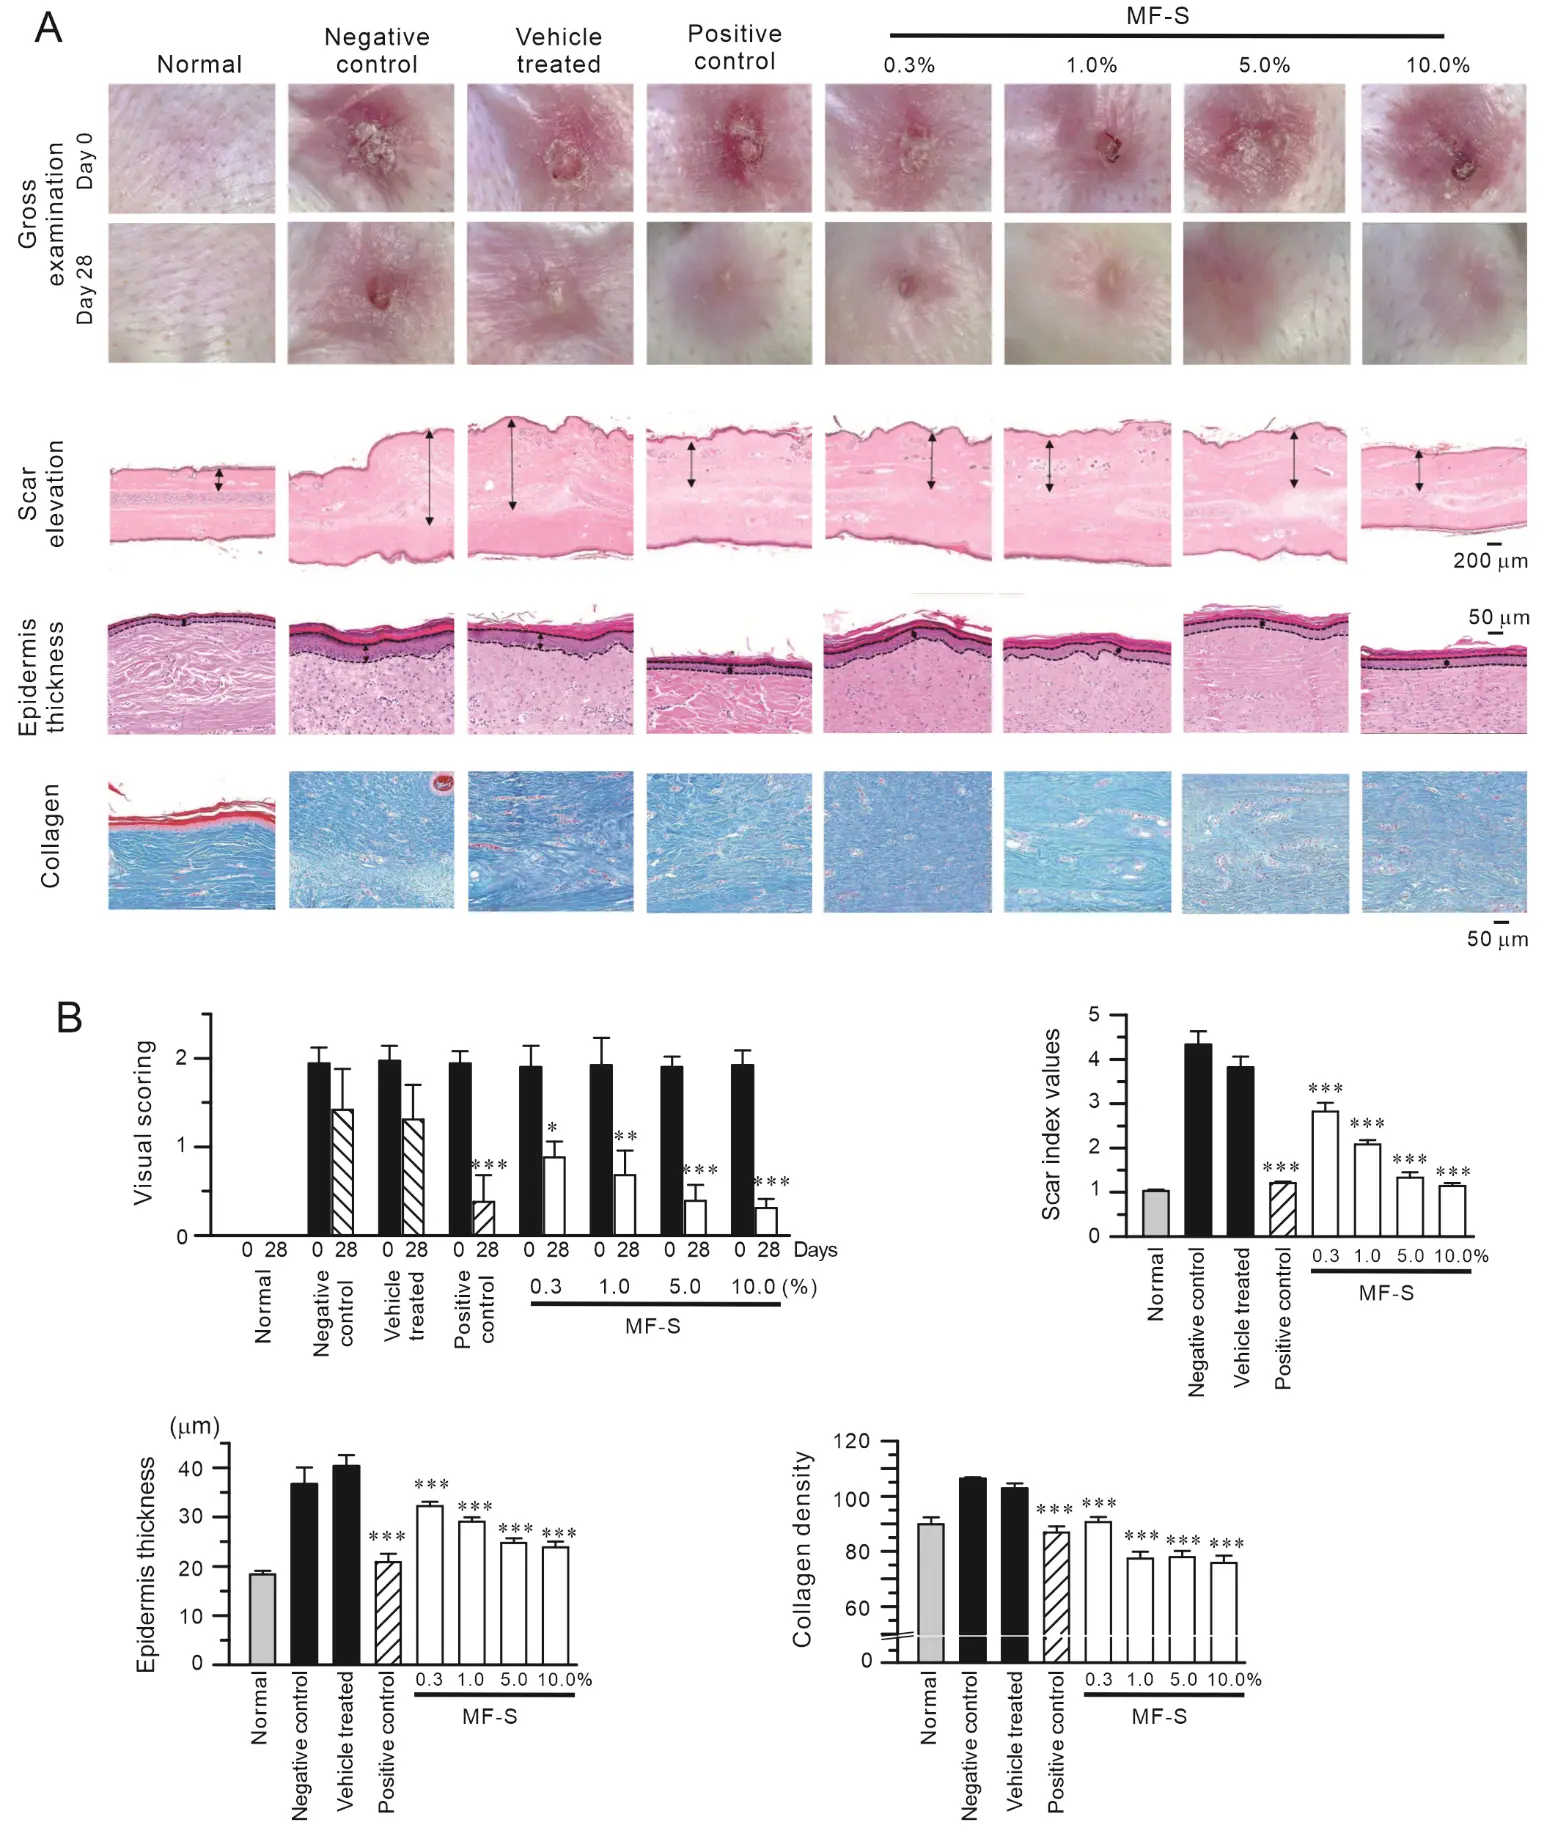
Figure 5. MF-S reduces hypertrophic scar formation in a rabbit ear wound model. (A) Representative gross and histological images of rabbit ear scars from normal, negative control, vehicle-treated, positive control, and MF-S-treated groups at the indicated concentrations. Scar elevation and epidermal thickness were evaluated in H&E–stained sections, as indicated by double-headed arrows, while collagen deposition was visualized using Masson’s trichrome staining. (B) Quantitative analysis of macroscopic appearance, scar index, epidermal thickness, and collagen density. MF-S treatment resulted in a concentration–dependent reduction in scar hypertrophy and collagen accumulation. Data are presented as the mean ± SEM (n = 6). * p < 0.05, ** p < 0.01, *** p < 0.001 compared with vehicle-treated control.
3.5. MF-S Inhibits ADA Activity
Prior studies have demonstrated that phenyl ring moieties contribute to the binding of ADA [38,39]. Because MF-S contains phenyl rings, we hypothesized that MF-S increases adenosine levels by inhibiting ADA activity. ADA catalyzes the conversion of adenosine to inosine; therefore, inosine production was used as an indirect measure of ADA activity. Treatment of purified calf intestine ADA with MF-S resulted in a concentration–dependent reduction in enzymatic activity (Figure 6A, left panel). Nonlinear regression analysis using the Hill equation yielded an IC50 value of 0.32 ± 0.21 nM for MF-S (Figure 6A, right panel). We next examined whether MF-S inhibits ADA activity in a cellular context. Treatment of NIH-3T3, HFL-1, and Jurkat T cells with MF-S led to a concentration–dependent decrease in ADA activity in all cell types tested (Figure 6B). These collective findings strongly indicate that MF-S directly inhibits ADA activity. Finally, the inhibitory potential of MF-S was compared with that of pentostatin, a potent and irreversible ADA inhibitor. No statistically significant difference in ADA inhibition was observed between MF-S (100 nM) and pentostatin (1 nM), indicating that MF-S exhibits a comparable inhibitory effect on ADA activity under the tested conditions.
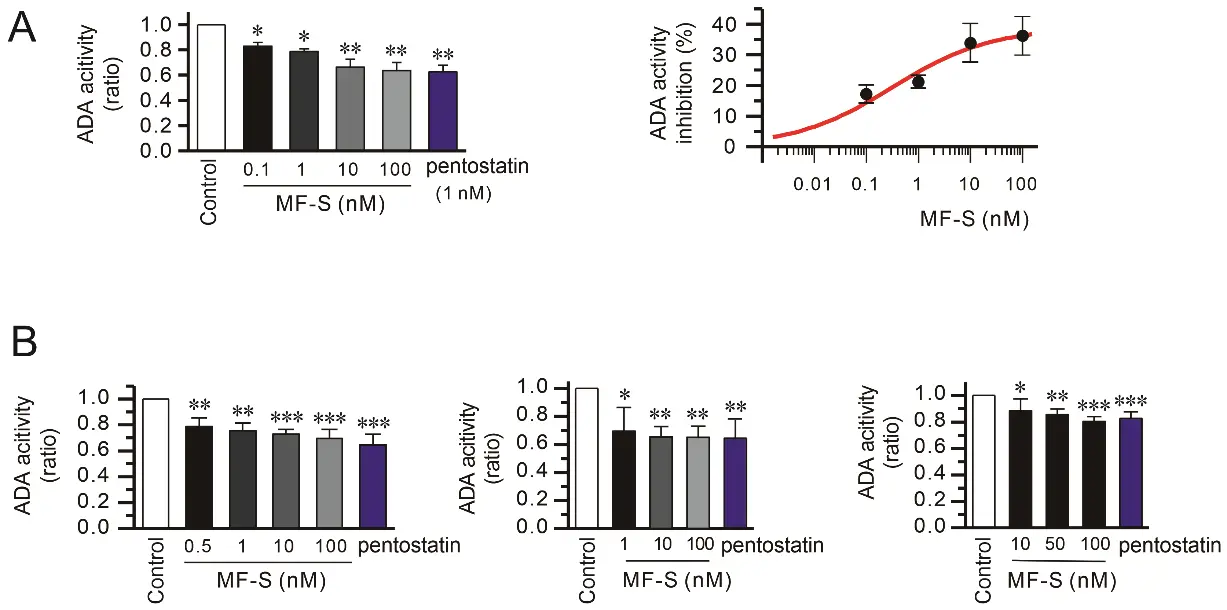
Figure 6. ADA activity was inhibited by MF-S. (A) Purified ADA from calf intestine was used to measure ADA activity. The magnitude of ADA activity inhibition at each treatment was expressed as a percentage of initial ADA activity. (B) NIH-3T3 (left panel), HFL-1 (middle panel), and Jurkat T cells (right panel) were treated with MF-S for 10 min, and ADA activity was measured using cell lysate. ADA activity was decreased by MF-S in a concentration–dependent manner. Each point represents the mean ± SEM of 5–14 separate experiments (n = 5–14). * p < 0.05, ** p < 0.01, *** p < 0.001 vs. control.
4. Discussion
In the present study, MF-S inhibited ADA activity in a concentration–dependent manner, resulting in increased adenosine and cAMP levels in both fibroblasts and immune cells. Importantly, MF-S–induced activation of adenosine–cAMP signaling was abolished by pharmacological inhibition of adenosine production using the selective CD73 inhibitor AB680. These findings indicate that MF-S enhances adenosine availability primarily through ADA inhibition, thereby activating downstream cAMP signaling pathways. In addition, MF-S increased the expression of CD39 and CD73, which may further amplify adenosine signaling by promoting extracellular adenosine generation. Because adenosine exerts immunosuppressive and anti-inflammatory effects [24,40], and cAMP signaling suppresses fibrotic responses through inhibition of Smad signaling and activation of Epac- and PKA–dependent pathways [25], activation of the adenosine–cAMP axis provides a mechanistic framework for the anti-inflammatory and anti-fibrotic effects of MF and its isomers observed in vitro and in vivo. Collectively, these findings suggest that MF and its isomers may represent promising therapeutic candidates for inflammatory, autoimmune, and fibrotic disorders.
Previous studies have demonstrated that MF and MF-S elevate intracellular cAMP levels in diverse cell types, including fibroblasts and smooth muscle cells [21,22]. Notably, MF– or MF-S–induced cAMP signaling and anti-fibrotic effects were suppressed by pharmacological antagonism of A2AAR or A2BAR [10,21]. However, the present radioligand binding assays revealed no evidence of direct interaction between MF-S and ARs, indicating that cAMP activation occurs through an indirect mechanism. Given that MF-S inhibits ADA and increases adenosine levels, it is likely that endogenously generated adenosine subsequently activates A2AAR and A2BAR, leading to cAMP elevation. Structural studies have suggested that the presence of a phenyl ring is important for ADA inhibition [38,39]. Thus, the phenyl moiety of MF and its isomers may contribute to their ADA-inhibitory activity. Consistent with this mechanism, blockade of CD73–mediated adenosine production using AB680 effectively suppressed MF-S–induced cAMP signaling, further supporting the conclusion that MF-S activates cAMP signaling via enhanced adenosine generation.
Accumulating evidence indicates that cAMP-elevating agents upregulate CD39 and CD73 expression and activity. NECA, forskolin, and prostaglandin E2 increase CD73 expression and function in human microvascular endothelial cells [35], while membrane-permeable cAMP analogs like 8-bromo-cAMP and cAMP-elevating agents such as forskolin and prostaglandin E2 enhance CD39 expression and enzymatic activity via PKA–dependent pathways in macrophages [34]. These observations suggest that cAMP positively regulates the ectonucleotidase system. Accordingly, MF and its isomers, by elevating intracellular cAMP, may promote CD39 and CD73 expression through cAMP–dependent mechanisms, thereby establishing a feed-forward loop that enhances adenosine generation and signaling.
Cyclic AMP plays a central role in modulating inflammatory and fibrotic responses through coordinated regulation of Smad, Epac, and PKA signaling pathways. Smad proteins are key mediators of tissue fibrogenesis [41], and TGFβ1 induces fibrosis primarily via activation of Smad signaling [37]. In the present study, MF-S reversed TGFβ-induced upregulation of Smad4, suggesting that MF-S suppresses profibrotic signaling downstream of TGFβ (Supplementary Figure S1). Smad4 serves as an essential and potentially limiting co-mediator for Smad3-dependent transcription. Thus, suppression of TGFβ–induced Smad4 upregulation by MF-S may effectively dampen canonical Smad signaling, consistent with previous reports demonstrating that cAMP signaling functionally inhibits TGFβ/Smad3/4 transcriptional responses [42]. Furthermore, cAMP exerts anti-fibrotic effects by inhibiting epithelial–mesenchymal transition and extracellular matrix production through Epac–mediated pathways. Notably, profibrotic stimuli, including TGFβ and angiotensin II, downregulate Epac expression, and this reduction contributes to tissue fibrosis [25]. Additionally, cAMP inhibits TGFβ–induced fibrosis by suppressing the expression and production of connective tissue growth factor [43,44]. Parallel to its anti-fibrotic role, cAMP signaling suppresses immune cell activation and proliferation, thereby attenuating inflammatory responses [24,45]. Therefore, cAMP-elevating agents such as MF-S may counteract fibrogenesis by restoring cAMP signaling and suppressing TGFβ–driven profibrotic pathways.
Upregulation of the Ca2+-activated K+ channels KCa3.1 and KCa2.3 upregulation has been reported in immune cells and fibrotic tissues in both human patients and animal models of inflammatory, autoimmune, and fibrotic diseases. Increased expression of these channels enhances Ca2+ influx, thereby promoting immune activation, inflammation, and fibrogenesis. Profibrotic and pro-inflammatory mediators, including TGFβ and cytokines, induce KCa3.1 and KCa2.3 expression [46,47,48], whereas pharmacological or genetic inhibition of these channels attenuates fibrotic and inflammatory responses [28,46]. Consistent with these findings, MF and its isomers inhibit KCa3.1 currents via PKA–dependent pathways and downregulate KCa3.1 and KCa2.3 expression via Epac–mediated mechanism [11,22]. Thus, suppression of KCa channel activity represents an additional mechanism by which MF and MF-S mitigate inflammatory and fibrotic responses.
Several limitations of this study should be acknowledged. First, although MF-S was shown to inhibit ADA activity and elevate adenosine levels, direct structural or crystallographic evidence for MF-S binding to ADA was not obtained. While the presence of phenyl rings in modafinil suggests a potential for interaction with ADA, the precise molecular determinants and inhibitory mode of action remain unclear and warrant further structural and biochemical investigation. Second, while pharmacological inhibitors were used to dissect signaling pathways, genetic approaches (e.g., ADA or CD73 knockdown) were not employed to definitively establish causality. Third, the therapeutic efficacy of MF-S has been confirmed across multiple in vivo models, including murine models of liver and lung fibrosis [10,11] as well as a rabbit ear model of hypertrophic scarring, supporting the robustness of its anti-fibrotic effects; however, differences in tissue context and disease mechanisms among these models should be considered when interpreting translational relevance. Finally, although modafinil and its R-isomer have been used clinically for the treatment of narcolepsy for decades with a well-established safety profile in humans, long-term safety, pharmacokinetics, and potential off-target effects of MF and its isomers in the context of chronic anti-fibrotic therapy have not been systematically evaluated. Elucidation of this newly identified mechanism may therefore enable rational drug repurposing of modafinil or its isomers for novel fibrotic indications, while underscoring the need for indication-specific safety and pharmacological assessments.
5. Conclusions
MF-S inhibits ADA activity, thereby increasing adenosine availability and promoting the subsequent activation of cAMP signaling in both fibroblasts and immune cells. In addition, MF-S upregulates the ectonucleotidases CD39 and CD73, which may further enhance adenosine generation and signaling. Augmented adenosine signaling contributes to the suppression of immune and inflammatory responses. Moreover, activation of the adenosine–cAMP axis exerts anti-fibrotic effects by attenuating Smad–dependent signaling while engaging Epac- and PKA–mediated pathways. Collectively, these mechanisms provide a plausible explanation for the anti-inflammatory and anti-fibrotic effects of MF-S observed in both in vitro and in vivo models [11]. Taken together, our findings support MF and MF-S as promising therapeutic candidates for the treatment of inflammatory, autoimmune, and fibrotic disorders.
Supplementary Materials
The following supporting information can be found at: https://www.sciepublish.com/article/pii/842, Figure S1: MF-S inhibited Smad4 upregulation by TGFβ in human lung fibroblasts. Smad4 protein levels were measured by Western blot. Blots shown are representative of 9 experiments performed with 9 different cultures. Data are presented as the mean ± SEM values. ** p < 0.01.
Statement of the Use of Generative AI and AI-Assisted Technologies in the Writing Process
During the preparation of this manuscript, the authors used ChatGPT (version 4.0) solely for grammar checking. After using this tool, the authors reviewed and edited the content as needed and assume full responsibility for the content of the published article.
Author Contributions
Conceptualization, S.C., K.-C.K. and S.-H.S.; methodology, S.C., J.-A.K. and S.-H.S.; formal analysis, S.C., J.-A.K. and S.-H.S.; writing—original draft preparation, S.C. and K.-C.K.; writing—review and editing, S.C. and S.-H.S.; supervision, S.C. and S.-H.S.; funding acquisition, S.C., K.-C.K. and S.-H.S. All authors have read and agreed to the published version of the manuscript.
Ethics Statement
The study was conducted according to the guidelines of the Declaration of Helsinki, and approved by the Institutional Review Board (or Ethics Committee) of Seoul National University Bundang Hospital, Gyeonggi-do, Republic of Korea (BA-2108-326-008-02, issued at 27 August 2021).
Informed Consent Statement
Not applicable.
Data Availability Statement
The original contributions presented in this study are included in the article. Further inquiries can be directed to the corresponding author.
Funding
This work was supported by the National Research Foundation of Korea (NRF) grant funded by the Korea government (MSIT) (NRF-2022R1A2C1092484 and NRF-2022R1A2C1007823), Republic of Korea and intramural research promotion grants from Ewha Womans University, School of Medicine.
Declaration of Competing Interest
The authors declare that they have no known competing financial interests or personal relationships that could have appeared to influence the work reported in this paper.
References
- Gerrard P, Malcolm R. Mechanisms of modafinil: A review of current research. Neuropsychiatr. Dis. Treat. 2007, 3, 349–364. DOI:10.2147/ndt.s12160183 [Google Scholar]
- Jung J, Youm J, Kang J, Kim AY, Suh JK, Kang HY. Assessing Condition-Specific Adverse Event Profiles of Modafinil for Labelled and Off-Label Uses: A Systematic Review and Meta-Analysis. Basic Clin. Pharmacol. Toxicol. 2026, 138, e70147. DOI:10.1111/bcpt.70147 [Google Scholar]
- Ghazanfar S, Farooq M, Qazi SU, Chaurasia B, Kaunzner U. The use of modafinil for the treatment of fatigue in multiple sclerosis: A systematic review and meta-analysis of controlled clinical trials. Brain Behav. 2024, 14, e3623. DOI:10.1002/brb3.3623 [Google Scholar]
- Sousa A, Dinis-Oliveira RJ. Pharmacokinetic and pharmacodynamic of the cognitive enhancer modafinil: Relevant clinical and forensic aspects. Subst. Abus. 2020, 41, 155–173. DOI:10.1080/08897077.2019.1700584 [Google Scholar]
- Minzenberg MJ, Carter CS. Modafinil: A review of neurochemical actions and effects on cognition. Neuropsychopharmacology 2008, 33, 1477–1502. DOI:10.1038/sj.npp.1301534 [Google Scholar]
- Lindsay SE, Gudelsky GA, Heaton PC. Use of modafinil for the treatment of attention deficit/hyperactivity disorder. Ann. Pharmacother. 2006, 40, 1829–1833. DOI:10.1345/aph.1H024 [Google Scholar]
- Zamanian MY, Karimvandi MN, Nikbakhtzadeh M, Zahedi E, Bokov DO, Kujawska M, et al. Effects of Modafinil (Provigil) on Memory and Learning in Experimental and Clinical Studies: From Molecular Mechanisms to Behaviour Molecular Mechanisms and Behavioural Effects. Curr. Mol. Pharmacol. 2023, 16, 507–516. DOI:10.2174/1874467215666220901122824 [Google Scholar]
- Battleday RM, Brem AK. Modafinil for cognitive neuroenhancement in healthy non-sleep-deprived subjects: A systematic review. Eur. Neuropsychopharmacol. 2015, 25, 1865–1881. DOI:10.1016/j.euroneuro.2015.07.028 [Google Scholar]
- Amini MJ, Seighali N, Arabazadeh Bahri R, Ala M, Mohammad Jafari R, Dehpour AR. Repurposing of modafinil as an anti-inflammatory drug: A systematic review of experimental studies. Naunyn Schmiedeberg’s Arch. Pharmacol. 2025, 398, 15599–15609. DOI:10.1007/s00210-025-03964-9 [Google Scholar]
- Li H, Kim JA, Jo SE, Lee H, Kim KC, Choi S, et al. Modafinil exerts anti-inflammatory and anti-fibrotic effects by upregulating adenosine A2A and A2B receptors. Purinergic Signal. 2024, 20, 371–384. DOI:10.1007/s11302-023-09973-8 [Google Scholar]
- Choi S, Kim JA, Li H, Jo SE, Lee H, Kim TH, et al. Anti-inflammatory and anti-fibrotic effects of modafinil in nonalcoholic liver disease. Biomed. Pharmacother. 2021, 144, 112372. DOI:10.1016/j.biopha.2021.112372 [Google Scholar]
- Zager A. Modulating the immune response with the wake-promoting drug modafinil: A potential therapeutic approach for inflammatory disorders. Brain Behav. Immun. 2020, 88, 878–886. DOI:10.1016/j.bbi.2020.04.038 [Google Scholar]
- Kamel M, Ahmed SM, Abdelzaher W. The potential protective effect of modafinil in intestinal ischemic reperfusion-induced in rats. Int. Immunopharmacol. 2020, 88, 106983. DOI:10.1016/j.intimp.2020.106983 [Google Scholar]
- Yousefi-Manesh H, Rashidian A, Hemmati S, Shirooie S, Sadeghi MA, Zarei N, et al. Therapeutic effects of modafinil in ischemic stroke; possible role of NF-kappaB downregulation. Immunopharmacol. Immunotoxicol. 2019, 41, 558–564. DOI:10.1080/08923973.2019.1669045 [Google Scholar]
- Abbasi Y, Shabani R, Mousavizadeh K, Soleimani M, Mehdizadeh M. Neuroprotective effect of ethanol and Modafinil on focal cerebral ischemia in rats. Metab. Brain Dis. 2019, 34, 805–819. DOI:10.1007/s11011-018-0378-0 [Google Scholar]
- Yousefi-Manesh H, Shirooie S, Hemati S, Shokrian-Zeini M, Zarei N, Raoufi M, et al. Protective effects of modafinil administration on testicular torsion/detorsion damage in rats. Exp. Mol. Pathol. 2019, 111, 104305. DOI:10.1016/j.yexmp.2019.104305 [Google Scholar]
- Dejban P, Rahimi N, Takzare N, Dehpour AR. Biochemical and histopathological evidence for the beneficial effects of modafinil on the rat model of inflammatory bowel disease: Involvement of nitric oxide pathway. Pharmacol. Rep. 2020, 72, 135–146. DOI:10.1007/s43440-019-00054-5 [Google Scholar]
- Brandão WN, Andersen ML, Palermo-Neto J, Peron JP, Zager A. Therapeutic treatment with Modafinil decreases the severity of experimental autoimmune encephalomyelitis in mice. Int. Immunopharmacol. 2019, 75, 105809. DOI:10.1016/j.intimp.2019.105809 [Google Scholar]
- Bibani RH, Tench CR, George J, Manouchehrinia A, Palace J, Constantinescu CS. Reduced EDSS progression in multiple sclerosis patients treated with modafinil for three years or more compared to matched untreated subjects. Mult. Scler. Relat. Disord. 2012, 1, 131–135. DOI:10.1016/j.msard.2012.03.004 [Google Scholar]
- Han J, Chen D, Liu D, Zhu Y. Modafinil attenuates inflammation via inhibiting Akt/NF-kappaB pathway in apoE-deficient mouse model of atherosclerosis. Inflammopharmacology 2018, 26, 385–393. DOI:10.1007/s10787-017-0387-3 [Google Scholar]
- Pal China S, Pal S, Chattopadhyay S, Porwal K, Mittal M, Sanyal S, et al. The wakefulness promoting drug Modafinil causes adenosine receptor-mediated upregulation of receptor activator of nuclear factor kappaB ligand in osteoblasts: Negative impact of the drug on peak bone accrual in rats. Toxicol. Appl. Pharmacol. 2018, 348, 22–31. DOI:10.1016/j.taap.2018.04.006 [Google Scholar]
- Choi S, Kim MY, Joo KY, Park S, Kim JA, Jung JC, et al. Modafinil inhibits K(Ca)3.1 currents and muscle contraction via a cAMP-dependent mechanism. Pharmacol. Res. 2012, 66, 51–59. DOI:10.1016/j.phrs.2012.02.009 [Google Scholar]
- Tavares LP, Negreiros-Lima GL, Lima KM, PMR ES, Pinho V, Teixeira MM, et al. Blame the signaling: Role of cAMP for the resolution of inflammation. Pharmacol. Res. 2020, 159, 105030. DOI:10.1016/j.phrs.2020.105030 [Google Scholar]
- Raker VK, Becker C, Steinbrink K. The cAMP Pathway as Therapeutic Target in Autoimmune and Inflammatory Diseases. Front. Immunol. 2016, 7, 123. DOI:10.3389/fimmu.2016.00123 [Google Scholar]
- Insel PA, Murray F, Yokoyama U, Romano S, Yun H, Brown L, et al. cAMP and Epac in the regulation of tissue fibrosis. Br. J. Pharmacol. 2012, 166, 447–456. DOI:10.1111/j.1476-5381.2012.01847.x [Google Scholar]
- Campo GM, Avenoso A, D’Ascola A, Prestipino V, Scuruchi M, Nastasi G, et al. Protein kinase a mediated anti-inflammatory effects exerted by adenosine treatment in mouse chondrocytes stimulated with IL-1beta. Biofactors 2012, 38, 429–439. DOI:10.1002/biof.1040 [Google Scholar]
- Hewer RC, Sala-Newby GB, Wu YJ, Newby AC, Bond M. PKA and Epac synergistically inhibit smooth muscle cell proliferation. J. Mol. Cell Cardiol. 2011, 50, 87–98. DOI:10.1016/j.yjmcc.2010.10.010 [Google Scholar]
- Roach KM, Bradding P. Ca2+ signalling in fibroblasts and the therapeutic potential of KCa3.1 channel blockers in fibrotic diseases. Br. J. Pharmacol. 2020, 177, 1003–1024. DOI:10.1111/bph.14939 [Google Scholar]
- Organ L, Bacci B, Koumoundouros E, Kimpton WG, Samuel CS, Nowell CJ, et al. Inhibition of the K(Ca)3.1 Channel Alleviates Established Pulmonary Fibrosis in a Large Animal Model. Am. J. Respir. Cell Mol. Biol. 2017, 56, 539–550. DOI:10.1165/rcmb.2016-0092OC [Google Scholar]
- Lee WR, Kim KH, An HJ, Kim JY, Lee SJ, Han SM, et al. Apamin inhibits hepatic fibrosis through suppression of transforming growth factor beta1-induced hepatocyte epithelial-mesenchymal transition. Biochem. Biophys. Res. Commun. 2014, 450, 195–201. DOI:10.1016/j.bbrc.2014.05.089 [Google Scholar]
- Prisinzano T, Podobinski J, Tidgewell K, Luo M, Swenson D. Synthesis and determination of the absolute configuration of the enantiomers of modafinil. Tetrahedron Asymmetry 2004, 15, 1053–1058. DOI:10.1016/j.tetasy.2004.01.039 [Google Scholar]
- Hulme EC, Trevethick MA. Ligand binding assays at equilibrium: Validation and interpretation. Br. J. Pharmacol. 2010, 161, 1219–1237. DOI:10.1111/j.1476-5381.2009.00604.x [Google Scholar]
- Effendi WI, Nagano T, Kobayashi K, Nishimura Y. Focusing on Adenosine Receptors as a Potential Targeted Therapy in Human Diseases. Cells 2020, 9, 785. DOI:10.3390/cells9030785 [Google Scholar]
- Liao H, Hyman MC, Baek AE, Fukase K, Pinsky DJ. cAMP/CREB-mediated transcriptional regulation of ectonucleoside triphosphate diphosphohydrolase 1 (CD39) expression. J. Biol. Chem. 2010, 285, 14791–14805. DOI:10.1074/jbc.M110.116905 [Google Scholar]
- Narravula S, Lennon PF, Mueller BU, Colgan SP. Regulation of endothelial CD73 by adenosine: Paracrine pathway for enhanced endothelial barrier function. J. Immunol. 2000, 165, 5262–5268. DOI:10.4049/jimmunol.165.9.5262 [Google Scholar]
- Pastor-Anglada M, Perez-Torras S. Who Is Who in Adenosine Transport. Front. Pharmacol. 2018, 9, 627. DOI:10.3389/fphar.2018.00627 [Google Scholar]
- Xu F, Liu C, Zhou D, Zhang L. TGF-beta/SMAD Pathway and Its Regulation in Hepatic Fibrosis. J. Histochem. Cytochem. 2016, 64, 157–167. DOI:10.1369/0022155415627681 [Google Scholar]
- Amanlou M, Saboury AA, Bazl R, Ganjali MR, Sheibani S. Adenosine deaminase activity modulation by some street drug: Molecular docking simulation and experimental investigation. DARU J. Pharm. Sci. 2014, 22, 42. DOI:10.1186/2008-2231-22-42 [Google Scholar]
- Alunni S, Orru M, Ottavi L. A study on the inhibition of adenosine deaminase. J. Enzyme Inhib. Med. Chem. 2008, 23, 182–189. DOI:10.1080/14756360701475233 [Google Scholar]
- Hasko G, Cronstein B. Regulation of inflammation by adenosine. Front. Immunol. 2013, 4, 85. DOI:10.3389/fimmu.2013.00085 [Google Scholar]
- Hu HH, Chen DQ, Wang YN, Feng YL, Cao G, Vaziri ND, et al. New insights into TGF-beta/Smad signaling in tissue fibrosis. Chem. Biol. Interact. 2018, 292, 76–83. DOI:10.1016/j.cbi.2018.07.008 [Google Scholar]
- Schiller M, Verrecchia F, Mauviel A. Cyclic adenosine 3′,5′-monophosphate-elevating agents inhibit transforming growth factor-beta-induced SMAD3/4-dependent transcription via a protein kinase A-dependent mechanism. Oncogene 2003, 22, 8881–8890. DOI:10.1038/sj.onc.1206871 [Google Scholar]
- Stratton R, Shiwen X, Martini G, Holmes A, Leask A, Haberberger T, et al. Iloprost suppresses connective tissue growth factor production in fibroblasts and in the skin of scleroderma patients. J. Clin. Investig. 2001, 108, 241–250. DOI:10.1172/JCI12020 [Google Scholar]
- Duncan MR, Frazier KS, Abramson S, Williams S, Klapper H, Huang X, et al. Connective tissue growth factor mediates transforming growth factor beta-induced collagen synthesis: Down-regulation by cAMP. FASEB J. 1999, 13, 1774–1786. DOI:10.1096/fasebj.13.13.1774 [Google Scholar]
- Salinthone S, Yadav V, Schillace RV, Bourdette DN, Carr DW. Lipoic acid attenuates inflammation via cAMP and protein kinase A signaling. PLoS ONE 2010, 5, e13058. DOI:10.1371/journal.pone.0013058 [Google Scholar]
- Ohya S, Kito H. Ca(2+)-Activated K(+) Channel K(Ca)3.1 as a Therapeutic Target for Immune Disorders. Biol. Pharm. Bull. 2018, 41, 1158–1163. DOI:10.1248/bpb.b18-00078 [Google Scholar]
- Sim JH, Kim KS, Park H, Kim KJ, Lin H, Kim TJ, et al. Differentially Expressed Potassium Channels Are Associated with Function of Human Effector Memory CD8(+) T Cells. Front. Immunol. 2017, 8, 859. DOI:10.3389/fimmu.2017.00859 [Google Scholar]
- Nguyen HM, Grossinger EM, Horiuchi M, Davis KW, Jin LW, Maezawa I, et al. Differential Kv1.3, KCa3.1, and Kir2.1 expression in “classically” and “alternatively” activated microglia. Glia 2017, 65, 106–121. DOI:10.1002/glia.23078 [Google Scholar]