Renal Aging and Fibrosis in the Elderly: Frontiers in Non-Invasive Assessment

Renal Aging and Fibrosis in the Elderly: Frontiers in Non-Invasive Assessment
Received: 31 October 2025 Revised: 24 November 2025 Accepted: 13 January 2026 Published: 15 January 2026

© 2026 The authors. This is an open access article under the Creative Commons Attribution 4.0 International License (https://creativecommons.org/licenses/by/4.0/).
1. Introduction
With the development of society and improvements in healthcare, the global population is aging rapidly. According to the 27th Edition of the global population estimation and prediction report released by the United Nations, in 2024, more than 10% of the people in the world will be over 65 years old, and it is estimated that this age group will account for more than 16% of the global population by 2050 [1]. In the elderly population, the prevalence of CKD is significantly increased, and more than 1/3 of people over 70 years old have moderate to severe CKD [2]. The aging process itself is considered to be an independent risk factor for the occurrence and development of CKD. It significantly magnifies the risk of CKD in the elderly through a variety of complex pathological mechanisms, and accelerates the progress of the disease, thus bringing a heavy burden to society and the economy [3]. This increased risk is clinically relevant, meaning that renal outcomes are prone to adverse effects as age increases. However, the exact mechanism of renal dysfunction in the elderly is still unknown. The effect of aging on the whole body is manifested in the impairment of physiological homeostasis and the increase of “wear” burden. Therefore, renal aging is not an independent disease but a complex, continuously changing pathophysiological process. Renal fibrosis is a common pathological process in renal aging and in the progression of CKD to end-stage renal disease, including glomerular sclerosis and renal interstitial fibrosis, and its pathogenesis is complex. It is characterized by infiltration of inflammatory cells, activation of myofibroblasts and deposition of a large amount of extracellular matrix, forming scar tissue, leading to destruction of renal tissue structure, functional damage and finally loss [4]. Currently, it can only delay the progress of CKD in the clinic, but it will eventually progress to renal failure. Dialysis and kidney transplantation are the only treatment methods [5]. For elderly patients with CKD, accurate diagnosis and evaluation of fibrosis is of great significance for disease monitoring, treatment planning and prognosis improvement. Currently, the gold standard for the diagnosis of renal fibrosis in elderly patients with kidney disease is renal biopsy, but as an invasive examination method, it has many limitations for elderly patients with kidney disease. In recent years, with the continuous emergence of new technologies such as functional magnetic resonance imaging (fMRI), Ultrasonic elastography and Nano-delivery system, these cutting-edge tools have shown great application potential in the field of elderly kidney disease, and gradually become a new choice for the diagnosis and monitoring of renal fibrosis, effectively making up for the shortcomings of traditional diagnostic methods, and opening up a new way for non-invasive diagnosis and monitoring of renal fibrosis in elderly patients with kidney disease.
2. Characteristics of an Aging Kidney
Aging refers to the natural phenomenon that human tissue structure and physiological function decline with aging. Aging is not a disease, but the biggest risk factor for senile diseases. The biological significance of aging is to make individuals die through aging, so as to maintain the stability of the species’ genome. Even without hypertension or diabetes, the morphology and function of the kidney will be affected by aging. In the aging kidney, glomerular sclerosis, interstitial fibrosis, arteriosclerosis, reduced renal mass, reduced glomerular filtration rate, increased vascular resistance, degradation of the urine concentration mechanism and acid-base imbalance. This article summarizes the structural and functional changes in aging kidneys, as shown in Table 1.
Table 1. Structural and functional changes in the aging kidney.
|
Structural Change |
Functional Changes |
|
|---|---|---|
|
Glomeruli |
Glomerulosclerosis and a reduced number of nephrons |
Decreased filtration surface area |
|
Tubules |
Tubular atrophy and basement membrane thickening |
Impaired reabsorption and secretion |
|
Interstitium |
Increased fibrosis and collagen deposition |
Reduced oxygen diffusion, ischemia |
|
Vasculature |
Arteriosclerosis, decreased renal blood flow |
Lower GFR and altered autoregulation |
|
Renal mass |
Thinning cortical thickness |
Overall reduction in renal function |
GFR: glomerular filtration rate.
2.1. Structural Changes of the Kidney in the Elderly
2.1.1. Glomerular Sclerosis and Quantity Reduction
The number and size of intact or normal glomeruli gradually decreased with age. One of the most frequently observed pathological changes in aging kidneys is the increase in the incidence of focal and global glomerular sclerosis. Unlike in CKD, hypertrophy of residual functional glomeruli and albuminuria were not observed during healthy aging [6]. The number of glomerular mesangial cells and endothelial cells will also increase with age until age 50, so they can maintain a physiologically appropriate proportion to the expanded glomerular volume [7]. However, with increasing age, the numbers of mesangial and endothelial cells gradually decreased after 50 years of age, resulting in damage to the structural integrity of the glomerular capillary network, a reduction in the effective filtration area, and a reduction in glomerular filtration rate (GFR) and filtration function. This change is more significant after the age of 70 [7]. Representative images of renal biopsy with the main features of nephrosclerosis are shown in Figure 1 (The figure was firstly publicated in Advances in Chronic Kidney Disease in 2016 by Denic et al.) [8].

Figure 1. Representative kidney biopsy images with the main features of nephrosclerosis [8]. (A) Two globally sclerotic glomeruli (GSG) are labeled with black arrowheads. Non-sclerotic glomerulus (NSG) is labeled with a black star. GSG are surrounded by tubular atrophy. (B) Thickened intima of a small to medium size artery (the area between red and yellow boundaries). (C) Two foci of tubular atrophy and interstitial fibrosis are magnified.
2.1.2. Renal Tubular Atrophy and Interstitial Fibrosis
Glomerular sclerosis is accompanied by renal tubular atrophy (TA) and interstitial fibrosis (IF), which are considered to be the main pathological changes of the renal tubulointerstitium in an aging kidney. With aging, the volume, number, and length of renal tubules decrease, while the number of renal tubular diverticula (local cystic expansions) increases. In addition, renal tubular atrophy is accompanied by thickening of the renal tubular basement membrane [9]. Compared with CKD, Interstitial fibrosis/tubular atrophy (IFTA) caused by nephron loss caused by aging is not as obvious as CKD, but with the increase in age, the mode of IFTA is enlightening. Analysis of large, unaffected wedge-shaped samples of renal tissue from patients undergoing radical nephrectomy for tumors showed that IFTA in elderly patients showed a more dispersed pattern than that in young patients, even though their IFTA percentages were the same [10].
Despite these changes, it should be noted that aging itself does not necessarily lead to a decline in renal function or clinical problems. The GFR of mononephron can remain stable until at least 70 years old [11]. Because the elderly kidney still has a certain compensatory mechanism to maintain “normal renal function”. These compensatory mechanisms primarily include the hypertrophy of nephrons and the adjustment of renal tubular function to adapt to the reduction in nephron numbers and declining function.
2.2. Changes of Renal Function in the Elderly
The changes in the biological functions of the aging kidney show a decrease in GFR, the impairment of renal tubular function, the increase of renal vascular resistance and endocrine dysfunction.
Age related decline in GFR has long been recognized as an initial parameter for evaluating age-related decline in function [12]. Studies have shown that renal tubular atrophy and interstitial fibrosis are correlated with eGFR [13]. Accurate estimation of GFR is very important for the diagnosis, risk stratification and drug dose adjustment of kidney disease. Especially in elderly patients, the prevalence of CKD, multiple drug use and the risk of adverse drug events are high. The gold standard for evaluating renal function is invasive GFR measurement using exogenous markers such as iodixanol or iodotide [14,15]. However, the measurement of glomerular filtration rate (mGFR) has not been widely used or available in clinical practice, because it requires standardized scheme, extended sampling time, repeated blood measurements, and a professional laboratory. Serum creatinine (Cr) and cystatin C (Cys) are widely used endogenous filtration markers for estimating GFR. Therefore, clinicians often face the problem that there are differences in the estimated values of GFR in the same body (using cystatin C, creatinine or a combination of both). These differences are particularly obvious in the elderly population. Because muscle mass and dietary protein intake of the elderly decrease with age, people worry that creatinine may not be the preferred filter marker for estimating GFR. In particular, lower muscle mass or protein intake may lead to a systematic overestimation of mGFR and an underestimate of the prevalence of CKD when eGFRcr (estimated glomerular filtration rate based on creatinine) is used. Cystatin C is not affected by muscle mass or dietary protein intake and is considered superior to creatinine in the elderly. In a study, it was found that in the two estimates based on creatinine (eGFRcr) and cystatin C (eGFRcys), the lower estimate may be more accurate [16]. Studies have found that in patients with CKD, the equation combining creatinine and cystatin C performs better than the equation using creatinine or cystatin C alone, and concluded that the Full Age Spectrum Creatinine-Cystatin C equation (FASCr-Cys) is better than the Chronic Kidney Disease Epidemiology Collaboration (CKD-EPI) creatinine-cystatin C equation (CKD-EPI Cr-Cys) [17].
Age related renal tubular dysfunction is characterized by decreased ability to concentrate urine, electrolyte imbalance, and increased susceptibility to acute kidney injury (AKI). The main cause of renal tubular injury is the reduction of the ability to concentrate or dilute urine caused by renal tubular arteriosclerosis. Due to the reduction of renal dilution ability, the elderly are more vulnerable to stress conditions such as surgery, fever, diuretics or other drugs that enhance the effect of antidiuretic hormone. The reduction of urinary sodium excretion in the elderly population leads to an increased susceptibility to volume overload. The kidney regulates acid-base balance by retaining bicarbonate and secreting net acid in the form of ammonium and titratable acid in the renal lumen. Under basic conditions, there was no significant difference in blood pH and bicarbonate levels between healthy elderly and young people. However, when faced with an acute acid load, the elderly kidney cannot increase acid excretion as effectively as the young kidney, resulting in a lower urine pH [18].
The kidney is a highly vascularized organ, and its function is highly dependent on adequate blood supply. The vascular system of the elderly kidney also has significant degenerative changes, mainly manifested as arteriosclerosis and capillary rarefaction [19]. Especially after 60 years old, the degree of arteriosclerosis increased significantly.
The higher incidence of anemia in the elderly can be attributed to the reduction of erythropoietin production associated with tubular atrophy or tubulointerstitial scar. The function of 1α-hydroxylase in the elderly kidney is weakened, which leads to the reduction of 1,25-dihydroxyvitamin D synthesis ability. This will increase the risk of osteoporosis in the elderly [20]. The kidney can remove about 50% of insulin from the systemic circulation through glomerular filtration and proximal renal tubular uptake and degradation, whereas the systemic insulin clearance rate in the elderly is lower than that in the young due to declining renal function [21].
3. Diagnosis of Renal Fibrosis
3.1. Renal Biopsy
Percutaneous renal biopsy and histopathological evaluation remain the gold standard for diagnosing renal fibrosis. This method can directly observe the pathological changes of renal tissue, clarify the degree and scope of fibrosis, and provide a decisive basis for diagnosis and treatment. A small number of renal tissue samples were obtained and made into paraffin sections with a thickness of 2~3 μm. After dewaxing and rehydration antigen repair, sealing, color development and re staining reaction, light microscopy was performed. Pathologists can directly observe histological changes in the kidney under a microscope. At present, the standard method for quantitative evaluation of renal fibrosis in most pathological departments is to visually evaluate the carrier glass of special staining, such as Masson trichrome staining or Sirius red staining, which can specifically display extracellular matrix components such as collagen fibers [22]. However, the visual assessment method has moderate repeatability [22], and Masson staining is not sensitive to mild fibrosis [23,24]. To improve the accuracy and repeatability of the assessment, some laboratories began adopting morphometry, using image analysis software (such as ImageJ (1.53t version, National Institute of Health, Bethesda, MD, USA)) to quantitatively analyse pathological incisions, accurately measure parameters such as interstitial fibrosis volume and renal atrophy volume, and reduce human error. In their research, Farris et al. Found that the variation between observers of morphometric methods was small by comparing morphometric methods with visual evaluation methods [25].
In addition, immunohistochemical staining technology is also widely used to localize, qualitatively and semi quantitatively analyze specific antigens (such as collagen Ⅲ) in tissues through specific antibodies. Studies have found that the results of visual evaluation of anti collagen Ⅲ stained sections are closely related to the results of computer morphological evaluation. And this evaluation method is a good predictor of eGFR [26].
However, although renal biopsy has irreplaceable value in diagnosis, its application in elderly patients is facing severe challenges and many limitations. First, the operation is invasive, and its potential complications can not be ignored, including perirenal hematoma, gross hematuria, arteriovenous fistula, infection and even death. Elderly patients are often complicated with hypertension, atherosclerosis, coagulation dysfunction and other basic diseases, their physiological reserve function is decreased, and their tolerance to the puncture operation is poor, so the risk of complications is significantly higher than that of young patients. Secondly, the amount of tissue samples obtained by renal biopsy is limited, which usually contains only 10–20 renal spheres, and the lesions of the kidney are often focal or segmental distribution, which may lead to sampling error, that is, the biopsy sample can not fully represent the real lesions of the whole kidney, which may lead to false negative results or underestimate the degree of fibrosis. Furthermore, the repeatability of renal biopsy is limited. Because of its invasiveness and risk, it is difficult to make multiple progress in a short time, which limits its application in dynamic monitoring of fibrosis progress, evaluating treatment effect or observing the natural course of disease. Therefore, in clinical practice, especially for elderly patients with stable disease and no obvious signs of progression, doctors tend to be cautious about renal biopsy. These limitations collectively drive the rapid development of non-invasive diagnostic techniques, aimed at exploring a safer, reproducible, and comprehensive method for assessing the degree of renal fibrosis. At present, non-invasive assessment methods have made significant progress and occupy an important position in fibrosis assessment, including serum and urine biomarker detection, ultrasound based hardness measurement technology, molecular imaging technology (such as FAPI-PET/CT), and multi parameter functional magnetic resonance imaging (fMRI). These technologies each have their own advantages, providing supplementary evaluation information across multiple dimensions, including fibrosis burden, microstructural changes, perfusion abnormalities, and inflammatory activity status, thereby providing diversified support for accurate clinical judgment of renal fibrosis.
3.2. Laboratory Tests
In view of the limitations of renal biopsy, the search for non-invasive and dynamic markers of renal fibrosis has become a hot spot in clinical research. Serum markers have attracted much attention because of their detection methods and strong repeatability. At present, clinical mainly through the detection of serum creatinine, blood urea nitrogen, eGFR and other indicators to evaluate the progress of CKD, but these indicators are less sensitive to early tubulointerstitial fibrosis. Hypoxia inducible factor-1α (HIF-1α) is a hypoxia-inducible factor. Under hypoxia, the expression of HIF-1α in the nucleus is significantly increased, and it can activate the transcription of hypoxia response element (HRE) of hypoxia inducible gene, leading to hypoxia response in cells [27]. Animal experiments have found that knocking out the expression of HIF-1α gene can effectively delay the occurrence of renal fibrosis in CKD rats [28]. Transforming growth factor 1 (TGF-β1) is a multifunctional protein peptide, which mainly exists in kidney tissue and is currently recognized as an important growth factor causing renal fibrosis [29]. Overexpression of TGF-β1 can cause a series of physiological changes, such as promoting the deposition of extracellular matrix, stimulating the proliferation and activation of fibroblasts, and mediating the involvement of connective tissue growth factor in renal fibrosis [30]. At present, clinical studies have shown that the elevated levels of serum HIF-1α and TGF-β1 detected by enzyme-linked immunosorbent assay (ELISA) are related to the progression of CKD and renal interstitial fibrosis, and can be used as a predictor for the diagnosis of TIF in CKD patients, and the combined detection of the two can improve the diagnostic accuracy [31]. Matrix metalloproteinase-7 (MMP-7) is an endopeptidase that can degrade extracellular matrix and basement membrane. It is also a downstream target gene of wnt/β-catenin signaling pathway [32,33]. More and more evidence indicates that MMP-7 plays an important role in the pathogenesis of renal fibrosis, and its urinary level is closely related to the degree of renal fibrosis, making it an important biomarker for predicting the progression of renal disease [34,35]. Wang et al. found that higher urinary fibrinogen levels in patients with kidney disease were associated with more severe interstitial fibrosis and renal tubular atrophy [36]. Kidney injury molecule-1 (KIM-1) is a transmembrane glycoprotein, which is highly expressed in injured proximal renal tubular epithelial cells and can be detected in plasma and urine [37,38]. Studies have shown that the expression of KIM-1 in renal tubules is related to renal inflammation and fibrosis. It is considered to be an early, sensitive and specific urinary biomarker of renal injury [39,40]. Dickkopf-related protein 3 (Dkk-3) is a glycoprotein secreted by renal tubular epithelial cells under stress [41]. The study found that the level of Dkk-3 (uDkk-3) in the urine of CKD patients detected by ELISA was closely related to the severity of renal tubular atrophy and interstitial fibrosis observed in renal biopsy [42]. Monocyte chemoattractant protein-1 (MCP-1), also known as C–C motif chemokine ligand 2 (CCL2), is a chemokine produced by damaged renal tubular epithelial cells and monocytes/macrophages. MCP-1 mediates and promotes renal fibrosis by inducing inflammatory cell activation and recruiting monocytes/macrophages. Interleukin (IL) is a group of cytokine proteins produced by various cells in the body, including immune cells. Both are inflammation related factors, and studies have found that IL-6 and MCP-1 in urine are associated with focal glomerulosclerosis and interstitial fibrosis expansion, but not with mesangial, extra capillary or intra capillary proliferation. After adjusting for age and eGFR, MCP-1 and IL-6 levels are independent predictors of fibrosis surface [43]. A single-cell RNA sequencing study of kidney tissue from CKD patients and healthy controls also found that the expression levels of IL-6, IL-18, and IL-33 were positively correlated with fibrosis severity and negatively correlated with eGFR [44]. However, there are limitations in evaluating renal fibrosis based on inflammation related factors, as their expression is easily disrupted by systemic inflammation, comorbidities, and other factors.
So far, cumulative biomarkers have been identified to reflect all aspects of renal function and structural changes in kidney disease. However, multi center large-scale studies are needed to verify its efficacy further. Secondly, more and more studies have shown that a single biomarker has limitations in diagnosis and monitoring, and it is difficult to evaluate the complex pathological conditions of elderly patients comprehensively. Therefore, exploring the combined application of multiple biomarkers is very important for accurately monitoring renal function, evaluating disease risk and improving treatment effect in elderly patients with kidney disease. This can not only provide more accurate information on disease progression, but also help to develop personalized treatment programs, so as to reduce the burden of kidney disease in the elderly.
3.3. Imaging Examination
3.3.1. Ultrasound
Ultrasound-based diagnostic techniques, owing to their non-invasive, convenient, and repeatable nature, hold significant clinical value in the assessment of renal fibrosis in elderly patients. The pathological progression of renal fibrosis is typically accompanied by two key alterations: increased renal tissue stiffness, resulting from extracellular matrix deposition, and abnormal renal microvascular perfusion, which represents a critical early pathological feature. Accordingly, ultrasound methods for evaluating renal fibrosis in elderly patients can be broadly classified into two categories. The first focuses on assessing renal tissue elasticity, providing a quantitative measure of tissue stiffness to reflect fibrosis severity. The second emphasizes evaluation of renal vascular alterations, enabling visualization of microvascular structures and quantification of perfusion status to facilitate early detection and comprehensive assessment of fibrosis. The following sections will detail the applications and recent advances of these two categories of techniques.
Tissue Elasticity Assessment (Elastography)
Ultrasonic elastography is a non-invasive method to measure the hardness of various tissues. In recent years, it has been used to evaluate liver fibrosis and to distinguish malignant from benign tumors in the thyroid and breast regions [45,46,47,48,49]. The basic principle is that the hardness of fibrotic tissue is significantly higher than that of normal tissue due to the deposition of extracellular matrix. According to different measurement principles, ultrasonic elastography can be divided into shear wave elastography (SWE) and strain imaging.
Virtual touch tissue quantification (VTQ) generates a shear wave in tissue through acoustic radiation force pulse (ARFI) and measures its shear wave velocity (SWV), which is positively correlated with tissue hardness [50]. The value of VTQ technology in the evaluation of chronic liver disease, especially liver fibrosis, has been confirmed by many studies [51]. Many studies have discussed the relationship between SWV and the degree of renal fibrosis, but the results are not completely consistent. Bob et al. found that the SWV of patients with chronic glomerulonephritis was generally lower than that of the normal control group. With the presence of renal histological lesions, the SWV showed a downward trend. In addition, the study pointed out that in the control group, renal SWV decreased with increasing age and measurement depth; however, when these scores (a semi-quantitative score of the severity of histological changes in chronic kidney disease) were correlated with renal SWV, no significant correlation was found [52]. Hu et al. found that SWV was negatively correlated with Katafuchi grading (r = −0.504, *p* < 0.001) and IFTA (T score, r = −0.490, *p* < 0.001). Moreover, when evaluating diagnostic efficacy via the receiver operating characteristic curve (ROC), the area under the curve (AUC) of SWV combined with conventional ultrasound indicators (renal length, parenchymal thickness, interlobular arterial resistance index) was higher than that of SWV alone or conventional ultrasound alone, which further improved the diagnostic accuracy for renal pathological damage [53]. Yang et al. evaluated 90 patients with idiopathic nephrotic syndrome and 30 healthy controls and found that SWV increased progressively with the severity of renal interstitial fibrosis. SWV showed good diagnostic performance, with an AUC of 0.869 (95% CI: 0.791–0.947; cut-off 2.41 m/s) for identifying moderate fibrosis and 0.954 (95% CI: 0.917–0.998; cut-off 2.77 m/s) for severe fibrosis, demonstrating high sensitivity and specificity [54]. This indicates that SWV has good diagnostic accuracy for distinguishing moderate to severe renal interstitial fibrosis, thus providing a reliable non-invasive quantitative assessment tool for evaluating the severity of renal interstitial fibrosis in patients. This difference may be related to the disease stage, sample size, detection methods and other factors. In the future, more large-scale, multicenter studies in elderly patients are needed to further clarify the role and significance of SWV in the diagnosis of renal fibrosis in the elderly. Sound touch elastography (STE) is a two-dimensional SWE method, which uses multiple ARFI to aim at the extended region of interest (ROI) to display the real-time color stiffness map [55]. SWV can be calculated, and the corresponding maximum elastic modulus can be derived [56]. Chen et al. conducted a prospective study involving 162 patients with CKD and found that patients with moderate-to-severe renal fibrosis were significantly older than those with mild renal fibrosis. An integrated strategy combining SWE and eGFR using logistic regression demonstrated the best diagnostic performance in distinguishing mild from moderate-to-severe renal fibrosis, with an AUC of 85.8% (95% CI: 80.0–91.6%) and a balanced sensitivity (86.4%) and specificity (74.3%), outperforming isolated, serial, and parallel strategies [57]. The advantage of shear wave imaging is that the measurement of tissue elasticity does not depend on the operator, because shear waves can be automatically triggered by mechanical vibration [58]. However, the problem with this method is that the shear wave is not only affected by interstitial fibrosis, but also by changes in renal blood flow [59,60,61].
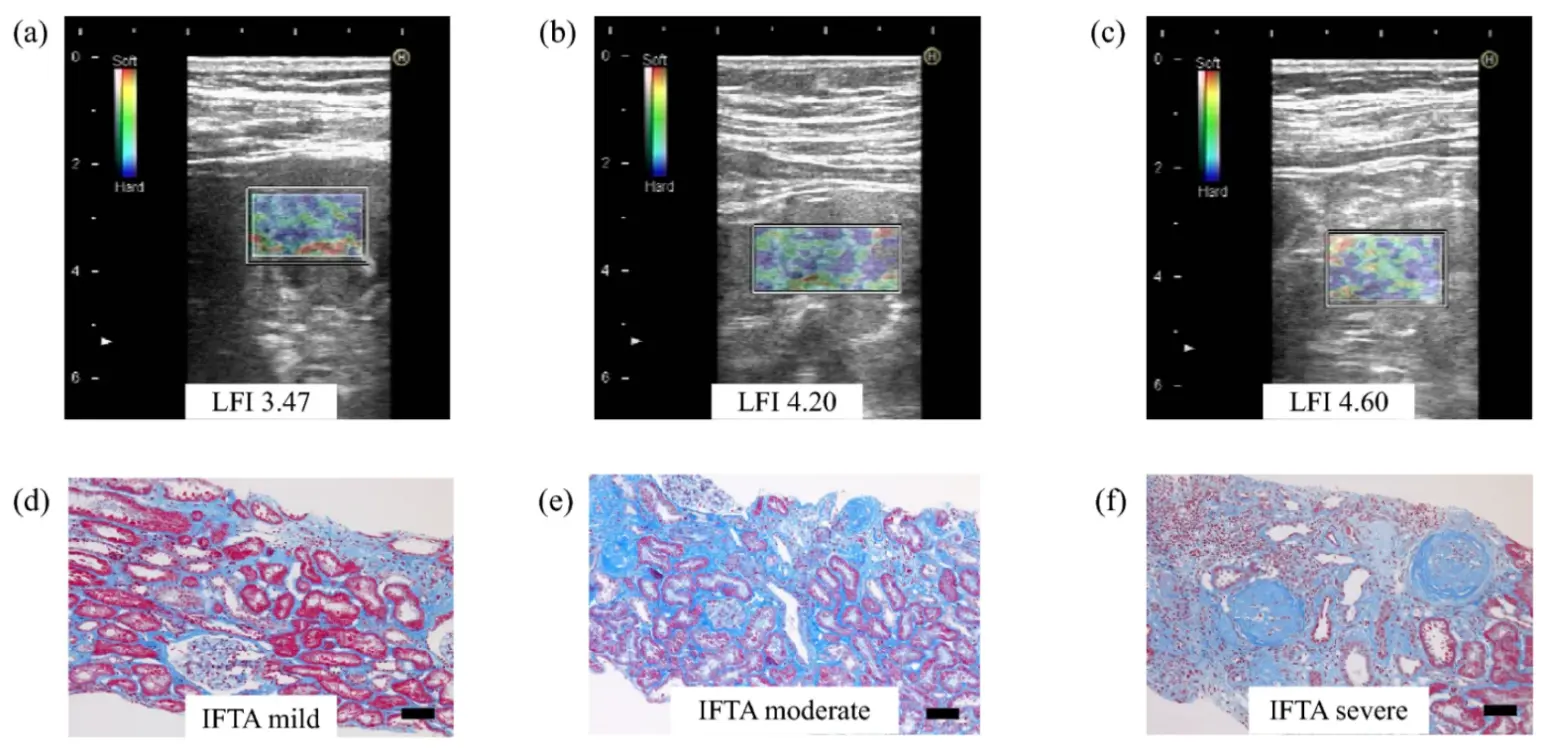
Real time tissue elastography (RTE) is a strain imaging ultrasonic elastography method, which can measure tissue displacement caused by heartbeat, so it can be used to evaluate deep organs, such as the original kidney. In a cohort of 29 patients with CKD, renal elasticity assessed by RTE showed a positive association with age and an inverse association with eGFR, while exhibiting no significant correlation with the urinary protein–to–creatinine ratio (UPCR), suggesting that RTE-derived elasticity may preferentially reflect structural renal injury rather than functional or proteinuric changes. Importantly, RTE-measured renal elasticity was significantly correlated with biopsy-confirmed renal fibrosis, demonstrating good interstage discrimination between mild and moderate-to-severe fibrosis (AUC = 0.778); this discriminative performance was further enhanced by combining renal elasticity with the interlobar artery resistance index (RI), achieving near-excellent diagnostic accuracy (AUC = 0.967 at a cut-off value of 1.75) with good interobserver reproducibility [62]. Figure 2 shows RTE images and Masson’s trichrome staining of pathological findings corresponding to different grades of IFTA (The figure was firstly publicated in Clinical and Experimental Nephrology in 2021 by Makita et al.) [62]. Compared with SWE, RTE appears less susceptible to renal hemodynamic variations and allows reliable assessment of native kidneys located deep in the retroperitoneum, thereby addressing key limitations of conventional ultrasound elastography. RTE seems to be an effective method for evaluating the degree of renal fibrosis.
Microvascular and Perfusion Assessment
Renal microvascular injury represents a key pathological feature in the early progression of CKD. The aforementioned elastography techniques primarily reflect tissue stiffness and are unable to assess renal microvascular perfusion, with limited sensitivity for early-stage fibrosis, thereby restricting their clinical applicability. Vascular-related ultrasound techniques, by visualizing microvascular structures or quantifying perfusion parameters, can address these limitations and provide an important complementary tool for early detection and comprehensive evaluation of renal fibrosis. Among these, superb microvascular imaging (SMI) and contrast-enhanced ultrasound (CEUS) are currently the most widely applied.
SMI, as an emerging ultrasound technique, addresses this limitation by enabling high-resolution visualization of renal microvasculature without contrast agents, while allowing quantification of perfusion status and assessment of microvascular structural integrity, thereby providing an important complementary non-invasive approach for the early detection and comprehensive evaluation of renal fibrosis [63]. In a prospective study, Armaly et al. reported that the vascular index derived from SMI was significantly lower in patients with CKD than in healthy controls and showed a positive correlation with eGFR and a negative correlation with SCr. These findings suggest that SMI-based microvascular parameters are associated with CKD stage and related histopathological alterations [64]. Qin et al. developed a multimodal ultrasound deep learning model integrating B-mode imaging, SMI, and SE to automatically differentiate early minimal and mild renal fibrosis in patients with chronic kidney disease. This model demonstrated superior performance compared with single-modality approaches and conventional clinical indicators, offering a promising tool for the early non-invasive detection of renal fibrosis [65].
CEUS is a non-invasive imaging modality that enables accurate quantitative assessment of microvascular perfusion in parenchymal organs by intravenously administering microbubble contrast agents [66]. These microbubbles function as intravascular blood-pool tracers, remaining entirely confined within the vascular lumen and exhibiting biodistribution characteristics highly similar to those of red blood cells [67]. This unique property allows CEUS to faithfully reflect microcirculatory perfusion, an advantage that conventional contrast agents used in CT and MRI fail to achieve. This contrast agent has almost no renal toxicity and is suitable for patients with impaired renal function. Yang et al. in IgA nephropathy (IgAN) patients and Huang et al. in kidney transplant recipients showed that CEUS can noninvasively assess IFTA by quantifying renal cortical perfusion parameters, with peak intensity (PI) negatively correlated with disease severity. PI thus holds potential as an imaging biomarker for evaluating renal injury and treatment response, providing reliable non-invasive evidence for pathological assessment and postoperative monitoring [68,69].
Photoacoustic Assessment
Photoacoustic imaging (PAI) is an emerging multimodal imaging technique that integrates the high molecular contrast of optical imaging with the deep tissue penetration of ultrasound, demonstrating unique potential for the assessment of renal fibrosis [70]. Current evidence suggests that PAI enables quantitative evaluation of renal interstitial fibrosis by detecting collagen deposition or reflecting tissue oxygenation status [71]. Notably, a study by Hysi et al. demonstrated a significant correlation between PAI signals and the degree of fibrosis in ex vivo human kidney tissues, indicating its potential clinical value in assessing donor kidney quality for transplantation [72]. However, in vivo clinical studies of PAI in renal fibrosis remain limited, and further validation is required before widespread clinical application.
In summary, ultrasound techniques provide complementary non-invasive approaches for evaluating renal fibrosis in elderly patients. Elastography methods, such as SWE and RTE, quantify tissue stiffness, reflecting structural injury, whereas microvascular imaging, including SMI, CEUS, and PAI, enables assessment of microvascular perfusion and early pathological changes. Integrating these techniques can enhance diagnostic accuracy and provide a more comprehensive evaluation of renal fibrosis, highlighting the potential of multimodal ultrasound in both research and clinical practice. However, further large-scale, multicenter studies are warranted to validate their clinical utility and standardize their application in elderly populations.
3.3.2. CT/PET-CT
Ultrasound-based images are highly operator-dependent, whereas contrast-enhanced computed tomography (CT) images are more reproducible and suitable for data-driven quantitative analysis. Furthermore, CT examinations are less costly than MRI and enable extensive data acquisition in routine clinical practice. CT radiomics shows excellent performance in the non-invasive assessment of renal fibrosis: Choi et al. constructed a model based on the total parenchymal features of the left kidney in 95 patients, achieving an AUC of 0.89 for distinguishing moderate-to-severe chronicity [73]; Ren et al. developed a combined model integrating clinical factors such as eGFR and UACR, with an AUC of 0.918 for predicting severe renal interstitial fibrosis, while realizing end-to-end automation and nomogram visualization [74]. Both studies confirm that total parenchymal features are the core imaging input, and the integration of clinical factors can optimize practical value, providing a new direction for replacing renal biopsy and conducting long-term follow-up.
At present, studies have shown that contrast-enhanced CT can be used to assess renal structure and function; however, elderly patients often have baseline renal function impairment, dehydration, or concomitant use of nephrotoxic medications, and iodinated contrast agents may further aggravate renal insufficiency. Therefore, the application of contrast-enhanced CT in the clinical evaluation of elderly patients should be carefully considered.
Positron emission tomography/computed tomography (PET/CT) is an imaging technology combining function and anatomy. It can noninvasively evaluate biochemical processes in vivo by using specific molecular probes (tracers). In recent years, PET/CT quantitatively evaluates the accumulation of radioactive tracers in fibrotic tissues by using molecular probes specific to specific biological processes or molecules, so as to clarify the disease mechanism and provide high specificity and sensitivity [75]. Fibroblast activating protein (FAP) is an atypical type II transmembrane serine protease [76]. FAP can hardly be detected in normal organs, but it is significantly up-regulated in tissue remodeling areas (including renal fibrosis and pulmonary fibrosis), which can be used as a biomarker of fibrosis [77]. FAP inhibitors (FAPIs) are small molecular compounds synthesized based on quinoline structure, which can specifically bind to FAP on the surface of cancer associated fibroblasts (CAFs) [76]. At present, after being labeled with positron emission radioisotopes, FAPIs can be used as a new tracer to provide a new tool for the diagnosis and prognosis of a variety of diseases. Many animal experiments and clinical studies have confirmed that using FAP targeted tracers (such as [18F]FAPI-42, [18F]AIF-NOTA-FAPI, [68Ga]Ga-FAPI-04) to image the kidney can sensitively detect renal fibrosis, and its signal intensity is positively correlated with the severity of renal fibrosis, and can predict the progress of fibrosis [78,79,80]. Figure 3 presents the representative PET images of [68Ga]Ga-FAPI-04 in the control group and adenine induced CKD rats at modeling weeks 1, 2, 4, and 6. It intuitively shows that the uptake of radioactive tracers in the renal region of CKD rats increases progressively with the progression of renal fibrosis, while the dynamic difference of low uptake levels is maintained in the control group(The figure was firstly publicated in Molecular Pharmaceutics in 2023 by Mao et al.)[79]. Zhao et al. further found that the uptake of Fluorine-18-FAPI (18F-FAPI) by the kidney was closely related to the progression of CKD, and had a complex relationship with eGFR, which was better than other tracers in the correlation with the severity of CKD, such as Fluorine-18-L-dihydroxyphenylalanine (18F-DOPA) and gallium-68 (68Ga)18F-prostate specific membrane antigen(PSMA), highlighting its potential as a highly sensitive molecular imaging biomarker for renal fibrosis assessment [81].
In summary, CT radiomics and PET/CT provide complementary non-invasive strategies for renal fibrosis assessment in elderly patients. CT radiomics enables reproducible structural quantification suitable for large-scale and longitudinal studies, whereas FAP-targeted PET/CT offers highly specific molecular-level evaluation of fibroblast activation. Further prospective, large-scale studies in elderly populations are required to validate their clinical utility and optimize risk–benefit balance.

3.3.3. fMRI
In recent years, renal functional magnetic resonance imaging (fMRI) has developed rapidly and has been increasingly validated as a powerful non-invasive tool for the comprehensive assessment of renal morphology and function. Compared with ultrasound-based techniques that primarily reflect tissue stiffness and CT/PET approaches that emphasize structural or molecular features, fMRI uniquely enables multiparametric, radiation-free evaluation of renal oxygenation, perfusion, diffusion microstructure, and biomechanical properties within a single examination. Renal fibrosis profoundly alters water diffusion patterns, tissue oxygenation, microvascular perfusion, and mechanical stiffness. Accordingly, fMRI provides multidimensional insight into the pathophysiological processes underlying CKD progression and renal aging, making it particularly attractive for repeated assessment in elderly patients. At present, the main magnetic resonance imaging techniques include blood oxygenation level-dependent MRI (BOLD-MRI), arterial spin labeling (ASL), diffusion-weighted imaging (DWI), intravoxel incoherent motion (IVIM), diffusion tensor imaging (DTI), diffusion kurtosis imaging (DKI) and magnetic resonance elastography (MRE).
BOLD-MRI is based on the principle that deoxyhemoglobin has a paramagnetic effect. It indirectly reflects the oxygen partial pressure in tissues by measuring the level of tissue apparent relaxation rate (R2* = 1/t2*). BOLD-MRI has been proven to be effective in detecting the changes of renal oxygenation, and R2* is directly proportional to the level of tissue deoxyhemoglobin [82]. Li et al. found that the average renal medulla R2* of the healthy elderly was 38.22 ± 4.48 Hz, which was higher than that of the healthy young people, reflecting that renal oxygenation was slightly abnormal with age [83]. However, interpretation of BOLD-MRI remains complex, as its signal is influenced by multiple confounders, including hydration status, hematocrit, sodium balance, microvascular density, and renal blood volume. These limitations highlight that BOLD-MRI is best interpreted in conjunction with complementary perfusion and diffusion parameters rather than as a standalone fibrosis biomarker [84,85].
ASL-MRI is a technique that can quantitatively evaluate renal blood perfusion without exogenous contrast agents. It measures renal blood flow (RBF) (mL/min/100 g) by labeling water molecules in arterial blood as endogenous tracers [86]. Compared with BOLD-MRI, which can absolutely quantify the renal blood perfusion parameters, the quantitative parameters obtained by BOLD imaging are the result of the complex interaction between RBF, renal blood volume and oxygen consumption [87]. Comparing the transplant recipients with healthy controls, the peritubular capillary density of the transplanted kidney decreased significantly, and the cortical RBF measured by ASL-MRI decreased with the increase of fibrosis, which was negatively correlated with Banff fibrosis score [88,89]. Mao et al. found that ASL derived RBF has high accuracy in differentiating different degrees of interstitial fibrosis (ROC AUC can reach more than 0.90), which indicates that ASL derived RBF has high accuracy in evaluating the degree of interstitial fibrosis [90]. However, due to low signal-to-noise ratio and resolution limitations, larger longitudinal studies are needed to assess its potential in CKD and fibrosis stratification.
DWI-MRI can be used to quantify the Brownian motion of water molecules in tissues and provide information about the microstructure of tissues. The apparent diffusion coefficient (ADC) can be obtained by single exponential fitting. Due to the deposition of extracellular matrix and the increase in cell density, renal fibrosis will restrict the free diffusion of water molecules, resulting in a decrease of ADC [70,91]. Some studies have pointed out that in animal models of diabetic nephropathy and patients with renal artery stenosis, renal ADC value is negatively correlated with the degree of interstitial fibrosis [92,93,94]. Suo et al. found that the ADC value of healthy people’s kidneys is affected by age and gender. With increasing age, the ADC decreased. The average ADC value of the whole kidney of the elderly is 2.15 × 10⁻³ mm2/s. In a pathological state, the lower the ADC value, the greater the restricted diffusion of water molecules in tissues. According to the normal ADC value range of the elderly, it can be judged that the decrease of ADC is caused by age or acute and chronic renal lesions [95]. Hueper et al. studied the ability of ADC to distinguish acute and chronic kidney lesions after AKI in the mouse model of ischemic AKI. The ADC value of the renal cortex decreased significantly at each time point after AKI, and at 4 weeks after AKI, the ADC value of the kidney changed with the severity of AKI and the degree of renal interstitial fibrosis [96].
DTI is the development and deepening of DWI, which quantifies the fractional anisotropy (FA) of water molecules by different diffusion velocities in all directions of three-dimensional space. FA decreased in renal tubular injury and renal microstructure changes, which were closely related to renal function. Interstitial fibrosis, glomerulosclerosis, and inflammatory infiltration all of which affect FA values. A study based on transplanted kidneys showed that FA and ADC were positively correlated with eGFR and negatively correlated with the degree of fibrosis [97]. In addition, the AUC of DTI is greater than that of ASL in accurately identifying allograft fibrosis [98]. In patients with CKD, cortical FA and ADC may help to distinguish DN patients from healthy individuals and assess the severity of fibrosis [99]. Therefore, DTI is a promising non-invasive method for evaluating renal insufficiency and fibrosis.
IVIM uses a double exponential model to separate the diffusion of water molecules and capillary perfusion to obtain pure water diffusion ADC (D), pseudo perfusion ADC (D*), and perfusion fraction (ƒ). D value is a parameter reflecting the movement of water molecules within and between cells. D* can evaluate the microcirculation or perfusion in blood vessels [100,101]. At the same time, f value represents total tissue perfusion, including all blood flow to capillaries [102]. Compared with conventional DWI, IVIM can evaluate tissue capillary perfusion alone. Animal renal fibrosis model experiment showed that there was a correlation between the decrease of IVIM parameters and renal fibrosis [100,103,104,105]. Some IVIM studies on CKD showed that D value and D* value were negatively correlated with the stage of CKD, while D value and ƒ value were positively correlated with eGFR. In addition, studies have shown that the ƒ value is significantly negatively correlated with the total renal pathological score (including interstitial fibrosis and tubular atrophy) [106,107,108]. Therefore, animal experiments and clinical studies have shown the great potential and advantages of IVIM in the evaluation of renal fibrosis. Mao et al. compared IVIM parameters (D, D*, ƒ) between CKD patients and healthy volunteers, and found that all IVIM parameters of CKD patients were significantly lower than those of the control group [109]. Figure 4 shows reduced field-of-view (FOV) IVIM DWI and pathological comparison of typical mild fibrosis and severe fibrosis cases in kidney transplant recipients (The figure was firstly publicated in European Radiology in 2021 by Yu et al.) [89].

Figure 4. Comparison of reduced FOV IVIM DWI and pathological findings [89]. Panels (a–f) are from a 34-year-old man with mild fibrosis, while panels (g–l) are from a 41-year-old man with severe fibrosis. (a,g) b0 images; (b,h) ADCT maps; (c,i) D maps; (d,j) D* maps; (e,k) ƒmaps; (f,l) Masson trichrome stain (original magnification, ×100). In renal allografts with mild fibrosis, the pseudocolour maps are red, indicating higher cortical total ADC (ADCT) and perfusion fraction values. The Masson trichrome stain (original magnification, ×100) demonstrated more severe fibrosis in the patient in the right column images than in the left column images. ADC = apparent diffusion coefficient.
DKI is an extension of DTI, which is used to quantify the non Gaussian distribution of water molecule diffusion in tissues. It has two parameters: apparent diffusion kurtosis K, which reflects the peak distribution of tissue diffusion rate, and diffusion coefficient D under non Gaussian distribution similar to ADC [110]. The higher the K value and the lower the D value, the greater the influence on the movement of water molecules, which may reflect the greater damage to the renal parenchyma. Early animal models of renal fibrosis and studies on healthy volunteers have confirmed that DKI is feasible in human kidneys [110,111] and can be used to evaluate renal fibrosis in animal models [112]. DKI has been used to evaluate renal fibrosis in CKD patients. The average D value of renal parenchyma is negatively correlated with histopathological fibrosis score (interstitial fibrosis and tubular atrophy), while the average K value of renal parenchyma is positively correlated with histopathological fibrosis score [113,114]. Liu et al. also conducted a prospective study, and the renal ADC value obtained from DKI showed significant predictive value for the prognosis of CKD patients, which may be a promising non-invasive follow-up technology for CKD patients [115]. In addition, Mao et al. reported that DKI can be used to evaluate the change of renal function and the degree of renal pathological injury in patients with CKD, and the diagnostic effect of K is better than ADC in distinguishing mild renal injury from moderate and severe renal injury [116].
Similar to SWE, MRE-DWI is a fMRI technology that can quantify tissue mechanical characteristics (tissue hardness and viscosity) in vivo. Zhang et al. found that the renal MRE hardness value of CKD patients was negatively correlated with the volume of extracellular matrix. The excessive accumulation of extracellular matrix (mainly composed of collagen) was the main factor of tissue fibrosis, and MRE could reflect the degree of renal interstitial fibrosis [117]. However, renal stiffness is influenced not only by fibrosis but also by renal perfusion and intrarenal pressure, and common comorbidities in elderly patients, such as hypertension and atherosclerosis, further complicate its assessment. Future studies may combine MRE with perfusion techniques, such as ASL, to correct for stiffness and establish age-stratified reference standards to improve diagnostic accuracy in elderly populations.
Overall, multiparametric fMRI enables integrated, radiation-free assessment of renal oxygenation, perfusion, microstructural diffusion, and biomechanical properties, providing pathophysiological information that is difficult to capture with other imaging modalities. These characteristics make fMRI particularly suitable for longitudinal evaluation of renal fibrosis in elderly patients and serve as an important complement to ultrasound- and CT/PET-based imaging approaches.
3.3.4. Nanotechnology
Nanotechnology is a non-invasive imaging technique for evaluating renal fibrosis in vivo by using nano materials or system design and targeting biomarkers of renal fibrosis. Zhu et al. developed a non-invasive imaging evaluation method for renal fibrosis in vivo. By targeting type I collagen, the main component of pathological renal fibrosis, they prepared a nano delivery system of anti type I collagen antibody combined with polyethylene glycol coated gold nanoparticles as imaging agent, which can be selectively located in type I collagen to monitor the degree of renal fibrosis, visualize renal fibrosis in vitro and in situ, and can be used for nondestructive quantification of renal fibrosis [118]. Yan et al. synthesized a nanoscale fluorophore AIE-4PEG550 with aggregation induced emission characteristics, which has good light stability, biocompatibility and renal excretion efficiency. It can visualize the progress of fibrosis in the longitudinal direction through dual-mode imaging (short wave infrared fluorescence imaging and photoacoustic imaging) [119]. The silica nanoparticles fluorescence imaging tool developed by Shirai et al. It can specifically bind to macrophage surface differentiation cluster 11b, deposit in areas of renal inflammation and fibrosis, and assist in the diagnosis of renal fibrosis [120]. Studies have found that matrix metalloproteinases (MMPs) are involved in the pathological process of renal fibrosis, and their content can reflect the integrity of connective tissue, providing potential opportunities for the detection and intervention of renal fibrosis [121]. Yu et al. developed a nano platform based on dopamine nanospheres and fluorescent labeled aptamers to evaluate the progress of renal fibrosis by detecting the ratio of MMP9 and MMP2 in urine, which has the advantages of simplicity, strong specificity and high sensitivity [122]. These new biomarkers, combined with imaging methods, are expected to improve the accuracy of diagnosis and staging of renal fibrosis, but it still needs a large number of clinical data and long-term research validation.
Nanotechnology has shown a good application prospect in the diagnosis of renal fibrosis in the elderly. These techniques have high sensitivity and specificity, and can achieve early, minimally invasive and even non-invasive diagnosis. Nanotechnology provides a potential alternative for elderly patients who are in poor physical condition and not suitable for invasive examination. However, the safety, biocompatibility and metabolic pathways of nanomaterials still need to be further studied, especially in the elderly with general decline in physiological function.
Overall, the diagnosis of renal fibrosis requires a combination of invasive and non-invasive methods. Although renal biopsy remains the reference standard, its invasiveness and limited applicability in elderly patients highlight the need for alternative approaches. Serum and urinary biomarkers provide accessible indicators of extracellular matrix turnover and inflammation. Non-invasive imaging techniques—including ultrasound elastography, FAPI-PET/CT, and multiparametric functional MRI—offer quantitative and repeatable assessments of tissue stiffness, fibroblast activation, perfusion, and microstructure, greatly enhancing the effectiveness of fibrosis evaluation. In addition, emerging nanotechnology-based strategies enable targeted molecular detection and signal amplification, further improving sensitivity for early fibrosis identification. Together, these complementary tools form a more comprehensive and safer diagnostic framework, particularly valuable for elderly patients in whom repeated biopsy is often impractical. In this review, we summarize the advantages and disadvantages of different diagnostic methods for renal fibrosis in elderly patients, as shown in Table 2.
Table 2. Advantages and disadvantages of different diagnostic methods for renal fibrosis in elderly patients.
|
Method |
Advantages |
Disadvantages |
|---|---|---|
|
Renal biopsy (invasive) |
Gold standard for histological diagnosis |
High risk of bleeding, infection; often contraindicated due to comorbidities (cardiovascular disease, coagulation disorders) |
|
MRI |
Non-invasive, provides quantitative assessment of fibrosis and renal perfusion |
Expensive, not suitable for patients with pacemakers or severe frailty |
|
Ultrasound elastography |
Safe, radiation-free, widely available; good for follow-up evaluation |
Operator-dependent, limited accuracy in obese or uncooperative elderly patients |
|
Blood/urine biomarkers |
Simple, repeatable, and well tolerated |
May lack specificity; influenced by systemic inflammation or comorbidities |
|
Nanotechnology-based imaging |
Promising for early detection with high sensitivity |
Still experimental; long-term biosafety in elderly remains uncertain |
4. Conclusions
With the intensification of global aging, the risk of CKD in the elderly population continues to increase. As the core pathological mechanism of CKD progression to end-stage renal disease, accurate assessment of renal fibrosis is crucial for clinical diagnosis and treatment. This article systematically reviews the characteristics of elderly kidney aging and the diagnostic system for kidney fibrosis, providing a reference for clinical practice.
The aging of elderly kidneys is characterized by multidimensional structural and functional remodeling. Structurally, it manifests as glomerulosclerosis, tubular atrophy, interstitial fibrosis, and renal vascular degeneration; Functionally, it manifests as a physiological decrease in eGFR, accompanied by decreased renal tubular function, endocrine disorders, and other related conditions. In the diagnosis of renal fibrosis, its application is limited in elderly patients due to limitations such as invasiveness, sampling errors, and poor reproducibility. Non invasive diagnostic technology has become the mainstream development direction: in laboratory testing, new fibrosis markers are convenient and reproducible, but the specificity of a single marker is insufficient and susceptible to systemic inflammation interference; among imaging techniques, ultrasound elastography is safe, convenient, and suitable for follow-up. PET/CT (FAPI targeted imaging) has high specificity, and fMRI can evaluate pathophysiological changes from multiple dimensions, such as oxygenation, perfusion, and microstructure. Each technique has its own advantages and limitations; Nanotechnology enables early, precise imaging by targeting biomarkers such as type I collagen and MMPs, providing a new option for elderly patients intolerant of invasive examinations. However, the biocompatibility of nanomaterials still needs to be verified.
In the future, the diagnosis of renal fibrosis will focus on optimizing and upgrading existing technologies, as well as multidimensional integration. In the field of biomarkers, further multi center large sample research is needed to verify the clinical value of novel biomarkers, explore the combination detection mode of multiple related biomarkers, reduce the interference of systemic inflammation, comorbidities and other factors, and improve diagnostic specificity; Establish a reference threshold for age stratified biomarkers to optimize diagnostic accuracy based on the physiological characteristics of the elderly population. In terms of imaging technology, it is necessary to promote standardized operating procedures for ultrasound elastography to reduce operator dependence on factors such as body shape and renal blood flow; Deepen the joint application of multiple parameters in fMRI, optimize parameter combinations through artificial intelligence algorithms, and improve the detection rate and staging accuracy of early fibrosis; Expand the clinical validation of FAPI targeted PET/CT in elderly patients and clarify its safety and efficacy in patients with concomitant renal dysfunction. In the field of nanotechnology, the focus is on breaking through the biocompatibility and metabolic safety issues of nanomaterials, accelerating the clinical translation of targeted imaging tools, and developing portable detection devices and rapid test kits to enhance the screening capabilities of primary healthcare institutions. In addition, it is necessary to strengthen the connection between basic research and clinical applications, explore more specific biological targets, promote the coordinated development of non-invasive diagnostic technologies and targeted therapies, and ultimately provide accurate and convenient disease-monitoring plans for elderly CKD patients, delay fibrosis progression, and improve long-term prognosis.
Author Contributions
Q.C: writing the manuscript, and approving the final version. J.Z: reviewing and editing the manuscript, and approving the final version.
Ethics Statement
Not applicable.
Informed Consent Statement
Not applicable.
Data Availability Statement
Not applicable.
Funding
Key Medical Research Project of Jiangsu Provincial Health Commission, ‘Application Research of Multimodal Imaging System for Renal Function in the Diagnosis, Prognosis, and Targeted Intervention of Acute Kidney Injury’ (K2024051).
Declaration of Competing Interest
The authors declare that they have no known competing financial interests or personal relationships that could have appeared to influence the work reported in this paper.
References
- United Nations, Department of Economic and Social Affairs, Population Division. World Population Prospects 2022. Available online: https://population.un.org/wpp/ (accessed on 1 October 2025) .
- Kovesdy CP. Epidemiology of chronic kidney disease: An update 2022. Kidney Int. Suppl. 2022, 12, 7–11. DOI:10.1016/j.kisu.2021.11.003 [Google Scholar]
- Ferenbach DA, Bonventre JV. Mechanisms of maladaptive repair after AKI leading to accelerated kidney ageing and CKD. Nat. Rev. Nephrol. 2015, 11, 264–276. DOI:10.1038/nrneph.2015.3 [Google Scholar]
- Djudjaj S, Boor P. Cellular and molecular mechanisms of kidney fibrosis. Mol. Asp. Med. 2019, 65, 16–36. DOI:10.1016/j.mam.2018.06.002 [Google Scholar]
- Van Asbeck AH, Dieker J, Boswinkel M, Van Der Vlag J, Brock R. Kidney-targeted therapies: A quantitative perspective. J. Control. Release 2020, 328, 762–775. DOI:10.1016/j.jconrel.2020.09.022 [Google Scholar]
- Denic A, Glassock RJ, Rule AD. The kidney in normal aging: A comparison with chronic kidney disease. Clin. J. Am. Soc. Nephrol. 2022, 17, 137–139. DOI:10.2215/CJN.10580821 [Google Scholar]
- Wiggins JE. Aging in the Glomerulus. J. Gerontol. Ser. A Biol. Sci. Med. Sci. 2012, 67, 1358–1364. DOI:10.1093/gerona/gls157 [Google Scholar]
- Denic A, Glassock RJ, Rule AD. Structural and functional changes with the aging kidney. Adv. Chronic Kidney Dis. 2016, 23, 19–28. DOI:10.1053/j.ackd.2015.08.004 [Google Scholar]
- Silva FG. The aging kidney: A review—Part I. Int. Urol. Nephrol. 2005, 37, 185–205. DOI:10.1007/s11255-004-0873-6 [Google Scholar]
- Ricaurte Archila L, Denic A, Mullan AF, Narasimhan R, Bogojevic M, Thompson RH, et al. A higher foci density of interstitial fibrosis and tubular atrophy predicts progressive CKD after a radical nephrectomy for tumor. J. Am. Soc. Nephrol. 2021, 32, 2623–2633. DOI:10.1681/ASN.2021020267 [Google Scholar]
- Wang X, Vrtiska TJ, Avula RT, Walters LR, Chakkera HA, Kremers WK, et al. Age, kidney function, and risk factors associate differently with cortical and medullary volumes of the kidney. Kidney Int. 2014, 85, 677–685. DOI:10.1038/ki.2013.359 [Google Scholar]
- Noronha IL, Santa-Catharina GP, Andrade L, Coelho VA, Jacob-Filho W, Elias RM. Glomerular filtration in the aging population. Front. Med. 2022, 9, 769329. DOI:10.3389/fmed.2022.769329 [Google Scholar]
- Bunnag S, Einecke G, RZeeve J, Jhangri GS, Mueller TF, Sis B, et al. Molecular correlates of renal function in kidney transplant biopsies. J. Am. Soc. Nephrol. 2009, 20, 1149–1160. DOI:10.1681/ASN.2008080863 [Google Scholar]
- Delanaye P, Melsom T, Ebert N, Bäck SE, Mariat C, Cavalier E, et al. Iohexol plasma clearance for measuring glomerular filtration rate in clinical practice and research: A review. Part 2: why to measure glomerular filtration rate with iohexol? Clin. Kidney J. 2016, 9, 700–704. DOI:10.1093/ckj/sfw071 [Google Scholar]
- Soveri I, Berg UB, Björk J, Elinder CG, Grubb A, Mejare I, et al. Measuring GFR: A systematic review. Am. J. Kidney Dis. 2014, 64, 411–424. DOI:10.1053/j.ajkd.2014.04.010 [Google Scholar]
- Potok OA, Rifkin DE, Ix JH, Shlipak MG, Satish A, Schneider A, et al. Estimated GFR accuracy when cystatin C– and creatinine-based estimates are discrepant in older adults. Kidney Med. 2023, 5, 100628. DOI:10.1016/j.xkme.2023.100628 [Google Scholar]
- Xia F, Hao W, Liang J, Zhao Z, Wu Y, Yu F, et al. Comparison of estimated glomerular filtration rate equations based on serum creatinine-, cystatin C- and creatinine–cystatin C in elderly Chinese patients. Int. Urol. Nephrol. 2022, 55, 943–952. DOI:10.1007/s11255-022-03370-7 [Google Scholar]
- Luckey AE. Fluid and electrolytes in the aged. Arch. Surg. 2003, 138, 1055. DOI:10.1001/archsurg.138.10.1055 [Google Scholar]
- Rizzoni D, Rizzoni M, Nardin M, Chiarini G, Agabiti-Rosei C, Aggiusti C, et al. Vascular aging and disease of the small vessels. High. Blood Press. Cardiovasc. Prev. 2019, 26, 183–189. DOI:10.1007/s40292-019-00320-w [Google Scholar]
- Bosworth C, De Boer IH. Impaired vitamin D metabolism in CKD. Semin. Nephrol. 2013, 33, 158–168. DOI:10.1016/j.semnephrol.2012.12.016 [Google Scholar]
- Lema-Perez L, Builes-Montaño CE, Alvarez H. A phenomenological-based semi-physical model of the kidneys and its role in glucose metabolism. J. Theor. Biol. 2021, 508, 110489. DOI:10.1016/j.jtbi.2020.110489 [Google Scholar]
- Moreso F, Lopez M, Vallejos A, Giordani C, Riera L, Fulladosa X, et al. Serial protocol biopsies to quantify the progression of chronic transplant nephropathy in stable renal allografts. Am. J. Transplant. 2001, 1, 82–88. DOI:10.1034/j.1600-6143.2001.010115.x [Google Scholar]
- Marcussen N, Olsen TS, Benediktsson H, Racusen L, Solez K. Reproducibility of the Banff classification of renal allograft pathology. Transplantation 1995, 60, 1083–1089. DOI:10.1097/00007890-199511270-00004 [Google Scholar]
- Furness PN, Taub N. Convergence of European Renal Transplant Pathology Assessment Procedures (CERTPAP) Project. International variation in the interpretation of renal transplant biopsies: Report of the CERTPAP Project. Kidney Int. 2001, 60, 1998–2012. DOI:10.1046/j.1523-1755.2001.00030.x [Google Scholar]
- Farris AB, Adams CD, Brousaides N, Della Pelle PA, Collins AB, Moradi E, et al. Morphometric and visual evaluation of fibrosis in renal biopsies. J. Am. Soc. Nephrol. 2011, 22, 176–186. DOI:10.1681/ASN.2009091005 [Google Scholar]
- Ambroise MM, Pathak N, Gunasekaran I, Ramdas A. Evaluation of renal interstitial fibrosis by trichrome staining, immunohistochemical and morphometrical analysis, and its correlation with renal dysfunction. J. Microsc. Ultrastruct. 2024, 10-4103. DOI:10.4103/jmau.jmau_19_24 [Google Scholar]
- Zhao H, Jiang N, Han Y, Yang M, Gao P, Xiong X, et al. Aristolochic acid induces renal fibrosis by arresting proximal tubular cells in G2/M phase mediated by HIF-1α. FASEB J. 2020, 34, 12599–12614. DOI:10.1096/fj.202000949R [Google Scholar]
- Park JH, Jun JH, Shim JK, Shin EJ, Shin E, Kwak YL. Effects of post ischemia-reperfusion treatment with trimetazidine on renal injury in rats: Insights on delayed renal fibrosis progression. Oxid. Med. Cell. Longev. 2018, 2018, 1072805. DOI:10.1155/2018/1072805 [Google Scholar]
- Li M, Zhou H, Di J, Yang M, Jia F. ILK participates in renal interstitial fibrosis by altering the phenotype of renal tubular epithelial cells via TGF-β1/smad pathway. Eur. Rev. Med. Pharmacol. Sci. 2019, 23, 289–296. DOI:10.26355/eurrev_201901_16775 [Google Scholar]
- Wang JL, Chen CW, Tsai MR, Liu SF, Hung TJ, Hung YJ, et al. Antifibrotic role of PGC-1α-siRNA against TGF-β1-induced renal interstitial fibrosis. Exp. Cell Res. 2018, 370, 160–167. DOI:10.1016/j.yexcr.2018.06.016 [Google Scholar]
- Lin YQ, Chen TT, Wang CC, Zhou Y, Cai XQ, Jiang Y, et al. The relationship between serum HIF-1α, TGF-β1 and renal interstitial fibrosis and disease progression in patients with chronic kidney disease. Chin. J. Gen. Practic. 2021, 19, 1868. DOI:10.16766/j.cnki.issn.1674-4152.002188. (In Chinese) [Google Scholar]
- Hu Q, Lan J, Liang W, Chen Y, Chen B, Liu Z, et al. MMP7 damages the integrity of the renal tubule epithelium by activating MMP2/9 during ischemia–reperfusion injury. J. Mol. Histol. 2020, 51, 685–700. DOI:10.1007/s10735-020-09914-4 [Google Scholar]
- Stene C, Polistena A, Gaber A, Nodin B, Ottochian B, Adawi D, et al. MMP7 modulation by short- and long-term radiotherapy in patients with rectal cancer. In Vivo 2018, 32, 133. DOI:10.21873/invivo.11215 [Google Scholar]
- Zhou D, Tian Y, Sun L, Li X, Zhou L, Xiao L, et al. Matrix metalloproteinase-7 is a urinary biomarker and pathogenic mediator of kidney fibrosis. J. Am. Soc. Nephrol. 2017, 28, 598–611. DOI:10.1681/ASN.2016030354 [Google Scholar]
- Ke B, Fan C, Yang L, Fang X. Matrix metalloproteinases-7 and kidney fibrosis. Front. Physiol. 2017, 8, 21. DOI:10.3389/fphys.2017.00021 [Google Scholar]
- Wang H, Zheng C, Lu Y, Jiang Q, Yin R, Zhu P, et al. Urinary Fibrinogen as a Predictor of Progression of CKD. Clin. J. Am. Soc. Nephrol. 2017, 12, 1922–1929. DOI:10.2215/CJN.01360217 [Google Scholar]
- Varatharajan S, Jain V, Pyati AK, Neeradi C, Reddy KS, Pallavali JR, et al. Neutrophil gelatinase-associated lipocalin, kidney injury molecule-1, and periostin: Novel urinary biomarkers in diabetic nephropathy. World J. Nephrol. 2024, 13, 98880. DOI:10.5527/wjn.v13.i4.98880 [Google Scholar]
- Jana S, Mitra P, Dutta A, Khatun A, Kumar Das T, Pradhan S, et al. Early diagnostic biomarkers for acute kidney injury using cisplatin-induced nephrotoxicity in rat model. Curr. Res. Toxicol. 2023, 5, 100135. DOI:10.1016/j.crtox.2023.100135 [Google Scholar]
- Siddiqui K, Joy SS, Al-Rubeaan K. Association of urinary monocyte chemoattractant protein-1 (MCP-1) and kidney injury molecule-1 (KIM-1) with risk factors of diabetic kidney disease in type 2 diabetes patients. Int. Urol. Nephrol. 2019, 51, 1379–1386. DOI:10.1007/s11255-019-02201-6 [Google Scholar]
- Ix JH, Shlipak MG. The promise of tubule biomarkers in kidney disease: A review. Am. J. Kidney Dis. 2021, 78, 719–727. DOI:10.1053/j.ajkd.2021.03.026 [Google Scholar]
- Fang X, Hu J, Chen Y, Shen W, Ke B. Dickkopf-3: Current knowledge in kidney diseases. Front. Physiol. 2020, 11, 533344. DOI:10.3389/fphys.2020.533344 [Google Scholar]
- Federico G, Meister M, Mathow D, Heine GH, Moldenhauer G, Popovic ZV, et al. Tubular dickkopf-3 promotes the development of renal atrophy and fibrosis. JCI Insight 2016, 1, e84916. DOI:10.1172/jci.insight.84916 [Google Scholar]
- Segarra-Medrano A, Carnicer-Caceres C, Valtierra-Carmeno N, Agraz-Pamplona I, Ramos-Terrades N, Jatem Escalante E, et al. Value of urinary levels of interleukin-6, epidermal growth factor, monocyte chemoattractant protein type 1 and transforming growth factor β1 in predicting the extent of fibrosis lesions in kidney biopsies of patients with IgA nephropathy. Nefrologia 2017, 37, 531–538. DOI:10.1016/j.nefro.2016.11.017 [Google Scholar]
- Doke T, Abedini A, Aldridge DL, Yang YW, Park J, Hernandez CM, et al. Single-cell analysis identifies the interaction of altered renal tubules with basophils orchestrating kidney fibrosis. Nat. Immunol. 2022, 23, 947–959. DOI:10.1038/s41590-022-01200-7 [Google Scholar]
- Ferraioli G, Filice C, Castera L, Choi BI, Sporea I, Wilson SR, et al. WFUMB guidelines and recommendations for clinical use of ultrasound elastography: Part 3: Liver. Ultrasound Med. Biol. 2015, 41, 1161–1179. DOI:10.1016/j.ultrasmedbio.2015.03.007 [Google Scholar]
- Bojunga J, Dauth N, Berner C, Meyer G, Holzer K, Voelkl L, et al. Acoustic radiation force impulse imaging for differentiation of thyroid nodules. PLoS ONE 2012, 7, e42735. DOI:10.1371/journal.pone.0042735 [Google Scholar]
- Wojcinski S, Brandhorst KA, Sadigh G, Hillemanns P, Degenhardt F. Acoustic radiation force impulse imaging with Virtual Touch™ tissue quantification: Mean shear wave velocity of malignant and benign breast masses. Int. J. Women’s Health 2013, 2013, 619–627. DOI:10.2147/IJWH.S50953 [Google Scholar]
- Yashima Y, Sasahira N, Isayama H, Kogure H, Ikeda H, Hirano K, et al. Acoustic radiation force impulse elastography for noninvasive assessment of chronic pancreatitis. J. Gastroenterol. 2012, 47, 427–432. DOI:10.1007/s00535-011-0491-x [Google Scholar]
- Kwon HJ. Acoustic radiation force impulse elastography for hepatocellular carcinoma-associated radiofrequency ablation. World J. Gastroenterol. 2011, 17, 1874. DOI:10.3748/wjg.v17.i14.1874 [Google Scholar]
- Garra BS. Imaging and estimation of tissue elasticity by ultrasound. Ultrasound Q. 2007, 23, 255–268. DOI:10.1097/ruq.0b013e31815b7ed6 [Google Scholar]
- Alric L, Kamar N, Bonnet D, Danjoux M, Abravanel F, Lauwers-Cances V, et al. Comparison of liver stiffness, fibrotest and liver biopsy for assessment of liver fibrosis in kidney-transplant patients with chronic viral hepatitis: Noninvasive tests to assess liver fibrosis. Transpl. Int. 2009, 22, 568–573. DOI:10.1111/j.1432-2277.2009.00834.x [Google Scholar]
- Bob F, Grosu I, Sporea I, Bota S, Popescu A, Sirli R, et al. Is there a correlation between kidney shear wave velocity measured with VTQ and histological parameters in patients with chronic glomerulonephritis? A pilot study. Med. Ultrason. 2018, 1, 27. DOI:10.11152/mu-1117 [Google Scholar]
- Hu Q, Zhang WJ, Lin ZQ, Wang XY, Zheng HY, Wei HM, et al. Combined acoustic radiation force impulse and conventional ultrasound in the quantitative assessment of immunoglobulin a nephropathy. Ultrasound Med. Biol. 2019, 45, 2309–2316. DOI:10.1016/j.ultrasmedbio.2019.05.013 [Google Scholar]
- Yang X, Yu N, Yu J, Wang H, Li X. Virtual touch tissue quantification for assessing renal pathology in idiopathic nephrotic syndrome. Ultrasound Med. Biol. 2018, 44, 1318–1326. DOI:10.1016/j.ultrasmedbio.2018.02.012 [Google Scholar]
- Sigrist RMS, Liau J, Kaffas AE, Chammas MC, Willmann JK. Ultrasound elastography: Review of techniques and clinical applications. Theranostics 2017, 7, 1303–1329. DOI:10.7150/thno.18650 [Google Scholar]
- Song P, Zhao H, Manduca A, Urban MW, Greenleaf JF, Chen S. Comb-push ultrasound shear elastography (CUSE): A novel method for two-dimensional shear elasticity imaging of soft tissues. IEEE Trans. Med. Imaging 2012, 31, 1821–1832. DOI:10.1109/TMI.2012.2205586 [Google Scholar]
- Chen Z, Wang Y, Gunda ST, Han X, Su Z, Ying MT. Integrating shear wave elastography and estimated glomerular filtration rate to enhance diagnostic strategy for renal fibrosis assessment in chronic kidney disease. Quant. Imaging Med. Surg. 2024, 14, 1766. DOI:10.21037/qims-23-962. [Google Scholar]
- The BE1 Study Group, Cosgrove DO, Berg WA, Doré CJ, Skyba DM, Henry JP, et al. Shear wave elastography for breast masses is highly reproducible. Eur. Radio. 2012, 22, 1023–1032. DOI:10.1007/s00330-011-2340-y [Google Scholar]
- Asano K, Ogata A, Tanaka K, Ide Y, Sankoda A, Kawakita C, et al. Acoustic radiation force impulse elastography of the kidneys: Is shear wave velocity affected by tissue fibrosis or renal blood flow? J. Ultrasound Med. 2014, 33, 793–801. DOI:10.7863/ultra.33.5.793 [Google Scholar]
- Liu X, Li N, Xu T, Sun F, Li R, Gao Q, et al. Effect of renal perfusion and structural heterogeneity on shear wave elastography of the kidney: An in vivo and ex vivo study. BMC Nephrol. 2017, 18, 265. DOI:10.1186/s12882-017-0679-2 [Google Scholar]
- Gennisson JL, Grenier N, Combe C, Tanter M. Supersonic shear wave elastography of in vivo pig kidney: Influence of blood pressure, urinary pressure and tissue anisotropy. Ultrasound Med. Biol. 2012, 38, 1559–1567. DOI:10.1016/j.ultrasmedbio.2012.04.013 [Google Scholar]
- Makita A, Nagao T, Miyoshi KI, Koizumi Y, Kurata M, Kondo F, et al. The association between renal elasticity evaluated by real-time tissue elastography and renal fibrosis. Clin. Exp. Nephrol. 2021, 25, 981–987. DOI:10.1007/s10157-021-02063-2 [Google Scholar]
- Fleig S, Magnuska ZA, Koczera P, Salewski J, Djudjaj S, Schmitz G, et al. Advanced ultrasound methods to improve chronic kidney disease diagnosis. NPJ Imaging 2024, 2, 22. DOI:10.1038/s44303-024-00023-5 [Google Scholar]
- Armaly Z, Abu-Rahme M, Kinaneh S, Hijazi B, Habbasshi N, Artul S. An Innovative Ultrasound Technique for Early Detection of Kidney Dysfunction: Superb Microvascular Imaging as a Reference Standard. J. Clin. Med. 2022, 11, 925. DOI:10.3390/jcm11040925 [Google Scholar]
- Qin X, Liu X, Xia L, Luo Q, Zhang C. Multimodal ultrasound deep learning to detect fibrosis in early chronic kidney disease. Ren. Fail. 2024, 46, 2417740. DOI:10.1080/0886022X.2024.2417740 [Google Scholar]
- Schneider AG, Hofmann L, Wuerzner G, Glatz N, Maillard M, Meuwly JY, et al. Renal perfusion evaluation with contrast-enhanced ultrasonography. Nephrol. Dial. Transplant. 2012, 27, 674–681. DOI:10.1093/ndt/gfr345 [Google Scholar]
- Cosgrove D, Lassau N. Imaging of perfusion using ultrasound. Eur. J. Nucl. Med. Mol. Imaging 2010, 37 (Suppl. S1), S65–S85. DOI:10.1007/s00259-010-1537-7 [Google Scholar]
- Yang W, Mou S, Xu Y, Du J, Xu L, Li F, et al. Contrast-enhanced ultrasonography for assessment of tubular atrophy/interstitial fibrosis in immunoglobulin A nephropathy: A preliminary clinical study. Abdom. Radiol. 2018, 43, 1423–1431. DOI:10.1007/s00261-017-1301-6 [Google Scholar]
- Huang P, Xu N, Qi R. Study of interstitial fibrosis and renal tubule atrophy in transplanted kidney by contrast-enhanced ultrasound. J. Med. Res. Combat. Trauma. 2025, 38, 620–624. DOI:10.16571/j.cnki.2097-2768.2025.06.010. (In Chinese) [Google Scholar]
- Jiang B, Liu F, Fu H, Mao J. Advances in imaging techniques to assess kidney fibrosis. Ren. Fail. 2023, 45, 2171887. DOI:10.1080/0886022X.2023.2171887 [Google Scholar]
- Okumura K, Matsumoto J, Iwata Y, Yoshida K, Yoneda N, Ogi T, et al. Evaluation of renal oxygen saturation using photoacoustic imaging for the early prediction of chronic renal function in a model of ischemia-induced acute kidney injury. PLoS ONE 2018, 13, e0206461. DOI:10.1371/journal.pone.0206461 [Google Scholar]
- Hysi E, He X, Fadhel MN, Zhang T, Krizova A, Ordon M, et al. Photoacoustic imaging of kidney fibrosis for assessing pretransplant organ quality. JCI Insight 2020, 5, e136995. DOI:10.1172/jci.insight.136995 [Google Scholar]
- Choi YH, Kim JE, Lee RW, Kim B, Shin HC, Choe M, et al. Histopathological correlations of CT-based radiomics imaging biomarkers in native kidney biopsy. BMC Med. Imaging 2024, 24, 256. DOI:10.1186/s12880-024-01434-x [Google Scholar]
- Ren Y, Yang F, Li W, Zhang Y, Kang S, Cui F. End-to-end CT radiomics-based pipeline for predicting renal interstitial fibrosis grade in CKD patients. Acad. Radiol. 2025, 32, 3464–3474. DOI:10.1016/j.acra.2024.12.050 [Google Scholar]
- Velikyan I, Rosenström U, Estrada S, Ljungvall I, Häggström J, Eriksson O, et al. Synthesis and preclinical evaluation of 68Ga-labeled collagelin analogs for imaging and quantification of fibrosis. Nucl. Med. Biol. 2014, 41, 728–736. DOI:10.1016/j.nucmedbio.2014.06.001 [Google Scholar]
- Dendl K, Koerber SA, Kratochwil C, Cardinale J, Finck R, Dabir M, et al. FAP and FAPI-PET/CT in malignant and non-malignant diseases: A perfect symbiosis? Cancers 2021, 13, 4946. DOI:10.3390/cancers13194946 [Google Scholar]
- Hamson EJ, Keane FM, Tholen S, Schilling O, Gorrell MD. Understanding fibroblast activation protein (FAP): Substrates, activities, expression and targeting for cancer therapy. Proteom. Clin. Appl. 2014, 8, 454–463. DOI:10.1002/prca.201300095 [Google Scholar]
- Huang J, Cui S, Chi X, Cong A, Yang X, Su H, et al. Dynamically visualizing profibrotic maladaptive repair after acute kidney injury by fibroblast activation protein imaging. Kidney Int. 2024, 106, 826–839. DOI:10.1016/j.kint.2024.07.015 [Google Scholar]
- Mao H, Chen L, Wu W, Zhang L, Li X, Chen Y, et al. Noninvasive assessment of renal fibrosis of chronic kidney disease in rats by [68Ga]Ga-FAPI-04 small animal PET/CT and biomarkers. Mol. Pharm. 2023, 20, 2714–2725. DOI:10.1021/acs.molpharmaceut.3c00163 [Google Scholar]
- Zhou Y, Yang X, Liu H, Luo W, Liu H, Lv T, et al. Value of [68Ga]ga-FAPI-04 imaging in the diagnosis of renal fibrosis. Eur. J. Nucl. Med. Mol. Imaging 2021, 48, 3493–3501. DOI:10.1007/s00259-021-05343-x [Google Scholar]
- Zhao X, Fu W. Application value of Philips Ingenuity TF PET/CT scanner imaging agent FAP in evaluating renal fibrosis. Hell. J. Nucl. Med. 2025, 28, 28–35. DOI:10.1967/s002449912784 [Google Scholar]
- Pruijm M, Milani B, Burnier M. Blood oxygenation level-dependent MRI to assess renal oxygenation in renal diseases: Progresses and challenges. Front. Physiol. 2017, 7, 667. DOI:10.3389/fphys.2016.00667 [Google Scholar]
- Li H, Cao W, Zhang X, Sun B, Jiang S, Li J, et al. BOLD-fMRI reveals the association between renal oxygenation and functional connectivity in the aging brain. NeuroImage 2019, 186, 510–517. DOI:10.1016/j.neuroimage.2018.11.030 [Google Scholar]
- Neugarten J, Golestaneh L. Blood oxygenation level-dependent MRI for assessment of renal oxygenation. Int. J. Nephrol. Renov. Dis. 2014, 7, 421–435. DOI:10.2147/IJNRD.S42924 [Google Scholar]
- Fine LG, Dharmakumar R. Limitations of BOLD-MRI for assessment of hypoxia in chronically diseased human kidneys. Kidney Int. 2012, 82, 934–935. DOI:10.1038/ki.2012.283 [Google Scholar]
- Nery F, Buchanan CE, Harteveld AA, Odudu A, Bane O, Cox EF, et al. Consensus-based technical recommendations for clinical translation of renal ASL MRI. Magn. Reson. Mater. Phys. Biol. Med. 2020, 33, 141–161. DOI:10.1007/s10334-019-00800-z [Google Scholar]
- Chen WB, Liang L, Zhang B, Liu CL, Liu HJ, Luo HY, et al. To evaluate the damage of renal function in CIAKI rats at 3T: Using ASL and BOLD MRI. BioMed Res. Int. 2015, 2015, 1–8. DOI:10.1155/2015/593060 [Google Scholar]
- Jiang B, Wan JY, Tian YY, Xu R, Ma JL, Li J, et al. Arterial spin labeling in assessment of interstitial fibrosis in renal allografts. Zhonghua Yi Xue Za Zhi 2024, 104, 276–281. DOI:10.3760/cma.j.cn112137-20230726-00095 [Google Scholar]
- Yu YM, Wang W, Wen J, Zhang Y, Lu GM, Zhang LJ. Detection of renal allograft fibrosis with MRI: Arterial spin labeling outperforms reduced field-of-view IVIM. Eur. Radiol. 2021, 31, 6696–6707. DOI:10.1007/s00330-021-07818-9 [Google Scholar]
- Mao W, Ding X, Ding Y, Cao B, Fu C, Kuehn B, et al. Evaluation of interstitial fibrosis in chronic kidney disease by multiparametric functional MRI and histopathologic analysis. Eur. Radiol. 2022, 33, 4138–4147. DOI:10.1007/s00330-022-09329-7 [Google Scholar]
- Hua C, Qiu L, Zhou L, Zhuang Y, Cai T, Xu B, et al. Value of multiparametric magnetic resonance imaging for evaluating chronic kidney disease and renal fibrosis. Eur. Radiol. 2023, 33, 5211–5221. DOI:10.1007/s00330-023-09674-1 [Google Scholar]
- Zhang Z, Zha T, Jiang Z, Pan L, Liu Y, Dong C, et al. Using ultrahigh b-value diffusion-weighted imaging to noninvasively assess renal fibrosis in a rabbit model of renal artery stenosis. J. Comput. Assist. Tomogr. 2023, 47, 713–720. DOI:10.1097/RCT.0000000000001487 [Google Scholar]
- Su CH, Hsu YC, Thangudu S, Chen WY, Huang YT, Yu CC, et al. Application of multiparametric MR imaging to predict the diversification of renal function in miR29a-mediated diabetic nephropathy. Sci. Rep. 2021, 11, 1909. DOI:10.1038/s41598-021-81519-7 [Google Scholar]
- Ferguson CM, Eirin A, Abumoawad A, Saad A, Jiang K, Hedayat AF, et al. Renal fibrosis detected by diffusion-weighted magnetic resonance imaging remains unchanged despite treatment in subjects with renovascular disease. Sci. Rep. 2020, 10, 16300. DOI:10.1038/s41598-020-73202-0 [Google Scholar]
- Suo ST, Cao MQ, Ding YZ, Yao QY, Wu GY, Xu JR. Apparent diffusion coefficient measurements of bilateral kidneys at 3 T MRI: Effects of age, gender, and laterality in healthy adults. Clin. Radiol. 2014, 69, e491–e496. DOI:10.1016/j.crad.2014.08.009 [Google Scholar]
- Hueper K, Rong S, Gutberlet M, Hartung D, Mengel M, Lu X, et al. T2 relaxation time and apparent diffusion coefficient for noninvasive assessment of renal pathology after acute kidney injury in mice: Comparison with histopathology. Investig. Radiol. 2013, 48, 834–842. DOI:10.1097/RLI.0b013e31829d0414 [Google Scholar]
- Adams LC, Bressem KK, Scheibl S, Nunninger M, Gentsch A, Fahlenkamp UL, et al. Multiparametric assessment of changes in renal tissue after kidney transplantation with quantitative MR relaxometry and diffusion-tensor imaging at 3 T. J. Clin. Med. 2020, 9, 1551. DOI:10.3390/jcm9051551 [Google Scholar]
- Wan J, Jin M, Li J, Ma J, Que C, Jiang B, et al. Magnetic resonance diffusion tensor imaging is superior to arterial spin labeling in detecting renal allograft fibrosis. Quant. Imaging Med. Surg. 2025, 15, 3211–3221. DOI:10.21037/qims-24-1023 [Google Scholar]
- Buchanan CE, Mahmoud H, Cox EF, McCulloch T, Prestwich BL, Taal MW, et al. Quantitative assessment of renal structural and functional changes in chronic kidney disease using multi-parametric magnetic resonance imaging. Nephrol. Dial. Transplant. 2020, 35, 955–964. DOI:10.1093/ndt/gfz129 [Google Scholar]
- Cai X, Yu J, Zhou Q, Du B, Feng Y, Liu X. Use of intravoxel incoherent motion MRI to assess renal fibrosis in a rat model of unilateral ureteral obstruction. J. Magn. Reson. Imaging 2016, 44, 698–706. DOI:10.1002/jmri.25172 [Google Scholar]
- Ichikawa S, Motosugi U, Ichikawa T, Sano K, Morisaka H, Araki T. Intravoxel incoherent motion imaging of the kidney: Alterations in diffusion and perfusion in patients with renal dysfunction. Magn. Reson. Imaging 2013, 31, 414–417. DOI:10.1016/j.mri.2012.08.004 [Google Scholar]
- Henkelman RM. Does IVIM measure classical perfusion? Magn. Reson. Med. 2005, 16, 470–475. DOI:10.1002/mrm.1910160313 [Google Scholar]
- Hashim E, Yuen DA, Kirpalani A. Reduced flow in delayed graft function as assessed by IVIM is associated with time to recovery following kidney transplantation. J. Magn. Reson. Imaging 2021, 53, 108–117. DOI:10.1002/jmri.27245 [Google Scholar]
- Woo S, Cho JY, Kim SY, Kim SH. Intravoxel incoherent motion MRI-derived parameters and T2* relaxation time for noninvasive assessment of renal fibrosis: An experimental study in a rabbit model of unilateral ureter obstruction. Magn. Reson. Imaging 2018, 51, 104–112. DOI:10.1016/j.mri.2018.04.018 [Google Scholar]
- Zhang Q, Yu Z, Zeng S, Liang L, Xu Y, Zhang Z, et al. Use of intravoxel incoherent motion imaging to monitor a rat kidney chronic allograft damage model. BMC Nephrol. 2019, 20, 364. DOI:10.1186/s12882-019-1545-1 [Google Scholar]
- Mao W, Zhou J, Zeng M, Ding Y, Qu L, Chen C, et al. Chronic kidney disease: Pathological and functional evaluation with intravoxel incoherent motion diffusion-weighted imaging. Magn. Reson. Imaging 2018, 47, 1251–1259. DOI:10.1002/jmri.25861 [Google Scholar]
- Liang P, Yuan G, Li S, Peng X, Xu C, Benkert T, et al. Noninvasive assessment of renal function, Oxford classification and prognostic risk stratification of IgAN by using intravoxel incoherent motion diffusion-weighted imaging and blood oxygenation level-dependent MRI. J. Magn. Reson. Imaging 2022, 58, 879. DOI:10.1002/jmri.28565 [Google Scholar]
- Zhou SP, Wang Q, Zhai X, Chen P, Zhao J, Bai X, et al. The role of intravoxel incoherent motion diffusion-weighted imaging in distinguishing diabetic nephropathy from non-diabetic renal disease in diabetic patients. Zhonghua Nei Ke Za Zhi 2023, 62, 1288–1294. DOI:10.3760/cma.j.cn112138-20230520-00265 [Google Scholar]
- Mao W, Zhou J, Zeng M, Ding Y, Qu L, Chen C, et al. Intravoxel incoherent motion diffusion-weighted imaging for the assessment of renal fibrosis of chronic kidney disease: A preliminary study. Magn. Reson. Imaging 2018, 47, 118. DOI:10.1016/j.mri.2017.12.010 [Google Scholar]
- Rosenkrantz AB, Padhani AR, Chenevert TL, Koh D, De Keyzer F, Taouli B, et al. Body diffusion kurtosis imaging: Basic principles, applications, and considerations for clinical practice. J. Magn. Reson. Imaging 2015, 42, 1190–1202. DOI:10.1002/jmri.24985 [Google Scholar]
- Huang Y, Chen X, Zhang Z, Yan L, Pan D, Liang C, et al. MRI quantification of non-gaussian water diffusion in normal human kidney: A diffusional kurtosis imaging study. NMR Biomed. 2015, 28, 154–161. DOI:10.1002/nbm.3235 [Google Scholar]
- Li A, Liang L, Liang P, Hu Y, Xu C, Hu X, et al. Assessment of renal fibrosis in a rat model of unilateral ureteral obstruction with diffusion kurtosis imaging: Comparison with α-SMA expression and 18F-FDG PET. Magn. Reson. Imaging 2020, 66, 176–184. DOI:10.1016/j.mri.2019.08.035 [Google Scholar]
- Mao W, Ding Y, Ding X, Fu C, Zeng M, Zhou J. Diffusion kurtosis imaging for the assessment of renal fibrosis of chronic kidney disease: A preliminary study. Magn. Reson. Imaging 2021, 80, 113–120. DOI:10.1016/j.mri.2021.05.002 [Google Scholar]
- Liu Y, Zhang GMY, Peng X, Wen Y, Ye W, Zheng K, et al. Diffusional kurtosis imaging in assessing renal function and pathology of IgA nephropathy: A preliminary clinical study. Clin. Radiol. 2018, 73, 818–826. DOI:10.1016/j.crad.2018.05.012 [Google Scholar]
- Liu Y, Zhang GM, Peng X, Li X, Sun H, Chen L. Diffusion kurtosis imaging as an imaging biomarker for predicting prognosis in chronic kidney disease patients. Nephrol. Dial. Transplant. 2022, 37, 1451. DOI:10.1093/ndt/gfab229 [Google Scholar]
- Mao W, Ding Y, Ding X, Wang Y, Fu C, Zeng M, et al. Pathological assessment of chronic kidney disease with DWI: Is there an added value for diffusion kurtosis imaging? J. Magn. Reson. Imaging 2021, 54, 508. DOI:10.1002/jmri.27569 [Google Scholar]
- Zhang J, Yu Y, Liu X, Tang X, Xu F, Zhang M, et al. Evaluation of renal fibrosis by mapping histology and magnetic resonance imaging. Kidney Dis. 2021, 7, 131–142. DOI:10.1159/000513332 [Google Scholar]
- Zhu XY, Zou X, Mukherjee R, Yu Z, Ferguson CM, Zhou W, et al. Targeted imaging of renal fibrosis using antibody-conjugated gold nanoparticles in renal artery stenosis. Investig. Radiol. 2018, 53, 623–628. DOI:10.1097/RLI.0000000000000476 [Google Scholar]
- Yan D, Li T, Yang Y, Niu N, Wang D, Ge J, et al. A water-soluble AIEgen for noninvasive diagnosis of kidney fibrosis via SWIR fluorescence and photoacoustic imaging. Adv. Mater. 2022, 34, 2206643. DOI:10.1002/adma.202206643 [Google Scholar]
- Shirai T, Kohara H, Tabata Y. Inflammation imaging by silica nanoparticles with antibodies orientedly immobilized. J. Drug Target. 2012, 20, 535–543. DOI:10.3109/1061186X.2012.693500 [Google Scholar]
- Cheng Z, Limbu M, Wang Z, Liu J, Liu L, Zhang X, et al. MMP-2 and 9 in chronic kidney disease. Int. J. Mol. Sci. 2017, 18, 776. DOI:10.3390/ijms18040776 [Google Scholar]
- Yu XA, Hu Y, Zhang Y, Zhang R, Bai X, Gu L, et al. Integrating the polydopamine nanosphere/aptamers nanoplatform with a DNase-I-assisted recycling amplification strategy for simultaneous detection of MMP-9 and MMP-2 during renal interstitial fibrosis. ACS Sens. 2020, 5, 1119–1125. DOI:10.1021/acssensors.0c00058 [Google Scholar]