Operation Management Optimization of Hydropower Stations Based on Big Data Technology: A Case Study of X Hydropower Station Group

Operation Management Optimization of Hydropower Stations Based on Big Data Technology: A Case Study of X Hydropower Station Group

Received: 03 December 2025 Revised: 25 December 2025 Accepted: 13 January 2026 Published: 16 January 2026

© 2026 The authors. This is an open access article under the Creative Commons Attribution 4.0 International License (https://creativecommons.org/licenses/by/4.0/).
1. Introduction
Hydropower, as a clean energy generation method, occupies a crucial position in the energy sector. Amidst the current trends towards intelligent and modernized development, hydropower station operation management models have demonstrated diverse characteristics, encompassing combined operation and maintenance management, contracted maintenance and management, as well as the Operation and Maintenance Integration (OMI) model [1].
Scholars have conducted in-depth research on the operation and management of hydropower stations. For instance, Mbeutcha studied long-term power dispatch issues in large hydropower systems, exploring strategies to balance current power sales revenue with reservoir energy storage savings for future benefits, thereby solving long-term dispatch problems [2]. Pereira proposed a computational scheme capable of determining the most economical power generation decisions for power systems and hydropower stations at various stages, with results applicable to real-time generated weekly or monthly dispatch generation plans [3]. Chang introduced a short-term hydropower scheduling method based on Mixed Integer Linear Programming, used to determine the optimal or near-optimal scheduling of schedulable hydropower units in hydro-dominated systems [4]. Yamin provided a comprehensive review of power generation planning methods under regulated and deregulated power markets since 1951, covering a wide range of deterministic, meta-heuristic, and hybrid algorithms [5]. Juan presented a dynamic programming model to solve short-term scheduling problems in hydropower stations in a power energy sales market, aiming for maximum revenue. This model has been applied in actual hydropower plants and has been proven capable of providing operational plans that maximize hydropower plant revenue while satisfying multiple different types of constraints [6]. Paredes-Arquiola proposed a heuristic method that can obtain rule curves for multi-hydropower reservoir group scheduling systems, using optimization and simulation techniques to conduct extensive research on the operational laws of these systems [7]. Pathak stated that with the rapid increase in demand for high-quality products in the market, every organization should have a well-structured and planned management system to survive in a competitive world [8].
However, for a long time, the OMI model for hydropower stations has relied heavily on operators’ personal experience, rigid scheduling protocols, and basic data monitoring via Supervisory Control and Data Acquisition systems [9]. This traditional model gradually reveals its limitations when facing increasingly complex power grid demands, variable climatic conditions, and the challenges posed by aging equipment. First, the phenomenon of data silos is severe: Production, equipment, maintenance, hydrological, meteorological, and other data within hydropower stations are scattered across different business systems, forming data silos that hinder effective correlation analysis and comprehensive utilization [10,11,12]. Second, decision-making is highly subjective: Many critical decisions, such as unit start-stop operations and load distribution, depend heavily on dispatchers’ experience-based judgment and lack support from precise data models, making it difficult to achieve global optimization [13]. Third, the equipment maintenance model is outdated: Traditional periodic maintenance or post-failure repair models cannot accurately predict potential equipment failures, potentially leading to unnecessary maintenance costs and unplanned downtime losses [14]. Fourth, the operational efficiency is not fully tapped: Due to the inability to conduct in-depth analysis of massive operational data, the optimal operating conditions of units and the potential for refined utilization of water resources are difficult to fully explore, resulting in the waste of hydropower resources [15].
Big data technology, as one of the emerging technologies, brings new opportunities to hydropower station operation management. The significant roles of big data technology are reflected in establishing hydropower station big data management libraries, intelligent production, equipment maintenance, intelligent inspection and control, and safety management. However, the in-depth application of big data in the hydropower sector still faces numerous challenges. At the technical level, issues related to data quality and standardization remain bottlenecks that constrain the effectiveness of upper-layer applications [16,17]. The “black box” nature of advanced artificial intelligence algorithms (such as deep learning) has raised significant concerns regarding their interpretability in critical decision-making applications [18]. Additionally, the complexity and high costs associated with multi-system integration pose further challenges. At the management level, promoting the application of big data necessitates corresponding organizational restructuring and business process reengineering. There is a severe shortage of composite talents who possess both expertise in hydropower operations and data science. Moreover, big data projects involve substantial investments and long cycles, and the quantitative evaluation system for return on investment remains imperfect. At the standardization level, the industry still lacks unified data standards, interface specifications, and widely recognized benchmarks for measuring the performance and application benefits of big data systems [19,20]. These issues, to a certain extent, hinder the large-scale promotion of technologies and the benchmarking improvements across the industry.
In the operation and management of hydropower stations, load rate serves as a pivotal performance indicator, directly influencing the supply-demand balance and operational efficiency of the power system. To gain a deeper understanding of the seasonal variations in load rate and their implications for the power system, this paper primarily aims to address two core questions. (1) How can we analyze the trends in load rate across different seasons or months and identify the key factors influencing it, thereby providing data support for power system planning and energy strategy formulation? And (2) how can we establish a grey prediction model based on historical data to forecast future changes in load rate, enhancing the dispatch capabilities of hydropower stations and the stability of power supply?
2. Methods
This paper proposes a method for optimizing the operational management of hydropower stations by integrating K-means clustering with a grey prediction model, with the framework underpinned by big data technology. First, we integrated historical operational dispatch data—including water levels, inflow rates, and power generation output—and employed a hierarchical clustering approach to group the diverse influencing factors of cascade hydropower stations. This process generated clustering curves that delineate data characteristics across different seasons and operational states. Next, we established a grey prediction model tailored to variations in hydropower station load factors, which facilitates the forecasting of optimal power generation plans. This integrated model delivered robust data support and a reliable decision-making framework for the operational management of hydropower stations.
2.1. K-Means Clustering Algorithm
The K-means clustering algorithm is a classic distance-based, non-hierarchical clustering method. Operating on the principle of minimizing an objective error function, the algorithm partitions a dataset into a predefined number of clusters (denoted as K), with the silhouette coefficient serving as its primary evaluation metric. A core tenet of this approach is that smaller distances between two data points imply higher inter-sample similarity. Within the K-means framework, sample similarity is quantified using the Euclidean distance, denoted as [$$d\left(i,j\right)$$]. The distance between an individual sample and a cluster is defined as the distance from that sample to the cluster’s centroid [$$d\left(ei,x\right)$$], while the distance between two clusters is represented by the distance between their respective centroids [$$d\left(ei,ej\right)$$].
A key limitation of K-means is that clustering results are sensitive to the random selection of initial centroids, which can lead to significant deviations from the globally optimal clustering solution. In practice, to mitigate this limitation and improve result robustness, multiple initial centroid sets are typically tested, with the K-means algorithm executed repeatedly for a predefined number of iterations. For continuous datasets, the cluster centroid is calculated as the mean of all data points within that cluster. However, if some sample attributes are categorical variables, the mean is not a meaningful or well-defined metric for centroid calculation. In such instances, the K-modes algorithm is employed instead to identify the cluster centroid.
With respect to data type handling and similarity measurement, continuous attributes are first subjected to zero-mean normalization prior to distance calculation. The data matrix for a dataset containing n samples and p attributes is expressed as follows:
|
```latex\left[\begin{array}{ccc}{x}_{11}& \cdots & {x}_{1p}\\ ⋮& \ddots & ⋮\\ {x}_{n1}& \cdots & {x}_{np}\end{array}\right]``` |
The Euclidean distance between two samples is formally defined as $$\sqrt{{\left({x}_{i1}\mathrm{ }-\mathrm{ }{x}_{j1}\right)}^{2}+\mathrm{ }{\left({x}_{i2}\mathrm{ }-\mathrm{ }{x}_{j2}\right)}^{2}\mathrm{ }+\mathrm{ }{\left({x}_{ip}\mathrm{ }-\mathrm{ }{x}_{jp}\right)}^{2}}$$.
The Sum of Squared Errors (SSE) serves as the objective function for evaluating clustering quality. Between two distinct clustering outcomes, the solution with the lower SSE value is selected as the optimal result.
For continuous attributes, the SSE objective function is defined as $$\sum _{i=1}^{K}\sum _{x \in {E}_{i}}{dist\left(ei,x\right)}^{2}$$, where the cluster center $${e}_{i}$$ of cluster $${E}_{i}$$ is $$\frac{1}{{n}_{i}}\sum _{x\in{E}_{i}}x$$; and $${n}_{i}$$ represents the number of samples in cluster number i.
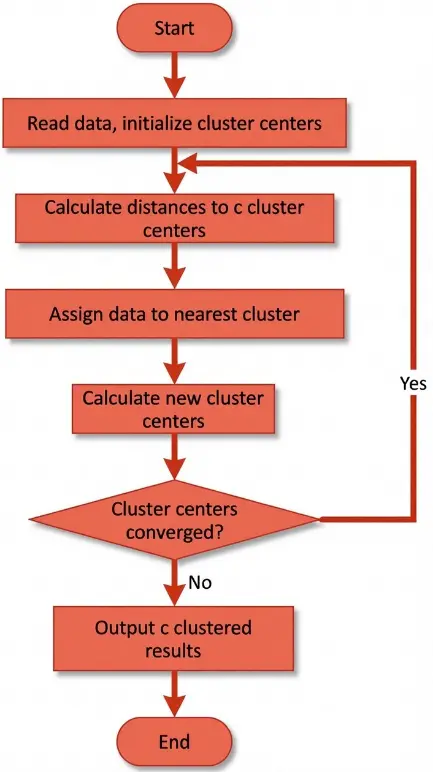
The solution workflow of the K-means clustering algorithm is illustrated in Figure 1 [21]. Step 1: Randomly select K objects from the n-sample dataset to serve as the initial cluster centroids. Step 2: Calculate the distance from each sample to every cluster centroid, then assign each sample to the nearest cluster. Step 3: After all samples have been assigned, recalculate the centroid for each cluster. Step 4: Compare the newly calculated centroids with those obtained in the previous iteration. If the centroids have changed, return to Step 2; if not, proceed to Step 5. Step 5: Terminate the algorithm when the centroids stabilize (i.e., no longer change) and output the final clustering results.
2.2. Grey Prediction Model
To account for fluctuations in hydropower station load factors, this study first identifies and analyzes key influencing factors to extract their variation patterns, thereby enhancing our understanding of the stations’ operational dynamics. Using the processed dataset, this study develops a predictive model for fluctuations in hydropower station load factor and uses it to forecast monthly load factor values. Among the available predictive modelling approaches, the grey prediction model was selected for this application.
The GM(1.1) model exhibits distinct advantages over traditional statistical models [22]. On the one hand, its predictive accuracy is independent of sample size, enabling high-precision forecasts even with a limited dataset. On the other hand, it delivers higher accuracy for predictions closer to the current time horizon—a characteristic inherent to its fundamental operating principles. By analyzing these dynamic relationships, this study seeks to develop a continuous dynamic model that characterizes the system’s behavior over time.
3. Materials
3.1. Overview of the Case: X Hydropower Station Group (X HSG)
The X Hydropower Station Group (X HSG), located in Province S, China, accounts for a relatively small proportion of the total installed hydropower capacity in this province. However, due to the nearly 30 years of operation of some of its stations, it still plays a crucial role in ensuring the stable operation of the local grid and promoting the consumption of clean electricity in the province. The hydropower stations already in operation within the river basin of the X HSG demonstrate relatively inadequate regulation capabilities. A leading reservoir with significant storage capacity is situated upstream of this hydropower station group to optimize overall regulatory performance, while the downstream experiences considerable load fluctuations influenced by other basins and weather conditions.
After years of capacity building in the basin, the midstream and downstream power generation projects of the X HSG are nearing completion. The current development model is anchored by a key hydropower station with notable storage and regulation functions, strategically positioned upstream, while downstream stations exhibit more moderate regulation performance, scattered along the river. This multi-layered development strategy aims to maximize the utilization of the extensive reservoir capacity of the leading hydropower station and the significant elevation drop across the entire basin, thereby efficiently tapping into and utilizing hydraulic energy resources.
Currently, five power stations—A, B, C, D, and E—have been built and are operational within the basin where the X HSG is located. Among them, A to D are daily regulating stations, while E is an annual regulating station. Generally, the regulatory capacity of stations located further downstream is weaker. Consequently, stations A, B, C, and D, situated downstream of the X HSG, exhibit notable scheduling limitations, particularly in medium- to long-term basin management. Research in this area primarily focuses on urgent daily scheduling strategy planning. In the upstream region of the X HSG, due to the presence of a leading station with substantial reservoir capacity and installed generation scale, precise control of the water level in this leading station before the flood season can effectively partially regulate the flow during wet and dry seasons in the downstream basin, thereby achieving efficient utilization of water resources. Therefore, the core concern in optimizing the scheduling strategy for the X HSG lies in formulating a long-term scheduling plan for this leading station.
The X HSG case boasts strong sample representativeness, attributed to the following four aspects. First, X HSG adopts the typical structure of “an upstream annual regulating leading hydropower station + downstream daily regulating cascaded hydropower stations”, which reproduces the core scenario of cascaded coordinated dispatching in the industry. Second, some stations have been in operation for decades, confronting issues such as equipment aging, limitations of the traditional OMI model, and scattered data. These issues are the common pain points shared by existing hydropower stations worldwide. Third, constrained by both regional climate and power grid load fluctuations, X HSG faces challenges like seasonal supply-demand balance and load response speed, which are universal in global hydropower operations. Fourth, the combination of “daily regulating stations + an annual regulating station” is one of the standard models for cascaded dispatching in the industry, and its coordinated optimization is a core research topic in this field.
3.2. Data Preparation
Historical scheduling information for the upstream cascade hydropower stations in the X HSG may include structured big data on water levels, inflow rates, power generation, etc. In this paper, MySQL is used as the underlying persistent database, and data acquisition tools such as Flume and Kafka, along with the OpenRefine data cleaning toolkit, are employed to extract and integrate historical scheduling information from various data sources.
Kafka, a data stream processing tool, is used to acquire real-time operational data from hydropower stations. MySQL database management software is used to store and manage historical scheduling information. Python toolkits such as Scikit-learn, Numpy, and Pandas are used for data analysis and modeling.
Data cleaning tools are used to clean and process historical scheduling information to ensure data quality and consistency. Based on Python data analysis toolkits such as Scikit-learn, this paper employs hierarchical clustering methods to analyze and obtain typical output curves for the daily output curves of hydropower stations.
In the initial stage of data acquisition, preprocessing for data cleaning is crucial. Its core task is to correct, eliminate, or replace defects in the original dataset, such as missing values, outliers, and duplicates, to ensure data purity and thus make the results of model training more accurate. Data samples primarily consist of factors such as water levels, 96-point load (Table 1), inflow rates, dry and floods, etc., and scheduling decisions are heavily reliant on these data [23].
Table 1. Schematic illustration of a 96-point load curve data sample for a hydropower station on a day.
|
00:15 |
00:30 |
00:45 |
01:00 |
01:15 |
01:30 |
01:45 |
02:00 |
|
20 |
20 |
20 |
20 |
20 |
160 |
160 |
160 |
|
02:15 |
02:30 |
02:45 |
03:00 |
03:15 |
03:30 |
03:45 |
04:00 |
|
160 |
160 |
160 |
160 |
160 |
160 |
20 |
20 |
|
04:15 |
04:30 |
04:45 |
05:00 |
05:15 |
05:30 |
05:45 |
06:00 |
|
20 |
20 |
20 |
20 |
20 |
20 |
20 |
20 |
|
06:15 |
06:30 |
06:45 |
07:00 |
07:15 |
07:30 |
07:45 |
08:00 |
|
20 |
20 |
20 |
20 |
20 |
20 |
20 |
20 |
|
08:15 |
08:30 |
08:45 |
09:00 |
09:15 |
09:30 |
09:45 |
10:00 |
|
20 |
20 |
20 |
20 |
20 |
100 |
100 |
100 |
|
10:15 |
10:30 |
10:45 |
11:00 |
11:15 |
11:30 |
11:45 |
12:00 |
|
100 |
100 |
100 |
100 |
100 |
100 |
100 |
100 |
|
12:15 |
12:30 |
12:45 |
13:00 |
13:15 |
13:30 |
13:45 |
14:00 |
|
150 |
150 |
150 |
150 |
150 |
150 |
150 |
150 |
|
14:15 |
14:30 |
14:45 |
15:00 |
15:15 |
15:30 |
15:45 |
16:00 |
|
150 |
150 |
150 |
150 |
150 |
150 |
150 |
150 |
|
16:15 |
16:30 |
16:45 |
17:00 |
17:15 |
17:30 |
17:45 |
18:00 |
|
150 |
150 |
150 |
150 |
150 |
150 |
150 |
150 |
|
18:15 |
18:30 |
18:45 |
19:00 |
19:15 |
19:30 |
19:45 |
20:00 |
|
150 |
20 |
20 |
20 |
20 |
20 |
20 |
20 |
|
20:15 |
20:30 |
20:45 |
21:00 |
21:15 |
21:30 |
21:45 |
22:00 |
|
20 |
20 |
200 |
260 |
260 |
260 |
260 |
260 |
|
22:15 |
22:30 |
22:45 |
23:00 |
23:15 |
23:30 |
23:45 |
0:00 |
|
260 |
260 |
260 |
260 |
260 |
260 |
260 |
260 |
Note: Odd-numbered rows represent the time of the day, and even-numbered rows represent the output (MW) of the station.
Overall, scheduling data can be roughly divided into two categories: one is time-related, such as the seasonal characteristics of the locations of the hydropower stations. For example, the rainfall patterns in Province S significantly affect the load demand of hydropower stations. During the flood season, due to abundant water sources, hydropower stations usually operate at full load and rarely participate in peak shaving. In the dry season, due to reduced flow, hydropower stations maintain higher water levels to maximize power generation potential. Although power generation is low, they play an important role in peak shaving, helping to smooth the overall load curve of the power grid. Therefore, to accurately reflect differences in scheduling strategies across seasons, model training should be conducted separately for the wet and dry seasons.
The other category is numerical data, such as water levels, flow rates, and power station output loads. When collecting these data, sensors are typically relied upon. However, the data integrity is often challenged. For example, water level data is recorded hourly. If a sensor fails, it may result in several days of zero value recordings or sudden changes at the end of measurements. In the data cleaning stage, we need to fill in missing values by comparing historical similar situations and make reasonable inferences and corrections for sudden changes in water levels. The processing methods for flow data and power station output loads are similar and will not be detailed here.
4. Results and Discussions
4.1. Hierarchical Clustering of Output Curves for Cascade Hydropower Stations
During flood seasons, the load of hydropower stations tends to be stable, whereas during dry seasons, it fluctuates significantly. This subsection employs K-means clustering to specifically analyze the output curves of upstream hydropower stations with poor regulation performance during the dry season, using data from January to May. The clustering process employs the group average method to measure the distance between clusters.
The results are visualized in a three-dimensional space, where the position of each point is determined by its water level, inflow, and load rate. In Figure 2, each cluster is represented by a different color, allowing for the observation of data point aggregation patterns. The spatial distribution of clusters reveals the central tendency and dispersion patterns of data points, highlighting data variations across different periods. Overall, the model classifies records into internally homogeneous groups based on multidimensional data, offering valuable insights for water level and inflow management to support further analysis. In general, during the dry season, data values on the average water level axis are primarily concentrated between 1129 m and 1130 m. During the flood season, these water level values are mainly between 1126 m and 1128 m, with a broader range due to greater water level fluctuations. For the average inflow axis, values during the dry season are mostly between 200 m3/s and 400 m3/s. During the flood season, they range from 200 m3/s to 1200 m3/s, indicating a substantial increase in inflow. As for the load rate axis, values during the dry season are primarily below 30%. During the flood season, they range from 40% to 100%, indicating a significantly higher load rate.
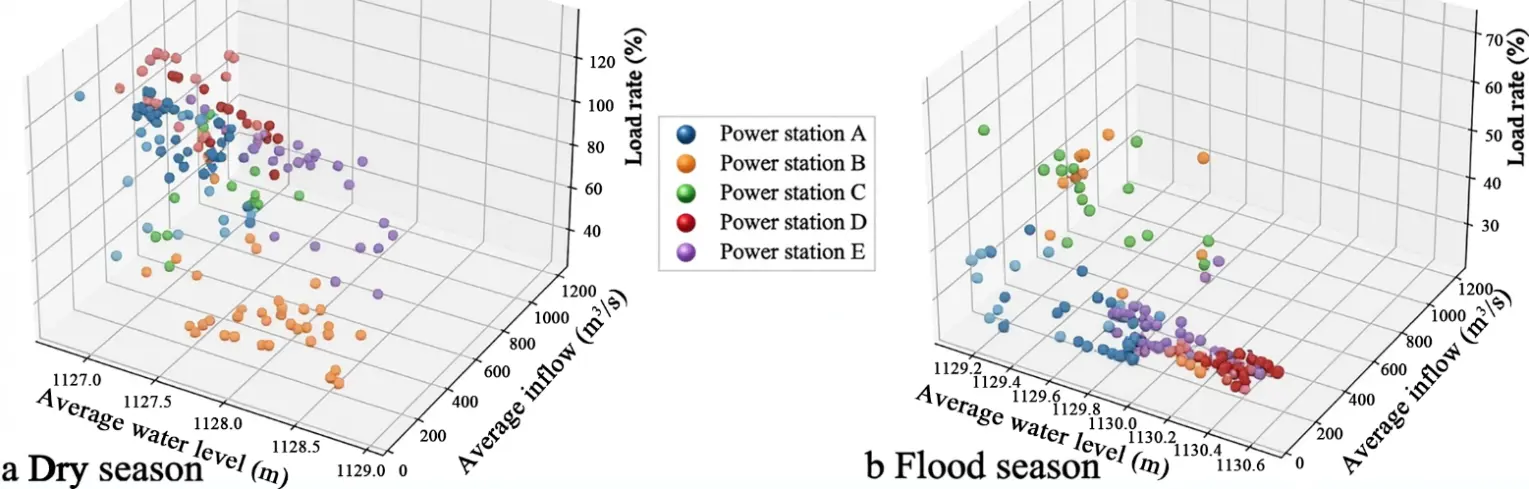
Figure 2. K-means clustering of load rate, water level, and inflow for power stations A, B, C, D, and E.
The use of the average calculation method aims to reduce data dimensionality to facilitate effective clustering analysis and data visualization. In the original dataset, features shown in Figure 2 consist of multiple columns. Directly utilizing these multi-column data for clustering would lead to high-dimensional data processing, which increases computational complexity and poses difficulties for visualization. By computing the average value for each feature column, data dimensionality is effectively reduced, rendering clustering results more distinct and visualization more intuitive and comprehensible. This method not only simplifies data processing but also improves the operability and interpretability of data analysis.
From this clustering analysis, various operational states of the hydropower stations can be inferred. For instance, high water levels and high inflow (observed at Hydropower Station C) indicate peak power generation potential, while lower water levels and inflow (observed at Hydropower Station A) may correspond to maintenance periods or low-power generation periods. The temporal dimension reveals potential seasonal variations in water levels and inflow, which are crucial for the operation and management of hydropower stations.
By comparing the clustering plots of the dry and flood seasons, patterns of changes in inflow and water levels can be identified. Inflow and water levels are significantly higher during the flood season than during the dry season, which is an important consideration for hydropower station operation and management. Particularly during the flood season, hydropower stations need to respond to potential extreme weather events and schedule operations reasonably to ensure a safe and stable power supply.
4.2. Short-Term Scheduling Method for Cascaded Hydropower Stations Based on Big Data
Utilizing big data methods to construct a rational and precise scheduling strategy for cascaded hydropower stations can effectively improve the efficiency of day-ahead planning in power systems. This subsection analyzes load rates across different time periods each day, which are often influenced by various factors such as temperature variations, seasonal demands, and industrial production activities. Therefore, analyzing the load rates for 96 time periods per day facilitates a better understanding of how these influencing factors affect power system operations. By leveraging a grey prediction model, load rate data for each time period in the upcoming month are accurately forecasted. This series of work provides support for designing an innovative strategy to establish effective short-term operational scheduling plans for cascaded hydropower stations.
4.2.1. Data Analysis
The load rate refers to the ratio of the load in a power system within a specific period to its rated capacity, serving as a crucial indicator for assessing the operational status and supply-demand balance of the power system. Load rates are influenced by various factors, including temperature changes, seasonal demands, and industrial production activities, across different seasons and months. To ensure efficient operation and management of hydropower stations and a stable power supply, it is essential to conduct in-depth analyses of the seasonal factors affecting load rates. Through such analyses, variation patterns of load rates can be identified and predicted, thereby providing a scientific basis for the planning, operation, and scheduling of power systems. Furthermore, this analysis not only helps reveal the impact of seasonal demand changes on power systems but also assists stakeholders in formulating more precise and adaptable energy strategies. Therefore, this work explores the significance of studying load rates for power system planning and management, as well as their variations across different months.
First, variations in load rates across different months reflect differences in seasonal demands. For instance, in summer, rising temperatures lead to increased use of electrical devices such as air conditioners, resulting in higher power demand and a corresponding rise in load rates. In winter, the increased use of heating equipment similarly affects load rates, albeit with potentially opposite trends compared to summer. Thus, analyzing load rate variations across different months helps understand the impact of seasonal demands on power systems.
Second, analyzing load rates for different months supports the planning and management of power systems. By understanding load rate trends across various months, energy suppliers, government agencies, and businesses can formulate corresponding energy production and consumption strategies to meet monthly power demands and optimize the efficiency of energy resource utilization. Additionally, analyzing load rates enables the prediction of future energy demands, providing a reference for the operation and scheduling of power systems to ensure the stability and reliability of the power supply.
Time series diagrams were plotted to display daily load value changes for each hydropower station intuitively. Then, by identifying curves with significant fluctuations in daily load rate data, the most representative typical dates were selected for further analysis (Figure 3). By comparing load characteristics across different hydropower stations, similar load fluctuation patterns emerged.
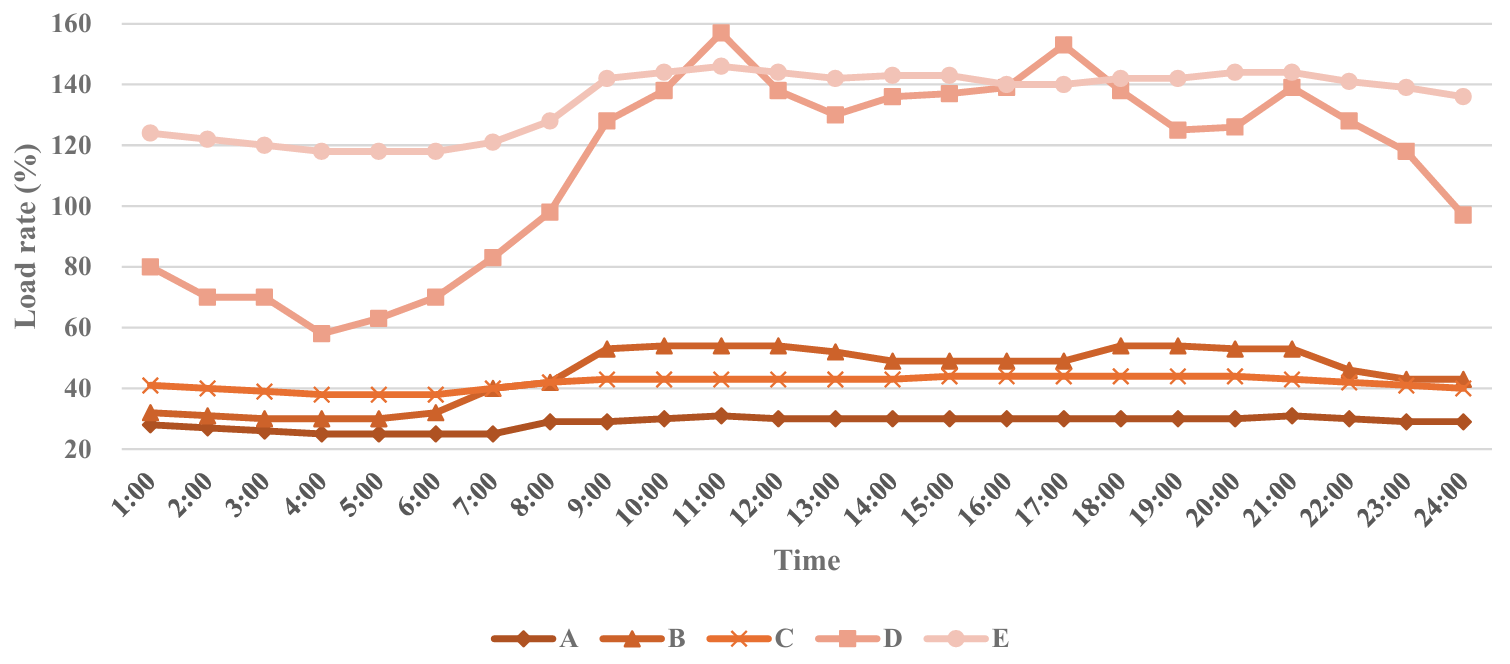
In Figure 3, the load rate of Hydropower Station A starts at 60% and shows a slight upward trend over time, reaching nearly 70% at noon before stabilizing. This pattern indicates that Hydropower Station A maintains a relatively high operational load for most of the day, potentially reflecting stable electricity demand throughout the day. The load rate of Hydropower Station B fluctuates around 50%, with a slight increase before noon, a decrease in the afternoon, and subsequent stabilization. The small fluctuations in the load rate of Hydropower Station B may imply relatively balanced power output and good adaptability to load changes. The load rate of Hydropower Station C remains around 50%, with a sudden drop at noon and rapid recovery, reflecting a temporary adjustment in scheduling operations or load demand. Overall, the load rate of Hydropower Station C is relatively stable. The load rate of Hydropower Station D starts at a low level, gradually increases over time, peaks in the evening, and then drops sharply. This pattern indicates that Hydropower Station D is significantly affected by daily demand variations, increasing output during the day to meet peak demands and reducing output at night due to lower demand. The load rate of Hydropower Station E consistently ranges between 60% and 70%, indicating minimal load variation and high stability in load demand. Among all stations, Hydropower Station E exhibits the most stable operating mode, consistent with its role as a leading station.
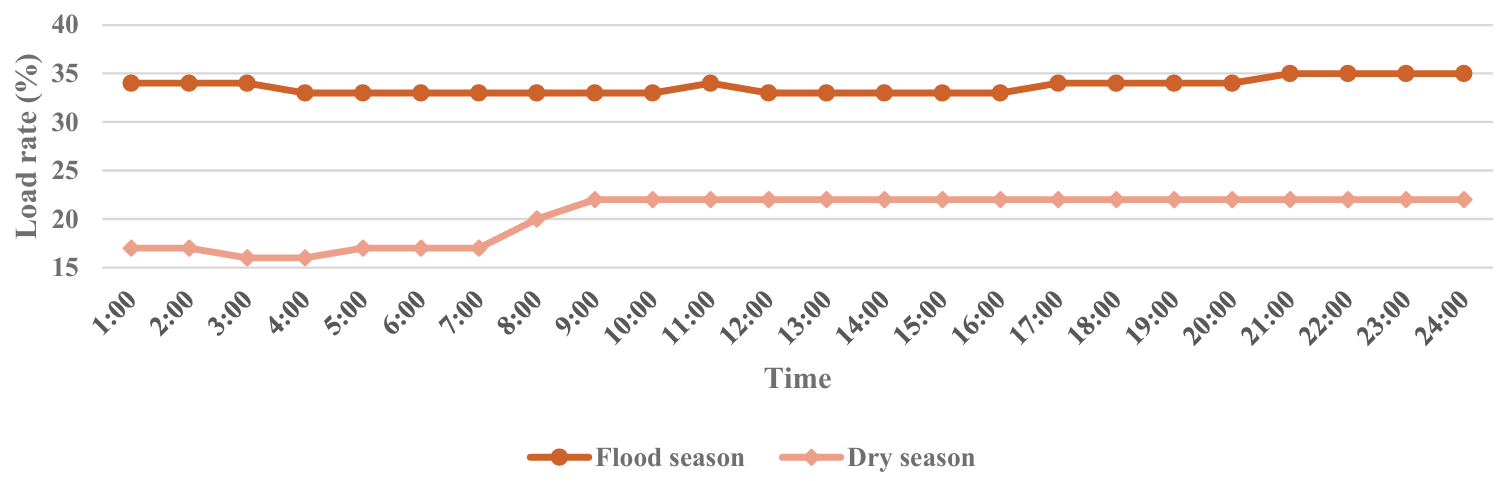
Figure 4 demonstrates the load rate variations of Hydropower Station A across different seasons. Although the overall load rate trends in both figures show some similarities, notable differences exist in load rate levels, amplitude of variation, and specific time points. Compared to the flood season, the initial load rate is lower in the dry season. However, the daytime peaks are similar in both figures, indicating that despite lower early-morning demand, the maximum daytime demand is comparable. Additionally, the load rate changes more rapidly in the dry season, particularly in the early morning and late evening, suggesting that the hydropower station requires faster response capabilities and more flexible scheduling strategies to adapt to these rapid changes. In contrast, the load rate in the flood season sustains at higher levels for a longer duration. In the dry season, by contrast, the load rate quickly reaches its peak and stabilizes within a shorter period, reflecting two distinct operational and demand patterns.
4.2.2. Application and Result Analysis of the Grey Prediction
Taking Hydropower Station A as an example, this section presents the prediction results, i.e., the daily load rate values for the next 30 days. Furthermore, the Root Mean Square Error (RMSE) of the prediction model is calculated to evaluate its accuracy. With an RMSE of approximately 2.1333, the model demonstrates relatively high prediction accuracy. The specific prediction results are as follows:
[96.12455528 96.00200606 95.89942237 95.81355147 95.74167053 95.68150033
95.63113297 95.58897138 95.5536787 95.52413586 95.49940609 95.47870525
95.46137697 95.44687179 95.43472976 95.4245659 95.41605792 95.40893605
95.40297446 95.39798413 95.39380681 95.39031006 95.38738299 95.3849328
95.38288179 95.38116492 95.37972777 95.37852475 95.37751773 95.37667477]
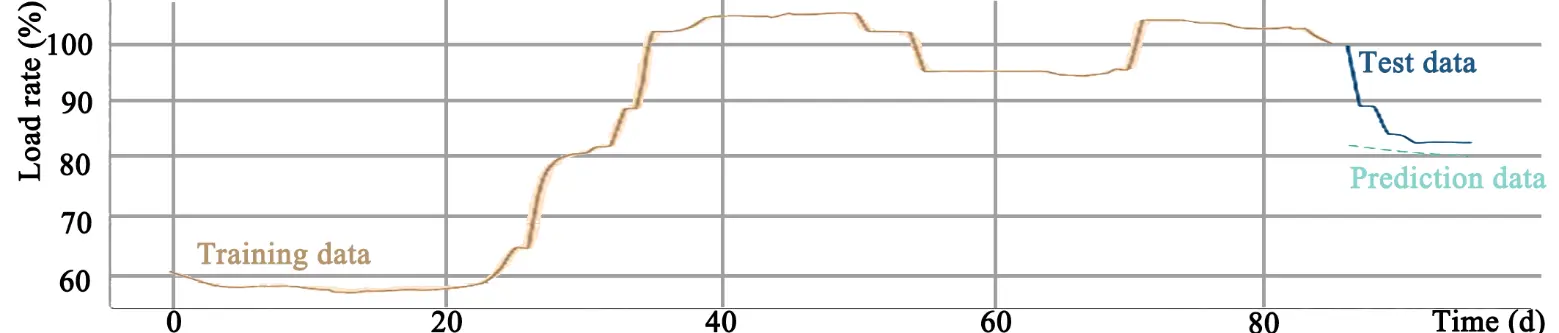
As shown in Figure 5, the training data (orange line) shows a gradual increase in load rate from nearly 60% to over 100% roughly between Day 0 and Day 40. Subsequently, the load rate remains relatively stable at around 100% with slight periodic fluctuations. The test data (dark blue line) starts at around 60% (around Day 60), experiences a sharp drop from 100% to below 80%, followed by a short period of stabilization and then a further decline. The prediction data (light blue line) starts at the end of the test data period, predicting a continued decrease in the future load rate and simulating a similar fluctuation pattern, albeit with a smoother curve.
5. Conclusions
5.1. Key Questions Addressed
The strength of operational management directly influences the competitiveness of an enterprise and significantly impacts its development and economic benefits. Operational management plays a crucial role in the development of hydropower stations. Based on practical cases from the X HSG, this paper analyzed the application of big data technology in the operational management of hydropower stations and proposed corresponding optimization strategies. The research covered data collection, cleaning, cluster analysis, and the formulation of seasonal dispatch strategies, aiming to enhance the efficient utilization of hydraulic resources and the stable operation of the power grid.
For question (1) raised in the Introduction, load rates in hydropower stations exhibit different trends across seasons or months. To address this issue, this study adopted the following methods. First, data collection and analysis: collect load rate data for 96 time periods each day, ensuring data accuracy and completeness; using statistical analysis methods, analyze the data to identify patterns and trends in load rate changes across the 96 time periods. Second, analysis of influencing factors: analyze potential factors affecting load rate changes in each time period, such as weather changes, seasonal demand, and industrial activities, to help understand the reasons behind load rate variations in each period.
For question (2), establish a grey prediction model for monthly load rate changes in hydropower stations. First, data preparation: collect historical monthly load rate data from hydropower stations, ensuring data completeness and accuracy. Second, grey prediction model establishment: utilize existing historical data to establish a grey prediction model for monthly load rate changes in hydropower stations. This model, based on the grey relational degree function, can effectively predict future load rate trends. Third, model validation: validate the accuracy and reliability of the established grey prediction model using partial historical data, adjusting model parameters to improve prediction effectiveness. Fourth, future load rate change prediction: Use the established grey prediction model to predict future monthly load rate changes in hydropower stations.
As the X HSG serves as a typical cascaded hydropower station cluster featuring “daily regulating stations + an annual regulating station”, its operational characteristics and the contradictions it faces are highly consistent with industry commonalities. Therefore, the big data optimization methods and dispatching strategies proposed in this study can be transferred and applied to other hydropower stations/clusters with similar structures or operational scenarios.
5.2. Research Limitations
This work also has some limitations. First, the data presented in this paper are only a sample from the watershed case study, and the hydrological conditions of the power stations in this watershed are relatively complex. However, since hydrological characteristics vary globally, the specific K-means clusters found here may not directly transfer to basins with different rainfall patterns. Second, the grey prediction model is generally best for short-term forecasting with limited data. The model might be inaccurate for long-term (multi-year) strategic planning. Third, this study mainly focused on load rates and water levels, which means the work did not currently calculate the financial revenue impact of this optimized scheduling. Despite these limitations, this study aims to present an idea that can trigger discussions within the industry to explore other methods suitable for optimizing the dispatch of cascaded hydropower stations globally.
5.3. Future Directions
In future research, the following directions can be considered. First, according to the latest research [24], hydropower stations may leverage the spatial allocation of electrolysers to utilize surplus production capacity for hydrogen generation, thereby reducing wind power curtailment and optimizing transmission utilization. Second, given the potential changes in electricity consumption brought about by the large-scale deployment of electric vehicles and their charging infrastructure, future iterations of the grey prediction model should account for the complexity of such changes and bidirectional flexibility [25]. Third, when exploring demand-side coordination, the thermal inertia of downstream building complexes can be linked to upstream hydropower scheduling, such as by adopting a more comprehensive “source-load” flexibility system to alleviate distribution network congestion. Fourth, based on the methodology proposed in this paper, financial and operational risks associated with hydrological uncertainty can also be explored to further optimize management.
Statement of the Use of Generative AI and AI-Assisted Technologies in the Writing Process
During the preparation of this manuscript, the authors used ERNIE Bot 4.5 Turbo in order to enhance English expression and Nano Banana Pro for figure beautification. After using these tools, the authors reviewed and edited the content as needed and take full responsibility for the content of the published article.
Author Contributions
Conceptualization, Q.J.; methodology, Q.J.; software, Q.J.; validation, Q.J.; formal analysis, Q.J.; investigation, Q.J.; resources, Q.J.; data curation, Q.J.; writing—original draft preparation, D.D.; writing—review and editing, D.D.; visualization, D.D.; supervision, D.D.; project administration, Q.J.; funding acquisition, D.D. All authors have read and agreed to the published version of the manuscript.
Ethics Statement
Not applicable.
Informed Consent Statement
Not applicable.
Data Availability Statement
The datasets presented in this article are not readily available because the data are part of an ongoing study. Requests to access the datasets should be directed to Sichuan Huaneng Baoxing River Hydropower Co., Ltd.
Funding
This research received no external funding.
Declaration of Competing Interest
The authors declare that they have no known competing financial interests or personal relationships that could have appeared to influence the work reported in this paper.
References
-
Zhang Z, Yang D, Yao X, Lu P, Wang R. Independent research and development of simulation operation software in the process of plant Operation and Maintenance Integration. Yunnan Water Power 2023, 39, 141–144. DOI:10.3969/j.issn.1006-3951.2023.06.037 [Google Scholar]
-
Mbeutcha Y, Gendreau M, Emiel G. A hybrid dynamic programming—Tabu Search approach for the long-term hydropower scheduling problem. Comput. Manag. Sci. 2021, 18, 385–410. DOI:10.1007/s10287-021-00402-y [Google Scholar]
-
Pereira MVF, Pinto LMVG. Stochastic optimization of a multireservoir hydroelectric system: A decomposition approach. Water Resour. Res. 2008, 21, 779–792. DOI:10.1029/WR021i006p00779 [Google Scholar]
-
Chang GW, Aganagic M, Waight JG, Medina J, Burton T, Reeves S, et al. Experiences with mixed integer linear programming based approaches on short-term hydro scheduling. IEEE Trans. Power Syst. 2001, 16, 743–749. DOI:10.1109/59.962421 [Google Scholar]
-
Yamin HY. Review on methods of generation scheduling in electric power systems. Electr. Power Syst. Res. 2004, 69, 227–248. DOI:10.1016/j.epsr.2003.10.002 [Google Scholar]
-
Pérez-Díaz JI, Wilhelmi JR, Arévalo LA. Optimal short-term operation schedule of a hydropower plant in a competitive electricity market. Energy Convers. Manag. 2010, 51, 2955–2966. DOI:10.1016/j.enconman.2010.06.038 [Google Scholar]
-
Paredes-Arquiola J, Solera-Solera A, Andreu-Alvarez J. Operation rules for multireservoir systems combining heuristic methods and flow networks. Ing. Hidraul. En Mex. 2023, 23, 151–164. Available online: http://www.imta.gob.mx/productos/rihm/rihm.html (accessed on 12 November 2025).
-
Pathak S, Negi S, Yadav S. Quality management system: A much-needed tool to ensure total quality management. Int. J. Trend Sci. Res. Dev. 2021, 5, 784–787. Available online: https://www.ijtsrd.com/papers/ijtsrd39975.pdf (accessed on 12 November 2025).
-
Yucesan Y, Ramuhalli P, Chen Y, Miller J, Hanson E, Signore S. Predictive analytics for hydropower fleet intelligence. Annu. Conf. Progn. Heal. Manag. Soc. 2023, 15, 1–12. DOI:10.36001/phmconf.2023.v15i1.3562 [Google Scholar]
-
Ma Y, Hong L, Qin T, Hao X, Tan T. Research on monitoring data security sharing method for hydropower station operation and maintenance. In Proceedings of the 5th International Symposium on Big Data and Applied Statistics, Xining, China, 22–24 April 2022; p. 012009. DOI:10.1088/1742-6596/2294/1/012009 [Google Scholar]
-
Wu X, Zhang W, Fu J, Tang S, Dai J, Xu T. Study on optimization of monitoring and early warning system for hydropower plant equipment safety implementation based on big data era. In Proceedings of the 3rd International Conference on Artificial intelligence, Systems, and Computing Technology (AISCT 2019), Brasilia, Brazil, 12–13 October 2019; pp. 350–356. Available online: https://webofproceedings.org/proceedings_series/article/artId/11096.html (accessed on 12 November 2025).
-
Li S, Liu Z, Zheng M, Wang H. Exploration on big data architecture and its correlation analysis for safety monitoring in operation of basin’s hydro-junctions. Int. Conf. Civ. Hydraul. Eng. 2019, 304, 022026. DOI:10.1088/1755-1315/304/2/022026 [Google Scholar]
-
Lu T. Construction and application of intelligent operation system for hydropower stations driven by big data. Hydroelectr. Sci. Technol. 2025, 8, 111–113. DOI:10.33142/hst.v8i6.16906 [Google Scholar]
-
Lu Z, Yang Z. Construction of fault prediction and intelligent operation and maintenance system for hydropower station equipment based on big data analysis. Small Hydro Power 2025, 49–53. DOI:10.3969/j.issn.1007-7642.2025.03.014 [Google Scholar]
-
Shrestha S, Luintel MC. Plant Operation Optimization—A Case Study of Middle Marsyangdi Hydropower Station. In Proceedings of IOE Graduate Conference; 2016; pp. 245–252. Available online: http://conference.ioe.edu.np/ioegc2016/papers/IOEGC-2016-32.pdf (accessed on 12 November 2025).
-
Li C. Discussion on how to improve the dfficiency of production information transmission in hydropower stations. Hydropower Water Resour. 2023, 7, 37–39. DOI:10.12238/hwr.v7i8.4966 [Google Scholar]
-
Garcia D, Puig V, Quevedo J, Cugueró MA. Big data analytics and knowledge discovery applied to automatic meter readers. In Real-Time Monitoring and Operational Control of Drinking-Water Systems; Puig V, Ocampo-Martínez C, Pérez R, Cembrano G, Quevedo J, Escobet T, Eds.; Springer International Publishing: Cham, Switzerland, 2017, pp. 401–423. DOI:10.1007/978-3-319-50751-4_20 [Google Scholar]
-
Yang L. Research on the prediction and optimization scheduling of hydroelectric power station operation status based on artificial intelligence. Urban Constr. Plan. 2024, 1, 93–95. DOI:10.33142/ucp.v1i6.15200 [Google Scholar]
-
Chen M, Mao S, Liu Y. Big data: A survey. Mob. Networks Appl. 2014, 19, 171–209. DOI:10.1007/s11036-013-0489-0 [Google Scholar]
-
Mosavi A, Lopez A, Varkonyi-Koczy RA. Industrial applications of big data: State of the art survey. In International Conference on Global Research and Education; Springer International Publishing: Cham, Switzerland, 2017. DOI:10.1007/978-3-319-67459-9_29 [Google Scholar]
-
Chen D, Yuan S, Pei J, Wang W. Identification method for centrifugal pump working condition based on improved binary tree support verctor machine. J. Drain. Irrig. Mach. Eng. 2023, 41, 8–15. [Google Scholar]
-
Mao S, Gao M, Wen J, Nie X. Generalized admissible region of class ratio for fractional accumulated GM(1,1) model. J. Grey Syst. 2014, 26, 55–68. Available online: https://www.researchgate.net/profile/Mingyun-Gao/publication/287457101_Generalized_Admissible_Region_of_Class_Ratio_for_Fractional_Accumulated_GM11_Model/links/5eb36e1b45851523bd49817f/Generalized-Admissible-Region-of-Class-Ratio-for-Fractional-Accumulated-GM1-1-Model.pdf?_sg%5B0%5D=started_experiment_milestone&origin=journalDetail&_rtd=e30%3D (accessed on 12 November 2025).
-
Huang S, Shi J, Wang B, An N, Li L, Hou X, et al. A hybrid framework for day-ahead electricity spot-price forecasting: A case study in China. Appl. Energy 2024, 373, 123863. DOI:10.1016/j.apenergy.2024.123863 [Google Scholar]
-
Giannelos S, Konstantelos I, Pudjianto D, Strbac G. The impact of electrolyser allocation on Great Britain’s electricity transmission system in 2050. Int. J. Hydrogen Energy 2026, 202, 153097. DOI:10.1016/j.ijhydene.2025.153097 [Google Scholar]
-
Amann G, Escobedo Bermúdez VR, Boskov-Kovacs E, Gallego Amores S, Giannelos S, Iliceto A, et al. E-Mobility Deployment and Impact on Grids: Impact of Electric Vehicle and Charging Infrastructure on European Transmission and Distribution Grids : Innovation Needs; Publications Office of the European Union: Luxembourg, 2022. DOI:10.2833/937755 [Google Scholar]