Investigating Potential PFAS Emissions from Initial Electrolyzer Operation

Investigating Potential PFAS Emissions from Initial Electrolyzer Operation
Parikhit Sinha
1,*
 Bibek Tripathi
2
Bibek Tripathi
2
Received: 30 July 2025 Revised: 17 September 2025 Accepted: 20 October 2025 Published: 24 October 2025

© 2025 The authors. This is an open access article under the Creative Commons Attribution 4.0 International License (https://creativecommons.org/licenses/by/4.0/).
1. Introduction
Per- and polyfluoroalkyl substances (PFAS) are a family of organo-fluorine substances subject to increasing regulation globally. In the European Union, economy-wide product restrictions have been proposed [1] based on the broad OECD definition of PFAS, substances having at least one fully fluorinated carbon atom [2]. Fluoropolymers are included under this broad definition despite being non-hazardous and non-bioavailable [3,4]. Proton exchange membrane (PEM) water electrolyzers use fluoropolymers in membrane assemblies for their unique physical and chemical properties, such as selective proton conductivity and durability under harsh operating conditions. The specific membrane materials are perfluorinated sulfonic acid (PFSA) ionomers, fluoropolymers with pendant sulfonic acid groups [5].
Concerns have been raised about the life cycle of fluoropolymers, including the use of fluorosurfactants during fluoropolymer production and end-of-life hazards from fluoropolymer disposal [6]. Product stewardship of fluoropolymers in PEM water electrolysis has been evaluated over the product life cycle as a potential alternative to regulatory PFAS product restrictions [7]. The main stewardship strategies include fluorosurfactant emissions control and replacement during fluoropolymer manufacturing, and takeback and recycling of end-of-life fluoropolymer materials.
While these strategies address the supply chain and end-of-life of fluoropolymers in water electrolysis, the use phase must also be evaluated. During the electrolyzer use phase, water is recirculated and consumed to produce H2 and O2, with no wastewater generated during routine operation. Nevertheless, it is of regulatory interest to understand whether there may be PFAS constituents in the recirculated water, in case of maintenance activities that generate wastewater.
In product reliability testing, fluoride concentrations in recirculated water are routinely measured as a proxy for membrane degradation [8]. The chemical degradation mechanism is similar to the Fenton reaction, where hydrogen peroxide (H2O2) and metal catalyst (Fe2+) react to form hydroxyl radicals (•OH) [9]. •OH, when generated from H2O2 and trace metal impurities in water during electrolyzer operation, can dismantle the fluorocarbon backbone of the PEM ionomer and generate hydrogen fluoride (HF) (Equation (1), Equation (2) and Equation (3), where “RF” represents a fluorinated alkyl group [10]). HF can be measured as fluoride (F−) release rate during reliability testing [10,11].
The fluoride observations reflect potential early life degradation of the membrane, and are typically highest at the onset of stack testing and stabilize to low levels over time [12]. These types of reliability measurements can be extended to measure for PFAS constituents using standard analytical methods, such as U.S. Environmental Protection Agency (EPA) Method 1633, which analyzes for 40 PFAS compounds by liquid chromatography-tandem mass spectrometry (LC-MS/MS) [13].
Potential PFAS emissions in water during the product use phase have been investigated in modeling and laboratory studies for PEM fuel cells [14]. A first field study of potential PFAS emissions in water during commercial system operation has been reported for PEM fuel cells [15]. To the authors’ knowledge, similar field data have not been reported for commercial PEM electrolyzers.
In the commercial fuel cell study [15], water produced during fuel cell operation in light and heavy-duty fuel cell electric vehicles was analyzed for 17 PFAS constituents in accordance with DIN 17892:2024–08 [16]. Two to five PFAS constituents were detected at parts per trillion (ppt) levels in each of the eight samples taken, at a non-critical range according to German national PFAS guidelines. However, the authors could not attribute the PFAS constituents to their potential source (membrane, balance of plant, or environmental background), highlighting the importance of sampling methodology and controls when measuring and interpreting low-concentration substances. The need for use phase data for potential PFAS emissions from electrolyzers and fuel cells is reflected in the 2025 Horizon Europe funding program (HORIZON-JU-CLEANH2-2025-05-02) [17].
We hypothesize that potential PFAS emissions to water will likely be detectable at the beginning of stack operation based on the timing of observed fluoride release rates during product reliability monitoring. Therefore, water testing was conducted conservatively by sampling at the beginning of stack operation (first ~2 weeks). Water testing is expected to deepen the understanding of potential PFAS emissions of electrolyzer systems during product use, and complement stewardship strategies over the full product life cycle [7]. This improved understanding supports science-based decision-making for policymakers and informs industry on engineering approaches for measurement, analysis, and mitigating potential use-phase PFAS emissions and their environmental impact.
2. Materials and Methods
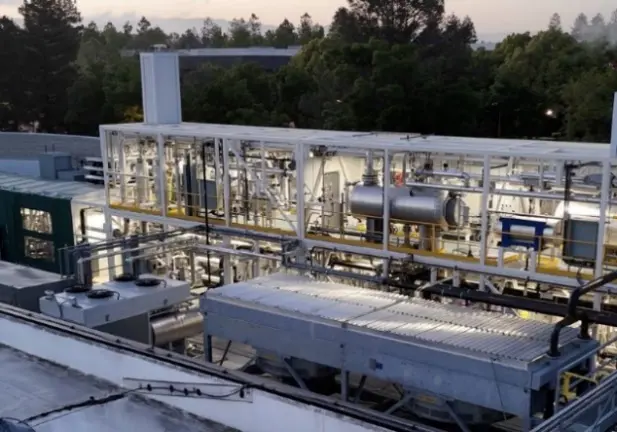
Water samples were collected from Electric Hydrogen’s Pioneer electrolyzer plant in San Jose, California, USA (Figure 1), during testing of an 80-cell multi-megawatt PEM stack in October–November 2024. A key methodological consideration was sample selection, with respect to sampling locations within the electrolyzer system, choice of control samples, and timing of sample collection. Additional considerations included sample handling procedures, analytical methods, and comparisons to regulatory benchmarks, as described below.
2.1. Sample Selection
Figure 2 shows the locations of samples, and Table 1 indicates the timing of sample collection before, during, and after electrolysis. After 5 h of water circulation and prior to electrolysis, control water samples were collected at the anode inlet and outlet and at the reverse osmosis deionization (RODI) outlet. Control samples were selected to account for any potential PFAS emissions associated with the balance of plant (non-stack components). Samples were collected downstream of water treatment (RODI) to measure recirculated water. Because the water treatment system may utilize fluoropolymers, it was necessary to collect a pre-electrolysis control sample (RO-1) that was downstream of the water treatment but upstream of the electrolyzer stack. The RO-1 pre-electrolysis control sample was used to characterize any potential PFAS emissions to water that may be attributed to the water treatment system.
During operation, water samples were collected after ~1 day of electrolysis (25 h), ~6 days (135 h), and again after ~2 weeks of electrolysis (332 h). During electrolysis, water samples were collected at the anode inlet to the stack and at the anode separator outlet. Water is recirculated numerous times through the electrolyzer plant before being consumed in the electrolysis reaction, so all samples collected during electrolysis have the potential for detecting emissions of fluorinated compounds.

Figure 2. Electrolyzer process flow and sample locations. Water, electricity, hydrogen, and oxygen flows are shown in blue, purple, red, and green, respectively. Water sample collection points are shown in orange circles, and sample identification (ID) names are shown in bold. A dashed blue line shows the proposed drain line connecting the electrolysis water circulation to the upstream water treatment. “EOD H2O” (electro-osmotic drag water) refers to water transported across the membrane (from anode to cathode) and recirculated downstream of the cathode outlet of the electrolyzer stack.
After the plant operational shutdown (412 h), further water samples were taken at the anode separator outlet and the anode and cathode outlets. These samples are representative of water quality from plant maintenance activities that involve plant shutdown before stack end-of-life.
Table 1. Time and location of water sample collection with sample ID corresponding to Figure 2.
|
Sample Event |
Electrolysis Runtime |
Sample ID |
Sample Location |
|---|---|---|---|
|
Pre-electrolysis |
0 h * |
RO-1 |
RODI Outlet |
|
Pre-electrolysis |
0 h * |
AI1-1 |
Anode Inlet |
|
Pre-electrolysis |
0 h * |
AO1-1-PRE |
Anode Outlet |
|
Electrolysis in progress |
25 h |
AI1-2 |
Anode Inlet |
|
Electrolysis in progress |
25 h |
AS-1 |
Anode Separator Out |
|
Electrolysis in progress |
135 h |
AI1-4 |
Anode Inlet |
|
Electrolysis in progress |
135 h |
AS-3 |
Anode Separator Out |
|
Electrolysis in progress |
332 h |
AI1-5 |
Anode Inlet |
|
Electrolysis in progress |
332 h |
AS-4 |
Anode Separator Out |
|
Post-shutdown |
412 h |
AS-5 |
Anode Separator Out |
|
Post-shutdown |
412 h |
AO1-1-POST |
Anode Outlet |
|
Post-shutdown |
412 h |
CO1-1 |
Cathode Outlet |
* Pre-electrolysis samples were collected after 5 h of water circulation and before electrolysis.
2.2. Sample Handling
Because organo-fluorine substances are commonplace, special handling measures are needed to minimize the potential for sample contamination (Table 2). These measures include choice of clothing and personal protective equipment, background environmental considerations, and sample collection and shipment considerations.
Table 2. Sample handling procedures to mitigate potential background PFAS contamination.
|
Category |
Guidance |
|---|---|
|
Clothing and personal protective equipment |
Avoid boots or clothing containing weather-resistant additives (safety boots and wet weather wear made of polyurethane or PVC are acceptable). Avoid materials containing coated HDPE. Avoid clothing that has been treated with fabric softener. Avoid face/body moisturizers, cosmetics, fragrance, sunscreen, insect repellent, or similar products on the sampling day. Wash hands and wear powderless nitrile gloves during sampling. |
|
Environmental considerations |
Ensure the sample area is free of food/drink and food packaging. Sampling outdoors uncovered, most notably in rainy conditions, may result in a positive interference of the sample in industrial locations. |
|
Sample collection and shipment |
If other water samples are planned to be collected for analysis other than PFAS, collect samples for PFAS analysis first, as some containers may contain PFAS. Use sample containers provided by the contracted laboratory only. Avoid tubing, fittings, etc. containing PFTE to collect sample (silicone, uncoated HDPE, polypropylene, acetate and stainless steel are generally acceptable materials). Avoid labeling the sample using felt-tipped pens; a ballpoint pen is recommended. Avoid handling plastic clipboards, binders, or hard-covered notebooks. Ship PFAS samples separate from any other samples on ice (2–6 °C); isolate samples from ice in shipment by packing them in a resealable plastic bag; do not use chemical cold packs. |
2.3. Analytical Methods
Analysis of water samples was conducted by a certified third-party laboratory (Pace Analytical Services; Longmeadow, MA, USA) under U.S. EPA Method 1633 [13]. This method utilizes LC-MS/MS and detects 40 PFAS substances (Table 3).
Table 3. PFAS analytes under U.S. EPA Method 1633.
|
Analyte |
CAS # |
Analyte |
CAS # |
|---|---|---|---|
|
Perfluorobutanoic acid (PFBA) |
375-22-4 |
NMeFOSAA |
2355-31-9 |
|
Perfluoropentanoic acid (PFPeA) |
2706-90-3 |
NEtFOSAA |
2991-50-6 |
|
Perfluorohexanoic acid (PFHxA) |
307-24-4 |
4:2 FTS |
757124-72-4 |
|
Perfluoroheptanoic acid (PFHpA) |
375-85-9 |
6:2 FTS |
27619-97-2 |
|
Perfluorooctanoic acid (PFOA) |
335-67-1 |
8:2 FTS |
39108-34-4 |
|
Perfluorononanoic acid (PFNA) |
375-95-1 |
NEtFOSA |
4151-50-2 |
|
Perfluorodecanoic acid (PFDA) |
335-76-2 |
NMeFOSA |
31506-32-8 |
|
Perfluoroundecanoic acid (PFUnA) |
2058-94-8 |
NMeFOSE |
24448-09-7 |
|
Perfluorododecanoic acid (PFDoA) |
307-55-1 |
NEtFOSE |
1691-99-2 |
|
Perfluorotridecanoic acid (PFTriA) |
72629-94-8 |
9Cl-PF3ONS |
756426-58-1 |
|
Perfluorotetradecanoic acid (PFTeA) |
376-06-7 |
HFPO-DA (GenX) |
13252-13-6 |
|
Perfluorobutanesulfonic acid (PFBS) |
375-73-5 |
11Cl-PF3OUdS |
763051-92-9 |
|
Perfluoropentanesulfonic acid (PFPeS) |
2706-91-4 |
ADONA |
919005-14-4 |
|
Perfluorohexanesulfonic acid (PFHxS) |
355-46-4 |
3:3 FTCA |
356-02-5 |
|
Perfluoroheptanesulfonic Acid (PFHpS) |
375-92-8 |
5:3 FTCA |
914637-49-3 |
|
Perfluorooctanesulfonic acid (PFOS) |
1763-23-1 |
7:3 FTCA |
812-70-4 |
|
Perfluorononanesulfonic acid (PFNS) |
68259-12-1 |
NFDHA |
151772-58-6 |
|
Perfluorodecanesulfonic acid (PFDS) |
335-77-3 |
PFMBA |
863090-89-5 |
|
Perfluorododecanesulfonic acid (PFDoS) |
79780-39-5 |
PFMPA |
377-73-1 |
|
Perfluorooctanesulfonamide (FOSA) |
754-91-6 |
PFEESA |
113507-82-7 |
2.4. Regulatory Benchmarks
Once analyzed, the results can be compared to established regulatory benchmarks. U.S. EPA has published enforceable Maximum Contaminant Levels (MCL) for 6 PFAS compounds for potable water systems under the U.S. Safe Drinking Water Act [18]. They are 4 ppt each for perfluorooctanoic acid (PFOA) and perfluorooctanesulfonic acid (PFOS), and 10 ppt each for perfluorononanoic acid (PFNA), perfluorohexanesulfonic acid (PFHxS), and HFPO-DA (GenX). The sixth regulated PFAS is perfluorobutanesulfonic acid (PFBS) under a hazard index (HI) limit (Equation (4)) assigned to a mixture of two or more PFAS: PFHxS, PFNA, HFPO-DA, and PFBS.
It is important to note that PFAS regulatory levels, such as the samples collected for this study, have not yet been established for non-potable waters. Therefore, the benchmarking is for general reference and does not consider the additional fate and transport analysis necessary when evaluating potential impacts related to non-potable water.
In order to assist the interpretation of the PFAS analytical results, additional water samples were taken at 412 h (post-shutdown) for fluoride analysis. Samples were collected from the makeup water tank and RODI outlet, the inlet and outlet of the anode, and the outlets of the O2 separator and anode pump. These water samples were analyzed for fluoride using ion chromatography [12] with a reporting limit of 0.5 µg/L using internal lab analysis.
3. Results
All samples analyzed were non-detect for the 40 PFAS compounds under U.S. EPA Method 1633 (Table 4). The sample reporting limits were low enough to enable comparison to regulatory benchmarks (MCL). All samples analyzed were non-detect and below the regulatory benchmarks, which are conservative and for general reference since they apply to drinking water, whereas the samples are non-potable industrial water.
Table 4. PFAS analytical results in water collected from electrolyzer operation and regulatory benchmark (MCL) in nanograms per liter (parts per trillion). All results were non-detect with reporting limit (RL) indicated by “<RL”.
|
Pre-Electrolysis |
Electrolysis in Progress |
Post-Shutdown |
MCL 1 |
||||||||||
|---|---|---|---|---|---|---|---|---|---|---|---|---|---|
|
Run-Time |
0 h |
0 h |
0 h |
25 h |
25 h |
135 h |
135 h |
332 h |
332 h |
412 h |
412 h |
412 h |
|
|
Sample ID |
RO-1 |
AI1-1 |
AO1-1-PRE |
AI1-2 |
AS-1 |
AI1-4 |
AS-3 |
AI1-5 |
AS-4 |
AS-5 |
A01-1-POST |
C01-1 |
|
|
PFBA |
<6.3 |
<7.4 |
<6.8 |
<6.9 |
<6.9 |
<6.5 |
<7.3 |
<6.5 |
<6.4 |
<6.4 |
<6.3 |
<6.6 |
|
|
PFPeA |
<3.1 |
<3.7 |
<3.4 |
<3.4 |
<3.4 |
<3.3 |
<3.7 |
<3.3 |
<3.2 |
<3.2 |
<3.2 |
<3.3 |
|
|
PFHxA |
<1.6 |
<1.8 |
<1.7 |
<1.7 |
<1.7 |
<1.6 |
<1.8 |
<1.6 |
<1.6 |
<1.6 |
<1.6 |
<1.7 |
|
|
PFHpA |
<1.6 |
<1.8 |
<1.7 |
<1.7 |
<1.7 |
<1.6 |
<1.8 |
<1.6 |
<1.6 |
<1.6 |
<1.6 |
<1.7 |
|
|
PFOA |
<1.6 |
<1.8 |
<1.7 |
<1.7 |
<1.7 |
<1.6 |
<1.8 |
<1.6 |
<1.6 |
<1.6 |
<1.6 |
<1.7 |
4.0 |
|
PFNA |
<1.6 |
<1.8 |
<1.7 |
<1.7 |
<1.7 |
<1.6 |
<1.8 |
<1.6 |
<1.6 |
<1.6 |
<1.6 |
<1.7 |
10.0 |
|
PFDA |
<1.6 |
<1.8 |
<1.7 |
<1.7 |
<1.7 |
<1.6 |
<1.8 |
<1.6 |
<1.6 |
<1.6 |
<1.6 |
<1.7 |
|
|
PFUnA |
<1.6 |
<1.8 |
<1.7 |
<1.7 |
<1.7 |
<1.6 |
<1.8 |
<1.6 |
<1.6 |
<1.6 |
<1.6 |
<1.7 |
|
|
PFDoA |
<1.6 |
<1.8 |
<1.7 |
<1.7 |
<1.7 |
<1.6 |
<1.8 |
<1.6 |
<1.6 |
<1.6 |
<1.6 |
<1.7 |
|
|
PFTrDA |
<1.6 |
<1.8 |
<1.7 |
<1.7 |
<1.7 |
<1.6 |
<1.8 |
<1.6 |
<1.6 |
<1.6 |
<1.6 |
<1.7 |
|
|
PFTeDA |
<1.6 |
<1.8 |
<1.7 |
<1.7 |
<1.7 |
<1.6 |
<1.8 |
<1.6 |
<1.6 |
<1.6 |
<1.6 |
<1.7 |
|
|
PFBS |
<1.6 |
<1.8 |
<1.7 |
<1.7 |
<1.7 |
<1.6 |
<1.8 |
<1.6 |
<1.6 |
<1.6 |
<1.6 |
<1.7 |
HI ≤ 1 * |
|
PFPeS |
<1.6 |
<1.8 |
<1.7 |
<1.7 |
<1.7 |
<1.6 |
<1.8 |
<1.6 |
<1.6 |
<1.6 |
<1.6 |
<1.7 |
|
|
PFHxS |
<1.6 |
<1.8 |
<1.7 |
<1.7 |
<1.7 |
<1.6 |
<1.8 |
<1.6 |
<1.6 |
<1.6 |
<1.6 |
<1.7 |
10.0 |
|
PFHpS |
<1.6 |
<1.8 |
<1.7 |
<1.7 |
<1.7 |
<1.6 |
<1.8 |
<1.6 |
<1.6 |
<1.6 |
<1.6 |
<1.7 |
|
|
PFOS |
<1.6 |
<1.8 |
<1.7 |
<1.7 |
<1.7 |
<1.6 |
<1.8 |
<1.6 |
<1.6 |
<1.6 |
<1.6 |
<1.7 |
4.0 |
|
PFNS |
<1.6 |
<1.8 |
<1.7 |
<1.7 |
<1.7 |
<1.6 |
<1.8 |
<1.6 |
<1.6 |
<1.6 |
<1.6 |
<1.7 |
|
|
PFDS |
<1.6 |
<1.8 |
<1.7 |
<1.7 |
<1.7 |
<1.6 |
<1.8 |
<1.6 |
<1.6 |
<1.6 |
<1.6 |
<1.7 |
|
|
PFDoS |
<1.6 |
<1.8 |
<1.7 |
<1.7 |
<1.7 |
<1.6 |
<1.8 |
<1.6 |
<1.6 |
<1.6 |
<1.6 |
<1.7 |
|
|
4:2FTS |
<6.3 |
<7.4 |
<6.8 |
<6.9 |
<6.9 |
<6.5 |
<7.3 |
<6.5 |
<6.4 |
<6.4 |
<6.3 |
<6.6 |
|
|
6:2FTS |
<6.3 |
<7.4 |
<6.8 |
<6.9 |
<6.9 |
<6.5 |
<7.3 |
<6.5 |
<6.4 |
<6.4 |
<6.3 |
<6.6 |
|
|
8:2FTS |
<6.3 |
<7.4 |
<6.8 |
<6.9 |
<6.9 |
<6.5 |
<7.3 |
<6.5 |
<6.4 |
<6.4 |
<6.3 |
<6.6 |
|
|
PFOSA |
<1.6 |
<1.8 |
<1.7 |
<1.7 |
<1.7 |
<1.6 |
<1.8 |
<1.6 |
<1.6 |
<1.6 |
<1.6 |
<1.7 |
|
|
NMeFOSA |
<1.6 |
<1.8 |
<1.7 |
<1.7 |
<1.7 |
<1.6 |
<1.8 |
<1.6 |
<1.6 |
<1.6 |
<1.6 |
<1.7 |
|
|
NEtFOSA |
<1.6 |
<1.8 |
<1.7 |
<1.7 |
<1.7 |
<1.6 |
<1.8 |
<1.6 |
<1.6 |
<1.6 |
<1.6 |
<1.7 |
|
|
NMeFOSAA |
<1.6 |
<1.8 |
<1.7 |
<1.7 |
<1.7 |
<1.6 |
<1.8 |
<1.6 |
<1.6 |
<1.6 |
<1.6 |
<1.7 |
|
|
NEtFOSAA |
<1.6 |
<1.8 |
<1.7 |
<1.7 |
<1.7 |
<1.6 |
<1.8 |
<1.6 |
<1.6 |
<1.6 |
<1.6 |
<1.7 |
|
|
NMeFOSE |
<16 |
<18 |
<17 |
<17 |
<17 |
<16 |
<18 |
<16 |
<16 |
<16 |
<16 |
<17 |
|
|
NEtFOSE |
<16 |
<18 |
<17 |
<17 |
<17 |
<16 |
<18 |
<16 |
<16 |
<16 |
<16 |
<17 |
|
|
HFPO-DA |
<6.3 |
<7.4 |
<6.8 |
<6.9 |
<6.9 |
<6.5 |
<7.3 |
<6.5 |
<6.4 |
<6.4 |
<6.3 |
<6.6 |
10.0 |
|
ADONA |
<6.3 |
<7.4 |
<6.8 |
<6.9 |
<6.9 |
<6.5 |
<7.3 |
<6.5 |
<6.4 |
<6.4 |
<6.3 |
<6.6 |
|
|
9Cl-PF3ONS |
<6.3 |
<7.4 |
<6.8 |
<6.9 |
<6.9 |
<6.5 |
<7.3 |
<6.5 |
<6.4 |
<6.4 |
<6.3 |
<6.6 |
|
|
11Cl-PF3OUdS |
<6.3 |
<7.4 |
<6.8 |
<6.9 |
<6.9 |
<6.5 |
<7.3 |
<6.5 |
<6.4 |
<6.4 |
<6.3 |
<6.6 |
|
|
3:3FTCA |
<7.8 |
<9.2 |
<8.5 |
<8.6 |
<8.6 |
<8.1 |
<9.2 |
<8.1 |
<8.0 |
<8.0 |
<7.9 |
<8.3 |
|
|
5:3FTCA |
<39 |
<46 |
<43 |
<43 |
<43 |
<41 |
<46 |
<41 |
<40 |
<40 |
<40 |
<42 |
|
|
7:3FTCA |
<39 |
<46 |
<43 |
<43 |
<43 |
<41 |
<46 |
<41 |
<40 |
<40 |
<40 |
<42 |
|
|
PFEESA |
<3.1 |
<3.7 |
<3.4 |
<3.4 |
<3.4 |
<3.3 |
<3.7 |
<3.3 |
<3.2 |
<3.2 |
<3.2 |
<3.3 |
|
|
PFMPA |
<3.1 |
<3.7 |
<3.4 |
<3.4 |
<3.4 |
<3.3 |
<3.7 |
<3.3 |
<3.2 |
<3.2 |
<3.2 |
<3.3 |
|
|
PFMBA |
<3.1 |
<3.7 |
<3.4 |
<3.4 |
<3.4 |
<3.3 |
<3.7 |
<3.3 |
<3.2 |
<3.2 |
<3.2 |
<3.3 |
|
|
NFDHA |
<3.1 |
<3.7 |
<3.4 |
<3.4 |
<3.4 |
<3.3 |
<3.7 |
<3.3 |
<3.2 |
<3.2 |
<3.2 |
<3.3 |
|
1 MCL: enforceable maximum contaminant level in potable water; * mixtures containing two or more of HFPO-DA, PFHxS, PFNA, and PFBS to yield a hazard index of ≤1 using Equation (1).
The results are consistent with performance monitoring data, which showed stable cell voltage (<2 V) over the ~2-week testing period. During the three sample events while electrolysis was in progress (Table 1), individual cell voltage (V) ranged from 1.72–1.76 V at 25 h, 1.82–1.87 V at 135 h, and 1.86–1.92 V at 332 h. Cell voltage is proportional to membrane thickness, with thinner membranes having lower cell voltage due to reduced electrical resistance [5]. Therefore, cell degradation in the form of membrane thinning would be expected to reduce cell voltage over the testing period. However, voltage increased slightly over the testing period, indicating that membrane thinning was not occurring, consistent with the lack of PFAS detections in the water samples.
In addition to the voltage data, fluoride analysis of post-shutdown (412 h) water samples showed no fluoride detections in the makeup water tank and RODI outlet, the inlet and outlet of the anode, and the outlets of the O2 separator and anode pump. Water samples downstream of the cathode outlet in the makeup water tank also had no detectable fluoride. Lack of fluoride detections is consistent with the lack of PFAS detections in the water samples.
4. Discussion
While no PFAS constituents were detected in electrolyzer water samples, the study provided information about sampling approaches relevant to electrolyzer operation. Minimizing gas cross-over and maintaining water quality during electrolyzer operation can mitigate potential chemical degradation of membranes via •OH radical formation. Closed-loop circulation approaches that minimize potential wastewater discharge can also mitigate the potential for PFAS emissions during electrolyzer operation. Further research may consider potential use-phase PFAS emissions after extended operation or accelerated life testing, as well as fate and transport methods for estimating potential environmental exposure point concentrations.
4.1. Sampling Procedures
The study highlights the importance of uniform sampling procedures for evaluating the potential for PFAS emissions during electrolyzer operation. Sampling after water circulation but before electrolysis is effective for obtaining control samples that can account for the potential balance of plant emissions. Sample collection and transport procedures that mitigate the potential for background contamination are necessary because organo-fluorine substances are commonplace in equipment and supplies. Hygiene and handling procedures are emphasized because PFAS constituents are being measured and benchmarked at parts per trillion concentrations. Sampling at the beginning of stack life is consistent with prior reliability testing, showing fluorine measurements are highest at the beginning of stack life. Sampling at different points in the water circulation system can help account for potential variability in concentrations within the system. Sampling points are subject to constraints around the ability to safely collect water samples during electrolyzer operation. For example, the sample collection ports for the anode and cathode outlet (AO1-1 and CO1-1, respectively in Figure 2) are located within the stack frame and therefore not accessible while the stack is energized during electrolysis. Instead, these samples were collected pre-electrolysis or post-shutdown.
The two main types of fluoropolymers used in PEM electrolysis are the PFSA ionomer and polytetrafluoroethylene (PTFE). The PFSA ionomer comprises the membrane and is also used as a catalyst binding material within the membrane electrode assembly (MEA). PTFE is used in sealing materials such as gaskets to prevent leaks and maintain system pressure [19]. If PFAS constituents are detected, chemical signatures may be used to attribute the source of potential PFAS emissions to a specific type of fluoropolymer. Specifically, the presence of -SO3H groups in detected PFAS constituents can be used as a signature of the pendant sulfonic acid groups in the PFSA ionomer. For example, in the commercial fuel cell PFAS emissions study [15], Lange et al. observed -SO3H groups in only one of the detected PFAS constituents (6:2 fluorotelomer sulfonate; FTS), indicating that most detected PFAS constituents were not associated with the MEA. Because 6:2 FTS contains -CH2- groups, which are not present in the pendant sulfonic acid groups of PFSA ionomers, Lange et al. also concluded that 6:2 FTS is not attributable to the MEA and most likely originates from the balance of plant.
4.2. Analytical Procedures
Use of established analytical methods such as U.S. EPA Method 1633 increases the reproducibility of measurements, though can limit the number of PFAS constituents that are analyzed. Reporting limits should be low enough to allow for comparison to established benchmarks. Interpretation of benchmarks should document whether the sample is from potable or non-potable water, as the latter requires additional fate and transport analysis to inform comparisons to potable water benchmarks.
The low reporting limits in Table 4 allow for comparison to the MCL regulatory benchmarks as well as the quantification of the hazard index (Equation (4)). Using one-half of the reporting limit as the standard replacement value for non-detect constituents in Table 4 [20], the combined hazard index for PFHxS, PFNA, HFPO-DA, and PFBS based on Equation (4) is 0.9, which is below the regulatory threshold of 1. The proximity of the combined hazard index to the regulatory threshold highlights the importance of analytical procedures for making inferences about potential environmental impacts. Even though no analytes were detected, and individual analytical reporting limits were below regulatory benchmarks, the combined hazard index across multiple constituents can be close to regulatory thresholds if one or more constituents have an elevated reporting limit. In Table 4, the reporting limit of HFPO-DA is about four times higher than that of the other three constituents (PFHxS, PFNA, and PFBS). As a result, even though all constituents are non-detect and below their individual MCL regulatory benchmarks (where applicable), the combined hazard index is relatively close to the regulatory limit of 1.
4.3. Monitoring
While water sampling for PFAS constituents in electrolyzer systems is not routine, analysis of fluoride concentrations in recirculated water is commonly conducted for quality and reliability testing. Fluoride represents hydrogen fluoride emissions (Equation (1), Equation (2) and Equation (3)) and is therefore not a direct predictor of potential PFAS emissions. However, fluoride can indicate potential membrane degradation and provide an early warning system regarding the health of the electrolyzer stack [12]. Fluoride emissions are measured with ion chromatography, which can be implemented on-site, facilitating the collection and ~real-time analysis of samples over the course of electrolyzer operation. Although PFAS constituents were only analyzed during the initial operation (~first 2 weeks) of the electrolyzer plant in this study, fluoride emissions could be routinely collected over a longer duration. If fluoride detections were observed in later hours of operation, they could potentially be used to initiate further investigation of membrane health.
4.4. Mitigation
As described in Equation (1), Equation (2) and Equation (3), membrane degradation can occur via reaction with •OH radicals, which can be formed in the presence of H2O2 and metal impurity catalysts in water. Therefore, strategies for mitigating membrane degradation can focus on minimizing H2O2 formation and maintaining water purity [10,11,14]. During electrolyzer operation, H2O2 can form during gas crossover, where H2 and O2 are both present and able to react. This study used a gas crossover threshold of <10% of the lower flammability limit (LFL) of H2 to operate the electrolyzer plant. Operational strategies that minimize chemical membrane degradation include moderating operating conditions for temperature and pressure and establishing a uniform humidity distribution within stack cells [11]. The monitoring of stack performance and degradation with cell voltage and fluoride emissions measurements, as done in this study, can also inform the potential for membrane degradation.
With regards to water quality during electrolyzer operation, raw water is purified with the reverse osmosis/deionization (RODI) water treatment system, recirculated within the electrolyzer, and consumed to produce H2 and O2. Water quality of the recirculated water is maintained with deionization resin beds (Figure 2). If trace contaminant levels are found to exceed allowable specifications, the recirculated water may need to be drained, representing a potential for wastewater discharge. However, water can be re-purified rather than discharged if the drain is channeled back to the original RODI unit (dashed blue line in Figure 2).
This proposed approach represents a dual use of the RODI system to provide water and wastewater treatment, which can increase closed-loop operation and minimize the potential for PFAS emissions from wastewater. Some wastewater will still be generated during electrolyzer operation by rejecting water from the RODI system. However, as a consolidated single wastewater stream, it can be appropriately treated and discharged in accordance with permitted discharge limits and environmental regulations.
4.5. Further Research
Various aspects of stakeholder interest [17] have been explored in this study, including sampling and analytical protocols, approaches to source attribution, interpretation of reporting limits, and mitigation approaches for avoiding chemical degradation and minimizing the generation of wastewater. While this study focused on potential PFAS emissions at beginning-of-life operation and maintenance events, further research may consider potential emissions after extended operation. Similar water sampling could be conducted after several thousand hours of electrolysis and/or after accelerated life testing over shorter durations. Accelerated life testing variables such as operating conditions (temperature, pressure, voltage, current density), membrane thickness, and dynamic operation (ramp rates) can potentially influence chemical degradation rates [21,22]. In addition to the PFAS and fluoride measurements conducted in this study, total organic fluorine and total organic carbon measurements may be used to quantify total residuals in water (fluorinated and non-fluorinated, respectively) in the electrolyzer use phase [17].
Fate and transport analysis is needed to estimate potential exposure point concentrations to inform the potential environmental impact of PFAS emissions from electrolyzer operation. Fate and transport analysis models the movement of chemicals through environmental media. It can be used to estimate concentrations of chemicals in an exposure medium, based on concentrations of chemicals in an impacted medium. For example, if the impacted medium is the point of wastewater discharge from electrolyzer operation and the exposure medium is drinking water from an adjacent groundwater well, fate and transport analysis can be used to model the movement of PFAS constituents from the point of discharge to the groundwater well. The U.S. EPA soil screening guidance provides methods for modeling the partitioning of dissolved chemical constituents between soil, groundwater, and air [23,24]. It has previously been used to develop fate and transport methods for potential use-phase environmental impacts of renewable energy technologies [25]. While the latter methodology investigated metal constituents not subject to biodegradation, fate and transport analysis of PFAS constituents may need to consider potential biodegradation in the environment [17].
5. Conclusions
Potential PFAS emissions during product use in PEM water electrolysis are of regulatory interest in the context of life cycle product stewardship as a potential alternative to regulatory PFAS product restrictions. Understanding the potential for use-phase PFAS emissions and identifying the root cause requires careful selection and timing of control and electrolysis samples, handling procedures that prevent background contamination, and analytical methods capable of measuring PFAS at parts per trillion concentrations. Consistent with high early-life fluoride release rates in reliability testing, electrolysis water samples were collected during the first ~2 weeks of stack operation in a multi-megawatt PEM electrolyzer plant, and no PFAS substances were detected. The sampling methodologies can be used to evaluate potential PFAS emissions from other electrolysis systems. Minimizing gas crossover and maintaining water quality during electrolyzer operation can mitigate H2O2 formation and the associated potential for chemical degradation via •OH radicals. Dual use of the reverse osmosis/deionization system for water and wastewater treatment can improve the closed-loop water circulation during electrolyzer operation and minimize the potential for PFAS emissions in wastewater.
Acknowledgments
We thank Erika Fisher for advising on experimental design and analysis, and James Lalikos and Brad Parks for advising on discussion of results.
Author Contributions
Conceptualization, P.S.; Methodology, P.S. and B.T.; Formal Analysis, P.S.; Investigation, B.T.; Data Curation, B.T.; Writing—Original Draft Preparation, P.S.; Writing—Review and Editing, P.S. and B.T. All authors have read and agreed to the published version of the manuscript.
Ethics Statement
Not applicable.
Informed Consent Statement
Not applicable.
Data Availability Statement
The original contributions presented in this study are included in the article. Further inquiries can be directed to the corresponding author.
Funding
This research received no external funding.
Declaration of Competing Interest
Dr. Parikhit Sinha and Bibek Tripathi are employed by Electric Hydrogen Co., Devens. The authors declare that the research was conducted in the absence of any commercial or financial relationships that could be construed as a potential conflict of interest.
References
-
European Chemicals Agency. Restriction on the Manufacture, Placing on the Market and Use of PFASs, Annex XV Report. Available online: https://echa.europa.eu/documents/10162/f605d4b5-7c17-7414-8823-b49b9fd43aea (accessed on 5 June 2025). [Google Scholar]
-
Organisation for Economic Co‐operation and Development (OECD). Reconciling Terminology of the Universe of Per- and Polyfluoroalkyl Substances: Recommendations and Practical Guidance. In OECD Series on Risk Management of Chemicals; OECD Publishing: Paris, France, 2021. doi:10.1787/e458e796-en. [Google Scholar]
-
Henry BJ, Carlin JP, Hammerschmidt JA, Buck RC, Buxton LW, Fiedler H, et al. A critical review of the application of polymer of low concern and regulatory criteria to fluoropolymers. Integr. Environ. Assess. Manag. 2018, 14, 316–334. doi:10.1002/ieam.4035. [Google Scholar]
-
Korzeniowski SH, Buck RC, Newkold RM, Kassmi AE, Laganis E, Matsuoka Y, et al. A critical review of the application of polymer of low concern regulatory criteria to fluoropolymers II: Fluoroplastics and fluoroelastomers. Integr. Environ. Assess. Manag. 2023, 19, 326–354. doi:10.1002/ieam.4646. [Google Scholar]
-
Wang T, Cao X, Jiao L. PEM water electrolysis for hydrogen production: Fundamentals, advances, and prospects. Carb Neutrality 2022, 1, 21. doi:10.1007/s43979-022-00022-8. [Google Scholar]
-
Lohmann R, Cousins IT, DeWitt JC, Gluge J, Goldenman G, Herzke D, et al. Are Fluoropolymers Really of Low Concern for Human and Environmental Health and Separate from Other PFAS? Environ. Sci. Tech. 2020, 54, 12820–12828. doi:10.1021/acs.est.0c03244. [Google Scholar]
-
Sinha P, Cypher SM. Life Cycle Fluoropolymer Management in Proton Exchange Membrane Electrolysis. Hydrogen 2024, 5, 710–722. doi:10.3390/hydrogen5040037. [Google Scholar]
-
Kusoglu A, Calabrese M, Weber AZ. Effect of Mechanical Compression on Chemical Degradation of Nafion Membranes. ECS Electrochem. Lett. 2014, 3, F33–F35. doi:10.1149/2.008405eel. [Google Scholar]
-
Berg A, Meyerstein D. Chapter 7—The chemistry of monovalent copper in aqueous solutions. In Advances in Inorganic Chemistry; van Eldik R, Ivanović-Burmazović I, Eds.; Academic Press: Cambridge, MA, USA, 2012; Volume 64, pp. 219–261. doi:10.1016/B978-0-12-396462-5.00007-6. [Google Scholar]
-
Zaton M, Roziere J, Jones DJ. Current understanding of chemical degradation mechanisms of perfluorosulfonic acid membranes and their mitigation strategies: A review. Sustain. Energy Fuels 2017, 1, 409. doi:10.1039/c7se00038c. [Google Scholar]
-
Madhav D, Wang J, Keloth R, Mus J, Buysschaert F, Vandeginste V. A Review of Proton Exchange Membrane Degradation Pathways, Mechanisms, and Mitigation Strategies in a Fuel Cell. Energies 2024, 17, 998. doi:10.3390/en17050998. [Google Scholar]
-
Kuhnert E, Heidinger M, Bernroitner A, Kiziltan Ö, Berger E, Hacker V, et al. Fluoride emission rate analysis in proton exchange membrane water electrolyzer cells. Front. Energy Res. 2024, 12, 1457310. doi:10.3389/fenrg.2024.1457310. [Google Scholar]
-
U.S. Environmental Protection Agency. Method 1633, Revision A, Analysis of Per- and Polyfluoroalkyl Substances (PFAS) in Aqueous, Solid, Biosolids, and Tissue Samples by LC-MS/MSEPA, 820-R-24-007. Available online: https://www.epa.gov/system/files/documents/2024-12/method-1633a-december-5-2024-508-compliant.pdf (accessed on 5 June 2025). [Google Scholar]
-
Tettau P, Thiele P, Mauermann P, Wick M, Tinz S, Pischinger S. Per- and polyfluoroalkyl substances in proton exchange membrane fuel cells —A review. J. Power Sources 2025, 630, 236104. doi:10.1016/j.jpowsour.2024.236104. [Google Scholar]
-
Lange T, Dietrich M, Schlottmann H, Valkov V, Mackert V, Radev I, et al. Investigating PFAS emissions of light- and heavy-duty fuel cell electric vehicles. J. Power Sources Adv. 2025, 32, 100171. doi:10.1016/j.powera.2025.100171. [Google Scholar]
-
Ingold V, Kämpfe A, Ruhl AS. Screening for 26 per- and polyfluoroalkyl substances (PFAS) in German drinking waters with support of residents. Eco-Environ. Health 2023, 2, 235–242, doi:10.1016/j.eehl.2023.08.004. [Google Scholar]
-
European Commission. Understanding Emissions of PFAS from Electrolysers and/or Fuel Cells under Product Use, HORIZON-JU-CLEANH2-2025-05-02. Available online: https://ec.europa.eu/info/funding-tenders/opportunities/portal/screen/opportunities/topic-details/horizon-ju-cleanh2-2025-05-02 (accessed on 5 June 2025). [Google Scholar]
-
U.S. Environmental Protection Agency. PFAS National Primary Drinking Water Regulation, 40 CFR Parts 141 and 142. Available online: https://www.federalregister.gov/documents/2024/04/26/2024-07773/pfas-national-primary-drinking-water-regulation (accessed on 5 June 2025). [Google Scholar]
-
Hydrogen Europe. Hydrogen Europe Position Paper on PFAS. Available online: https://hydrogeneurope.eu/policy-priorities/position-papers/ (accessed on 4 August 2025). [Google Scholar]
-
Sinha P, Lambert MB, Trumbull VL. Evaluation of statistical methods for left-censored environmental data with nonuniform detection limits. Environ. Toxicol. Chem. 2009, 25, 2533–2540. doi:10.1897/05-548R.1. [Google Scholar]
-
Urbano E, Pahon E, Yousfi-Steiner N, Guillou M. Accelerated stress testing in proton exchange membrane water electrolysis—Critical review. J. Power Sources 2024, 623, 235451. doi:10.1016/j.jpowsour.2024.235451. [Google Scholar]
-
Kuhnert E, Hacker V, Bodner M. A Review of Accelerated Stress Tests for Enhancing MEA Durability in PEM Water Electrolysis Cells. Int. J. Energy Res. 2023, 2023, 3183108. doi:10.1155/2023/3183108. [Google Scholar]
-
U.S. Environmental Protection Agency. Soil Screening Guidance: User’s Guide, Second Edition, Office of Emergency and Remedial Response. Available online: https://semspub.epa.gov/work/HQ/175238.pdf (accessed on 5 August 2025). [Google Scholar]
-
U.S. Environmental Protection Agency. Supplemental Guidance for Developing Soil Screening Levels for Superfund Sites, Office of Solid Waste and Emergency Response. Available online: https://semspub.epa.gov/work/HQ/175878.pdf (accessed on 5 August 2025). [Google Scholar]
-
Sinha P, Heath G, Wade A, Komoto K. Human health risk assessment methods for PV, Part 2: Breakage risks, International Energy Agency (IEA) PVPS Task 12, Report T12-15:2019. Available online: https://iea-pvps.org/key-topics/iea-pvps-t12-15_human-health-risk-assessment-methods-for-pv-part-2/ (accessed on 5 August 2025). [Google Scholar]