Divergent Aging Mechanisms of Calcium Arsenic Residue under Dry-Wet and Freeze-Thaw Cycles: Toxic Metal Mobility, Multiscale Physicochemical Characterization, and Escalated Ecological Risks

Divergent Aging Mechanisms of Calcium Arsenic Residue under Dry-Wet and Freeze-Thaw Cycles: Toxic Metal Mobility, Multiscale Physicochemical Characterization, and Escalated Ecological Risks
Xiaolong Zhao 1,2,† Guangli Wang 1,2,† Ying Du 1,2 Zhiying Zhao 1,2 Menghua Ran 1,2 Dongyun Du 1,2,*
Received: 09 August 2025 Revised: 22 September 2025 Accepted: 10 October 2025 Published: 20 October 2025

© 2025 The authors. This is an open access article under the Creative Commons Attribution 4.0 International License (https://creativecommons.org/licenses/by/4.0/).
1. Introduction
During the copper smelting and converting processes in non-ferrous metallurgy, sulfur-containing flue gases undergo waste heat recovery, multi-stage dust removal, and chemical scrubbing treatments. These treatments end up producing acidic wastewater with high levels of sulphuric acid (5–20%), fluorine/chlorine (1–8 g/L), and toxic elements (e.g., As, Zn, Cd), collectively known as “dirty acid” wastewater [1,2,3,4]. Due to its complex composition and synergistic toxicity, this wastewater presents a persistent environmental challenge for global metallurgical industries. Researchers have developed various treatment methods to address this, including sulfurization, lime neutralization, electrocoagulation, membrane separation, biological treatment, and tailing solidification [5,6,7,8,9,10]. While electrocoagulation and membrane technologies have demonstrated effectiveness in the remediation of low-arsenic groundwater [11], their application is constrained by the high acidity and complex matrix of industrial wastewater. Although cost-effective, biological methods are limited by pH/temperature sensitivity, ion interference, and long treatment durations [12]. In comparison, the sulfurization and lime-iron salt process has gained prominence as the mainstream industrial choice due to its controllable reagent dosage and cost-effectiveness, enabling arsenic removal through precipitation reactions. However, the risks of secondary arsenic release from residual sulfide oxidation and potential H2S emission hazards have led to adopting lime neutralization as a safer, more operational alternative [1,13]. This process generates metastable calcium arsenic residue (CAR) via Ca(OH)2/CaO-based precipitation [14,15], but the resultant hazardous waste disposal issue remains unresolved.
CAR, a hazardous waste, is typically disposed of through stockpiling and landfilling [16], posing serious environmental risks: (1) Massive accumulation—each plant generates tens of thousands of tons annually; (2) Synergistic toxicity—As(III)/As(V) exhibit carcinogenicity, Cd bioaccumulates through food chains, impairing renal function, and Zn overload disrupts soil microbial communities [17,18]; (3) Speciation sensitivity—Redox fluctuations and pH variations can trigger arsenic speciation transformations, substantially enhancing its mobility and bioavailability [14]. Historical incidents illustrate the ecological consequences of poor CAR management in developing countries, such as arsenic contamination in a 6-km aquifer near a Mexican smelter [19], and increased mortality rates in arsenic-exposed regions of Bangladesh [20,21], illustrating the environmental unsustainability of long-term CAR stockpiling [22,23].
Current environmental risk assessments for arsenic-bearing solid waste predominantly rely on static (e.g., TCLP) or semi-dynamic (e.g., SPLP) leaching tests. For example, Harshit Mahandra et al. employed multiple EPA-specified leaching protocols to evaluate arsenic release from vitrified flue dust [24], while Wang Yunyan et al. analyzed copper smelting desulfurization gypsum residues through static and semidynamic erosion experiments [25]. Jiangchi Fei et al. enhanced CAR stability by leaching unstable heavy metals and regulating arsenic speciation [22]. Nonetheless, three key limitations exist: (1) Overly idealized experimental conditions lacking dynamic climatic simulations (e.g., dry-wet (DW) alternation, freeze-thaw (FT) cycling); (2) Overdependence on empirical models (e.g., first-order kinetics) for long-term aging prediction while neglecting phase transformation mechanisms; (3) Weak correlation between stabilization strategies and toxic metal speciation evolution, limiting practical application in real-world stockpiling risk mitigation.
In this study, an accelerated aging model combined with multiscale characterization techniques (XRD, SEM, FTIR, XPS) was developed to assess the stability of CAR systematically under dynamic climatic conditions. The model simulates real-world environmental fluctuations, enabling the evaluation of the effects of DW and FT cycles on the physical and chemical properties of CAR. The transformation pathways of As, Zn, and Cd were tracked, and these transformations were correlated with metal leaching patterns to construct a comprehensive environmental risk profile. In addition, the findings were integrated into a detailed environmental risk assessment, establishing a predictive framework for long-term ecological risks. This approach provides valuable insights into the potential environmental impacts of CAR under varying climatic conditions and acts as a foundation for developing strategies to mitigate the ecological risks associated with toxic metal contamination in legacy waste sites.
2. Materials and Methods
2.1. Sample and Reagent Preparation
The CAR samples were collected from a copper smelting plant in Hubei Province, China, generated through lime neutralization treatment of “dirty acid” wastewater. The wet CAR had been stockpiled outdoors at the plant site for 45 days, exhibiting a moisture content of 25% and a pH of 10.54. After collection, samples were homogenized using the coning and quartering method and then stored in light-proof black polyethylene bags to preserve their integrity. For compositional analysis, the samples were dried in a vacuum oven at 25 °C for 12 h, physically crushed, sieved to 100 mesh (150 μm), and analyzed for elemental composition using X-ray fluorescence spectroscopy (XRF), as shown in Table S1. All reagents used in the study were sourced from Sinopharm Chemical Reagent Co., Ltd. (Wuhan, China).
2.2. Experimental Methods
2.2.1. Dry-Wet Alternation and Freeze-Thaw Cycles
Dry-wet (DW) cycling simulation [26]: Wet CAR was placed in disposable Petri dishes, and distilled water was added to adjust its moisture content to 70% of the maximum field water-holding capacity. After incubation for 12 h, the dishes were transferred to a 55 °C environment for 12 h of drying. Subsequently, distilled water was replenished to maintain the moisture content at 70%, completing one DW cycle. CAR samples were subjected to 3, 7, 14, 21, and 28 DW cycles. After each treatment, the wet CAR was air-dried in a fume hood, sieved through a 100-mesh screen, and stored. All treatments were performed in triplicate to ensure experimental representativeness.
Freeze-thaw (FT) cycling simulation [27]: Wet CAR was placed in disposable Petri dishes, and distilled water was added to adjust its moisture content to 70% of the maximum field water-holding capacity. After incubation for 12 h, the dishes were frozen at −20 °C for 12 h. The samples were then thawed at room temperature, and distilled water was replenished to restore the moisture content to 70%, completing one FT cycle. CAR samples underwent 3, 7, 14, 21, and 28 FT cycles. Post-treatment, the samples were air-dried in a fume hood, sieved through a 100-mesh screen, and stored. Similarly, all treatments were replicated three times.
2.2.2. Toxicity Characteristic Leaching Procedure (TCLP)
The simulated stockpiled CAR was physically crushed and subjected to the TCLP test according to standard protocols. The leachate was filtered through a 0.22 μm membrane and stored at 4 °C for subsequent analysis. The concentrations of leached toxic elements were determined using inductively coupled plasma optical emission spectrometry (ICP-OES).
2.2.3. Measurement of Bioavailable Toxic Elements
Bioavailable As: Bioavailable As was extracted using 0.05 mol/L NH4H2PO4 solution at a solid-to-liquid ratio of 1:25. The mixture was oscillated at 180 ± 20 rpm for 16 h, filtered through a 0.22 μm membrane, and stored at 4 °C.
Bioavailable Zn and Cd: A DTPA extractant (0.005 mol/L DTPA, 0.1 mol/L triethanolamine (TEA), and 0.01 mol/L CaCl2 was used with a solid-to-liquid ratio of 1:5 (5 g sample to 25 mL extractant). The mixture was horizontally oscillated at 180 cycles/min for 2 h. After centrifugation, the initial 5–6 mL of supernatant was discarded, and the remaining filtrate was passed through a 0.22 μm membrane and stored at 4 °C.
2.2.4. Sequential Extraction Procedure
A three-step sequential extraction method, proposed by the Community Bureau of Reference (BCR) and modified by Davidson’s sequential extraction protocol [28], was employed to analyze the chemical speciation of As, Zn, and Cd in CAR. Each extraction step was repeated three times.
2.2.5. Determination of Physicochemical Properties
A total of 5.0 g of sample was mixed with 25 mL of ultrapure water in a 50 mL beaker. The mixture was vigorously stirred for 1–2 min, allowed to settle for 30 min, and then measured for pH, electrical conductivity (EC), and oxidation-reduction potential (ORP) were then measured using a multi-parameter meter equipped with a saturated calomel electrode (SCE). These measurements were conducted on both raw CAR and samples treated with varying cycles of FT and DW.
2.3. Analytical and Characterization Methods
The particle size distribution of CAR was analyzed using an LS-609 laser particle size analyzer (by Zhuhai OMEC Instruments Co., Ltd., located in Zhuhai, China) is manufactured by Zhuhai OMEC Instruments Co., Ltd., located in Zhuhai, China. Elemental composition and content were determined by X-ray fluorescence spectroscopy (XRF). The crystalline structure was characterized via X-ray diffraction (XRD), identifying the primary mineral phases. Scanning electron microscopy (SEM) was employed to analyze the morphological features and microstructural characteristics of the samples. Fourier transform infrared spectroscopy (FTIR) was utilized to identify functional groups and molecular structures of compounds. In addition, X-ray photoelectron spectroscopy (XPS) was applied to investigate the valence state distribution of internal elements, elucidating their chemical transformations.
2.4. Environmental Risk Assessment of Toxic Elements
2.4.1. Potential Risk Index Method
The Potential Ecological Risk Index (IPER) proposed by HAKANSON was adopted to evaluate the cumulative ecological risks of toxic elements. This method has been widely applied in soil and solid waste environmental assessments [29,30].
The IPER is calculated as follows:
```latex{C}_{f}^{i}=\frac{{C}_{D}^{i}}{{C}_{n}^{i}}``` |
(1) |
```latex{E}_{r}^{i}={C}_{f}^{i}×{T}_{r}^{i}``` |
(2) |
```latex{I}_{PER}=\sum {E}_{r}^{i}``` |
(3) |
Formula: represents the single-metal contamination factor in CAR; denotes the measured concentration of the toxic metal in CAR (mg/kg); is the reference value for the corresponding toxic metal, determined based on the risk screening values stipulated in China’s GB36600-2018 “Soil Environmental Quality—Risk Control Standard for Soil Contamination of Development Land (Trial)” and GB15618-2018 “Soil Environmental Quality—Risk Control Standard for Soil Contamination of Agricultural Land (Trial)” (mg/kg); refers to the potential ecological risk index of a single toxic metal; is the toxicity response factor for the corresponding toxic metal, with values listed in Table S2. Total metal concentrations were adopted in these calculations as they more effectively capture the upper threshold of potential environmental risks. While bioavailable species demonstrate greater immediate ecological relevance, this study specifically examines climate-driven environmental transformation processes that control the long-term stability of CAR.
Moreover, the HAKANSON classification framework for the potential ecological risk index based on $$ {E}_{r}^{i} $$ [30,31], grades of comprehensive potential ecological risk based on the Integrated Potential Ecological Risk Index (IPER), as detailed in Supplementary Materials Table S3.
2.4.2. Risk Assessment Code (RAC)
The RAC was calculated to comprehensively evaluate the toxic variations of target toxic elements under FT and DW cycles. Studies have demonstrated that RAC effectively reflects the environmental reactivity of metals in CAR by accounting for their speciation fractions with distinct binding strengths [32,33]. The RAC acts as a primary method for classifying environmental risk levels and is calculated using Equation (4):
```latexRAC=\frac{F1}{F2+F2+F3+F4}×100%``` |
(4) |
In the equation, F1 is the acid-extractable fraction, F2 is the oxidizable fraction, F3 is the reducible fraction, and F4 is the residual fraction. According to the RAC guidelines, the environmental risk level of any toxic metal is categorized into five distinct grades: No risk (<1%), Low risk (1–10%), Moderate risk (11–30%), High risk (31–50%), and Extremely high risk (>50%) [34].
2.5. Aging Process Simulation
A quantitative artificial aging method [35,36] was employed to simulate the impact of rainfall. Assuming an annual rainfall of 1000 mm per 1 m3 of soil, the rainwater received by 1 g of dry soil over one year was calculated to be 0.769 mL (based on a bulk density of 1.3 g/cm3). By considering the moisture content of CAR and the water replenishment volumes in the DW/FT cycles, the rainwater equivalent for 1 g of CAR per cycle was determined to be 0.794 mL. This suggests that each DW or FT cycle simulates one year of natural aging. Thus, the 28 cycles of DW and FT treatments performed in this study correspond to a 28-year aging process.
The immobilization of metals can be conceptualized as binding to specific functional sites within the CAR matrix. At Year 0, metal binding can be assumed to be fully effective, with a reliability of 1. However, structural degradation due to repeated DW and FT cycles gradually reduces the efficiency of this immobilization [37,38]. This degradation process can be modeled using conditional probability theory:
```latex\underset{h\to 0}{\mathrm{lim}}\frac{P\left(\left(t\le T\le t+h\right)︱T>t\right)}{h}=\lambda``` |
(5) |
In Equation (5), time t acts as a parameter defining the interval between t and t + h. The parameter λ represents the aging rate within this interval. Using an exponential model R(t), the degradation process is described in Equation (6). Since the aging rate is not constant in real-world scenarios, it is more accurately described by a Weibull distribution, shown in Equation (7), which simplifies the exponential model in cases where aging follows a constant rate in Equation (8). The reliability function is expressed as follows:
|
|
(6) |
|
|
(7) |
|
|
(8) |
3. Results and Discussion
3.1. Changes in Physicochemical Properties of CAR
3.1.1. pH Variation
Figure 1a illustrates the pH evolution of CAR under DW and FT cycles. The pH gradually declined with increasing cycles. In DW cycles, the rate of pH decrease slowed after the 3rd cycle, likely due to the accelerated dissolution of metastable arsenate phases through periodic hydration, which released acidic components. In FT cycles, the pH stabilized after the 7th cycle, attributed to mechanical damage from ice-induced particle fragmentation, allowing for quicker acid penetration. After 28 cycles, the pH decreased to 8.33 in DW cycles, while FT cycles resulted in a pH of 9.10, indicating stronger acidification under DW cycles.
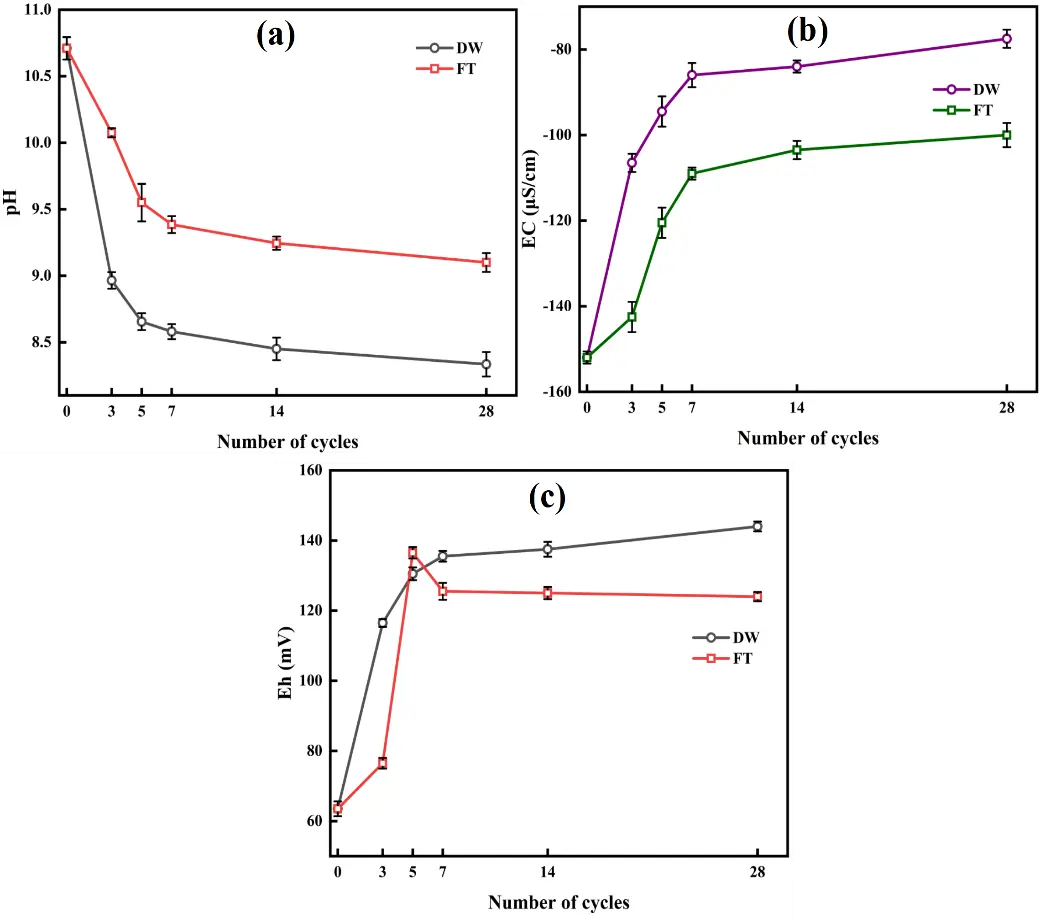
Figure 1. Illustrates the effects of DW and FT cycles on the physicochemical properties of CAR: (a) pH, (b) electrical conductivity (EC), and (c) redox potential (Eh).
3.1.2. Electrical Conductivity (EC) Dynamics
Figure 1b shows the EC evolution of CAR during DW and FT cycles. EC progressively increased with the number of cycles, stabilizing after the 7th cycle, with DW exhibiting a steeper rise than FT. After 28 cycles, EC reached −77.5 μS/cm for DW and −100 μS/cm for FT, indicating enhanced ion migration with prolonged liquid-phase interaction.
The staged changes in EC correlate with mineral dissolution kinetics. The initial rapid increase was due to the preferential dissolution of highly soluble components (e.g., gypsum, metal carbonates), governed by solid-liquid interfacial reactions. Subsequent deceleration arose from the slow dissolution of secondary minerals and increased ion diffusion resistance. Notably, ice crystal formation during FT increased solution density and reduced fluid mobility [39], thereby suppressing ion transport efficiency and resulting in lower EC increments compared to DW. This finding emphasizes the role that the physical states of the aqueous phase play in regulating ion transport.
3.1.3. Redox Potential (Eh) Evolution
Figure 1c reveals contrasting Eh trends under DW and FT. For DW, Eh increased steadily from 62 mV to 140 mV by cycle 28 and stabilized due to the accumulation of oxidized species (As(V)) and the depletion of reduced species (As(III)). This trend corresponds with pore structure dynamics during drying: Desiccation-induced shrinkage fractures enhance atmospheric oxygen diffusion efficiency, thereby facilitating persistent oxidation reactions throughout the slag matrix. Concurrently, infiltrating atmospheric CO2 promotes the speciation transformation and subsequent mobilization of toxic metal species.
In contrast, FT resulted in a non-monotonic Eh trajectory: rise to 136.5 mV by cycle 7, followed by a gradual decline to 124 mV by cycle 28. The initial increase in Eh was due to particle fragmentation, which increased the solid-gas contact area. However, ice barriers during prolonged freezing impede oxygen diffusion, suppressing oxidation. Simultaneously, ice encapsulation restricted ion migration, promoting redox equilibration.
3.1.4. Particle Size Distribution
Figure S1 illustrates the distinct evolutionary patterns of the particle size distribution of CAR under DW and FT cycles. The pristine sample displayed a bimodal distribution, with primary peaks at 7.19 μm and 29.9 μm, resulting in a median particle size (D50) of 8.23 μm (Figure S1a,d), indicative of complex, interwoven heterogeneous particle structures.
During the DW cycles, the particle size evolution followed three distinct phases of adjustments. During the initial 3 cycles, hydration-induced swelling in the wet phase promoted aggregate formation through surface interactions among fine particles [40], while concurrent Ca2⁺ release from carbonate dissolution enhanced flocculation, resulting in a reduction of the D50 to 7.81 μm. As the cycles increased to 14, rapid moisture evaporation during the drying phase triggered aggregate disintegration [41], along with carbonate alteration of mineral phases such as gypsum [42]. These processes led to a more rapid reduction of the D50 to 6.88 μm. After 28 cycles, the enhanced anti-disintegration capacity of the particles slowed the size reduction rate, stabilizing the D50 at 5.94 μm through progressive surface carbonation reactions (Figure S1c,f).
In contrast, FT cycles exhibited a counteractive regulatory mechanism. Although ice crystal growth exerted disruptive forces on coarse particles, the intrinsic anti-fragmentation characteristics of gypsum phases, along with ice-cementation-induced reagglomeration of fine particles, helped maintain system stability [43]. This dual mechanism led to a modest increase in D50 to 6.55 μm, accompanied by a migration of the primary peak to 9.23 μm after 28 cycles (Figure S1c,f).
3.2. Impacts of DW and FT Cycles on the Stability of As, Zn, and Cd in CAR
3.2.1. Variations in Leaching Toxicity of As, Zn, and Cd
The leaching toxicity and release dynamics of As, Zn, and Cd in CAR under DW and FT cycles are illustrated in Figure 2. Under DW cycles, the leaching concentrations of all three toxic elements increased progressively with cycle number. Arsenic leaching rose from 237.52 mg/L (3 cycles) to 300.98 mg/L (28 cycles), while Zn increased from 379.52 mg/L to 477.74 mg/L, and Cd escalated from 20.47 mg/L to 38.16 mg/L (Figure 2a–c). The cumulative release rates after 28 cycles reached 52.39%, 42.63%, and 68.55% for As, Zn, and Cd, respectively. This enhanced release was driven by synergistic mechanisms: the periodic DW cycles reduced system pH (from 10.58 to 8.33), increasing toxic metal ion activity. Simultaneously, CO2 dissolution in the aqueous phase generated carbonate ions participating in ligand exchange with arsenate compounds. Particle size reduction (32% decrease in D50) amplified the specific surface area, accelerating interfacial dissolution of mineral phases such as calcium arsenate and zinc/cadmium sulfides [44,45]. In addition, moisture transport promoted leaching effects that continuously carried dissolved metals outward, establishing sustained release fluxes.
In contrast, FT cycles exhibited a moderate release pattern. After 28 cycles, leaching concentrations stabilized at 258.28 mg/L (As), 407.97 mg/L (Zn), and 29.56 mg/L (Cd), corresponding to release rates of 44.28%, 32.52%, and 59.39%, respectively. Although ice crystal growth initially enhanced pore connectivity and facilitated short-term metal release, prolonged freezing suppressed solution mobility. Concurrently, the recrystallization of cementitious phases like gypsum formed dense microstructures that effectively impeded toxic metal diffusion [46]. These combined effects resulted in systematically lower release rates under FT compared to DW cycles.
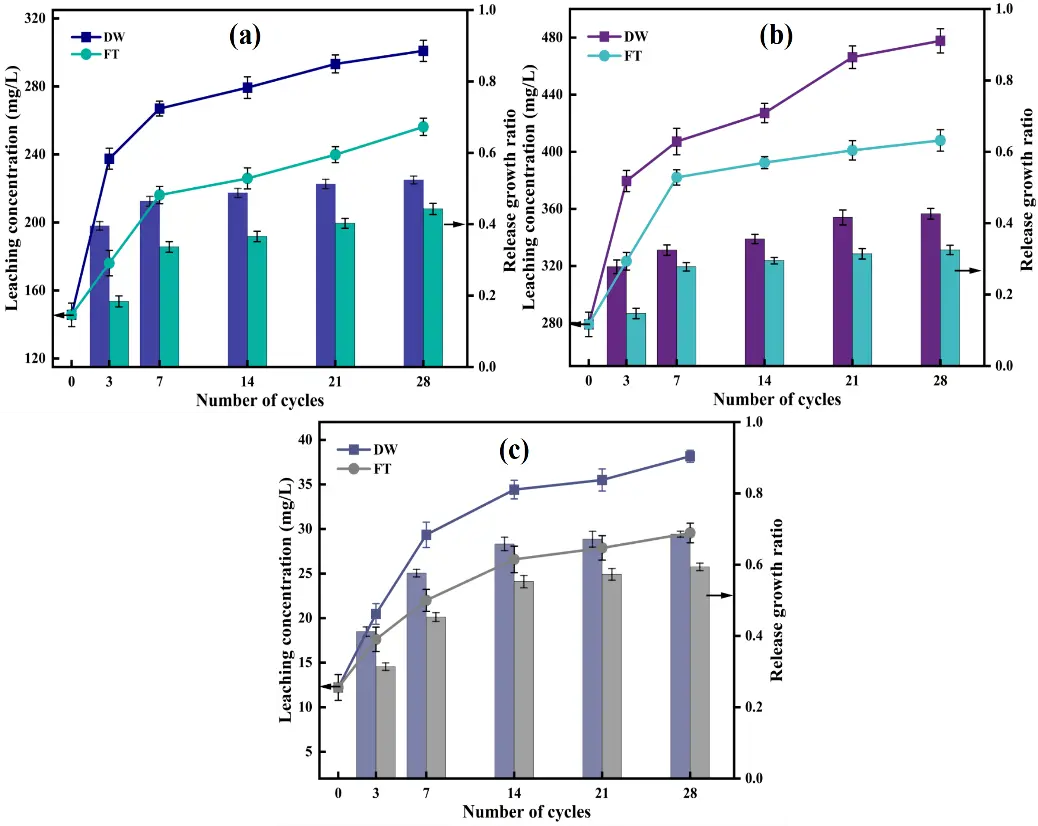
Figure 2. Illustrates the leaching toxicity (left) and release rates (right) of toxic elements in CAR subjected to 1 −28 cycles of DW and FT cycling: (a) As, (b) Zn, and (c) Cd.
3.2.2. Chemical Speciation Changes of As, Zn, and Cd
Figure 3 illustrates the chemical speciation of As, Zn, and Cd in CAR after 28 cycles of DW and FT. Sequential extraction, using Davidson’s three-step protocol, categorized the toxic elements into four fractions: acid-extractable (F1), oxidizable (F2), reducible (F3), and residual (F4). In raw CAR, As speciation followed this order: F4 (87.28%), F1 (11.17%), F2 (1.48%), and F3 (0.07%) (Figure 3a), while Zn and Cd exhibited similar distributions: F4 (83.40% and 79.52%), F1 (12.64% and 11.02%), F2 (2.88% and 8.21%), and F3 (0.07% and 1.25%) (Figure 3b,c). Following DW cycles, the residual fraction (F4) of As, Zn, and Cd decreased progressively, while F1 and F2 increased. After 28 cycles, F4 for As, Zn, and Cd declined from initial values of 88.26%, 83.40%, and 79.52% to 72.98%, 75.94%, and 60.19%, respectively. Concurrently, F1 increased to 17.65% (As), 18.63% (Zn), and 19.67% (Cd), and F2 rose to 7.34% (As), 4.31% (Zn), and 17.36% (Cd). Moisture enhanced metal solubility and oxidation processes, thereby promoting the transformation of residual phases into acid-soluble species [47]. Repeated drying cycles facilitated the retention of labile fractions (F1 and F2), with DW exerting the strongest effect on the oxidizable fraction of Cd and the acid-extractable fractions of As and Zn.
In contrast, F4 remained the dominant speciation for all metals under FT cycles. After 28 cycles, F1 increased moderately to 11.86% (As), 16.59% (Zn), and 15.23% (Cd), while F2 rose to 5.67% (As), 3.28% (Zn), and 14.25% (Cd) (Figure 3a–c). Limited speciation shifts under FT were attributed to mechanical immobilization: cyclic pore compression during freezing and expansion during thawing trapped toxic elements within the matrix, reducing their mobility [48].
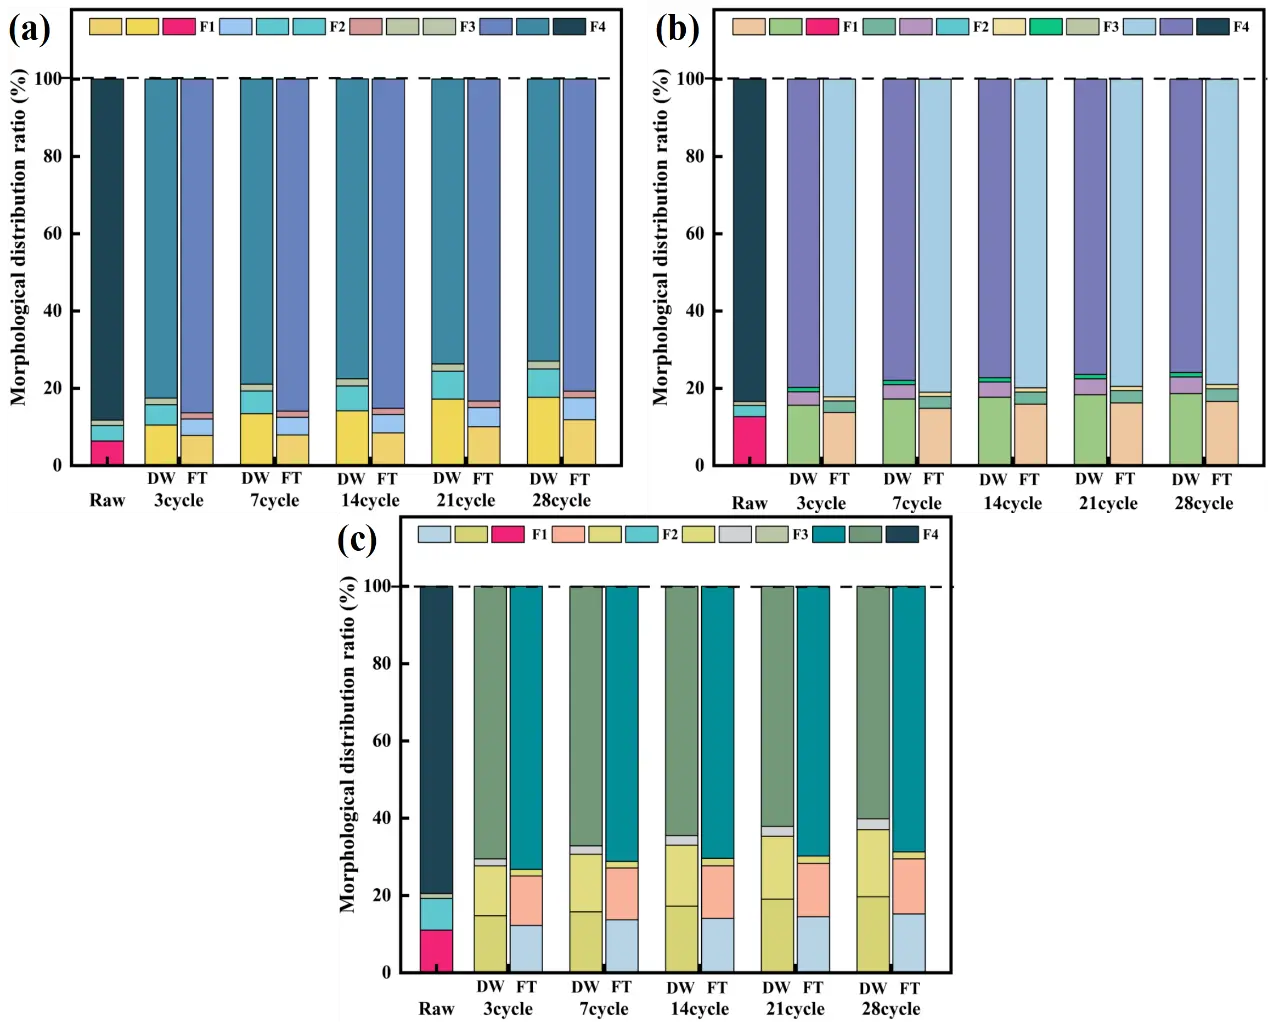
Figure 3. Evolution of toxic elements speciation in CAR after 28 cycles of DW and FT cycling, (a) As; (b) Zn; (c) Cd; acid-extractable (F1), oxidizable (F2), reducible (F3), and residual (F4).
3.2.3. Variations in Bioavailable As, Zn, and Cd in CAR
Figure S2 illustrates the changes in bioavailable concentrations of As, Zn, and Cd in CAR after 1–28 cycles of DW and FT. Under DW cycles, the bioavailable concentrations of all three toxic elements increased continuously with cycle progression. Arsenic rose from an initial concentration of 128.36 mg/L to 214.57 mg/L (67.2% increase), Zn increased from 144.20 mg/L to 234.80 mg/L (62.8% increase), and Cd escalated from 47.02 mg/L to 75.18 mg/L (59.9% increase) after 28 cycles. Bioavailable fractions reflect the environmental mobility and bioavailability of toxic elements, directly influencing their ecological risks during subsequent disposal [49]. The moist conditions under DW enhanced metal solubility, while repeated hydration and dehydration of mineral phases altered the chemical properties of the slag, promoting the release of bioavailable As, Zn, and Cd.
In contrast, FT cycles exhibited a biphasic release pattern characterized by rapid initial increases followed by gradual stabilization. Within the first 3 cycles, bioavailable As and Zn surged to 165.33 mg/L (28.8% increase) and 172.80 mg/L (19.8% increase), respectively. Subsequently, the growth rates slowed, reaching final concentrations of 184.75 mg/L (44.1% total increase) for As and 205.91 mg/L (42.8% total increase) for Zn after 28 cycles. The initial spike was attributed to freeze-thaw-induced fracturing and redistribution of mineral matrices, which reduced their adsorption capacity [50]. However, structural stabilization during later cycles attenuated further increases in bioavailability. Bioavailable Cd displayed intermediate sensitivity, rising to 62.78 mg/L (33.5% increase) after 28 FT cycles.
3.3. Characterization of CAR under DW and FT Cycles
3.3.1. XRD Analysis
Figure 4 illustrates the mineralogical evolution of CAR after 28 cycles of DW and FT, as analyzed by XRD. Raw CAR primarily contained crystalline phases of CaSO4·2H2O, CaCO3, Zn2(AsO4)(OH)·2H2O, Ca3(AsO4)2, Zn3(AsO4)2, ZnS, and CdS, with minor amorphous phases due to its heterogeneous composition [14].
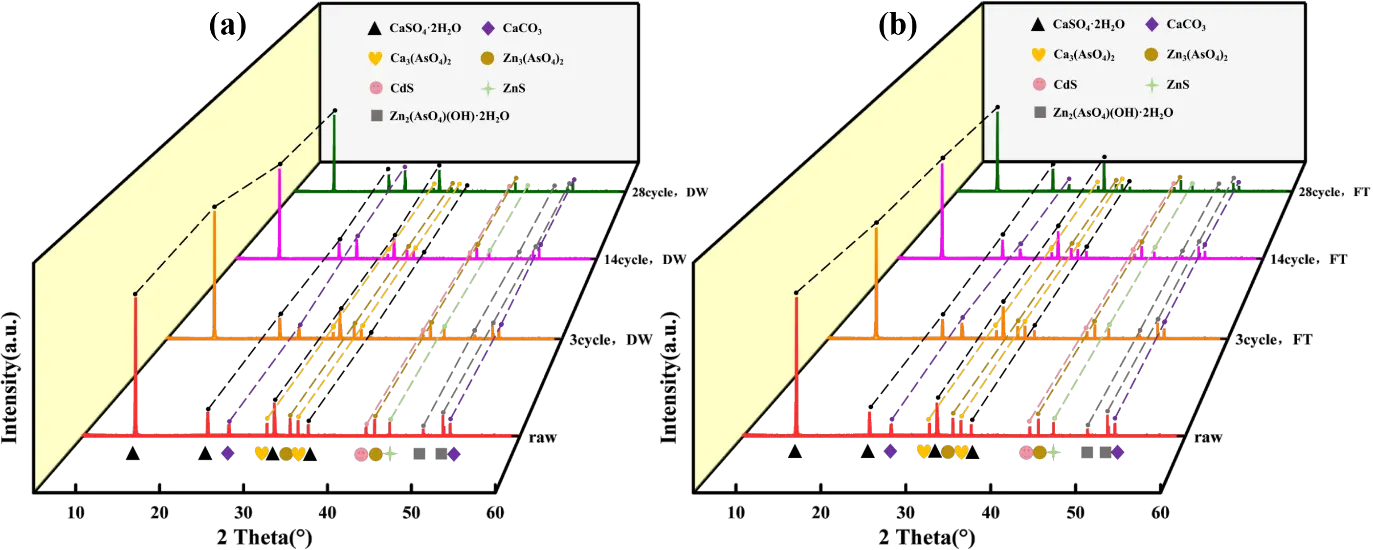
Under DW cycles, mineralogical reorganization occurred. The peak intensity of CaSO4·2H2O linearly attenuated with cycle progression, while CaCO3 peaks intensified (Figure 4a). This inverse relationship confirms a DW driven carbonation pathway: atmospheric CO2 infiltrated through open pores during drying, reacting with gypsum at the solid-gas interface (Equation (9)). Concurrently, arsenate minerals (e.g., Ca3(AsO4)2) and zinc hydroxyarsenate exhibited reduced peak intensities, indicating enhanced dissolution during wet phases due to pH-driven protonation of AsO43− (pH decline from 10.58 to 8.33). Sulfide phases (ZnS and CdS) also degraded, consistent with oxidation pathways under elevated redox potential (Eh > 140 mV) (Equations (10) and (11)):
```latex\mathrm{C}\mathrm{a}\mathrm{S}\mathrm{O}₄·2\mathrm{H}₂\mathrm{O}\mathrm{ }+\mathrm{ }\mathrm{C}\mathrm{O}₂\mathrm{ }+\mathrm{ }\mathrm{H}₂\mathrm{O}\mathrm{ }\to \mathrm{ }\mathrm{C}\mathrm{a}\mathrm{C}\mathrm{O}₃\mathrm{ }+\mathrm{ }\mathrm{S}\mathrm{O}₄²⁻\mathrm{ }+\mathrm{ }2\mathrm{H}⁺``` |
(9) |
```latex\mathrm{Z}\mathrm{n}\mathrm{S}\mathrm{ }+\mathrm{ }2\mathrm{O}₂+\mathrm{H}₂\mathrm{O}\to \mathrm{ }\mathrm{Z}\mathrm{n}\mathrm{O}\mathrm{ }+\mathrm{ }\mathrm{S}\mathrm{O}₄²⁻+2\mathrm{H}⁺``` |
(10) |
```latex\mathrm{C}\mathrm{d}\mathrm{S}\mathrm{ }+\mathrm{ }2\mathrm{O}₂+\mathrm{H}₂\mathrm{O}\to \mathrm{ }\mathrm{C}\mathrm{d}\mathrm{O}\mathrm{ }+\mathrm{ }\mathrm{S}\mathrm{O}₄²⁻+2\mathrm{H}⁺``` |
(11) |
In contrast, FT cycles induced distinct phase dynamics. CaSO4·2H2O peak attenuation was less pronounced (Figure 4b), attributed to ice encapsulation suppressing CO2 diffusion and low-temperature retardation of reaction kinetics. Calcite peaks exhibited non-monotonic behavior: initial intensification (cycles 3–14) followed by decline (cycles 14–28). This biphasic trend reflects dual ice-mediated mechanisms: (1) ice crystal compression enhanced pore connectivity, promoting localized carbonation; and (2) subsequent meltwater transport of HCO3− triggered calcite dissolution and re-equilibration [51], Equation (12). Arsenic and sulfide phases showed slower degradation rates under FT than under DW, corroborating the inhibitory effects of low temperature on mineral alteration [52].
```latex\mathrm{C}\mathrm{a}\mathrm{C}\mathrm{O}₃\mathrm{ }+\mathrm{ }\mathrm{H}₂\mathrm{O}\mathrm{ }+\mathrm{ }\mathrm{C}\mathrm{O}₂\mathrm{ }\to \mathrm{ }\mathrm{C}\mathrm{a}²⁺\mathrm{ }+\mathrm{ }2\mathrm{H}\mathrm{C}\mathrm{O}₃⁻``` |
(12) |
3.3.2. SEM Analysis
Figure 5 illustrates the microstructural evolution of the CAR after 28 DW and FT cycles using SEM at various magnifications. Untreated CAR exhibited prismatic-blocky gypsum crystals (20–100 μm) with smooth surfaces and intact crystallinity at 50 μm scale (Figure 5a,d), indicative of an initially dense microstructure. Notably, high-resolution imaging (2 μm) revealed submicron particles (<5 μm) and columnar phases forming heterogeneous agglomerates on the gypsum matrix (Figure 5g), structurally and compositionally consistent with the multiphase coexistence of calcium arsenate and calcite identified by XRD. This confirms the complex syn-crystallization characteristics of minerals in raw CAR.
Following DW cycles, the samples displayed marked structural degradation: gypsum particles underwent selective size reduction (5–50 μm) accompanied by surface roughening and edge rounding (Figure 5b,e). These changes correlate with DW-induced As–O bond cleavage and partial mineral dissolution-recrystallization, particularly driven by CO2 adsorption-driven carbonation. At higher magnification (2 μm, Figure 5h), microporosity (<1 μm) became evident on gypsum surfaces, providing nucleation sites for amorphous particle reprecipitation and migration channels for toxic elements (e.g., As, Zn). The emergence and propagation of microcracks suggest stress-induced fracturing under cyclic humidity variations, aligning with XRD-detected declines in calcium arsenate intensity and calcite enrichment.
In contrast, FT cycles triggered more pronounced mechanical damage. At 10 μm scale, irregular fracture planes on gypsum surfaces (Figure 5f) illustrate ice-expansion-stress-dominated brittle fragmentation, coupled with localized carbonate precipitation induced by moisture migration. Freezing enhanced interparticle cementation, forming unevenly thick cementation layers on fragmented surfaces, likely due to ice-mediated carbonate reprecipitation. This process promoted further aggregation of fines and agglomerates, as evidenced by denser agglomerate structures observed at 2 μm magnification (Figure 5i), reflecting FT induced water infiltration and physical immobilization.
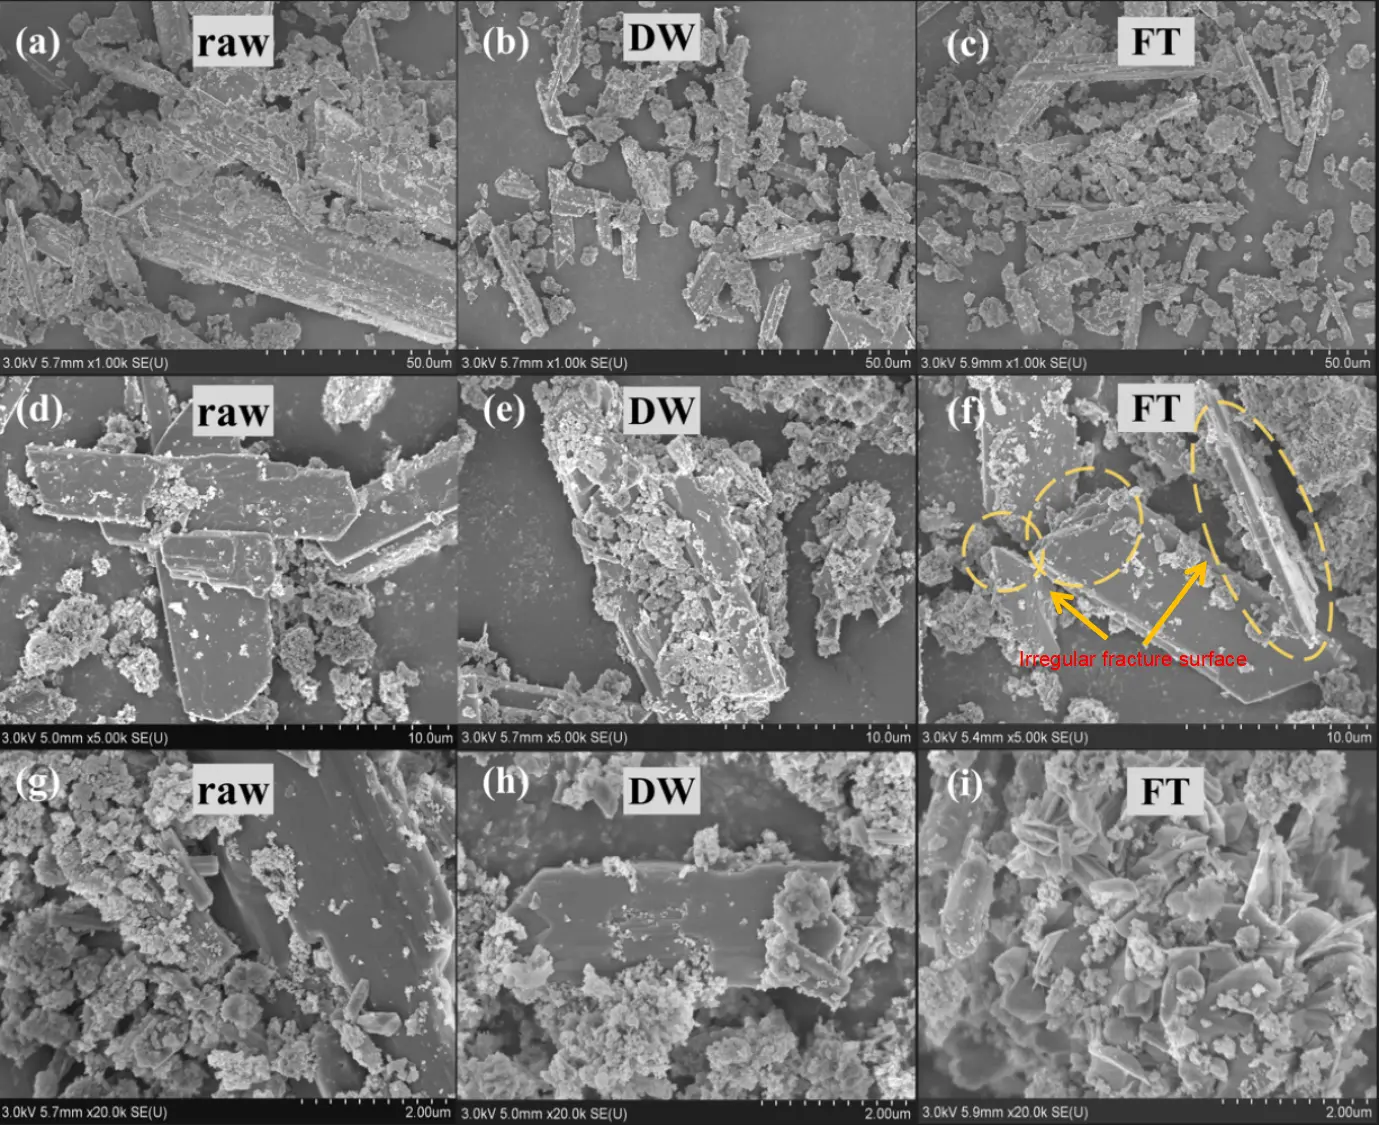
Figure 5. SEM images of CAR at different magnifications (50 μm, 10 μm, and 2 μm) after undergoing DW and FT cycles. (a,d,g): Raw CAR; (b,e,h): CAR after 28 cycles of DW; (c,f,i): CAR after 28 cycles of FT.
3.3.3. FTIR Analysis
Figure 6 presents the FTIR spectra of CAR subjected to 28 cycles of DW and FT. For untreated CAR, characteristic absorption bands were observed at 3404.14 cm−1 and 1621.93 cm−1, corresponding to O–H stretching and bending vibrations of crystalline water in CaSO4·2H2O [53,54]. The peaks at 1118.18 cm−1, 668.64 cm−1, and 601.77 cm−1 were attributed to S–O stretching vibrations of SO42− [55,56,57]. Absorption bands at 1687.22 cm−1 and 1413.00 cm−1 indicated the presence of C=O bonds, likely associated with carbonate complexes [58,59]. The peak at 874.107 cm−1 represented asymmetric stretching of CaCO3 [60], while bands at 794.25 cm−1 and 820.04 cm−1 were assigned to As(III)–O and As(V)–O stretching vibrations, respectively [61]. Zn–O stretching vibration was identified at 427.81 cm−1 [62].
Under DW cycles (Figure 6a), the O–H stretching band at 3405 cm−1 and bending vibration at 1622 cm−1 gradually weakened with increasing cycles, suggesting structural reorganization of gypsum and reduced water retention. The S–O stretching bands (1118 cm−1, 668 cm−1, 601 cm−1) exhibited peak shifts, indicative of SO42− complexation with metal ions such as Na⁺, K⁺, and Zn2+. The C=O bands (1687 cm−1, 1410 cm−1) shifted dynamically, reflecting active participation of carbonate groups in DW-driven reactions. Concurrently, the CaCO3 peak at 875 cm−1 intensified, corroborating XRD-detected calcite formation. Notably, the As(III)–O band (794 cm−1) attenuated, while the As(V)–O band (820 cm−1) strengthened, evidencing As(III) oxidation to As(V) [61]. The Zn–O band (427 cm−1) weakened and shifted, consistent with phase transformations of zinc oxides.
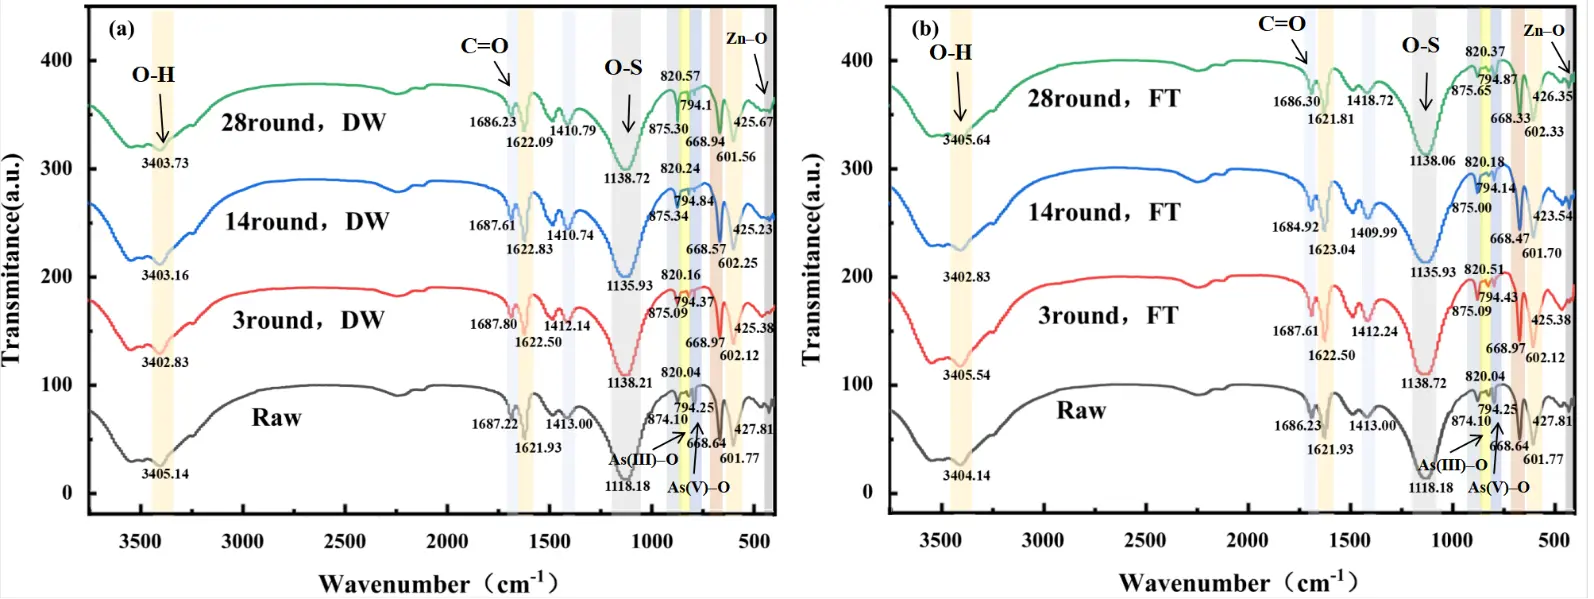
In contrast, FT cycles (Figure 6b) induced distinct spectral responses. While similar peak shifts occurred for gypsum, SO42−, and C=O groups, the As(III)–O and As(V)–O bands (794 cm−1, 820 cm−1) showed smaller intensity changes, and the Zn–O band (427 cm−1) remained stable, demonstrating suppressed arsenic and zinc transformations under low-temperature conditions. The CaCO3 peak at 875 cm−1 initially intensified during early cycles (1–14) due to ice-mediated carbonate precipitation but subsequently weakened (14–28 cycles) as structural damage from repeated freezing disrupted calcite crystallinity, aligning with XRD observations. These results show the mechanisms of DW induced chemical oxidation and FT mediated physical stabilization in altering CAR molecular structure.
3.3.4. XPS Analysis
Figure 7 illustrates the chemical state evolution of As, Zn, and Cd in CAR under DW and FT cycles. In raw CAR, arsenic existed as a mixture of As(III) and As(V), with As 3d5/2 binding energies at 44.61 eV (54.32%) and 45.31 eV (45.68%), respectively (Figure 7a), indicative of the metastable structure of calcium arsenate minerals (Ca3(AsO4)2) [14]. After 28 DW cycles, the As(III) proportion declined to 36.27% (44.12 eV), while As(V) increased to 63.73% (45.14 eV) (Figure 7m), driven by oxidative conditions (Eh > 140 mV) and enhanced aqueous-phase transport [63]. Supersaturation during drying likely promoted As(III) oxidation, whereas bicarbonate-mediated ligand exchange facilitated the dissolution of As(V) species [14,64]. Under FT cycles, As(III) only decreased to 39.66% (Figure 7g), indicating limited oxidation due to reduced reaction kinetics and oxygen diffusion through ice.
The Zn 2p spectra display typical spin–orbit splitting, with Zn 2p3/2 and Zn 2p1/2 peaks at ~1022.1 and ~1045.1 eV, respectively, exhibiting a constant energy separation of ~23 eV and an area ratio of ~2:1. Therefore, the chemical state analysis was based on the Zn 2p3/2 peak. In raw CAR, Zn primarily existed as ZnCO3 (1021.91 eV, 48.93%) and ZnO (1022.83 eV, 28.48%) (Figure 7b) [65,66]. After 28 FT cycles, ZnS (1023.65 eV) decreased from 8.61% to 4.65%, while ZnO increased to 36.58% (Figure 7h), attributed to ZnS oxidation and freezing-induced dehydration of Zn(OH)2 (1021.34 eV). Transient signals at ~1047–1048 eV reflect hindered Zn(OH)2 to ZnO transitions under low-temperature kinetics [67]. DW cycles promoted direct conversion of Zn(OH)2 to ZnO (38.48% at 28 cycles) without intermediate species (Figure 7n), indicating the facilitating role of proton-mediated transport.
The Cd 3d spectra also exhibit spin–orbit splitting, with Cd 3d5/2 and Cd 3d3/2 peaks at ~405.1 and ~411.8 eV, respectively, separated by ~6.7 eV with a 3:2 area ratio. Cd chemical state interpretations were based on Cd 3d5/2 binding energies. In raw CAR, CdCO3 (405.47 eV, 26.98%) and CdO (405.88 eV, 38.25%) were dominant species [68,69] (Figure 7c). DW cycles sharply reduced CdS (405.92 eV) from 18.51% to 3.43% and increased CdCO3 to 30.88% (Figure 7o), due to sequential oxidation-carbonation reactions. FT cycles led to a smaller CdCO3 increase (27.91%, Figure 7i), reflecting slower bicarbonate diffusion and carbonation. Both DW and FT treatments resulted in increased Cd(OH)2 contents (DW: 26.98%; FT: 26.76%), likely due to pH-induced CdCO3 dissolution and hydroxide precipitation during late-cycle oscillations.
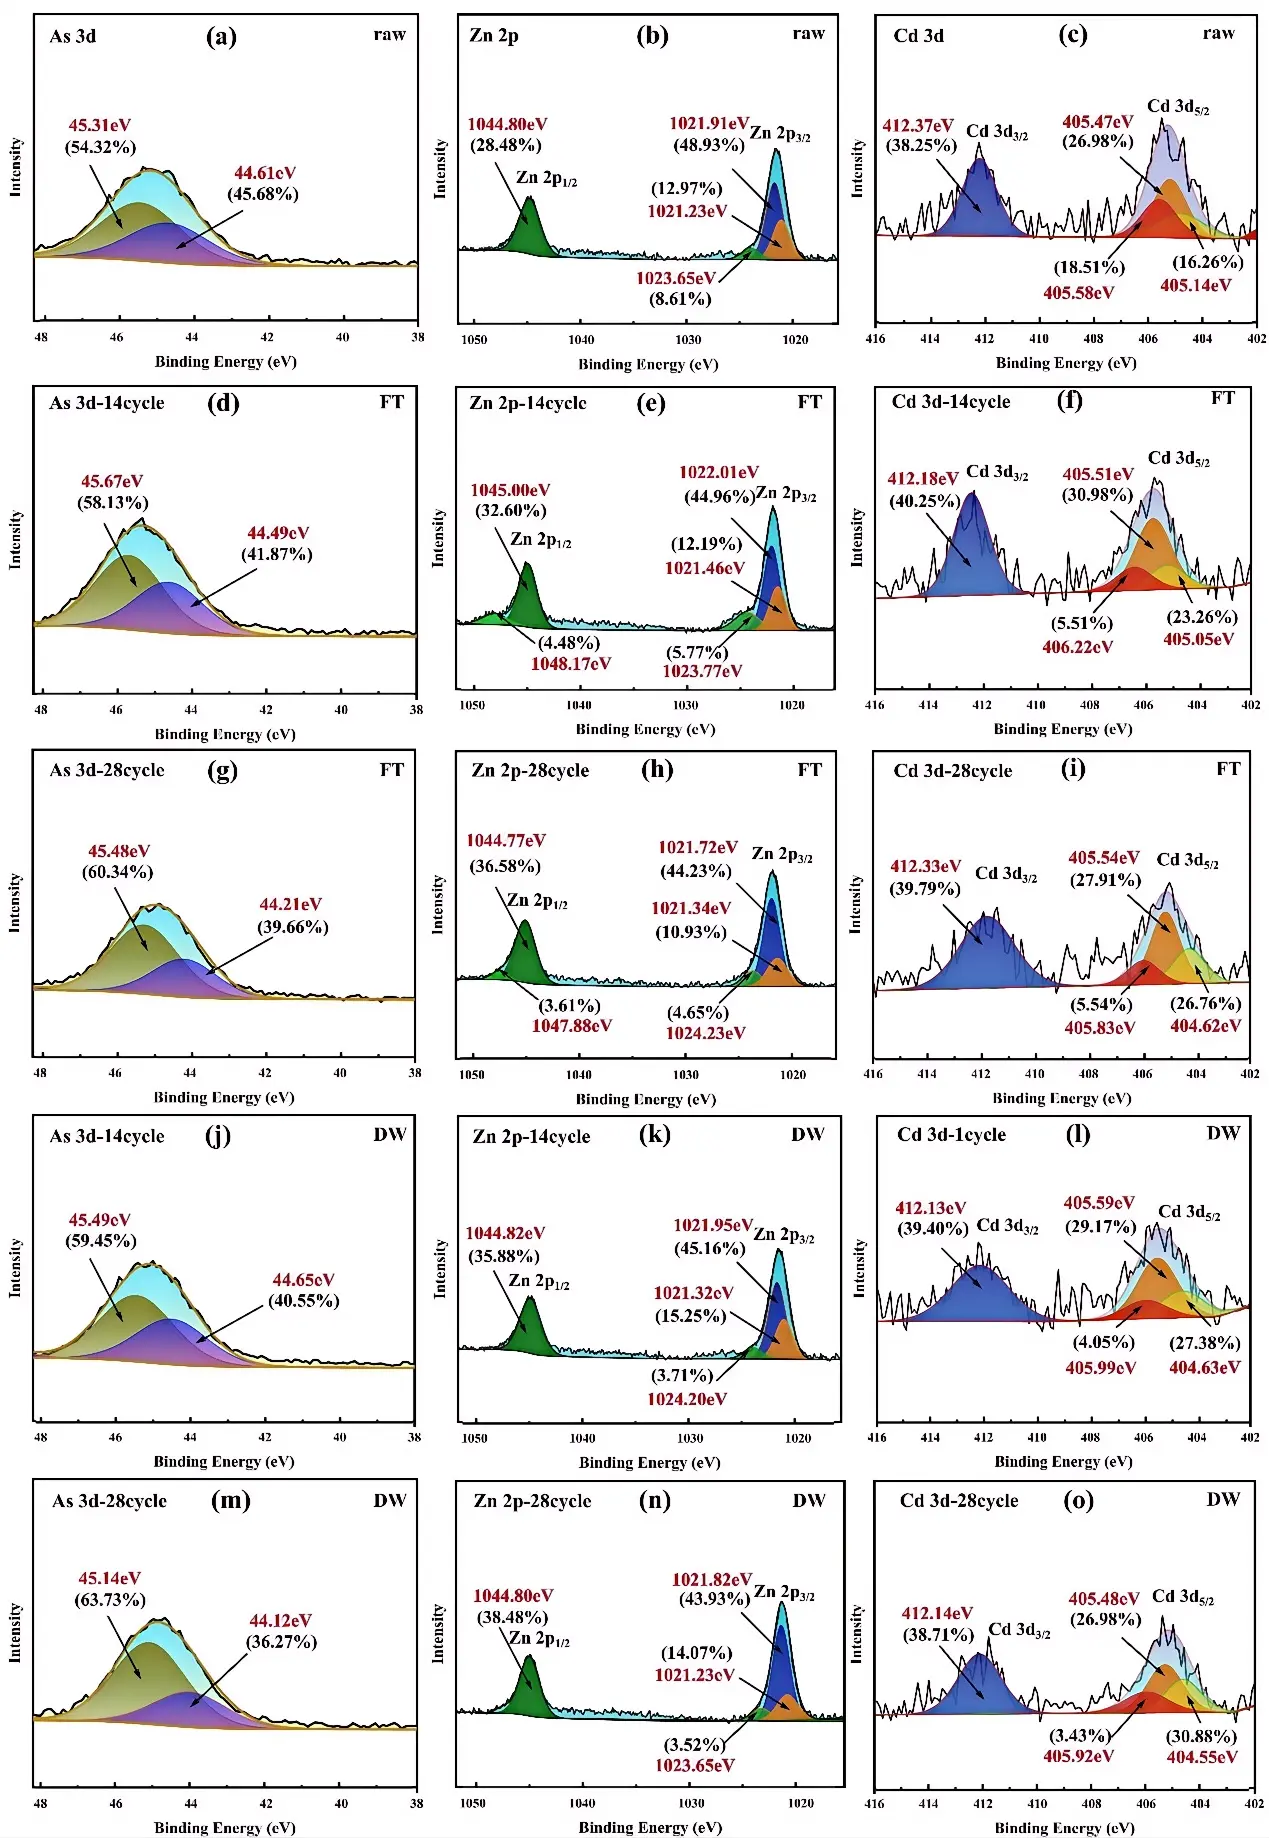
Figure 7. XPS spectra of CAR after 28 cycles of DW and FT: pristine samples: (a) As 3d, (b) Zn 2p, (c) Cd 3d; FT: (d) As 3d 14 cycles, (e) Zn 2p 14 cycles, (f) Cd 3d 14 cycles, (g) As 3d 28 cycles, (h) Zn 2p 28 cycles, (i) Cd 3d 28 cycles; DW: (j) As 3d 14 cycles, (k) Zn 2p 14 cycles, (l) Cd 3d 14 cycles, (m) As 3d 28 cycles, (n) Zn 2p 28 cycles, (o) Cd 3d 28 cycles.
3.4. Comprehensive Environmental Risk Assessment
3.4.1. Potential Ecological Risk Evaluation
Table S4 illustrates the application of the IPER proposed by HAKANSON to assess the ecological risk of CAR after DW and FT cycles. Results indicated that As and Cd in CAR posed extreme ecological risks, while Zn exhibited high ecological risk, as categorized by Hakanson index, with As and Cd showing higher risk scores due to their toxicity and environmental persistence. Following DW and FT cycles, the integrated IPER values increased from 10,229.51 (raw CAR) to 11,187.85 (DW) and 10,668.29 (FT), representing increments of 8.56% and 4.11%, respectively. Both cycles raised the overall ecological risk level to “severe risk”. Arsenic dominated the risk contribution, accounting for 80.14% (DW) and 80.19% (FT) of the total IPER, which can be attributed to its high toxicity and the potential for increased leaching under both DW and FT conditions. Continued cycling of DW and FT would further amplify the integrated ecological risks, showing the necessity for stringent management measures, such as containment, stabilization, or remediation techniques, to minimize environmental exposure and mitigate long-term impacts.
3.4.2. Risk Assessment Code (RAC)
Figure 8 presents the RAC values of As, Zn, and Cd in CAR after undergoing DW and FT cycles. For As, the initial RAC value (6.35%) indicated low environmental risk. Under DW cycles, As risk escalated progressively, reaching 10.48% (moderate risk) after just 3 cycles. FT cycles temporarily mitigated As release due to ice encapsulation, maintaining RAC below 8.43% (low risk) until 14 cycles. However, prolonged FT cycles induced particle expansion-contraction stresses, destabilizing arsenic-bearing mineral lattices [70], ultimately improving RAC to 11.86% (moderate risk) at 28 cycles (Figure 8a). The initial value of Zn (12.46%) is at a moderate risk level, and regardless of whether it undergoes DW or FT, its environmental risk continues to rise. After 28 cycles, the RAC values for Zn reach 18.63% and 16.59%, respectively (Figure 8b). Notably, the increase in Zn RAC is higher than that of As, indicating its lower mineral binding stability. Cd (11.25%) shows a similar trend in environmental risk as Zn after DW and FT cycles. After 28 cycles, its RAC values increase to 19.67% and 15.23%, respectively, indicating a moderate risk level (Figure 8c). Overall, neglecting the effects of DW and FT cycles during CAR treatment and disposal will lead to a continuous increase in environmental risk, complicating the treatment and disposal process.
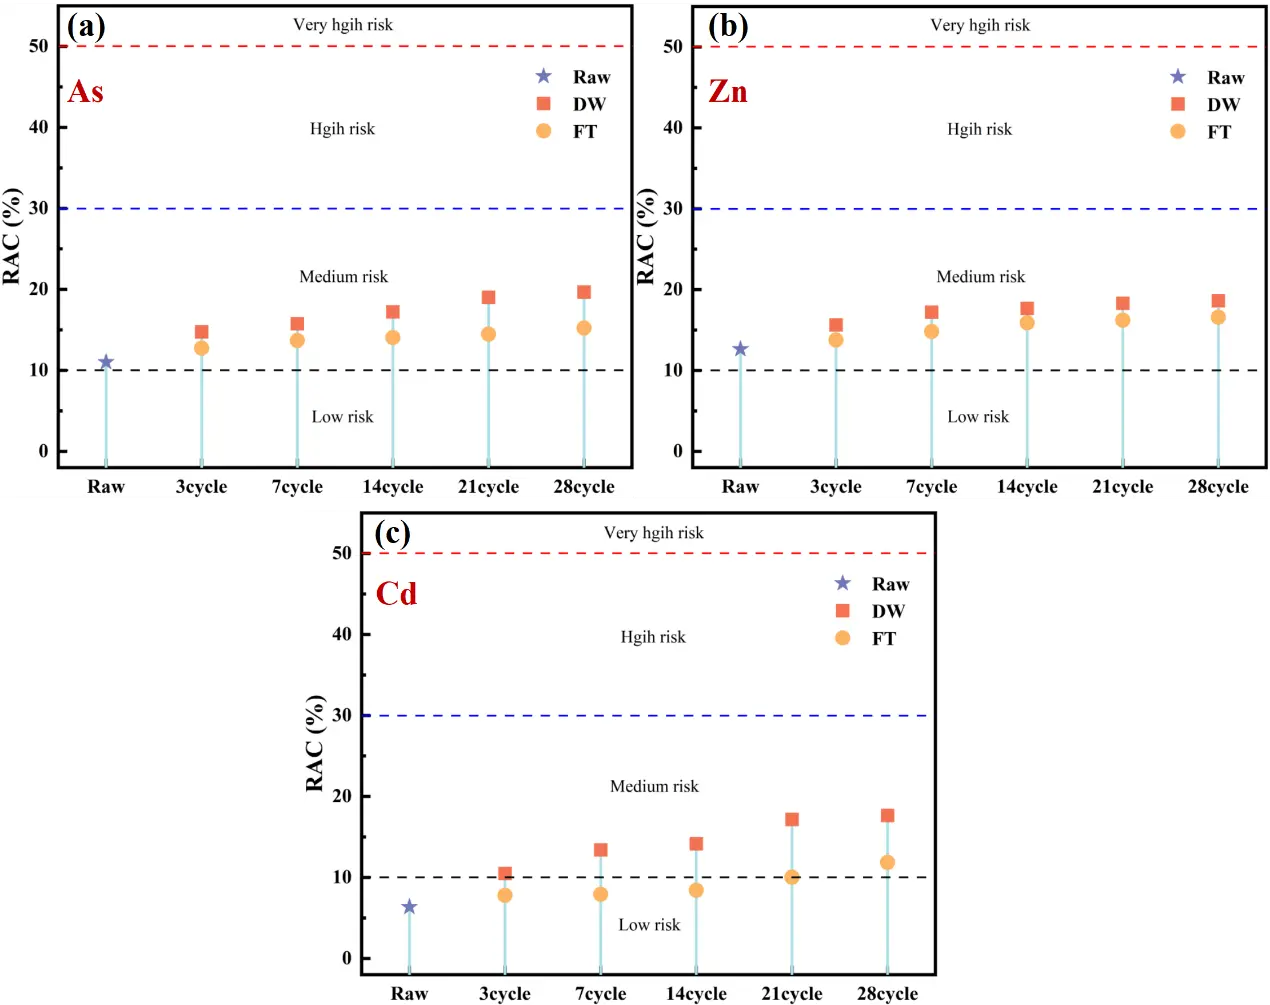
Figure 8. RAC values for toxic elements in CAR after 28 cycles of DW and FT cycles: (a) As; (b) Zn; (c) Cd.
3.5. Simulation of Multi Year Aging Processes
The 28 cycles of DW and FT in this study were designed to simulate a 28-year natural aging process of CAR. As indicated by the TCLP test results (Figure 2), the leaching concentrations of As, Zn, and Cd showed consistent upward trends over time, confirming the progressive accumulation of environmental risks. These results align with the ecological risk assessments discussed earlier, demonstrating an increased long-term threat posed by toxic elements.
For As, Zn, and Cd, the exponential and Weibull models for a 28-year accelerated aging process under DW and FT cycles are presented in Figures 9 and S3. The Weibull model, with superior confidence intervals, better captures the dynamics of aging, confirming cumulative toxic metal release over time.
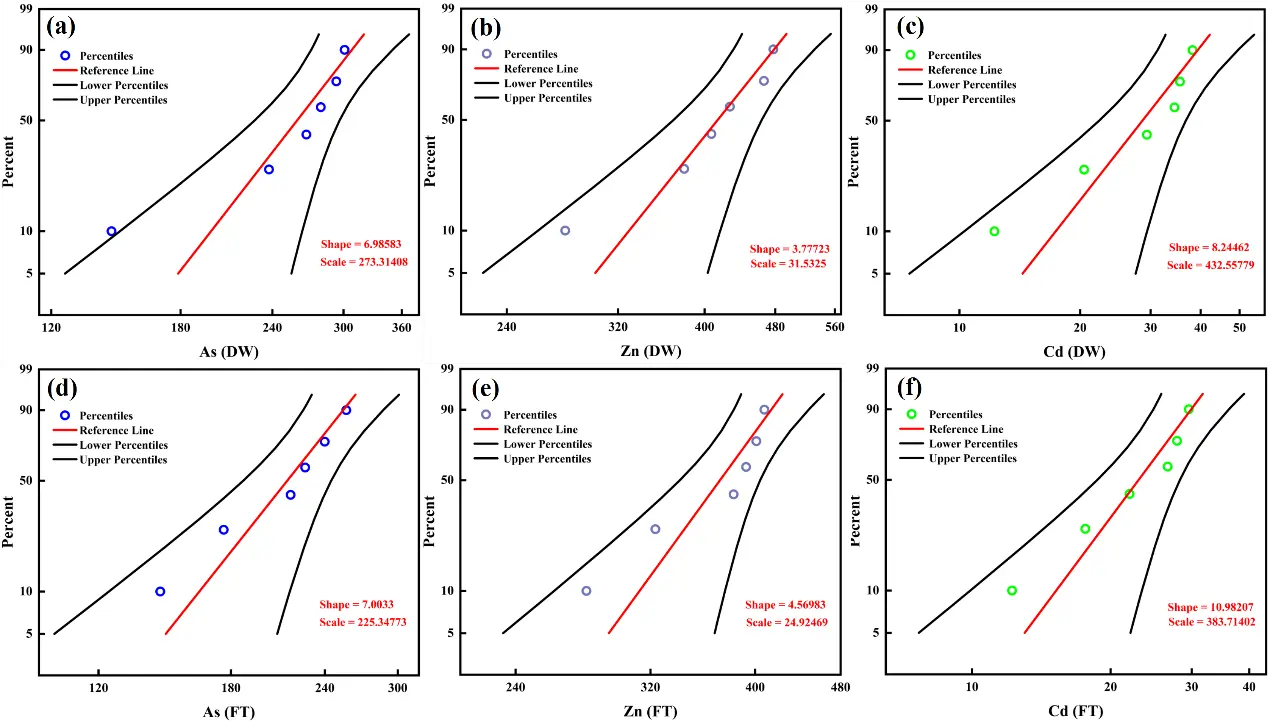
Figure 9. Weibull model of toxic elements in CAR under accelerated aging conditions for 28 years, subjected to DW and FT cycles. DW: (a) As, (b) Zn, (c) Cd; FT: (d) As, (e) Zn, (f) Cd.
Following DW and FT cycles, the α values for As are 6.98 and 7.00, for Zn are 3.78 and 4.57, and for Cd are 8.24 and 10.98, respectively. This indicates that DW cycles are more conducive to promoting structural degradation in CAR due to factors such as enhanced evaporation and oxidative processes, resulting in faster aging rates. In contrast, FT cycles, influenced by freezing and low temperatures, retard structural changes and thus result in slower aging. However, over the course of 28 years, the aging rates increase more significantly under FT conditions due to repeated freeze-thaw stress, albeit at a slower initial pace. After 28 years, the aging rates of toxic elements, in descending order, are Cd > As > Zn, while the reliability of metal binding remains above 0.90.
4. Conclusions
This study reveals divergent mechanisms by which dry-wet (DW) and freeze-thaw (FT) cycles affect the long-term stability of calcium arsenic residue (CAR). DW cycles intensify toxic metal release via carbonation-driven lattice disruption, acidification, and oxidation, significantly increasing the bioavailability and ecological risk of As, Zn, and Cd. In contrast, FT cycles partially mitigate these effects through freeze-induced immobilization and reduced ion migration. Risk assessments confirm a notable escalation under both conditions, with As as the dominant contributor. The Weibull reliability model demonstrates superior prediction of climate-dependent aging dynamics compared to traditional exponential models. These findings highlight the importance of climate-resilient stabilization strategies that suppress oxidation and control ion transport. Field-scale validation in semi-arid and cold regions is recommended. The proposed “mineral evolution–interface reaction–risk assessment” framework provides a quantitative basis for forecasting residue behavior under climate-driven stress, supporting sustainable management of arsenic-bearing wastes.
Supplementary Materials
The following supporting information can be found at: https://www.sciepublish.com/article/pii/720, Figure S1: The impacts of DW and FT on CAR particle size distribution and cumulative curves: (a,d) raw sample; (b,e) DW; (c,f) FT; Figure S2: Variations in the concentrations of bioavailable As, Zn, and Cd in CAR after 1 to 28 cycles of DW and FT cycling; Figure S3: Exponential model of heavy metals in CAR under accelerated aging conditions for 28 years, subjected to DW and FT cycles. DW: (a) As, (b) Zn, (c) Cd; FT: (d) As, (e) Zn, (f) Cd; Table S1: Major elemental composition of CAR; Table S2: Toxicity impact factors in the Potential Ecological Risk Index (IPER) methodology; Table S3: Risk level evaluation of heavy metal pollution by $$ {E}_{r}^{i} $$ and IPER; Table S4: Potential Ecological Risk Values of CAR after DW and FT Cycles.
Author Contributions
X.Z.: Conceptualization, Methodology, Software, Investigation, Writing—Original Draft. G.W.: Methodology, Data Curation. Y.D.: Supervision, Data Curation, Formal analysis. Z.Z.: Writing—Review & Editing, Validation, M.R.: Writing—Review & Editing. D.D.: Visualization, Writing—Review & Editing, Supervision, Data Curation.
Ethics Statement
Not applicable.
Informed Consent Statement
Not applicable.
Data Availability Statement
The authors confirm that the data supporting the findings of this study are available within the article or its supplementary materials.
Funding
This research was supported by the major innovation projects of Hubei province of China (Project No. 2019ACA156).
Declaration of Competing Interest
The authors declare that they have no known competing financial interests or personal relationships that could have appeared to influence the work reported in this paper.
References
- Du Y, Du Y, Ma W, Zhao X, Ma M, Cao L, et al. Application of dirty-acid wastewater treatment technology in non-ferrous metal smelting industry: Retrospect and prospect. J. Environ. Manag. 2024, 352, 120050. [Google Scholar]
- Liao T, Xi Y, Zhang L, Li J, Cui K. Removal of toxic arsenic (As (III)) from industrial wastewater by ultrasonic enhanced zero-valent lead combined with CuSO4. J. Hazard. Mater. 2021, 408, 124464. [Google Scholar]
- Wang J, Chen C. The current status of heavy metal pollution and treatment technology development in China. Environ. Technol. Rev. 2015, 4, 39–53. [Google Scholar]
- Wang J, Liu J, Peng X, He M, Hu X, Zhao J, et al. Reductive removal of As (V) and As (III) from aqueous solution by the UV/sulfite process: Recovery of elemental arsenic. Water Res. 2022, 223, 118981. [Google Scholar]
- Du Y, Zhao X, Xu Y, Ma W, Wang G, Zhao Z, et al. Innovative hydrogen sulfide generation from natural pyrrhotite: A green solution for acid wastewater treatment with resource recovery benefits. Process Saf. Environ. Prot. 2024, 194, 96–106. [Google Scholar]
- Xu L, Zheng Y, Zhao Y, Chen W. Recovery of arsenic oxide, harmless gypsum residue and clean water by lime neutralization and precipitation. Hydrometallurgy 2023, 215, 105996. [Google Scholar]
- Tenodi KZ, Tenodi S, Nikić J, Mohora E, Agbaba J, Rončević S. Optimizing arsenic removal from groundwater using continuous flow electrocoagulation with iron and aluminum electrodes: An experimental and modeling approach. J. Water Process Eng. 2024, 66, 106082. [Google Scholar]
- Nguyen DA, Nguyen DV, Jeong G, Asghar N, Jang A. Critical evaluation of hybrid metal–organic framework composites for efficient treatment of arsenic–contaminated solutions by adsorption and membrane–separation process. Chem. Eng. J. 2023, 461, 141789. [Google Scholar]
- Maity JP, Chen CY, Bhattacharya P, Sharma RK, Ahmad A, Patnaik S, et al. Advanced application of nano-technological and biological processes as well as mitigation options for arsenic removal. J. Hazard. Mater. 2021, 405, 123885. [Google Scholar]
- Jiang H, Zheng J, Fu Y, Wang Z, Yilmaz E, Cui L. Slag-based stabilization/solidification of hazardous arsenic-bearing tailings as cemented paste backfill: Strength and arsenic immobilization assessment. Case Stud. Constr. Mater. 2024, 20, e03002. [Google Scholar]
- Rahidul Hassan H. A review on different arsenic removal techniques used for decontamination of drinking water. Environ. Pollut. Bioavailab. 2023, 35, 2165964. [Google Scholar]
- Bhowmik T, Sarkar S, Bhattacharya A, Mukherjee A. A review of arsenic mitigation strategies in community water supplies with insights from South Asia: Options, opportunities and constraints. Environ. Sci. Water Res. Technol. 2022, 8, 2491–2520. [Google Scholar]
- Chu T, Zhang Y, Kong L, Li K, Zhao Z, Xu L, et al. Controllable H2S supply via membrane contactors for safe and efficient arsenic precipitation from acidic wastewater. J. Hazard. Mater. 2024, 480, 136251. [Google Scholar]
- Zhao X, Ma M, Du Y, Ma W, Wang G, Du D. Mineralogical insights into anion and cation dissolution behavior in calcium arsenic residue from copper smelting: Implications for safe disposal. J. Environ. Chem. Eng. 2024, 12, 113407. [Google Scholar]
- Ma X, Yuan Z, Zhang G, Zhang J, Wang X, Wang S, et al. Alternative Method for the Treatment of Hydrometallurgical Arsenic–Calcium Residues: The Immobilization of Arsenic as Scorodite. ACS Omega 2020, 5, 12979–12988. [Google Scholar]
- Wang X, Wang L, Chen J. Stabilization/solidification of metallurgical solid wastes. In Low Carbon Stabilization and Solidification of Hazardous Wastes; Elsevier: Amsterdam, The Netherlands, 2022; pp. 243–257. [Google Scholar]
- Khatun J, Intekhab A, Dhak DJT. Effect of uncontrolled fertilization and heavy metal toxicity associated with arsenic (As), lead (Pb) and cadmium (Cd), and possible remediation. Toxicology 2022, 477, 153274. [Google Scholar]
- Lv H, Ji C, Ding J, Yu L, Cai H. High levels of zinc affect nitrogen and phosphorus transformation in rice rhizosphere soil by modifying microbial communities. Plants 2022, 11, 2271. [Google Scholar]
- Martínez-Villegas N, Briones-Gallardo R, Ramos-Leal JA, Avalos-Borja M, Castañón-Sandoval AD, Razo-Flores E, et al. Arsenic mobility controlled by solid calcium arsenates: A case study in Mexico showcasing a potentially widespread environmental problem. Environ. Pollut. 2013, 176, 114–122. [Google Scholar]
- Chakraborti D, Rahman MM, Mukherjee A, Alauddin M, Hassan M, Dutta RN, et al. Groundwater arsenic contamination in Bangladesh—21 Years of research. J. Trace Elem. Med. Biol. 2015, 31, 237–248. [Google Scholar]
- Uddin R, Huda N. Arsenic Poisoning in Bangladesh. Oman Med. J. 2011, 26, 207. [Google Scholar]
- Fei J, Ma J, Yang J, Liang Y, Ke Y, Yao L, et al. Effect of simulated acid rain on stability of arsenic calcium residue in residue field. Environ. Geochem. Health 2020, 42, 769–780. [Google Scholar]
- Zhang D, Wang S, Wang Y, Gomez MA, Jia Y. The long-term stability of calcium arsenates: Implications for phase transformation and arsenic mobilization. J. Environ. Sci. 2019, 84, 29–41. [Google Scholar]
- Mahandra H, Wu C, Ghahreman A. Leaching characteristics and stability assessment of sequestered arsenic in flue dust based glass. Chemosphere 2021, 276, 130173. [Google Scholar]
- Wang YY, He ZT, Tang JY, Sun Z, Xu H, Du J, et al. Long-term environmental stability and heavy metals release mechanism of desulfurized gypsum sludge from copper smelter. J. Cent. South Univ. (Sci. Technol.) 2023, 54, 562–576. [Google Scholar]
- Naisse C, Girardin C, Lefevre R, Pozzi A, Maas R, Stark A, et al. Effect of physical weathering on the carbon sequestration potential of biochars and hydrochars in soil. Gcb Bioenergy 2014, 7, 488–496. [Google Scholar]
- Bing H, He P, Zhang Y. Cyclic freeze–thaw as a mechanism for water and salt migration in soil. Environ. Earth Sci. 2015, 74, 675–681. [Google Scholar]
- Khan YK, Shah MH. Sequential extraction of selected metals to assess their mobility, pollution status and health risk in roadside soil. Environ. Monit. Assess. 2023, 195, 552. [Google Scholar]
- Zhang Z, Cai W, Hu Y, Yang K, Zheng Y, Fang C, et al. Ecological Risk Assessment and Influencing Factors of Heavy-Metal Leaching from Coal-Based Solid Waste Fly Ash. Front. Chem. 2022, 10, 932133. [Google Scholar]
- Hakanson L. An ecological risk index for aquatic pollution control. A sedimentological approach. Water Res. 1980, 14, 975–1001. [Google Scholar]
- Xiang M, Li Y, Yang J, Lei K, Li Y, Li F. Heavy metal contamination risk assessment and correlation analysis of heavy metal contents in soil and crops. Environ. Pollut. 2021, 278, 116911. [Google Scholar]
- Du M, Liu H, Hu D, Huang J, Liu Z, Fang Y. The leaching mechanism of heavy metals (Ni, Cd, As) in a gasification slag during acidification. Waste Manag. 2020, 114, 17–24. [Google Scholar]
- Verma A, Yadav S. Chemical Speciation and Risk Assessment of Metals in Surface Dust and Top Soil Samples Collected from Bhiwadi Industrial Cluster (BIC), Rajasthan, India. In AGU Fall Meeting Abstracts; vol. 2021, pp. B45M-1785. 2021. [Google Scholar]
- Li W, Sun Y, Huang Y, Shimaoka T, Wang H, Wang YN, et al. Evaluation of chemical speciation and environmental risk levels of heavy metals during varied acid corrosion conditions for raw and solidified/stabilized MSWI fly ash. Waste Manag. 2019, 87, 407–416. [Google Scholar]
- Shen Z, Hou D, Xu W, Zhang J, Jin F, Zhao B, et al. Assessing long-term stability of cadmium and lead in a soil washing residue amended with MgO-based binders using quantitative accelerated ageing. Sci. Total Environ. 2018, 643, 1571–1578. [Google Scholar]
- Wang L, Li X, Tsang DC, Jin F, Hou D. Green remediation of Cd and Hg contaminated soil using humic acid modified montmorillonite: Immobilization performance under accelerated ageing conditions. J. Hazard. Mater. 2020, 387, 122005. [Google Scholar]
- Zhang Y, Liu X, Li P, Xiao L, Zhou S, Wang X, Critical factors in soil organic carbon mineralization induced by drying, wetting and wet-dry cycles in a typical watershed of Loess Plateau. J. Environ. Manag. 2024, 362, 121313. [Google Scholar]
- Yang Z, Wang Y, Li X, Ren S, Xu H, Chang J. The effect of long-term freeze-thaw cycles on the stabilization of lead in compound solidified/stabilized lead-contaminated soil. Environ. Sci. Pollut. Res. 2021, 28, 37413–37423. [Google Scholar]
- Safa M, Goodarzi AR, Lorestani B. Enhanced post freeze-thaw stability of Zn/Pb co-contaminated soil through MgO-activated steel slag and fiber treatment. Cold Reg. Sci. Technol. 2023, 210, 103826. [Google Scholar]
- He Z, Zhang R, Sha A, Zuo Q, Xu Z, Wu M, et al. Anti-swelling mechanism of DMDACC on weathered crust elution-deposited rare earth ore. J. Rare Earths 2022, 40, 1803–1811. [Google Scholar]
- Zhao J, Li S. Study on processability, compressive strength, drying shrinkage and evolution mechanisms of microstructures of alkali-activated slag-glass powder cementitious material. Constr. Build. Mater. 2022, 344, 128196. [Google Scholar]
- Wang Z, Shui Z, Sun T, Li H, Chi H, Ouyang G, et al. Effect of MgO and superfine slag modification on the carbonation resistance of phosphogypsum-based cementitious materials: Based on hydration enhancement and phase evolution regulation. Constr. Build. Mater. 2024, 415, 134914. [Google Scholar]
- Wang R, Zhang Q, Li Y. Deterioration of concrete under the coupling effects of freeze–thaw cycles and other actions: A review. Constr. Build. Mater. 2022, 319, 126045. [Google Scholar]
- Kumaragamage, D.; Warren, C. J.;Spiers, G. Soil Chemistry. Digging into Canadian Soils: An Introduction to Soil Science; Canadian Society of Soil Science, 2021.. [Google Scholar]
- ong L, Ji J, Yang J, Qian X, Li X, Wang H, et al. Sludge-based ceramsite for environmental remediation and architecture ingredients. J. Clean. Prod. 2024, 448, 141556. [Google Scholar]
- Yao M, Wang Q, Ma B, Liu Y, Yu Q, Han Y. Effect of Freeze-Thaw Cycle on Shear Strength of Lime-Solidified Dispersion Soils. Civ. Eng. J. 2020, 6, 114–129. [Google Scholar]
- Huang M, Zhou M, Li Z, Ding X, Wen J, Jin C, Wang L, et al. How do drying-wetting cycles influence availability of heavy metals in sediment? A perspective from DOM molecular composition. Water Res. 2022, 220, 118671. [Google Scholar]
- He Y, Chen X, Peng Y, Luo ZB, Jiang SF, Jiang H. Investigation of the effects of biochar amendment on soil under freeze-thaw cycles and the underlying mechanism. Heliyon 2024, 10, e34907. [Google Scholar]
- Li Q, Wang Y, Li Y, Li L, Tang M, Hu W, et al. Speciation of heavy metals in soils and their immobilization at micro-scale interfaces among diverse soil components. Sci. Total Environ. 2022, 825, 153862. [Google Scholar]
- Wu L, Du W, Wang L, Cao Y, Lv J. Effects of freeze-thaw leaching on physicochemical properties and cadmium transformation in cadmium contaminated soil. Ecotoxicol. Environ. Saf. 2024, 284, 116935. [Google Scholar]
- Xie C, Cao M, Yin H, Guan J, Wang L. Effects of freeze-thaw damage on fracture properties and microstructure of hybrid fibers reinforced cementitious composites containing calcium carbonate whisker. Constr. Build. Mater. 2021, 300, 123872. [Google Scholar]
- Lv J, Zuo W, Tian C, Wang M, Liao Q, Lin Z. Freeze-accelerated reactions on environmental relevant processes. Cell Rep. Phys. Sci. 2023, 4, 101456. [Google Scholar]
- Zouaouid K, Gheriani R. Mineralogical Analysis of Sand Roses and Sand Dunes Samples from Two Regions of South Algeria. Silicon 2019, 11, 1537–1545. [Google Scholar]
- Shao S, Ma B, Chen Y, Zhang W, Wang C. Behavior and mechanism of fluoride removal from aqueous solutions by using synthesized CaSO4·2H2O nanorods. Chem. Eng. J. 2021, 426, 131364. [Google Scholar]
- Xiong H , Liu Y, Wang S, Zhu S. Schwertmannite and akaganeite for adsorption removals of Cr(VI) from aqueous solutions. Environ. Sci. Pollut. Res. 2023, 30, 62295–62311. [Google Scholar]
- Morebodi KB, Reddy L, Balakrishna A, Erasmus LJ, Swart HC, Masiteng PL. Investigation of photoluminescence properties and energy transfer in Sm3+ and Eu3+ co-doped Na2Ca(SO4)2 nanophosphors prepared by combustion technique. Solid State Sci. 2022, 134, 107059. [Google Scholar]
- Lin S, Tian Y, Zhang W, Zhao T, Zhao M, Wang H. Enhanced photocatalytic activity over ZnO supported on calcium sulfate whisker derived from desulfurization gypsum. Korean J. Chem. Eng. 2022, 39, 3267–3276. [Google Scholar]
- Suzuki K, Katayama K, Sumii Y, Nakagita T, Suno R, Tsujimoto H, et al. Vibrational analysis of acetylcholine binding to the M(2) receptor. RSC Adv. 2021, 11, 12559–12567. [Google Scholar]
- Tuan Mohamood NFA, Abdul Halim AH, Zainuddin N. Carboxymethyl Cellulose Hydrogel from Biomass Waste of Oil Palm Empty Fruit Bunch Using Calcium Chloride as Crosslinking Agent. Polymers 2021, 13, 4056. [Google Scholar]
- Kathyola TA, Willneff EA, Willis CJ, Dowding PJ, Schroeder SL. Reactive CaCO3 Formation from CO2 and Methanolic Ca(OH)2 Dispersions: Transient Methoxide Salts, Carbonate Esters and Sol-Gels. ACS Phys. Chem. Au 2024, 4, 555–567. [Google Scholar]
- Ma M, Xu X, Ha Z, Su Q, Lv C, Li J, et al. Deep insight on mechanism and contribution of arsenic removal and heavy metals remediation by mechanical activation phosphogypsum. Environ. Pollut. 2023, 336, 122258. [Google Scholar]
- Prabakaran K, Sufiyan KM, Kumar S, Jandas PJ, Manikandan VS, Thirumurugan A. Synthesis of zinc oxide and tin oxide (ZnO/SnO2) nanocomposite for photoanode applications in dye sensitized solar cell. J. Mater. Sci. Mater. Electron. 2024, 35, 1993. [Google Scholar]
- Chen M, Hu H, Chen M, Wang C, Wang Q, Zeng C, et al. In-situ production of iron flocculation and reactive oxygen species by electrochemically decomposing siderite: An innovative Fe-EC route to remove trivalent arsenic. J. Hazard. Mater. 2023, 441, 129884. [Google Scholar]
- Tyszka R, Pietranik A, Potysz A, Kierczak J, Schulz B. Experimental simulations of Zn Pb slag weathering and its impact on the environment: Effects of acid rain, soil solution, and microbial activity. J. Geochem. Explor. 2021, 228, 106808. [Google Scholar]
- Wang X, Zhou Y, Feng F, Guo Y, Hao Z, Lu C, et al. Synthesis of high photoreactive flower-like ZnO nanoneedles assembly with exposed nonpolar {1010} facets oriented by carbon spheres. Appl. Surf. Sci. 2022, 598, 153799. [Google Scholar]
- La Porta FD, Nogueira AE, Gracia L, Pereira WS, Botelho G, Mulinari TA, et al. An experimental and theoretical investigation on the optical and photocatalytic properties of ZnS nanoparticles. J. Phys. Chem. Solids 2017, 103, 179–189. [Google Scholar]
- Badawy AA, Ghanem AF, Yassin MA, Youssef AM, Rehim MH. Utilization and characterization of cellulose nanocrystals decorated with silver and zinc oxide nanoparticles for removal of lead ion from wastewater. Environ. Nanotechnol. Monit. Manag. 2021, 16, 100501. [Google Scholar]
- Vu MH, Nguyen CC, Sakar M, Do TO. Ni supported CdIn2S4 spongy-like spheres: A noble metal free high-performance sunlight driven photocatalyst for hydrogen production. Phys. Chem. Chem. Phys. 2017, 19, 29429–29437. [Google Scholar]
- Zhang P, Liu Y, Tian B, Luo Y, Zhang J. Synthesis of core-shell structured CdS@CeO2 and CdS@TiO2 composites and comparison of their photocatalytic activities for the selective oxidation of benzyl alcohol to benzaldehyde. Catal. Today 2017, 281, 181–188. [Google Scholar]
- Shen J, Wang Q, Chen Y, Han Y, Zhang X, Liu Y. Evolution process of the microstructure of saline soil with different compaction degrees during freeze-thaw cycles. Eng. Geol. 2022, 304, 106699. [Google Scholar]