1. Introduction
In response to the escalating global climate change and environmental concerns, nations worldwide are intensifying their focus on renewable energy sources to diminish reliance on fossil fuels [
1]. Photovoltaic (PV) power generation, recognized for its widespread applicability, high efficiency, and decreasing costs, has emerged as a pivotal pathway in the global energy transition and sustainable development initiatives [
2,
3]. The global installed capacity of PV power has demonstrated consistent growth in recent years, establishing itself as a primary energy source in numerous countries and steadily increasing its share of total power generation capacity [
4]. By the close of 2023, the global newly added PV capacity reached 346 GW. Within this, China's cumulative installed PV capacity stood at 609 GW, accounting for 21% of the nation’s total power generation capacity, thereby positioning PV as China’s second-largest power source [
5].
With the global trend of urbanization, the reliance of terrestrial solar PVs on land resources has led to bottlenecks in solar energy development. In response to this issue, floating PV technology has emerged as a new and promising solution [
6]. Floating PV stations are often exposed to harsh marine environments, where persistent high salt spray can form salt crystals (NaCl crystals) on the surface of PV modules. Additionally, high temperatures and humidity accelerate this salt corrosion process. This phenomenon reduces the transparency of the PV module surfaces, significantly decreasing their power generation efficiency [
7]. Additionally, it may increase the surface temperature of PV modules, affecting their thermal stability. Compared to other contaminants like bird droppings and dust, salt deposition on the surface of PV panels tends to form persistent solid deposits, which have a more enduring impact on their performance [
8]. Through literature review, it has been found that existing research on salt deposition on the surface of floating offshore PV modules primarily focuses on its impact on power generation efficiency, while studies on the identification and detection of salt deposition remain limited. Therefore, research on efficient cleaning of salt deposition from the surface of PV modules is of great significance for ensuring the efficiency of offshore PV power generation
Currently, cleaning of PV modules (on land) largely depends on manual operations, which offer simplicity and low cost advantages [
9]. However, floating offshore PV stations have higher costs, safety risks, and operational limitations associated with such methods [
10]. Given the drawbacks of traditional cleaning methods, there is an urgent need to establish a more efficient and intelligent cleaning system for floating offshore PV stations to enhance operational maintenance and extend equipment lifespan. The premise of intelligent cleaning is the automation of salt deposition detection. With the continuous development of computer vision technology, object detection techniques have been widely applied across various fields. Lu et al. utilized Haar features and cascade Haar classifiers for object detection and tracking in industrial automation systems [
11], Song et al. designed an improved monitoring network for dark red infrared ships based on Haar wavelet decomposition of high-frequency features [
12]. Shirpour et al. utilized a multi-scale Histogram of Oriented Gradients (HOG) model combination based on the driver's attention field for detecting traffic objects [
13]. However, the above-mentioned object detection techniques mostly rely on manual feature extraction, requiring high image quality and often lacking in extracting other features such as grayscale values and thresholds [
14]. Moreover, they are susceptible to external disturbances in complex environments, resulting in low recognition accuracy [
15]. In the detection of salt deposition on floating offshore PV systems, the quality of acquired images is greatly influenced by environmental conditions, exhibiting irregular shapes and unclear edges. To enhance detection accuracy, there is an urgent need for more advanced object detection algorithms. Deep learning-based object detection algorithms have been widely adopted in image recognition due to their ability to automatically learn features and achieve excellent generalization through large-scale data training [
16]. As an advanced instance segmentation method, Mask Region-based Convolutional Neural Network (Mask R-CNN) has been widely applied across various fields. Cao et al. successfully utilized a clustering algorithm based on Mask R-CNN instance segmentation network to achieve efficient segmentation of coal and shale [
17], Nam et al. improved lung segmentation accuracy and treatment precision using machine learning-based image segmentation techniques [
18], Compared to other deep learning models, this model exhibits significant advantages in recognition accuracy [
19].
Although these machine vision-based technologies have made significant advancements, applying Mask R-CNN to salt deposition detection on floating offshore PVs faces specific challenges. The grid lines on PV surfaces are coated in light colors for thermal management purposes [
20], the light-colored coating on the grid lines of PV surfaces creates optical characteristics highly similar to salt crystal deposition [
21]. This design leads to two main types of misclassification challenges for traditional Mask R-CNN models: Firstly, the regular geometric shapes of the grid lines are not effectively distinguished from the random deposition patterns of salt crystals, causing the model to mistakenly identify grid lines as salt deposits. Secondly, the specular reflection properties of the grid line coatings introduce glare and high-light noise in the images, severely affecting feature extraction. These issues result in low completeness of recognition images output during the segmentation and identification process when using Mask R-CNN with input images. There is a lack of in-depth research addressing these challenges in investigating and analyzing them. In addressing the above challenges, this study innovatively introduces semantic information, defined as adaptive thresholds determined through multi-dimensional feature analysis using deep learning models. By calculating optimal thresholds suitable for different local regions, these adaptive thresholds are regarded as prior semantic information for the model. They encompass rich image features and segmentation cues, providing reliable prior knowledge for subsequent network construction [
22]. Based on this, the study has designed an advanced deep neural network framework to address practical challenges in salt deposition recognition on offshore floating PV panels. This framework cleverly integrates the prior semantic information during the feature extraction stage.
The innovative design of this study significantly enhances the network model's ability to allocate attention and focus on critical target areas. This enables more precise differentiation between salt deposition on PV panel surfaces and interference factors such as grid lines in the background. This breakthrough method effectively improves the classification accuracy and resistance to interference of the detection algorithm, offering new insights and practical references for addressing complex technical challenges in the maintenance of offshore PV components.
The identification process framework proposed in this study has the following key contributions: it establishes a framework suitable for the accurate identification of salt deposition on PV module surfaces, which is used to mitigate the interference caused by surface grid lines during salt deposition identification and improve the accuracy of such identification. Additionally, the remaining structure of this paper is organized as follows: Section 2 elaborates on the methodology for identifying salt deposition on the surface of marine floating PV modules proposed in this study, covering three main aspects—first, introducing the process framework of this methodology; second, explaining the datasets involved in the study; and third, expounding on the core content of this paper, namely the semantic threshold enhancement method for improving recognition effectiveness. Section 3 focuses on verifying, through both experimental data and visualized images, the effectiveness of the methodology presented in Section 2 in increasing the probability of salt deposition recognition. Section 4 serves as the conclusion, summarizing the contributions of the proposed process framework to the construction of marine floating PV power plants, while also analyzing the existing deficiencies of this research and future improvement directions.
2. Proposed Methodology
2.1. Framework Overview
This study proposes a semantic information-guided recognition framework to tackle the unique challenges of salt crystallization detection on offshore floating PV modules—particularly the visual interference caused by surface grid lines. The methodology is structured into three sequential stages: (1) construction of a marine salt deposition dataset, (2) semantic thresholding for low-level feature enhancement, in the output, the red area represents the salt analysis zone, the green area represents the surface of the photovoltaic module, and the purple area represents the grid lines of the module, and (3) semantic-integrated salt detection via Mask R-CNN, as illustrated in . Each stage is designed to improve the model’s capacity for accurate and robust salt deposition recognition in complex marine environments.
. Framework for salt deposition recognition based on semantic information.
2.1.1. Part 1: Construction of Marine Salt Deposition Dataset
The first stage focuses on constructing a reliable and diverse marine salt deposition dataset, which serves as the foundation for the entire framework. Due to the limited availability and high acquisition cost of offshore on-site images, a comparison of on-site and custom datasets was performed, revealing that self-constructed images can effectively replicate the edge morphology and crystallization texture of real salt deposits. To obtain the dataset, a custom dataset capture frame was developed, comprising a mobile guide rail, a sliding imaging device, and a configurable camera module, enabling controlled image acquisition under various lighting conditions, viewing angles, and salt coverage scenarios. to further enrich the dataset, a series of augmentation operations—including trimming, rotation, and flipping—were applied to simulate diverse deposition patterns and improve the generalization ability of the detection model. Following dataset expansion, each image was manually annotated using labelme for annotation, ensuring pixel-level precision of salt deposition boundaries. this three-step process—obtaining, expanding, and annotating datasets—yields a well-balanced and high-quality dataset tailored to support accurate salt crystallization detection in real-world offshore applications.
2.1.2. Part 2: Semantic Thresholding for Low-Level Feature Enhancement
In the second stage, the emphasis shifts to enhancing image features that distinguish salt deposits from visually similar grid lines [
23,
24]. This is achieved through a semantic thresholding approach designed to amplify salt-specific visual cues while minimizing irrelevant background interference. Initially, a median filtering operation [
25] is applied to the raw images for smoothing, effectively suppressing noise and enhancing edge continuity [
26]. Subsequently, the preprocessed images are divided into local subregions, and Otsu’s algorithm is employed as the threshold determination method to compute optimal thresholds within each region. This adaptive thresholding process ensures more accurate separation of salt crystallization from grid structures. The resulting binary maps are then used to extract semantic information, guiding the model toward correct classification of salt regions. These semantic representations capture salt-specific patterns and textures, serving as enriched priors that effectively improve the model’s ability to recognize and isolate salt deposits in later stages.
2.1.3. Part 3: Semantic-Integrated Salt Detection via Mask R-CNN
The final stage integrates the semantic information generated from thresholding into an enhanced Mask R-CNN model to perform precise instance-level segmentation of salt deposits. A composite input is constructed by merging the original RGB image with the semantic binary map, forming a four-channel representation that combines both visual and semantic features. The Mask R-CNN architecture is adapted to accommodate this input structure, allowing the network to leverage semantic guidance during training. This integration significantly boosts the model’s performance, resulting in a notable improvement in segmentation recognition rate, especially in complex backgrounds where salt deposits are difficult to distinguish. A series of evaluation indicators for applications is used to assess practical performance. Experimental results confirm that the semantic-enhanced Mask R-CNN demonstrates superior robustness, generalization, and detection accuracy, validating the framework’s potential for deployment in intelligent offshore PV maintenance systems.
2.2. Construction of the Marine Salt Deposition Dataset
A complete and well-annotated dataset is essential for training robust and generalizable models for salt crystallization detection in offshore PV systems. The variability in salt morphology, lighting conditions, and background interference—such as grid lines—requires diverse and high-quality image data to ensure the detection model can adapt to real-world scenarios. In this study, the dataset construction process is grounded in practical engineering experience and motivated by real environmental conditions observed in operational marine PV installations. Specifically, this study is based on an actual marine engineering project—the TJUT-U2 floating PV power station, independently developed and deployed by our research team. During long-term operation of this offshore floating PV plant, periodic inspections were conducted using unmanned aerial vehicles (UAVs). The UAV-based visual monitoring system captured high-resolution images of PV modules under different operational and environmental states. These aerial images revealed significant instances of salt crystallization forming on the surfaces of PV panels, particularly along the lower edges and near areas of water splash exposure, as shown in .
. Salt precipitation on the surface of offshore PV modules.
Such salt accumulation directly affects the transmittance of sunlight and degrades the power generation efficiency of the PV modules [
27]. Over time, the presence of salt patches not only reduces system output but also accelerates surface wear and thermal imbalance, posing potential risks to the long-term reliability and maintenance cost of marine PV installations.
Despite the value of real UAV-acquired field images, several limitations make them unsuitable for direct use as a training dataset. First, the quantity of usable images is limited due to strict access conditions, weather constraints, and limited inspection intervals. Second, the diversity of salt morphology and camera perspectives is insufficient, as environmental parameters such as lighting, angle, and deposition extent are largely uncontrollable. Third, many images contain complex background noise, reflections, and occlusions that hinder precise annotation. These limitations result in datasets that are sparse, imbalanced, and suboptimal for deep learning training, thereby restricting the model's generalization performance.
To address these limitations and support the development of a robust salt detection framework, we constructed a customized salt deposition dataset that simulates field conditions while allowing controlled variability. A comparison of on-site datasets and custom datasets showed strong consistency in edge texture and crystallization morphology, as illustrated in , the red rectangular box in the figure provides a magnified view of the edge textures and crystalline states of the on-site dataset and the customized dataset.validating the authenticity of the simulation approach.
. Comparison of datasets. (<b>a</b>) Field image of salt deposition; (<b>b</b>) Self-constructed image of salt deposition.
The custom dataset was acquired using a self-designed dataset capture frame, composed of three core modules: a mobile guide rail for positional stability, a sliding device for smooth image sweep across PV panels, and a flexible imaging module capable of mounting different camera types, as shown in . This platform allowed image capture under varying conditions of illumination and perspective to replicate real offshore variability.
. Photographic framework for the salt deposition dataset of PV modules.
The data acquisition process involved manually simulating salt crystallization on PV module surfaces. A saline solution, prepared to match seawater concentration, was poured evenly over PV surfaces while continuously stirring to ensure consistency. No constraints were imposed on the pouring angle or volume to preserve randomness in deposition patterns. The resulting deposits closely replicated the heterogeneous appearance of actual marine salt crystallization.
No restrictions were applied to ambient lighting or camera angles during photography to diversify the dataset further. As a result, the raw dataset contained several hundred high-resolution images, representing a wide range of salt morphologies, deposition densities, and environmental perspectives. This enhanced variability directly contributes to improved robustness in model learning [
28].
A series of augmentation techniques was applied to expand the dataset, including scaling, trimming, rotation, and horizontal flipping, effectively increasing data volume and representation diversity. Following augmentation, each image was annotated using LabelMe for annotation, with salt edges manually traced to ensure pixel-level ground truth masks. The final dataset includes 300 annotated images, which were randomly divided into a training set (240 images) and a validation set (60 images) using an 8:2 ratio. An independent test set was also curated for performance verification. Experimental validation showed that the improved model achieved high segmentation accuracy across varying lighting and salt morphologies, confirming the practical applicability and robustness of the constructed dataset in offshore PV scenarios.
2.3. Semantic Thresholding for Low-Level Feature Enhancement
2.3.1. Semantic Ambiguity in Salt and Gridline Features
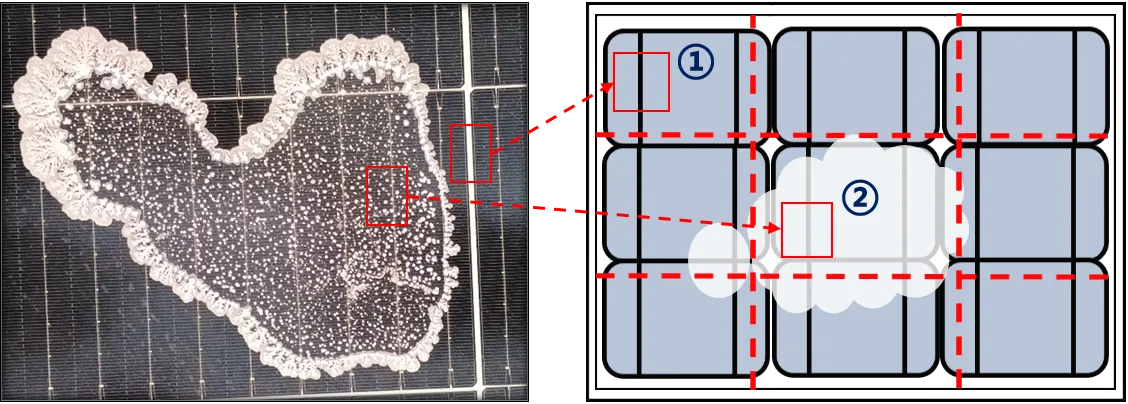
In offshore floating PV systems, visual ambiguity between salt deposition patches and surface gridlines poses a fundamental challenge to accurate image segmentation. As illustrated in , these two semantic entities—although physically distinct—often present similar visual characteristics in grayscale representations, particularly in terms of brightness and structure. Gridlines are arranged in a regular, topological pattern aligned with the PV module architecture, forming a lattice-like background feature. In contrast, salt crystallization is highly irregular, randomly distributed across the panel surface, and exhibits fragmented, diffuse morphology. However, due to their co-existence on the module surface, their projections frequently overlap or occlude each other in captured images, leading to semantic entanglement in pixel-level interpretation [
29].
Furthermore, salt deposits and gridlines tend to exhibit high grayscale intensities, especially under strong or uneven illumination. This results in overlapping peaks in the global grayscale histogram—forming a bimodal distribution with low inter-class separability. Consequently, traditional thresholding methods struggle to accurately separate the two, often misclassifying gridlines as salt or vice versa, as schematically represented in .
This inherent semantic ambiguity undermines the reliability of global segmentation algorithms and necessitates the incorporation of region-aware, feature-guided strategies to improve discrimination. To tackle this issue, the subsequent sections introduce a semantic-aware framework that enhances feature separability by leveraging local statistical cues and adaptive thresholding. These methods collectively enable more precise identification of salt regions while suppressing interference from structurally similar background features.
. Surface gridlines and salt deposition patches under the grayscale representation.
2.3.2. Adaptive Thresholding Strategy for Semantic Feature Extraction
To mitigate the semantic entanglement between salt crystallization and PV module gridlines outlined in Section 2.3.1, an adaptive thresholding strategy is adopted to enhance feature separability at the pixel level. Conventional global thresholding algorithms—such as Mean, Otsu, or Sauvola methods—typically operate under the assumption of uniform grayscale distributions and apply a single threshold value across the entire image. While these methods are computationally efficient, their performance is often compromised in heterogeneous scenes, particularly when local illumination varies or when salt deposition partially overlaps with background structures.
The image is first decomposed into multiple spatial sub-regions based on its structural layout to address this challenge. Local grayscale distributions are independently analyzed within each sub-region to determine a region-specific binarization threshold. This procedure enables the algorithm to respond adaptively to local intensity contrasts and textural features otherwise lost in global processing.
Formally, the input image
I is divided into
n non-overlapping sub-regions (as shown in
,
n = 9), the area indicated by the red rectangular box 1 corresponds to the clean region of the PV module, while the area indicated by the red rectangular box 2 corresponds to the salt-crystallized region on its surface; both are the primary subjects of this study. This segmentation process is based on the structural characteristics of the image, partitioning the original image into multiple smaller regions. The image information within each region can then be processed more independently, thereby reducing interference between different regions and enhancing the local accuracy of image processing. In the formula,
Is represents the image to be segmented, and
In denotes the segmented regions.
Seg refers to the segmentation algorithm.
Is represents the image to be segmented, and
In denotes the segmented regions as in
Equation (1).
. Semantic segmentation structure diagram of salt-splitting images.
For each region
Ii , an adaptive threshold
Bi is computed using a localized thresholding operator:
Through this formula framework,
Bn serves not only as a simple adaptive threshold but also encapsulates semantic information, thereby enabling the model to perform more precise pixel-level classification and segmentation. The obtained semantic information is then utilized to process the image.
Mn(
x,
y) represents the segmented semantic information obtained through the thresholding algorithm, and
E(
x,
y) denotes the pixel values corresponding to the grid lines in the image. A value of 1 indicates that the pixel (
x,
y) has been classified as foreground (salt deposition region), while a value of 0 indicates that it has been classified as background, as in
Equation (3).
This process preserves the localized semantics of salt deposition while attenuating interference from repetitive background structures such as gridlines or busbars. By incorporating this localized semantic guidance into the segmentation pipeline, a more discriminative and context-sensitive representation of low-level features is achieved, which lays the foundation for the subsequent selection of an optimal thresholding method.
2.3.3. Region-Based Semantic Filtering via Otsu Thresholding
To select the most suitable algorithm for regional threshold computation, several classic binarization methods—including Otsu [
30], Average, Sauvola [
31], and Niblack [
32] thresholding—were comparatively evaluated on the constructed salt deposition image dataset [
33]. These methods were assessed based on their ability to suppress structural background interference while maintaining high fidelity in representing salt crystallization patterns [
34].
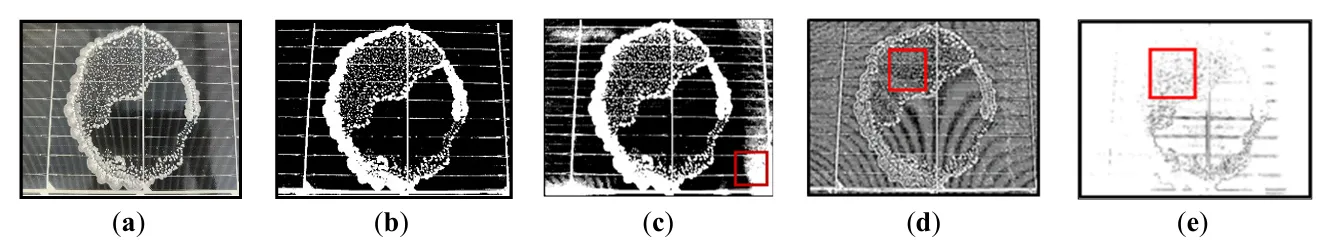
Experimental results, shown in
, indicate that Otsu thresholding consistently achieves superior performance in terms of inter-class separability and segmentation clarity, the red box identifies the noise in the algorithm’s output image that impacts the final model’s output. Otsu’s method determines the threshold by maximizing the between-class variance, which effectively enhances contrast between salt efflorescence and the PV module surface even in cases of grayscale ambiguity.
. Comparative results of salt deposition images processed by the four algorithms. (<b>a</b>) original image; (<b>b</b>) Otsu algorithm; (<b>c</b>) Average threshold; (<b>d</b>) Sauvola threshold; (<b>e</b>) Niblack threshold.
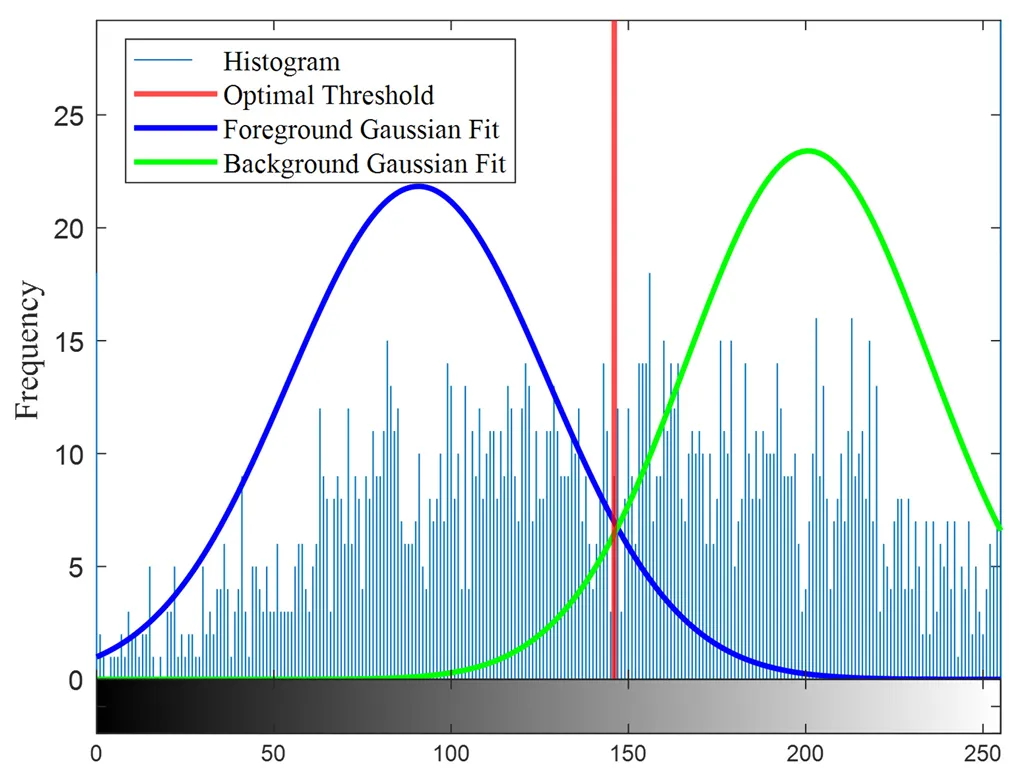
The Otsu algorithm adopts a clustering-based approach to optimize threshold selection by evaluating how different threshold values separate the image into two distinct classes. It calculates the proportion of pixels in each class and the inter-class variance between them. The optimal threshold is determined by maximizing the inter-class variance across the global range of gray levels, based on the total number of image pixels [
35]. As illustrated in
, the histogram demonstrates the concept of maximum inter-class variance in the grayscale image. The blue and green curves represent the fitted probability density functions of the foreground and background, respectively. The optimal threshold (red line) is selected by maximizing the variance difference between the two classes, thereby achieving the best possible separation between foreground and background. In other words, the optimal threshold corresponds to the maximum inter-class variance, indicating the greatest distinction in mean gray levels between the two classes.
. Schematic diagram of maximum inter-class variance in a grayscale image.
Specifically, the Otsu algorithm begins by initializing the salt image and defining variables for foreground and background. The means of the foreground and background are then computed. Let
w1 denote the proportion of foreground pixels and
w2 = 1 −
w1 the proportion of background pixels. The inter-class variance, representing the degree of separability between the two classes, is calculated as:
where
μ1 and
μ2 are the mean gray levels of the foreground and background, respectively, given by:
Here,
p(
i) denotes the normalized probability of each gray level
i, obtained from the histogram
h(
i) as:
where
i is the gray level and
L is the total number of pixels in the image.
Finally, for each image region
Ii , Otsu computes the optimal threshold
Bi as:
To accommodate illumination variation and spatial heterogeneity, Otsu thresholding was applied in a region-wise fashion. Each image was divided into nine sub-regions (
i.e.,
n = 9), and Otsu thresholding was performed individually on each. This region-based application significantly reduced semantic confusion caused by uniform global thresholding, especially in overlapping or gridline-dense areas.
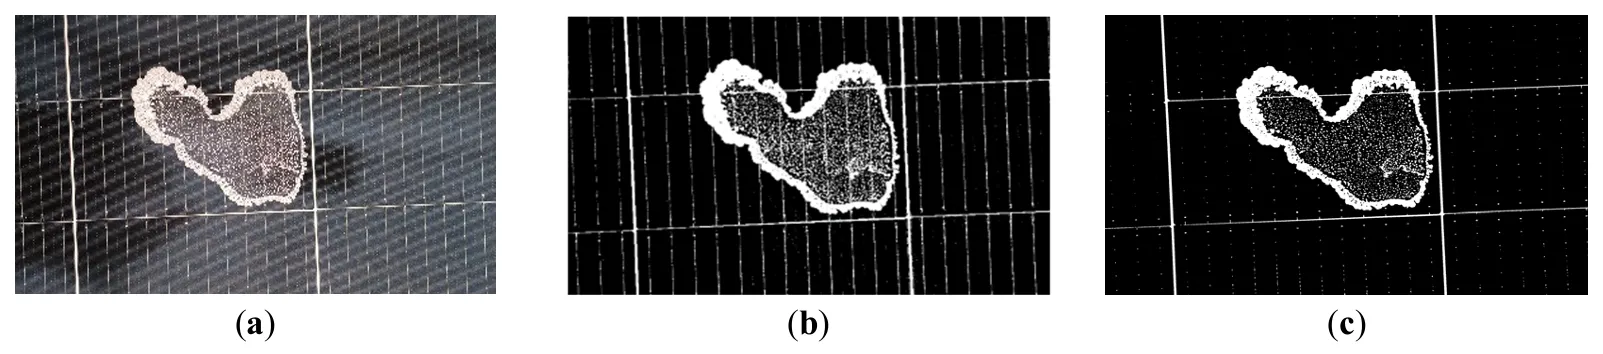
The semantic maps generated from region-wise Otsu processing were fused into a composite semantic channel and combined with the original RGB image to form a 4-channel input to the Mask R-CNN model. As shown in
, this approach improves foreground-background separability, particularly in visually ambiguous regions. The segmentation model exhibits enhanced salt detection performance by leveraging Otsu-derived semantic guidance while minimizing false positives from gridline interference.
. Output results of the improved image processing workflow. (<b>a</b>) original image; (<b>b</b>) pre-application; (<b>c</b>) post-application.
This semantic-aware preprocessing framework thus provides a robust foundation for feature optimization in complex marine inspection scenarios. It significantly improves the precision and reliability of salt detection on offshore floating PV modules.
2.4. Semantic-Integrated Salt Detection via Mask R-CNN
Through the screening of basic models, it is found that two models stand out for application in this scenario: Robust Principal Component Analysis (RPCA) via Low-rank plus Sparse (L+S) Decomposition [
36], and Mask R-CNN. From the perspective of application scenarios and core capabilities, RPCA via L+S Decomposition focuses on interference removal and structure extraction at the data level (providing high-quality data for subsequent tasks), while Mask R-CNN focuses on object-level detection and segmentation (enabling end-to-end output of object information); the two play different roles in the technical chain and exhibit complementarity. Since the core of this study is to achieve object-level detection and segmentation of salt deposition on the surface of PV modules, which requires direct acquisition of the spatial location and morphological information of salt deposition, Mask R-CNN is selected as the basic framework for method improvement in this study. In the final stage, the semantic information generated from thresholding is integrated into this enhanced Mask R-CNN model to realize precise instance-level segmentation of salt deposits. He et al [
37] proposed Mask R-CNN based on Fast Region-based Convolutional Neural Network (Fast R-CNN) [
38]. Mask R-CNN can predict both the class and bounding box of the target, with a more complex model architecture. Mask R-CNN introduces an additional branch that employs a fully convolutional network structure to apply pixel-level segmentation masks to each candidate region. Processing the input feature maps outputs a binary mask that indicates whether each pixel belongs to the corresponding instance. It has been widely applied in fields such as medical diagnosis [
39] and agriculture [
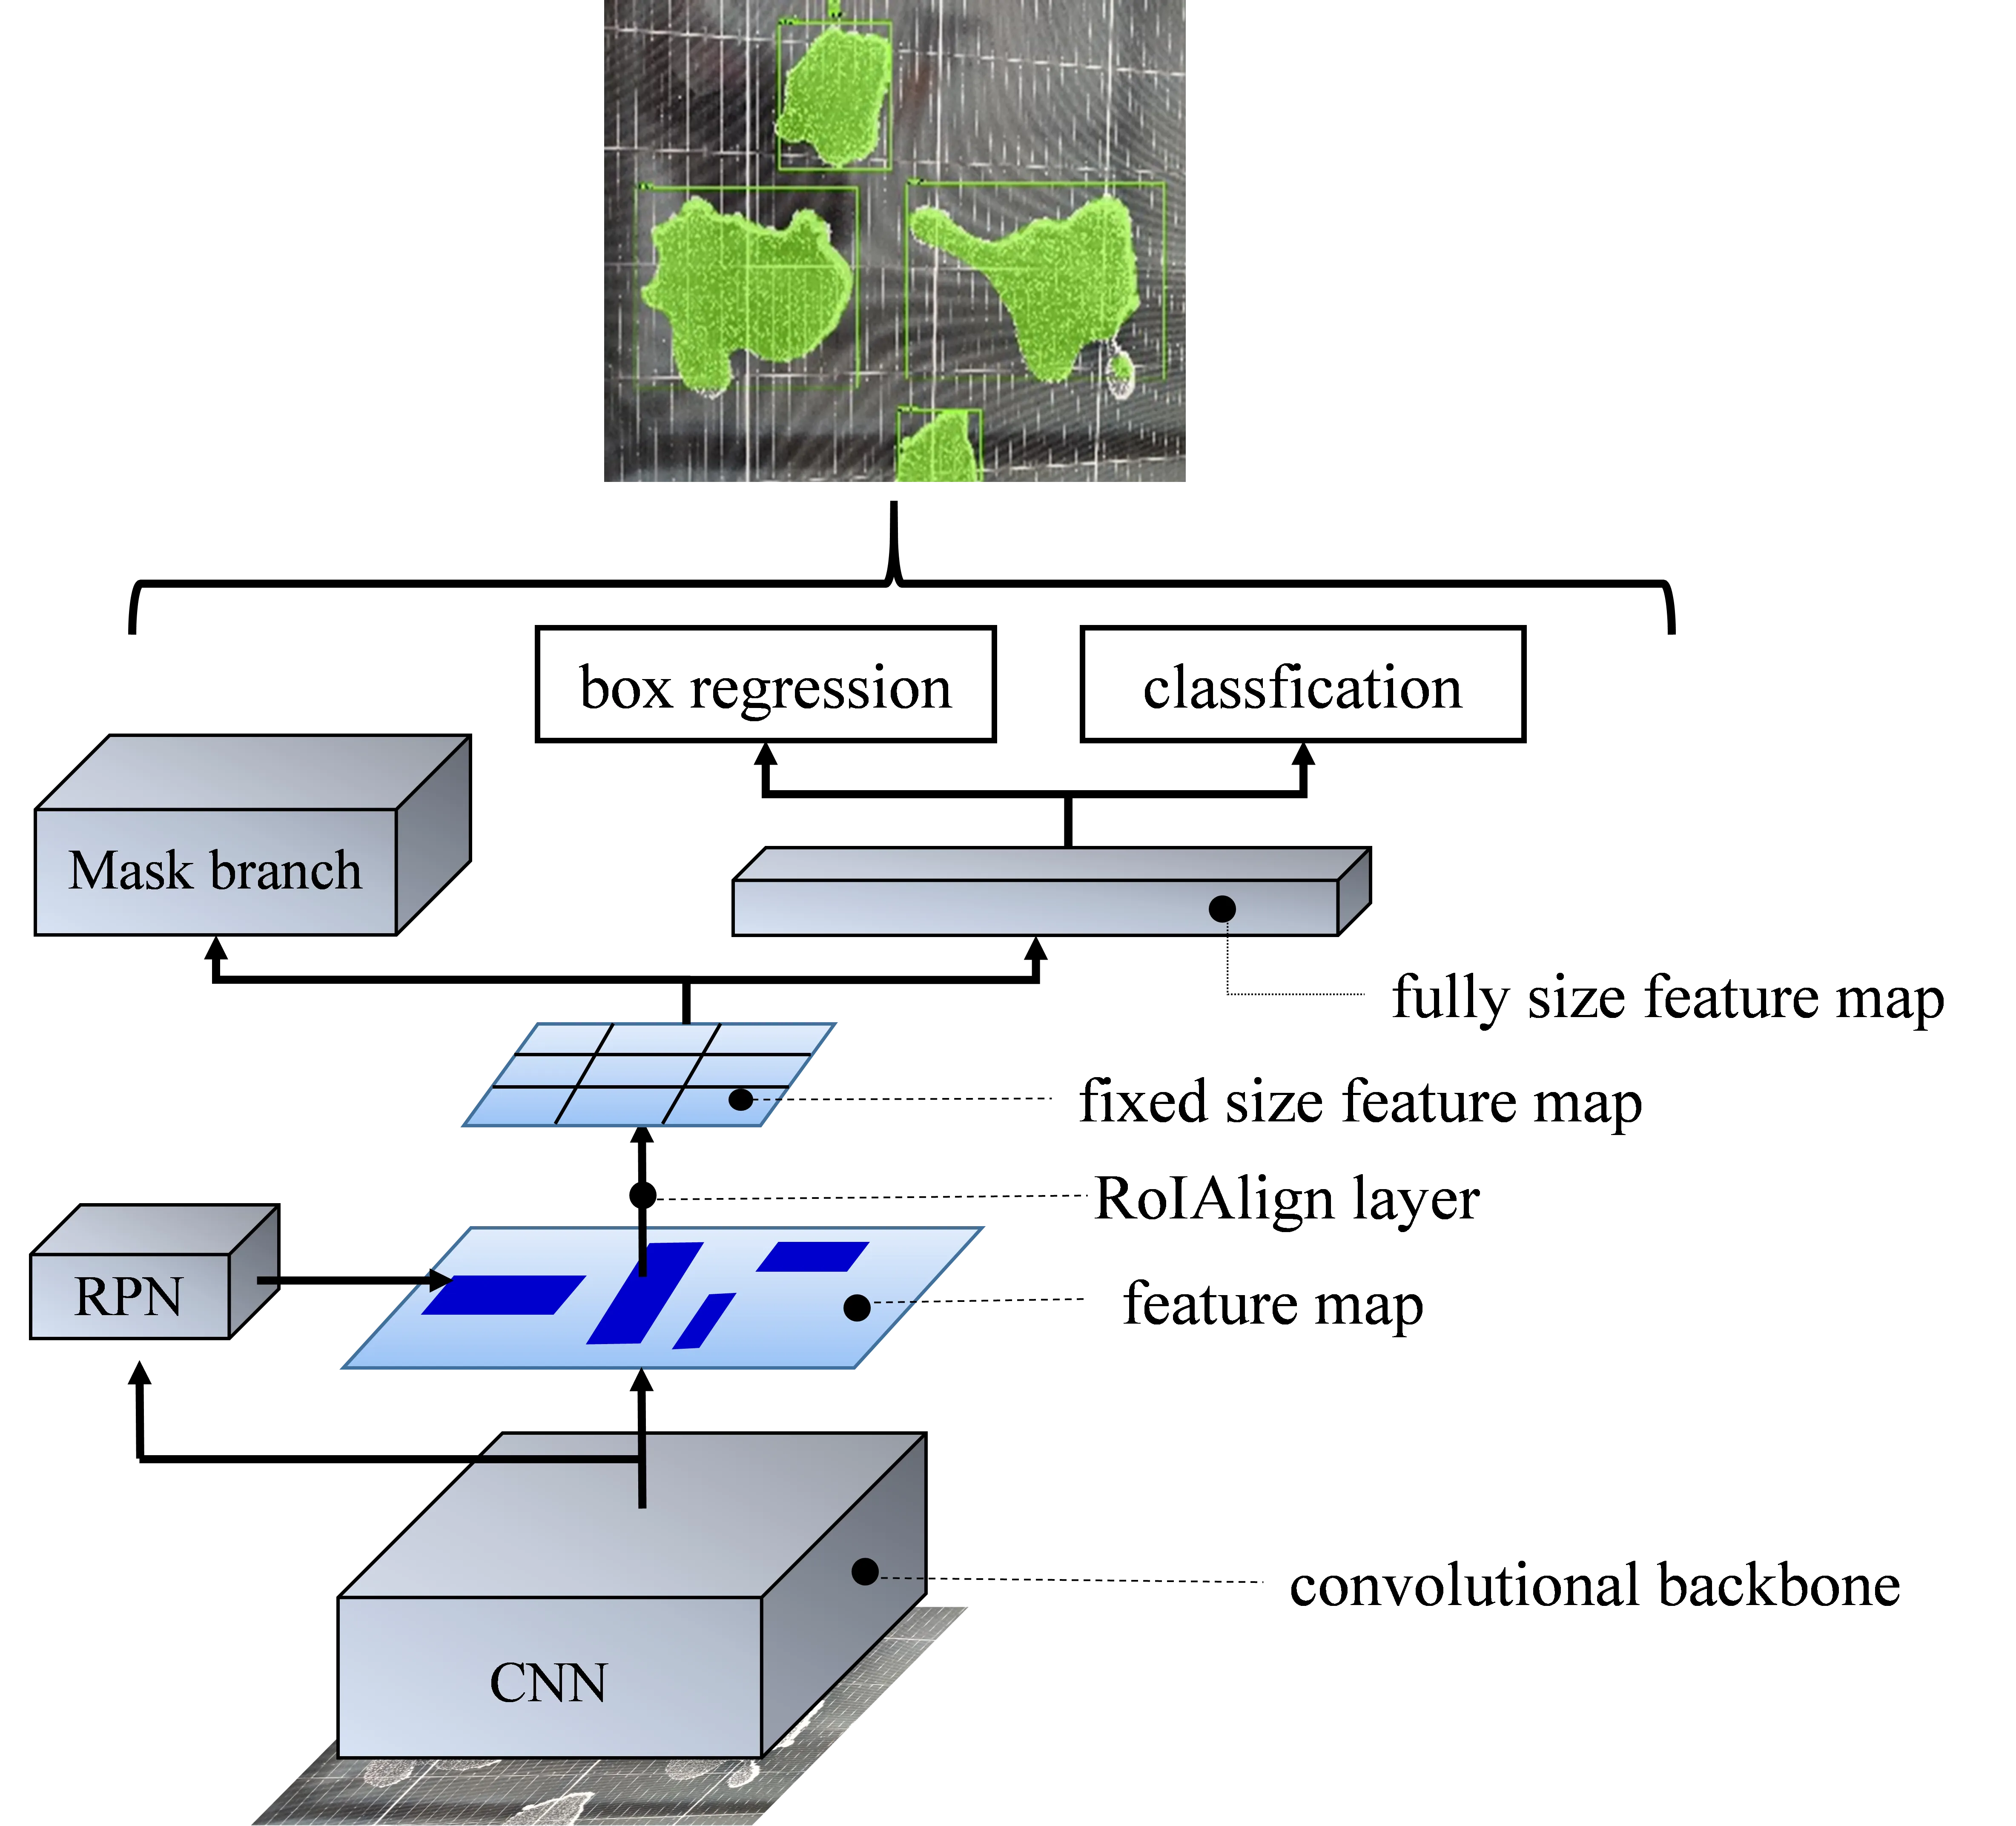
40], and has gradually evolved into a mature technology. Based on the characteristics of salt deposition on the surfaces of offshore floating PV modules and the practical requirements for salt removal, this study draws upon other object detection frameworks. It employs Mask R-CNN for the image recognition of salt deposition in offshore floating PV systems. The overall architecture can be illustrated as follows:
The acquired images of salt deposition on the surfaces of PV modules are first fed into the convolutional neural network to extract high-level features. During this process, the region proposal network generates candidate regions to assist in identifying areas that may contain salt deposition. The mask branch module then processes these candidate regions to generate masks for the salt deposition targets, thereby delineating the specific areas of salt accumulation.
The mask enables precise extraction of the salt deposition contours by performing pixel-level segmentation for each salt deposition target. Simultaneously, the box regression module accurately localizes the bounding box of the salt deposition by computing the minimum enclosing rectangle for each target, providing spatial information. The classification module then classifies the detected targets to determine whether they correspond to salt deposition or PV modules. In addition, a sliding window mechanism is employed to generate multiple anchor boxes on the feature map and to evaluate the target probability for each anchor.
Finally, after processing through multiple modules, the framework outputs the mask, bounding box, and class information for the salt deposition targets. The network architecture of Mask R-CNN is illustrated in
.
. Mask R-CNN architecture.
In the aforementioned thresholding process, semantic information is introduced to enhance the effectiveness of image segmentation, ensuring that both grid lines and salt deposition patches are correctly classified according to their semantic characteristics. After completing the threshold-based binarization for each segmented region, the nine processed sub-images are stitched together according to their original spatial positions. The stitched image retains the independently processed results of each segmented part while preserving the overall structural coherence of the image, the green box in the output indicates the salt-dissolving area identified by the model.
At this stage, the stitched image is treated as an additional channel and combined with the original Red (R), Green (G), and Blue (B) channels to form a four-dimensional space input for the Mask R-CNN model for object detection and segmentation. Integrating semantic information into the image processing pipeline enhances the model's understanding of image semantics, thereby improving its performance in complex scenarios. Compared with the original unsegmented images, the improved framework significantly enhances the model's capability to handle complex backgrounds. Through the effective utilization of semantic information and the adjustment of the image segmentation strategy, this study not only optimizes the application of the thresholding algorithm in image processing but also improves the accuracy of the Mask R-CNN model in detecting salt deposition on PV modules. This improved approach provides a more precise and efficient solution for image recognition tasks in practical applications, demonstrating strong adaptability and robustness, particularly in the presence of complex structures and noise within the images.
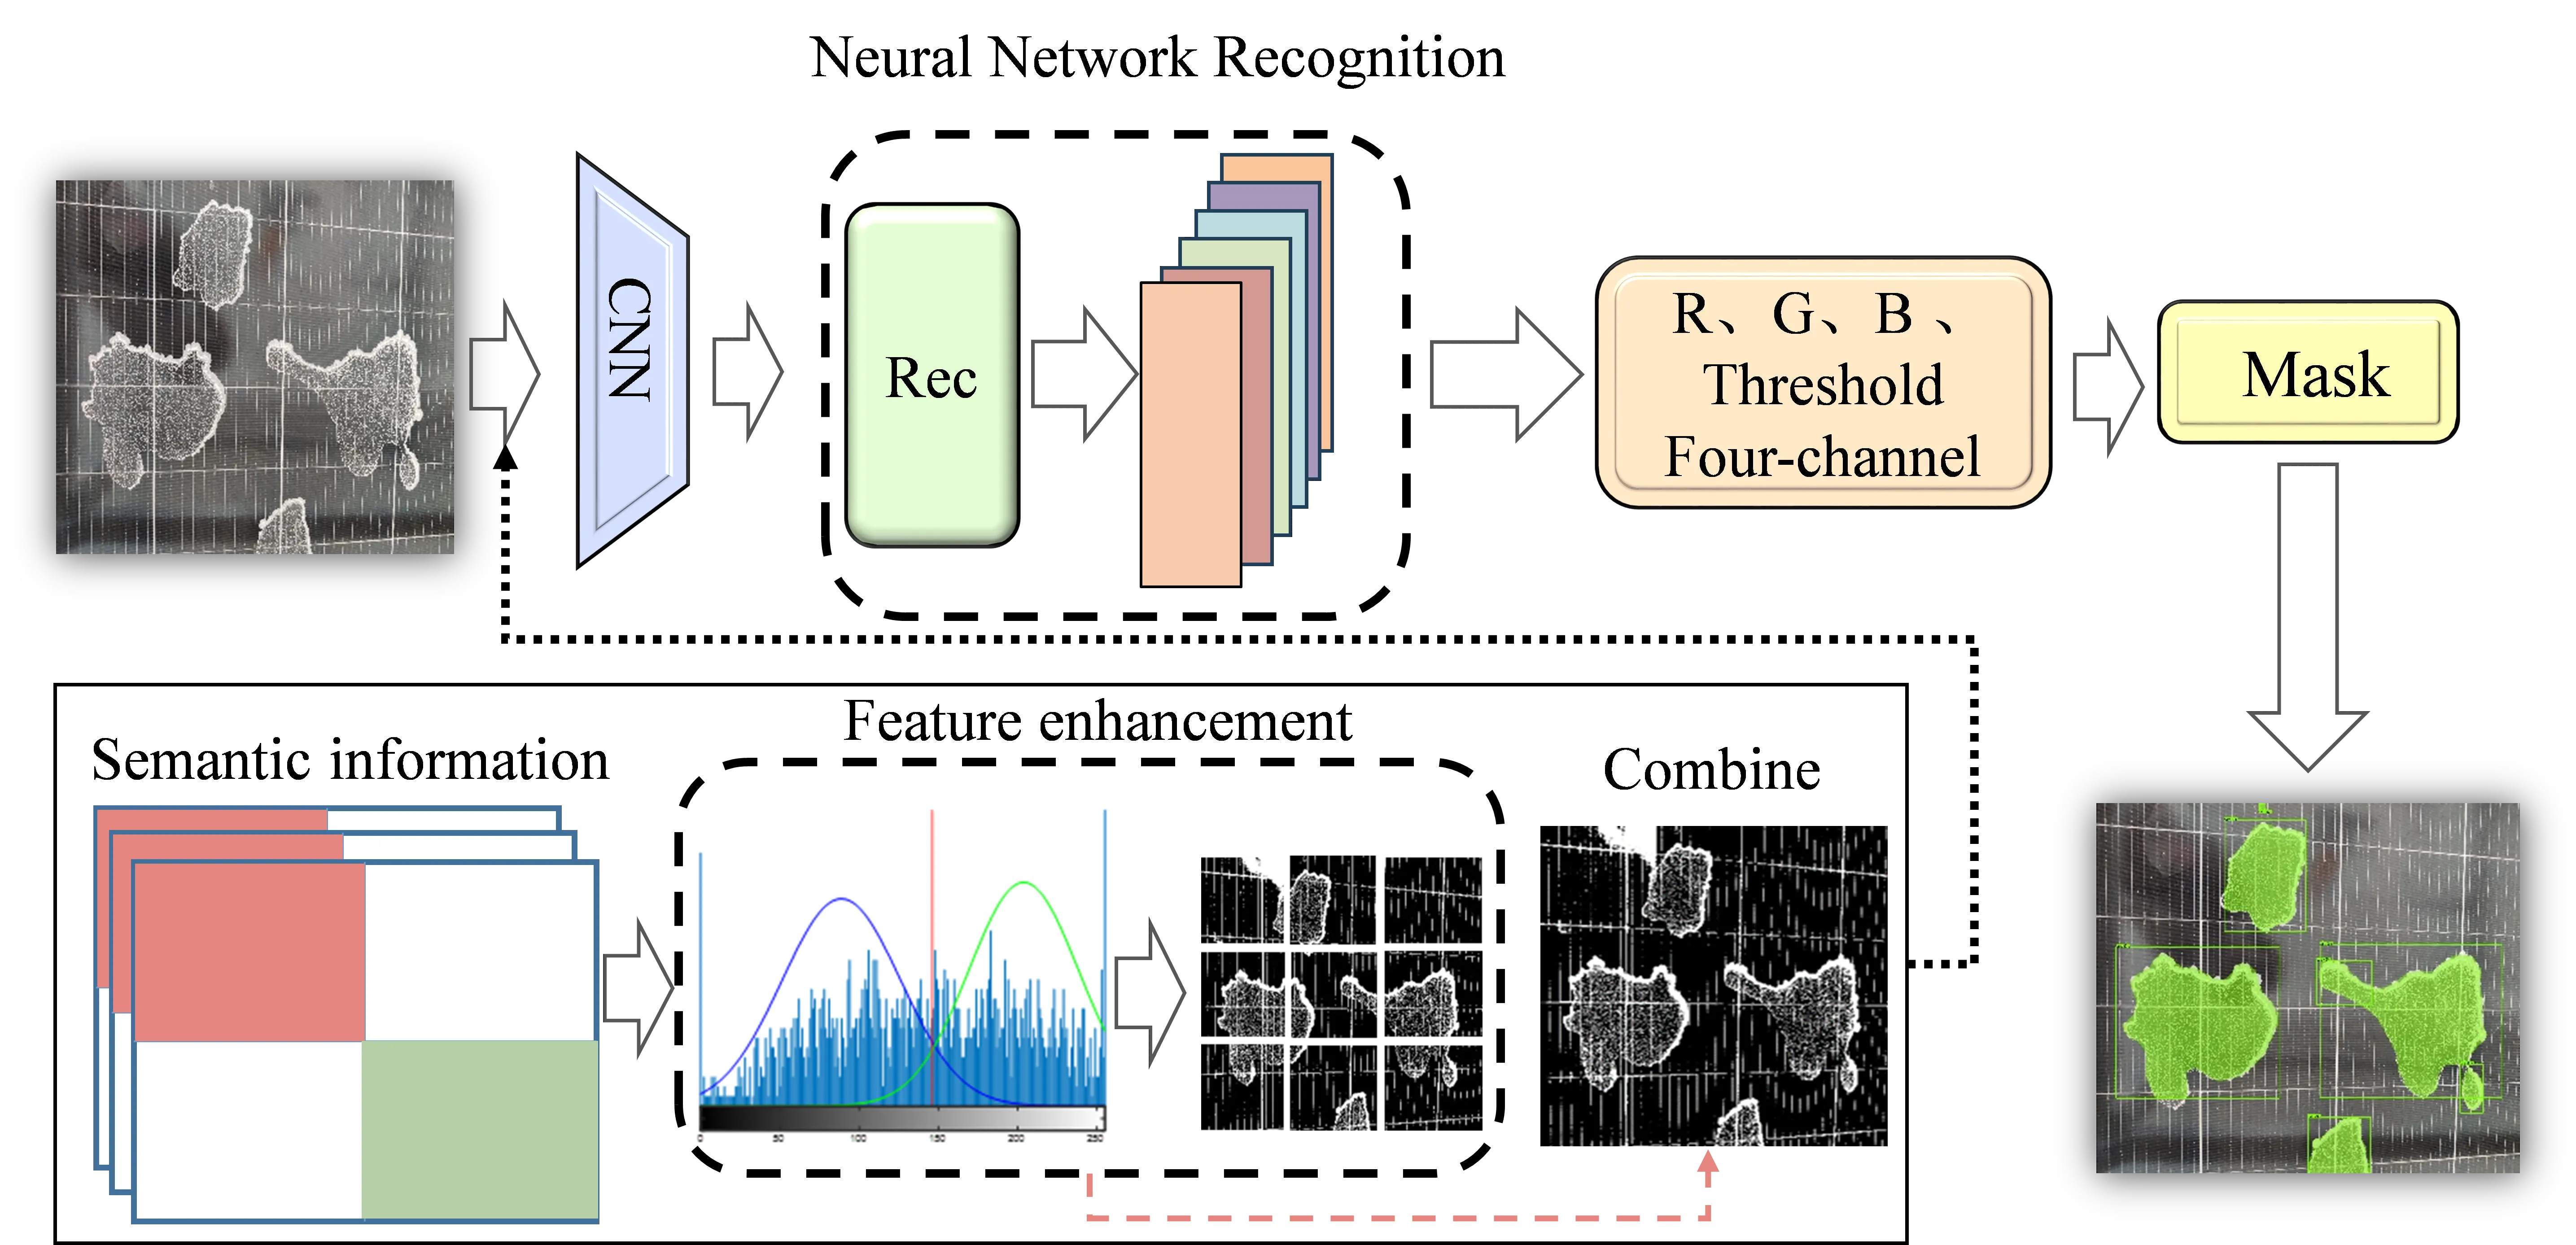
Given the irregular and difficult-to-identify boundaries of salt deposition, this study proposes a semantic information-based framework for recognizing salt deposition on the surfaces of offshore floating PV modules. This framework enhances the accuracy of salt deposition detection and segmentation by processing the salt deposition image data through a semantic information-guided thresholding logic. A four-dimensional space input is constructed by integrating the thresholding channel, which is optimized based on semantic information, with the original RGB image. This enables the model to not only learn the color information from the RGB image but also capture the critical textures and structural features highlighted by the thresholding process. In this manner, the model can achieve a comprehensive and in-depth understanding of the image information pertaining to salt deposition on PV module surfaces, allowing it to identify and segment salt deposition regions accurately. The improved network architecture is illustrated in
, the red box indicates the salt precipitation zone, while the green box indicates the photovoltaic module zone.
. Structure of the Mask R-CNN improved with semantic information.
3.Results and Discussion
3.1. The Devices and Strategies Employed in the Training of Models
During the model training process, parameter settings are of critical importance. To achieve optimal training performance, a systematic hyperparameter tuning process is required prior to formal training. In this process, multiple key hyperparameters are predefined and optimized to ensure the stability and convergence of the model. Furthermore, according to the fundamental principles of experimental design, especially when conducting comparative experiments, it is essential to maintain consistent parameter configurations and standardized dataset distribution strategies. This approach effectively controls potential confounding factors and ensures the authenticity and comparability of the evaluation results. To enable a fair comparison, the original and improved models are trained under identical dataset conditions, thereby eliminating the influence of external variables.
After multiple experimental trials, the final training parameters were determined, as shown in
. The image size and the number of input channels were set in accordance with the specific requirements of the model architecture to ensure compatibility between the input data and the model framework.
.
Detailed training parameters for model implementation.
| Training Parameters |
The Prescribed Value |
| Batch size |
6 |
| IoU |
0.5 |
| momentum |
0.9 |
| Epoch |
100 |
| Stride length |
30–60 |
During the model training process, multiple experiments were conducted to carefully adjust the learning rate to ensure the model could achieve optimal performance. As a critical factor influencing the effectiveness of model training, the learning rate was systematically and progressively modified throughout the experiments. A series of iterative trials was performed to evaluate different learning rate settings, with careful observation of the model’s convergence speed and recognition performance. It was ultimately determined that setting the learning rate to 0.011 yielded the best recognition results. This finding provides an important reference for subsequent training and application, ensuring the trained model can achieve the expected performance in practical scenarios. The meticulous parameter setting and optimization process significantly enhance the model’s performance and robustness in handling complex tasks.
3.2. Model Evaluation Metrics
To clearly and intuitively demonstrate the performance of the improved Mask R-CNN, this study employs two evaluation metrics: mean Average Precision (
mAP) and F1-score, to assess the model comprehensively.
mAP is a commonly used performance evaluation metric in object detection and instance segmentation tasks [
41]. Its specific calculation procedure involves first computing Precision and Recall, based on which the Precision (P)–Recall (R) curve is plotted.
TP represents the number of true positive salt deposition detections,
TP denotes the number of false positives, and
FN refers to the number of false negatives:
The Average Precision (
AP) is computed from the curve, typically by calculating the area under the curve using integration methods or specific approaches such as 12-point interpolation. Finally, the
AP values for all categories are averaged to obtain
mAP, AP
i represents the average precision of the i-th category:
When evaluating the model, the mAP may yield inconsistent recognition results due to variations in the selected
IoU thresholds. To enhance the comprehensiveness and accuracy of the model performance evaluation, a second evaluation metric, F1-score, is introduced. By adopting a multidimensional evaluation framework, the improved model's accuracy in detecting salt deposition can be more comprehensively assessed, providing a more precise basis for further model optimization. F1-score is a commonly used evaluation metric, particularly valuable in scenarios involving imbalanced datasets or where a balanced consideration of precision and recall is required [
42]. Salt deposition recognition typically involves identifying all relevant salt deposition regions within the image. A high recall rate indicates that the model can detect a greater number of true positives. In the context of PV module maintenance, the cost of missed detections is often substantial, as failing to identify salt deposition areas may lead to reduced equipment efficiency or even damage. Therefore, recall is of critical importance, as a recognition model with a high recall rate can effectively safeguard and extend the service life of PV modules. The F1-score, defined as the harmonic mean of precision and recall, is calculated as demonstrated in
Equation (11).
The F1-score effectively balances precision and recall, thereby mitigating the issue of performance distortion and low recall caused by the IoU threshold overlooking smaller targets. To better evaluate the model’s performance in this task, the introduction of these two evaluation metrics is particularly appropriate. The model’s ability to detect salt deposition regions can be accurately assessed by adopting both metrics, providing a more reliable foundation for subsequent model optimization and improvement.
Based on the aforementioned computational logic, mAP and F1-score are systematically incorporated as dual performance monitoring benchmarks during the model training phase. During model inference, the mAP values and F1-score data are simultaneously outputted for both the original RGB three-channel input mode and the improved four-dimensional spatial input mode. Comparative analysis reveals that the enhanced model achieves significant gains over the baseline model across both core evaluation metrics. The performance improvements exhibit consistency and stability at a statistical level, thereby fully validating the optimization effect of introducing four-dimensional spatial features on the model's detection efficacy.
3.3. Analysis Based on Evaluation Metrics and Visualizations
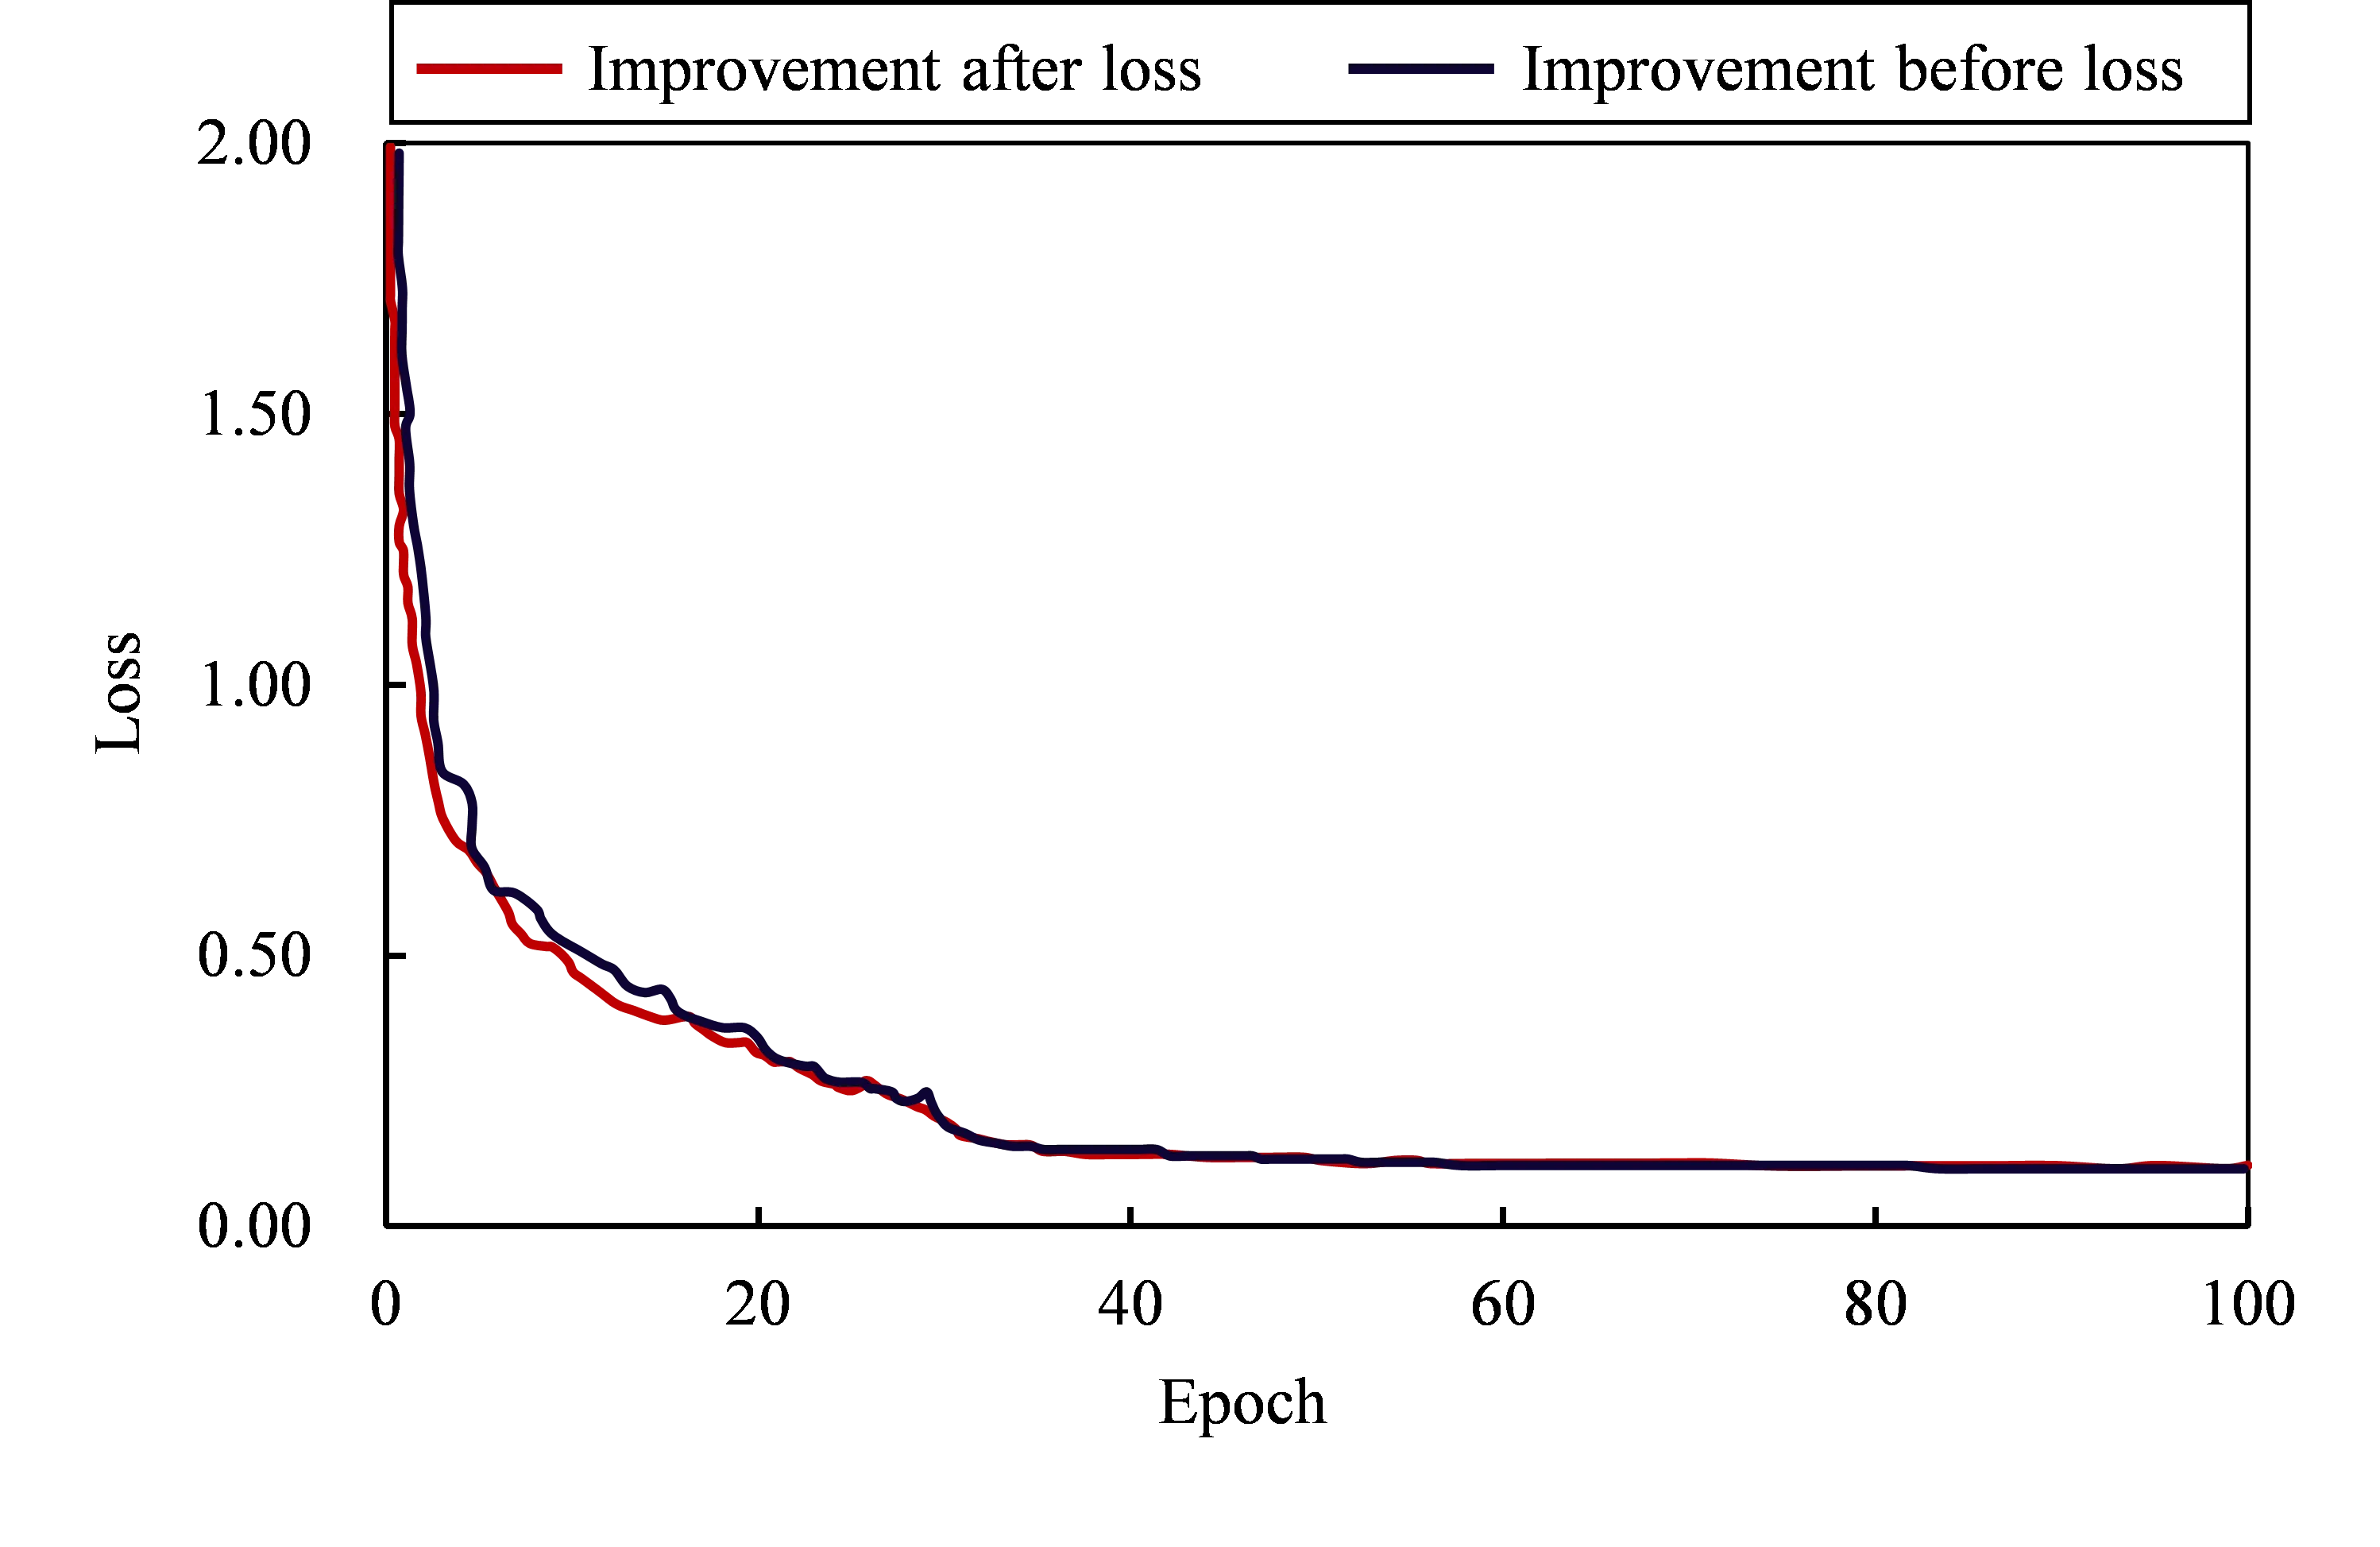
Following the implementation of the aforementioned research methodology, it was observed that during the initial phase of model training, as the number of training epochs increased, the training loss exhibited a pronounced and rapid decline. This indicates that the model was effectively learning the features and patterns present in the salt deposition data. As shown in the results below, with the continued increase in training epochs, the loss reduction rate gradually slowed and eventually stabilized at a relatively steady state. At 80 epoch, both the training and validation loss values reached stability, with all loss values falling below 0.25. Therefore, an epoch count of 80 was adopted to save computational time. Notably, the classification and regression losses of the head network converged towards zero, indicating that the model had successfully learned the distinct features and approximate locations of salt deposition on PV modules [
43], the model has already achieved satisfactory performance in both classification and region prediction tasks. The changes in training loss for the models before and after improvement are shown in
.
. Training loss curves of the model before and after improvement over training epochs.
During the model operation phase, after preprocessing the collected salt deposition images using the multi-scale feature fusion framework developed in this study, the feature space representation of the images exhibited significant optimization. Specifically, following adaptive thresholding segmentation and texture feature enhancement, the introduction of the semantic information-based thresholding unit for salt deposition features successfully suppressed the periodic interference signals caused by the grid lines of PV cells during model operation. Experimental results demonstrate that this processing pipeline effectively eliminates the spatial frequency aliasing caused by electrode grid lines, thereby improving the accuracy of morphological feature extraction in salt crystallization regions and providing a reliable visual basis for the quantitative analysis of salt deposition defects on PV modules.
Comparative analysis of the two models' performance in the salt deposition recognition task revealed that the improved model achieved a significant enhancement in recognition and segmentation accuracy compared to the baseline model. During the image processing stage, the semantic information-guided thresholding algorithm automatically determined the optimal binarization threshold for the input images, enhancing the edge features of salt deposition on PV modules to better separate salt deposition regions from the background. This effectively reduced the interference caused by grid lines during model recognition, enabling Mask R-CNN to focus more precisely on the target areas. Such preprocessing improved the feature recognition capability of Mask R-CNN. Consequently, the improved model demonstrated a consistently upward trend in early training stages. Moreover, by incorporating the four-dimensional space, the separability of the dataset was enhanced, improving data quality by converting sample images into more processable binary representations. As a result, the improved model exhibited faster convergence at the early training stage, achieving over 90% segmentation accuracy at an epoch count of 80, approximately 20 epochs earlier than the baseline model. This improvement helps to reduce label noise and unpredictability, leading to a more stable and efficient network training process. The comparison of recognition and segmentation accuracy curves between the baseline and improved models is presented in
.
. Comparison of mAP accuracy for detection and segmentation between the baseline and improved models. (<b>a</b>) Detection before <i>vs.</i> after model improvement ; (<b>b</b>) Segmentation before <i>vs.</i> after model improvement.
As shown in
, a comparison of the mAP and F1-score evaluation metrics between the baseline and improved models reveals that the recognition accuracy (mAP) of the improved model increased by 4.7%, while the segmentation accuracy (mAP) improved by 3.6%. The recognition accuracy (F1-score) increased by 3.3%, and the segmentation accuracy (F1-score) improved by 3.3% as well. These improvements demonstrate that the strategies adopted during the training and optimization processes effectively enhanced the model’s learning capacity and generalization ability. The improved model can thus provide more reliable predictions for practical applications in offshore floating PV systems, laying a solid foundation for further model advancements.
presents the comparison of evaluation metrics between the baseline and improved models.
.
Comparison of mAP and F1-score between the baseline and improved models.
| Evaluation Criteria |
Model before Improvement |
Model after Improvement |
| mAPdet |
88.4% |
92.0% |
| mAPseg |
88.5% |
93.3% |
| F1det |
62.7% |
66.0% |
| F1seg |
62.7% |
66.0% |
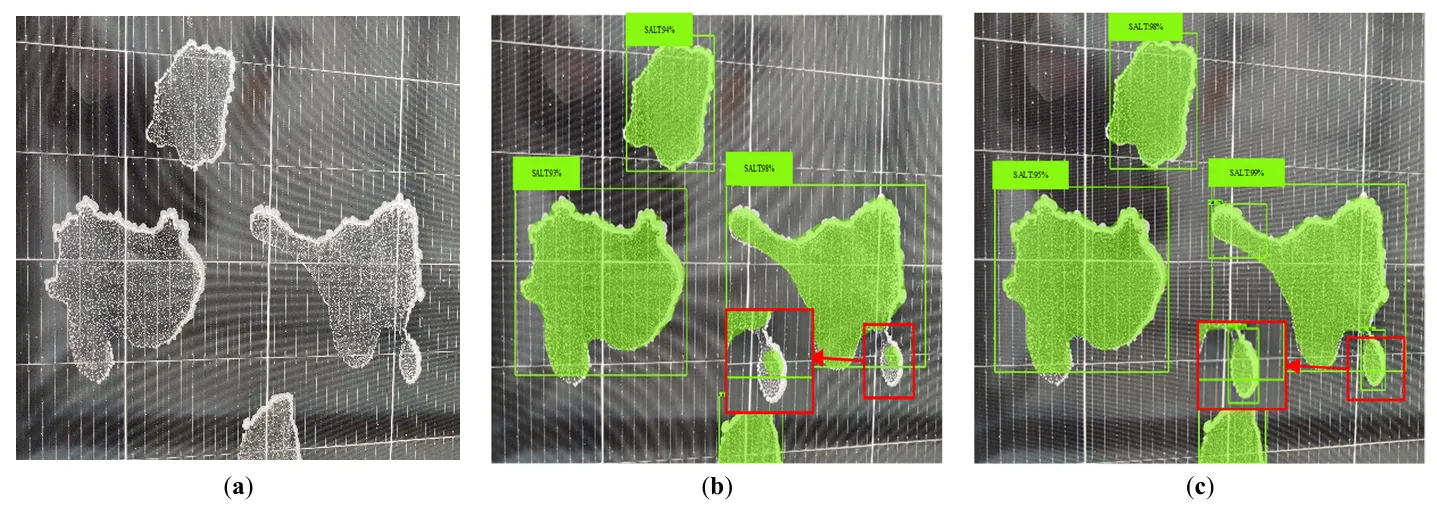
To intuitively demonstrate the advantages of the improved model over the baseline model in the integrity recognition of salt deposition on PV modules, the actual salt deposition dataset was input into both the baseline and improved models for comparative analysis. The comparison results are presented in
and
, the region highlighted by the red rectangular box in the figure indicates an area that the baseline model failed to detect, while the proposed model successfully identified; this region exhibits a strong contrast in the output structure.
. Comparison of single salt deposition target results on the test set. (<b>a</b>) original image; (<b>b</b>) pre-improvement; (<b>c</b>) proposed.
. Comparison of multiple salt deposition target results on the test set. (<b>a</b>) original image; (<b>b</b>) pre-improvement; (<b>c</b>) proposed.
4. Conclusions
The stable operation of floating PV systems in salt spray environments, as well as the development of efficient cleaning and maintenance systems, relies heavily on the accurate detection and localization of salt crystallization on PV module surfaces. This study identifies critical limitations in the performance of the existing Mask R-CNN framework for this task. Specifically, the conventional model exhibits insufficient sensitivity to the morphological features of salt crystals, resulting in a recognition accuracy of only 88.4%. Additionally, the interference caused by gridlines on the module surface significantly degrades the model’s robustness, leading to fragmented recognition of salt crystallization regions. In complex backgrounds, further susceptibility to noise and impurity artifacts contributes to a notable decline in segmentation performance.
A novel detection framework incorporating prior semantic information was proposed to overcome these challenges. By integrating an adaptive thresholding mechanism based on multi-dimensional analysis into the feature extraction stage, the model’s capacity to distinguish fine-grained salt features was substantially enhanced. Experimental validation on a measured dataset confirms that, compared to the traditional Mask R-CNN, the proposed framework not only significantly improves the accuracy of salt region localization but also markedly suppresses the interference from structural background features such as gridlines. Furthermore, the integrity of salt crystallization recognition is greatly improved through refined feature analysis.Quantitative results show a considerable performance gain: recognition accuracy increased to 93.3%, and the F1-score for complete region identification rose to 0.66. The integration of a noise suppression module further enhances the model’s robustness under complex background conditions, affirming its capability to handle challenging visual scenarios typical of marine environments. These improvements collectively provide strong technical support for intelligent maintenance strategies in offshore floating PV systems.
Nevertheless, further optimization remains necessary. Although the proposed model demonstrates improved computational efficiency, its recognition speed has not yet reached an optimal level for real-time deployment. Future research will therefore focus on refining the core architecture, streamlining the data processing pipeline, and incorporating advanced deep learning techniques to enhance real-time responsiveness, thereby aligning the system with the demands of practical engineering applications. From a broader perspective, exploring alternative methodological paradigms could further advance this field. For instance, graph neural networks and graph signal processing techniques, which are inherently suitable for modeling relational features in complex structures, may offer promising solutions. These approaches could reduce reliance on large-scale annotated datasets—a critical advantage given the challenges of data labeling in marine PV scenarios—while capturing the topological relationships between salt crystals and background components (e.g, gridlines, surface textures). Such extensions would not only complement the current framework but also enhance the adaptability of salt crystallization detection in real-world operational environments.
Declaration of Generative AI and AI-Assisted Technologies in the Writing Process
During the preparation of this work the author(s) used ChatGPT in order to translate the manuscript. After using this tool, the author(s) reviewed and edited the content as needed and take(s) full responsibility for the content of the publication.
Acknowledgements
This study is supported by the China Postdoctoral Science Foundation (No.2024T022TJ, No.2025M773253), National Key R&D Program of China (No. 2022YFB4200704), National Science Foundation of Tianjin Science and Technology Plan Project (Grant NO: 23ZYQYGX00140).
Author Contributions
X.G. and M.L.; Methodology, M.L.; Software, Y.L.; Validation, X.D., Q.M. and Y.L.; Formal Analysis, Q.M.; Investigation, X.D.; Resources, M.L.; Data Curation, X.X.; Writing—Original Draft Preparation, X.D.; Writing—Review & Editing, Q.M.; Visualization, X.D.; Supervision, X.G.; Project Administration, J.L.; Funding Acquisition, J.L.
Ethics Statement
Not applicable.
Informed Consent Statement
Not applicable.
Data Availability Statement
Data will be made available on request.
Funding
This research received no external funding.
Declaration of Competing Interest
The authors declare that they have no known competing financial interests or personal relationships that could have appeared to influence the work reported in this paper.
References
-
1.
Mohammadi A, Mehrpooya M. A comprehensive review on coupling different types of electrolyzer to renewable energy sources.
Energy 2018,
158, 632–655. doi:10.1016/j.energy.2018.06.073.
[Google Scholar]
-
2.
Wall S, Hong X, Sha L, Xie J. High-efficiency PV inverter with SiC technology.
IET Renew. Power Gener. 2018,
12, 149–156. doi:10.1049/iet-rpg.2017.0331.
[Google Scholar]
-
3.
Venkateswari R, Rajasekar N. Power enhancement of PV system via physical array reconfiguration based Lo Shu technique.
Energy Conv. Manag. 2020,
215, 22. doi:10.1016/j.enconman.2020.112885.
[Google Scholar]
-
4.
Pietzcker RC, Stetter D, Manger S, Luderer G. Using the sun to decarbonize the power sector: The economic potential of photovoltaics and concentrating solar power.
Appl. Energy 2014,
135, 704–720. doi:10.1016/j.apenergy.2014.08.011.
[Google Scholar]
-
5.
Zhao Q, Su C, Qin M, Umar M. Is global renewable energy development a curse or blessing for economic growth? Evidence from China.
Energy 2023,
285, 11. doi:10.1016/j.energy.2023.129403.
[Google Scholar]
-
6.
Gorjian S, Sharon H, Ebadi H, Kant K, Scavo F.B, Tina G.M. Recent technical advancements , economics and environmental impacts of floating photovoltaic solar energy conversion systems.
J. Clean. Prod. 2021,
278, 28. doi:10.1016/j.jclepro.2020.124285.
[Google Scholar]
-
7.
Gao X, Li Y, Liu M, Lian J, Ma Q, Zhang J, et al. An exploratory framework for analyzing the impact of salt deposition on offshore photovoltaic system, Renew.
Energy 2025,
242, 11. doi:10.1016/j.renene.2025.122439.
[Google Scholar]
-
8.
Zhang Y, Yuan C. Effects of marine environment on electrical output characteristics of PV module.
Renew. Sustain. Energy J. 2021,
13, 9. doi:10.1063/5.0060201.
[Google Scholar]
-
9.
Nie J, Luo T, Li H. Automatic hotspots detection based on UAV infrared images for large-scale PV plant.
Electron. Lett. 2020,
56, 193–194. doi:10.1049/el.2020.1542.
[Google Scholar]
-
10.
Ullah A, Amin A, Haider T, Saleem M, Butt N.Z. Investigation of soiling effects , dust chemistry and optimum cleaning schedule for PV modules in Lahore, Pakistan.
Renew. Energy 2020,
150, 456–468. doi:10.1016/j.renene.2019.12.090.
[Google Scholar]
-
11.
Lu K, Li J, Zhou L, Hu X, An X, He H. Generalized Haar Filter-Based Object Detection for Car Sharing Services.
IEEE Trans. Autom. Sci. Eng. 2018,
15, 1448–1458. doi:10.1109/TASE.2018.2830655.
[Google Scholar]
-
12.
Song Z, Yang J, Zhang D, Wang S, Li Z. Semi-Supervised Dim and Small Infrared Ship Detection Network Based on Haar Wavelet.
IEEE Access 2021,
9, 29686–29695. doi:10.1109/ACCESS.2021.3058526.
[Google Scholar]
-
13.
Shirpour M, Khairdoost N, Bauer MA, Beauchemin SS. Traffic Object Detection and Recognition Based on the Attentional Visual Field of Drivers.
IEEE T. Intell. Veh. 2023,
8, 594–604. doi:10.1109/TIV.2021.3133849.
[Google Scholar]
-
14.
Cao T, Song K, Xu L, Feng H, Yan Y, Guo J. Balanced multi-scale target score network for ceramic tile surface defect detection.
Measurement 2024,
224, 12. doi:10.1016/j.measurement.2023.113914.
[Google Scholar]
-
15.
Xu S, Tang H, Li J, Wang L, Zhang X, Gao H. A YOLOW Algorithm of Water-Crossing Object Detection.
Appl. Sci. 2023,
13, 15. doi:10.3390/app13158890.
[Google Scholar]
-
16.
Guo H, Bai H, Qin W. ClouDet: A Dilated Separable CNN-Based Cloud Detection Framework for Remote Sensing Imagery.
IEEE J. Sel. Top. Appl. Earth Observ. Remote Sens. 2021,
14, 9743–9755. doi:10.1109/JSTARS.2021.3114171.
[Google Scholar]
-
17.
Cao Z, Li Z, Fang L, Li J, Yang H, Hui D. Research on coal and gangue segmentation based on MFCCM - Mask R – CNN.
Energy Sci. Eng. 2024,
12, 2958–2973. doi:10.1002/ese3.1797.
[Google Scholar]
-
18.
Nam K, Lee D, Kang S, Lee S. Performance evaluation of mask R-CNN for lung segmentation using computed tomographic images.
J. Korean Phys. Soc. 2022,
81, 346–353. doi:10.1007/s40042-022-00532-9.
[Google Scholar]
-
19.
Zhang C, Zhou J, Wang H, Lian J, Ma Q, Zhang J, et al. Multi-Species Individual Tree Segmentation and Identification Based on Improved Mask R-CNN and UAV Imagery in Mixed Forests.
Remote Sens. 2022,
14, 22. doi:10.3390/rs14040874.
[Google Scholar]
-
20.
Jia X, Ai B, Deng Y, Xu X, Peng H, Shen H. PC2D simulation and optimization of the selective emitter solar cells fabricated by screen printing phosphoric paste method.
Jpn. J. Appl. Phys. 2015,
54, 9. doi:10.7567/JJAP.54.08KD23.
[Google Scholar]
-
21.
Chanchangi YN, Ghosh A, Sundaram S, Mallick TK. An analytical indoor experimental study on the effect of soiling on PV , focusing on dust properties and PV surface material.
Sol. Energy 2020,
203, 46–68. doi:10.1016/j.solener.2020.03.089.
[Google Scholar]
-
22.
Khan Z, Yang J. Image segmentation via multi dimensional color transform and consensus based region merging.
Multimed. Tools Appl. 2019,
78, 31347–31364. doi:10.1007/s11042-019-07906-5.
[Google Scholar]
-
23.
Sagar P, Upadhyaya A, Mishra SK, Pandey RN, Sahu SS, Panda G. A Circular Adaptive Median Filter for Salt and Pepper Noise Suppression from MRI Images.
J. Sci. Ind. Res. 2020,
79, 941–944.
[Google Scholar]
-
24.
Moghaddasi H, Hendriks RC, van der Veen A, de Groot NMS, Hunyadi B. Classification of De novo post-operative and persistent atrial fibrillation using multi-channel ECG recordings.
Comput. Biol. Med. 2022,
143, 14. doi:10.1016/j.compbiomed.2022.105270.
[Google Scholar]
-
25.
Yang GJ, Huang TS. The effect of median filtering on edge location estimation.
Comput. Graphics Image Proc. 1981,
15, 224–245.
[Google Scholar]
-
26.
Arias-Castro E, Donoho DL. Does Median Filtering Truly Preserve Edges Better Than Linear Filtering?
Ann. Stat. 2009,
37, 1172–1206, 10.1214/08-AOS604.
[Google Scholar]
-
27.
Wang P, Kong M, Wang L, Ni L. The Effect of the Superhydrophobic Film on the Generation Efficiency of Photovoltaic Modules Affected by Salt-Containing Dust Deposition.
IEEE J. Photovolt. 2019,
9, 1727–1732. doi:10.1109/JPHOTOV.2019.2930909.
[Google Scholar]
-
28.
Anzaku ET, Wang H, Babalola A, Van Messem A, De Neve W. Re-assessing accuracy degradation: a framework for understanding DNN behavior on similar-but-non-identical test datasets.
Mach. Learn. 2025,
114, 22. doi:10.1007/s10994-024-06693-x.
[Google Scholar]
-
29.
Zhong Y. A Theory of Semantic Information.
China Commun. 2017,
14, 1–17.
[Google Scholar]
-
30.
Lin KC. On improvement of the computation speed of Otsu 's image thresholding.
J. Electron. Imaging 2005,
14, 12. doi:10.1117/1.1902997.
[Google Scholar]
-
31.
Gatos B, Pratikakis I, Perantonis SJ. Adaptive degraded document image binarization.
Pattern Recognit. 2006,
39, 317–327. doi:10.1016/j.patcog.2005.09.010.
[Google Scholar]
-
32.
Garcia G, Herman I. Advances in Computer Graphics: Images: Synthesis, Analysis, and Interaction; Springer: London, UK, 1986.
-
33.
Liu C, Xie F, Dong X, Gao H, Zhang H. Small Target Detection From Infrared Remote Sensing Images Using Local Adaptive Thresholding.
IEEE J. Sel. Top. Appl. Earth Observ. Remote Sens. 2022,
15, 1941–1952. doi:10.1109/JSTARS.2022.3151928.
[Google Scholar]
-
34.
Liu Z, Bai X, Sun C, Zhou F, Li Y. Infrared ship target segmentation through integration of multiple feature maps.
Image Vis. Comput. 2016,
48–49, 14–25, 10.1016/j.imavis.2015.12.005.
[Google Scholar]
-
35.
AlSaeed D, Bouridane A, El-Zaart A. A Novel Fast Otsu Digital Image Segmentation Method.
Int. Arab J. Inf. Technol. 2016,
13, 427–434.
[Google Scholar]
-
36.
Bouwmans T, Javed S, Zhang H, Lin Z, Otazo R. On the applications of robust pca in image and video processing.
Proc. IEEE 2018,
106, 1427–1457.
[Google Scholar]
-
37.
He K, Gkioxari G, Dollar P, Girshick R. Mask R-CNN.
IEEE Trans. Pattern Anal. Mach. Intell. 2020,
42, 386–397. doi:10.1109/TPAMI.2018.2844175.
[Google Scholar]
-
38.
Ren S, He K, Girshick R, Sun J. Faster R-CNN: Towards Real-Time Object Detection with Region Proposal Networks.
IEEE Trans. Pattern Anal. Mach. Intell. 2017,
39, 1137–1149. doi:10.1109/TPAMI.2016.2577031.
[Google Scholar]
-
39.
Khan M.A, Akram T, Zhang Y, Sharif M. Attributes based skin lesion detection and recognition : A mask RCNN and transfer learning - based deep learning framework.
Pattern Recognit. Lett. 2021,
143, 58–66. doi:10.1016/j.patrec.2020.12.015.
[Google Scholar]
-
40.
Perez-Borrero I, Marin-Santos D, Gegundez-Arias ME, Cortes-Ancos E. A fast and accurate deep learning method for strawberry instance segmentation.
Comput. Electron. Agr. 2020,
178, 12. doi:10.1016/j.compag.2020.105736.
[Google Scholar]
-
41.
Kumar NM. Subramaniam U, Mathew M, Ajitha A, Almakhles D.J. Exergy analysis of thin-film solar PV module in ground-mount , floating and submerged installation methods.
Case Stud. Therm. Eng. 2020,
21, 11. doi:10.1016/j.csite.2020.100686.
[Google Scholar]
-
42.
Lee MCH, Braet J, Springael J. Performance Metrics for Multilabel Emotion Classification : Comparing Micro , Macro , and Weighted F1-Scores.
Appl. Sci. 2024,
14, 21. doi:10.3390/app14219863.
[Google Scholar]
-
43.
Wang X, Wang S, Guo Y, Jia X, Hu K, Cheng G. Multi-scale coal and gangue detection in dense state based on improved Mask RCNN.
Measurement 2023,
221, 15. doi:10.1016/j.measurement.2023.113467.
[Google Scholar]
 Mengmeng Liu
1,2
Yichu Li
1
Jijian Lian
1,2
Mengmeng Liu
1,2
Yichu Li
1
Jijian Lian
1,2