High-Entropy Alloys (HEAs) are complex metallic systems composed of five or more elements with nearly equiatomic concentrations. In most cases, HEAs form single-phase solid solutions with face-centered cubic (FCC) or body-centered cubic (BCC) crystal structures [
1,
2,
3,
4]. Due to the incorporation of chemically and structurally diverse elements, these lattices undergo significant distortion [
5,
6,
7,
8], which in turn influences their mechanical properties, phase stability, and potential functional applications.
These alloys exhibit significantly higher mixing entropy $$\Delta S_{m i x}$$ than conventional multi-component alloys, which is the basis for their name [
1].
According to Boltzmann’s hypothesis, the mixing entropy of an
n element regular solution alloy is determined by the Gibbs entropy formula:
where $$C_{i}$$ is the mole percent of the component and $$\sum\limits_{i = 1}^{n} C_{i} = 1$$.
The explanation for the increased value of entropy in HEA is based on the concept of thermodynamics, which states that the entropy of mixing between soluble components is maximum when these components are in equiatomic concentration [
9]. In this case:
where $$R$$ is the gas constant, and $$n$$ is the number of components. Thus mixing entropy $$\Delta S_{m i x}$$ increases with the increasing number of components.
By various authors, HEAs are usually called multi-component alloys in which $$\Delta S_{m i x} \geq 1 . 5 \div 1 . 61$$ [
10].
The change in Gibbs free energy $$\Delta G_{m i x}$$ when mixing HEA components is determined by the relation:
where $$\Delta H_{m i x}$$ is the change in enthalpy of mixing, $$T$$ is the temperature.
The calculation of $$\Delta H_{m i x}$$ is described by the following equation [
10,
11,
12]:
where $$\Delta H_{m i x}^{i j}$$ is defined as the mixing enthalpy of binary $$i - j$$ alloys in the liquid state.
Hence, the contribution of the entropy of mixing $$\Delta S_{m i x}$$ during the formation of HEAs reduces the free energy $$\Delta G_{m i x}$$. As a result, the likelihood of forming substitutional solid solutions with simple crystal lattices (fcc and bcc) significantly increases. Such lattices are significantly distorted, because they are formed by atoms of different elements with varying electronic structures and atomic sizes.
Due to these features, the properties of HEAs compare favourably with the properties of traditional alloys obtained by alloying one base component: they have a favourable combination of strength and ductility, high resistance to thermal and mechanical influences and high corrosion resistance.
One of the most studied model systems of high-entropy alloys is $$\mathrm{A l_{x} C o C r C u F e N i ; x = 0 \div 1}$$. It has been established that the phase composition of such alloys is determined by both the aluminum molar ratio x [
12] and the solidification cooling rate [
13].
In the case x = 0.5, HEA Al
0.5CoCrCuFeNi tends to be predominantly single-phase with fcc lattice [
13,
14]. It has been established that for this alloy $$\Delta H_{m i x} = - 1 . 52\, \mathrm{\frac{k J}{m o l}}$$, $$\Delta S_{m i x} = 14 . 7 \,\mathrm{\frac{J}{K \cdot m o l}}$$ [
13]; the ordering temperature is 968 K, the melting point of Cu-rich phase is 1426 K, the solidus temperature is 1552 K, and the liquidus temperature is 1635 K [
12]. The melting points of the chemical components of the high-entropy alloy Al
0.5CoCrCuFeNi are given in
.
.
Melting point of chemical components [13,15,16] and nominal compositions of high-entropy alloy Al0.5CoCrCuFeNi.
| Chemical Element |
Al |
Cr |
Fe |
Co |
Ni |
Cu |
| melting point, K |
933 |
2180 |
1811 |
1768 |
1728 |
1358 |
| nominal compositions of the HEA, at. % |
9.091 |
18.1818 |
18.1818 |
18.1818 |
18.1818 |
18.1818 |
High-Entropy Alloys (HEAs), composed of multiple principal elements in near-equiatomic ratios, have garnered significant attention due to their exceptional mechanical strength, thermal stability, and corrosion resistance. These properties make HEAs highly attractive for the fabrication of complex metallic components via Additive Manufacturing (AM) technologies [
17].
HEA Al
0.5CoCrCuFeNi, due to its outstanding mechanical performance and corrosion resistance, have emerged as promising candidates for manufacturing intricate metallic components via AM [
18,
19]. In particular, for Powder Bed Fusion (PBF) methods tailored for metal processing—such as Selective Laser Melting (SLM), Direct Metal Laser Sintering (DMLS), and Electron Beam Melting (EBM). These methods enable the fabrication of dense, high-strength structures with superior mechanical properties and complex geometries and high dimensional precision. Recent studies have shown that HEAs fabricated via SLM can achieve tensile strengths exceeding 1 GPa while maintaining ductility, thanks to refined grain structures and solid-solution strengthening [
17,
20].
Moreover, HEAs exhibit intrinsic biocompatibility and corrosion resistance, making them promising candidates for biomedical applications, including orthopedic implants and surgical tools. Their ability to maintain structural integrity in physiological environments positions them as viable alternatives to conventional titanium or cobalt-chromium alloys [
17].
However, the phase composition and microstructure of HEAs are highly sensitive to processing parameters such as laser power, scan speed, and cooling rate. This sensitivity leads to significant variability in phase formation, grain morphology, and defect distribution. While several studies have explored these relationships [
17,
18,
19,
20,
21], the current understanding remains incomplete, particularly regarding the interplay between AM-induced thermal gradients and phase stability.
Recent reviews have also highlighted the potential of Direct Energy Deposition (DED) techniques for producing large-scale HEA components with tailored compositions and gradient structures [
20]. Additionally, binder jetting and material extrusion methods are being investigated for producing HEA green bodies that undergo sintering to achieve full density, expanding the design space for functional components [
20].
Since the phase composition and microstructure of the Al
0.5CoCrCuFeNi alloy highly depend on the conditions of obtaining the samples, cooling rate and post-processing treatments, grain morphology and defect structures) [
13]. However, currently known studies [
13,
14,
22] of its structure are still limited in scope and require further exploration to fully understand the structure—property relationships.
In this publication, we present a comprehensive analysis of HEA Al
0.5CoCrCuFeNi samples produced under varying conditions, employing a combination of optical microscopy, scanning and transmission electron microscopy, and X-ray diffraction techniques. By correlating microstructural features with processing parameters, we aim to contribute to the growing body of knowledge on HEA behaviour in AM environments and support the development of optimized manufacturing strategies for next-generation metallic systems.
The initial ingot of the multi-component alloy, composed of 4.46 wt.% aluminium, 19.48 wt.% cobalt, 21.02 wt.% copper, 17.18 wt.% chromium, 19.4 wt.% nickel, and 18.46 wt.% iron, was produced by remelting high-purity (≈99.9%) components on a copper water-cooled hearth in an arc furnace, utilizing a non-consumable tungsten electrode. The remelting process was conducted in the atmosphere of purified argon. To achieve a uniform distribution of elements, the alloy underwent five remelting cycles, with periodic turnover on the hearth.
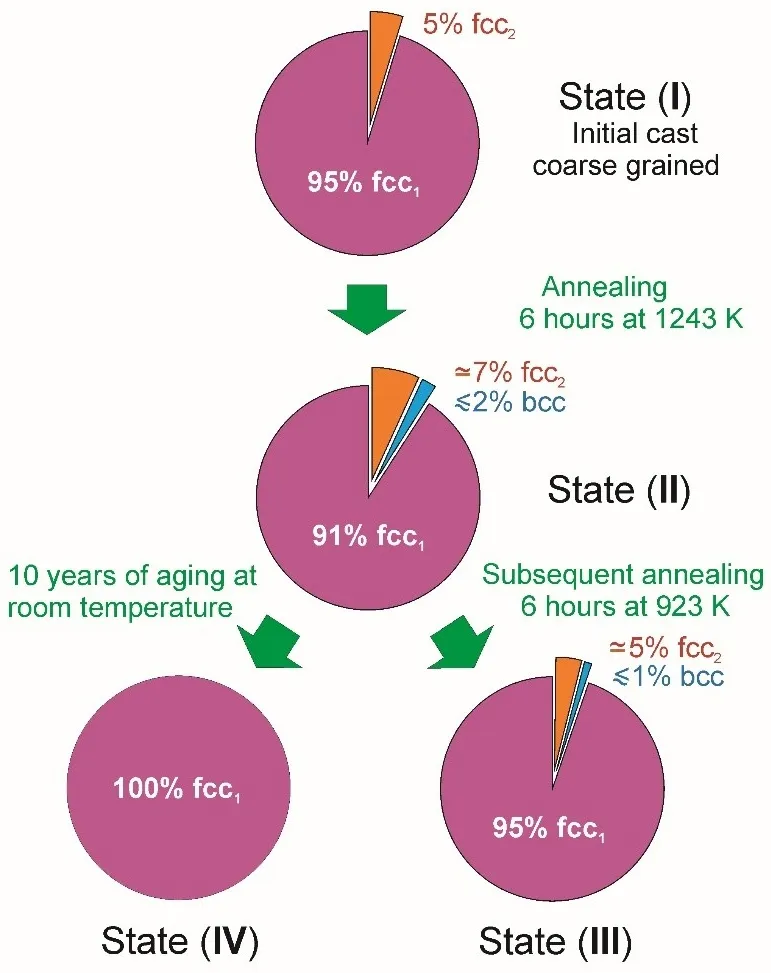
It was decided to study the structural characteristics of not only the initial cast coarse-grained state (I), but also their characteristics after a series of long-term high-temperature annealings: (II)—after high-temperature annealing in vacuum at 1243 K for 6 h; (III)—high-temperature annealing at 1243 K for 6 h with subsequent annealing at 923 K for 6 h; (IV)—high-temperature annealing in vacuum at 1243 K for 6 h (the results were taken after 10 years of aging at room temperature after annealing). Annealing was performed in a vacuum. Following the annealing process, the samples were cooled along with the furnace at a rate of 4–5 degrees per minute until reaching 770 K. This choice of heat treatment modes is due to the fact that the mechanical and acoustic properties of the HEA Al
0.5CoCrCuFeNi for structural states (I) and (IV) have been studied in detail in [
23,
24,
25,
26,
27,
28]. The scheme for obtaining the studied structural states (I)–(IV) is shown in
.
. The scheme for obtaining the studied structural states (I)–(IV) of high-entropy alloy Al<sub>0.5</sub>CoCrCuFeNi.
The metallographic analysis [
24] presented in
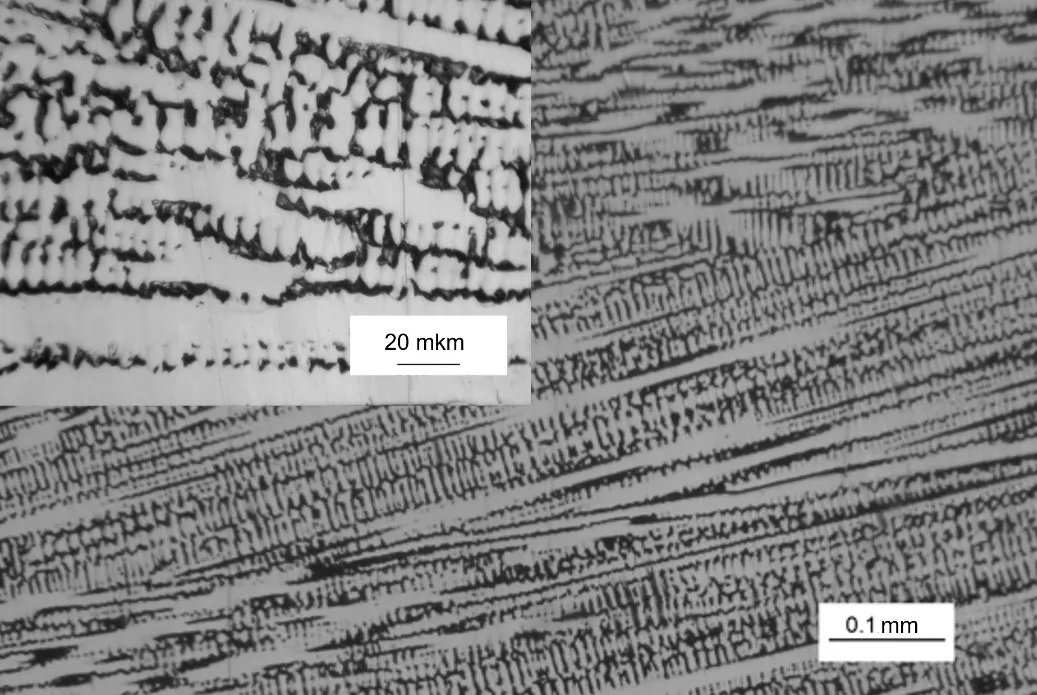
reveals that the microstructure of the alloy in the initial state (I) exhibits a characteristic dendritic pattern, consisting primarily of a dense body of dendrites as the main structural component, along with interdendritic spaces. Such a crystallographic texture inevitably forms when creating blanks from alloys using the argon-arc method with directed heat removal.
. Microstructure of a sample of high-entropy alloy Al<sub>0.5</sub>CoCrCuFeNi in the initial cast state (I). The inset shows the structure on a larger scale.
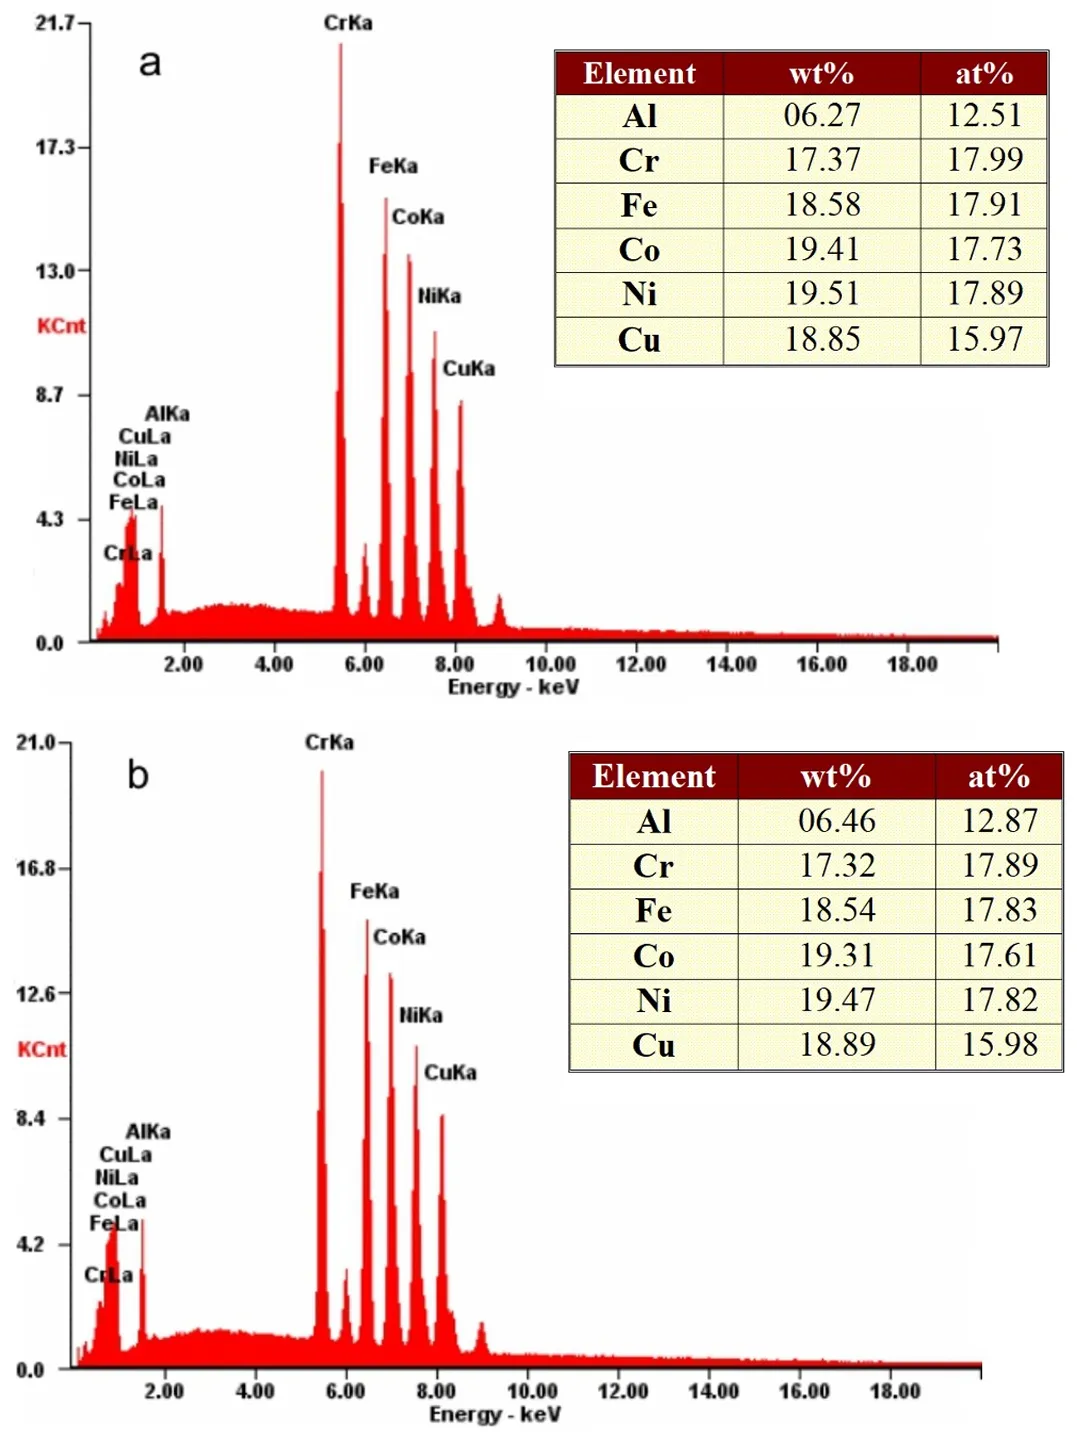
The elemental composition of the obtained ingots was studied by energy dispersive X-ray spectroscopy (EDS). Two samples (
A and
B) cut from different neighbouring regions of the ingot of the high-entropy alloy Al
0.5CoCrCuFeNi in structural state (II) were examined.
shows the results of determining the elemental composition of the alloy under study. The electron microscopy imaging of the sample and its elemental composition were studied using a Field Emission Scanning Electron Microscope (FE-SEM) FEI Nova Nano SEM 230 (Hillsboro, OR, USA) a Quanta 3D FEG (Quanta, Hillsboro, OR, USA) systems along with energy dispersive X-ray spectrometer EDAX Genesis XM4 (EDAX Inc., Mahwah, NJ, USA).
. The EDS patterns for the high-entropy alloy Al<sub>0.5</sub>CoCrCuFeNi in structural state (II): (<b>a</b>,<b>b</b>)—pattern for two different regions of the ingot (<b>A</b> and <b>B</b>, respectively).
It was found that the composition of the two samples studied differs slightly. These data correlate with the presence of dendritic structure (see
) and may indicate the presence of noticeable differences in the elemental chemical composition of dendrites and interdendritic spaces.
3.1. Dendritic Structure of the High-Entropy Alloy Al0.5CoCrCuFeNi
X-ray studies of the dendritic structure in structural states (I)–(III) were carried out on a DRON-2 (Federal State Unitary Enterprise “Institute for Analytical Instrumentation”, Saint Petersburg, Russia) serial diffractometer in Fe
Kα (states (I)) and Cu
Kα (states (II) and (III)) radiation using a selectively absorbing manganese filter [
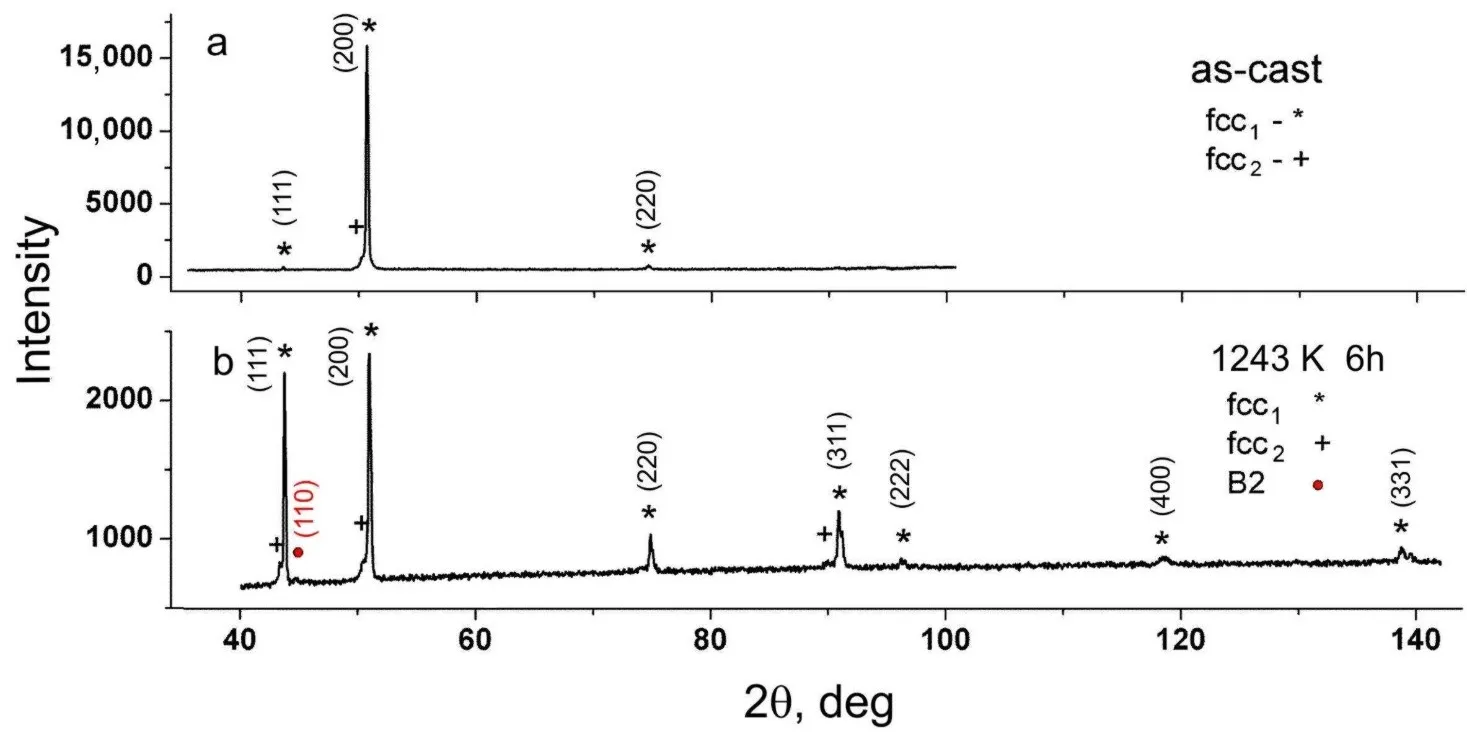
24]. According to X-ray diffraction (XRD) data, the branches of dendrites and interdendritic regions had two different face-centred cubic (fcc) crystal structures with very close lattice parameters, while the ratio of the intensities of diffraction reflections indicates the presence of a predominant crystallite orientation in the samples. Taking into account the ratio of the intensities of diffraction reflections in XRD patterns and the estimation of the volume fraction of phases according to metallography data, dendrites correspond to a phase with a lower lattice parameter fcc
1, and the interdendritic region corresponds to a phase, which has a larger lattice parameter fcc
2. The results of X-ray studies are shown in
and
, and
,
and
.
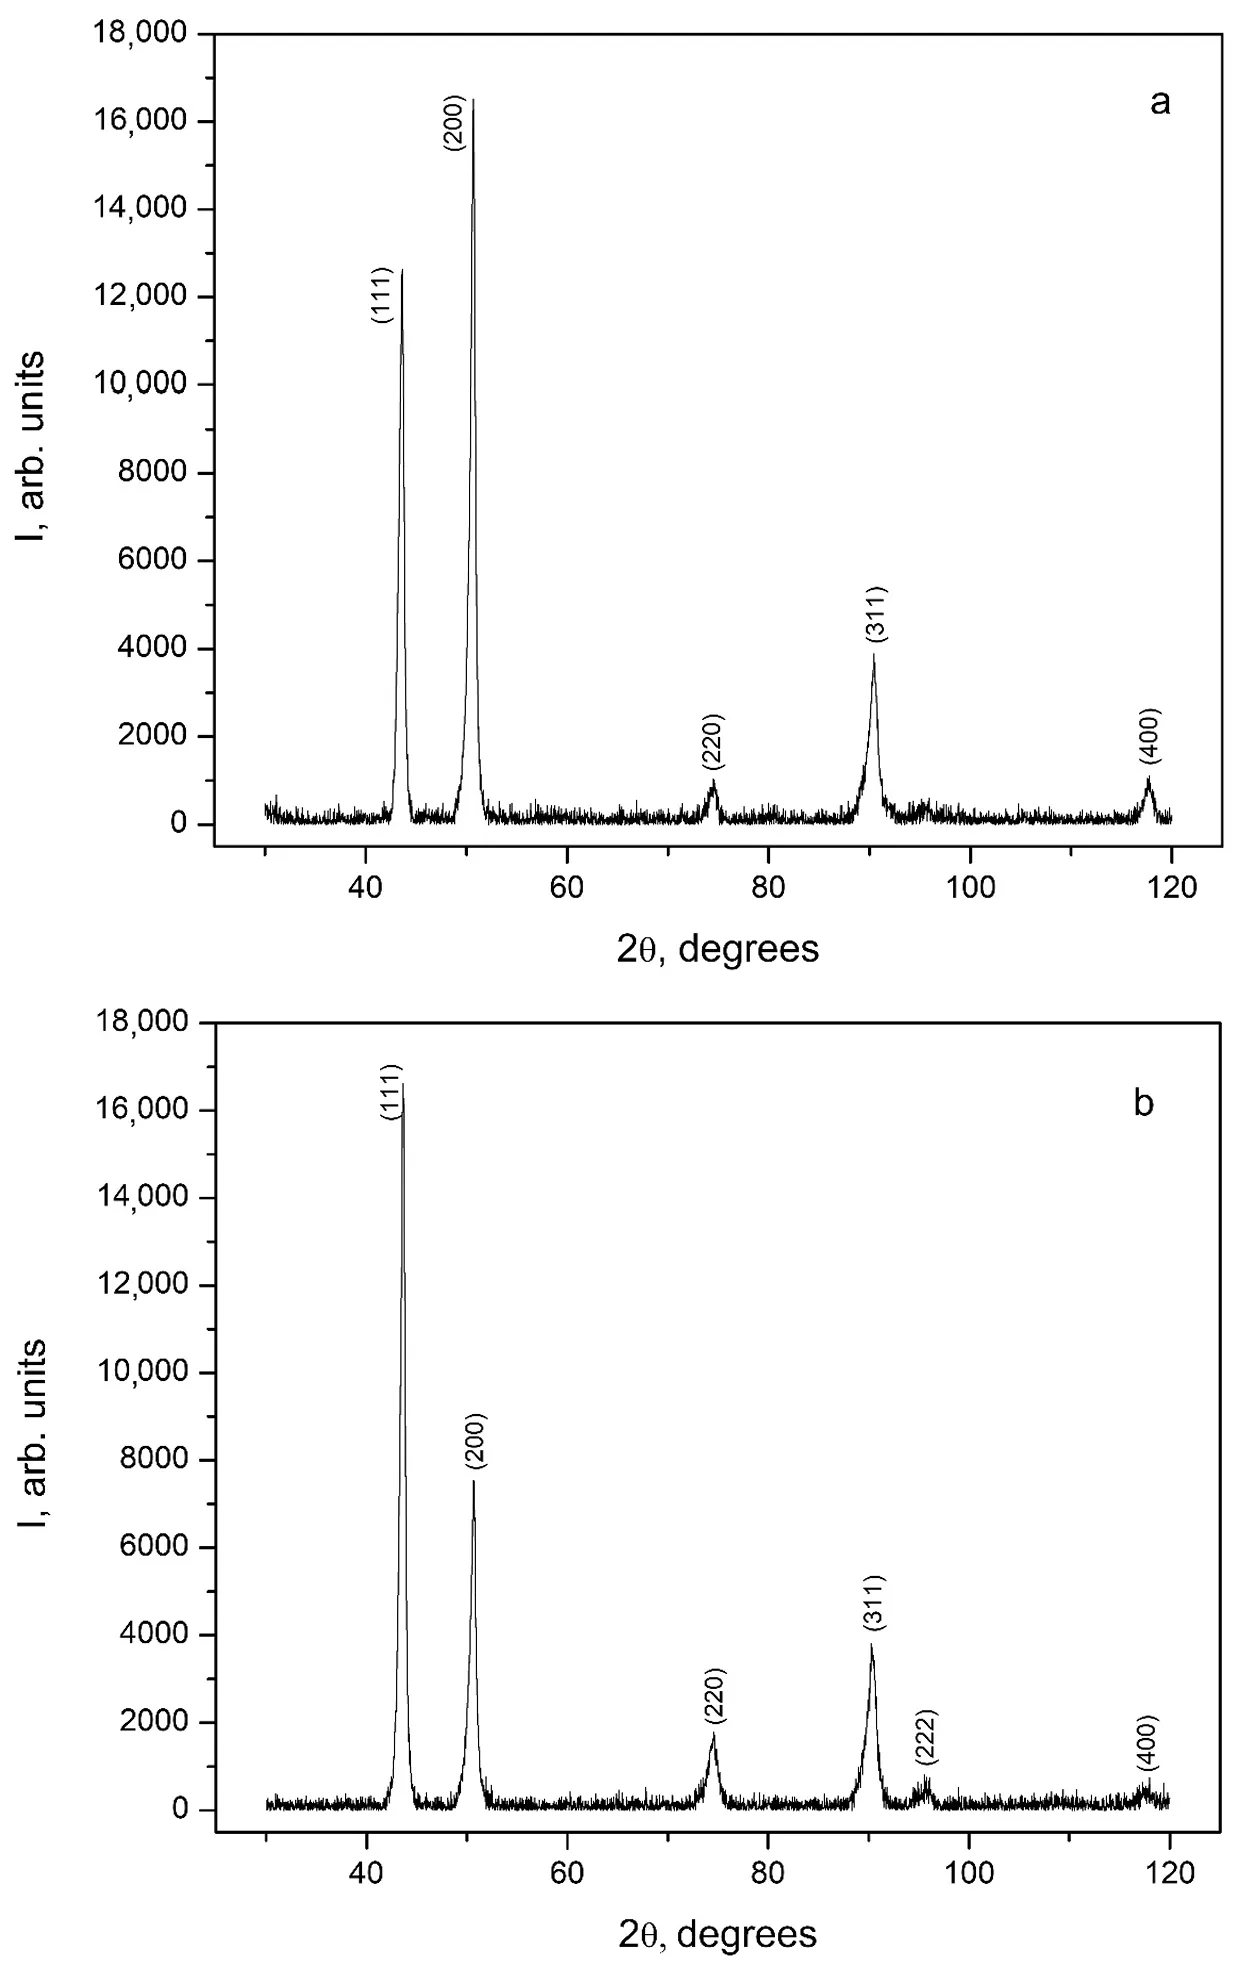
. X-ray diffraction patterns of the high-entropy alloy Al<sub>0.5</sub>CoCrCuFeNi: (<b>a</b>) initial cast structural state (I); (<b>b</b>) after annealing at 1243 K for 6 h—structural state (II).
.
X-ray diffraction data of the Al0.5CoCrCuFeNi HEA in the initial cast structural state (I). The measurements were performed in FeKα anode radiation, the values of the 2θ angles for CuKα radiation were obtained by recalculation using the formula $$\mathrm{sin} 2 \theta_{\mathrm{C u} K_{\alpha}} = \frac{\lambda_{\mathrm{C u} K_{\alpha}}}{\lambda_{\mathrm{F e} K_{\alpha}}} \mathrm{sin} 2 \theta_{\mathrm{F e} K_{\alpha}}$$; $$\lambda_{\mathrm{F e} K_{\alpha}} = 1 . 937\, \overset{\circ}{ \mathrm{A}}$$, $$\lambda_{\mathrm{C u} K_{\alpha}} = 1 . 541\, \overset{\circ}{ \mathrm{A}}$$.
| Phase |
Miller Indices,
hkl |
2θ Angle,
deg
(FeKα) |
2θ Angle,
deg
(CuKα) |
Intensity,
imp/s |
Lattice Parameter a,
Å |
| fcc1 |
111 |
55.573 |
43.56 |
194.6 |
3.596 |
| 200 |
65.079 |
50.52 |
14,438.7 |
| 220 |
99.183 |
74.58 |
220.0 |
| fcc2 |
200 |
64.568 |
50.44 |
791.0 |
3.625 |
.
X-ray diffraction data of the Al0.5CoCrCuFeNi HEA in the structural state (II).
| Phase |
Miller Indices,
hkl |
2θ Angle,
deg
(CuKα) |
Intensity,
imp/s |
Lattice Parameter a,
Å |
| fcc1 |
111 |
43.672 |
1551.5 |
3.588 |
| 200 |
50.873 |
1619.0 |
| 220 |
74.789 |
249.5 |
| 311 |
90.814 |
351.7 |
| 222 |
96.113 |
68.7 |
| 400 |
118.334 |
46.7 |
| 331 |
138.696 |
92.2 |
| fcc2 |
111 |
43.250 |
139.2 |
3.620 |
| 200 |
50.390 |
123.1 |
| 311 |
89.784 |
45.8 |
bcc
(type B2)
|
110 |
44.610 |
42.0 |
2.870 |
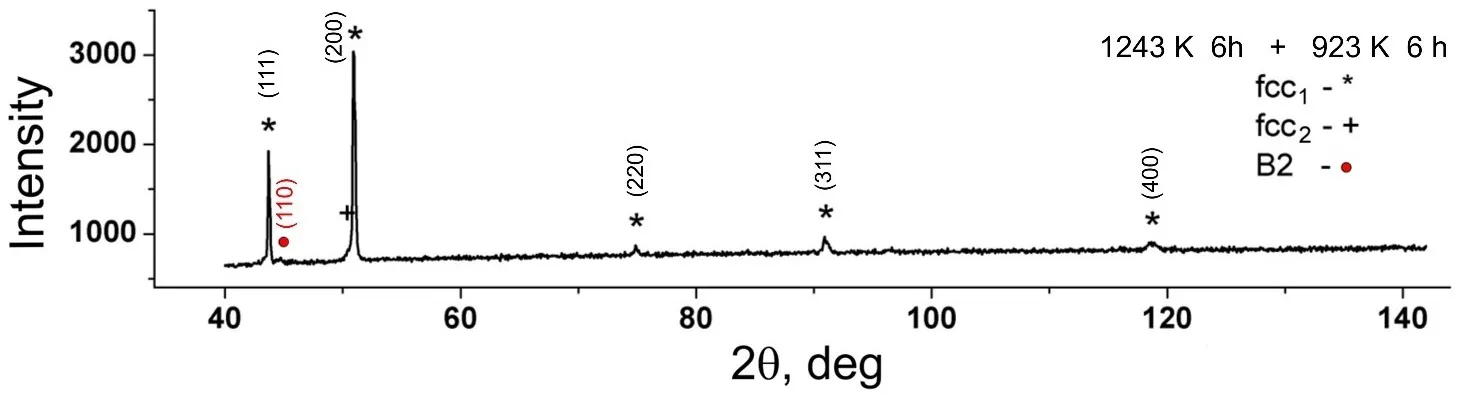
. X-ray diffraction patterns of the high-entropy alloy Al<sub>0.5</sub>CoCrCuFeNi after high-temperature annealing at 1243 K for 6 h with subsequent annealing at 923 K for 6 h—structural state (III).
.
X-ray diffraction data of the Al0.5CoCrCuFeNi HEA in the structural state (III).
| Phase |
Miller Indices,
hkl |
2θ Angle,
deg
(CuKα) |
Intensity,
imp/s |
Lattice Parameter a,
Å |
| fcc1 |
111 |
43.696 |
739.5 |
3.584 |
| 200 |
50.920 |
2173.6 |
| 220 |
74.859 |
97.7 |
| 311 |
90.901 |
166.0 |
| 400 |
118.565 |
70.0 |
| fcc2 |
111 |
43.264 |
44.4 |
3.617 |
| 200 |
50.420 |
115.7 |
bcc
(type B2)
|
110 |
44.691 |
51.0 |
2.865 |
X-ray diffraction (XRD) measurements for structural state (IV) were performed using a PANalytical X’Pert PRO diffractometer (Malvern Panalytical, Almelo, The Netherlands), renowned for its high angular resolution and suitability for peak broadening analysis. The experiments were conducted at the Institute of Low Temperature and Structure Research, Polish Academy of Sciences. XRD patterns were recorded at room temperature in Bragg-Brentano geometry over 2θ range: from 30° to 120°, with a Cu
Kα anode radiation.
presents XRD patterns obtained from two different adjacent regions (
A and
B) of the alloy sample in structural state (IV). The most characteristic reflections are marked with the corresponding Miller indices.
. The XRD patterns of two samples (<strong>A</strong> and <strong>B</strong>) cut from different adjacent regions of a high-entropy alloy Al<sub>0.5</sub>CoCrCuFeNi sample in structural state (IV): (<strong>a</strong>,<strong>b</strong>)—pattern for two different regions (<strong>A</strong> and <strong>B</strong>, respectively).
summarizes the results of diffraction patterns processing in structural state (IV) (see
). It was found that the XRD patterns contain reflections from a single fcc
1 lattice with an average lattice parameter of $$\overset{-}{a} = 3 . 605 \,\overset{\circ}{\mathrm{A}}$$. In the structural state (IV), the phases fcc
1 and bcc present in the state (II) are not identified. The observed disappearance of the bcc phase in the Al
0.5CoCrCuFeNi high-entropy alloy after 10 years of exposure at room temperature may be attributed to the metastable nature of the bcc phase formed during the initial processing state (II). Over extended time scales, extremely slow atomic diffusion—even at ambient conditions—could facilitate a gradual transformation toward a more thermodynamically stable fcc structure or lead to phase homogenization. This suggests long-term structural relaxation processes may occur in high-entropy alloys without external thermal activation. So, the disappearance of the bcc phase in the Al
0.5CoCrCuFeNi alloy after 10 years at room temperature may indicate a slow diffusion-driven transformation toward a more thermodynamically stable configuration. Previous studies have shown that HEAs often form metastable phases during rapid solidification or mechanical processing, which may gradually evolve over time even without thermal activation [
1,
5,
10]. The high configurational entropy and lattice distortion in these alloys suppress fast diffusion, but do not eliminate it entirely. Thus, extremely slow atomic rearrangements may lead to phase homogenization or transformation, even at ambient conditions. The long-term structural evolution of HEAs remains an area of active investigation.
.
The result of the XRD patterns analysis of Al0.5CoCrCuFeNi HEA in the structural state (IV).
| Sample |
Miller
Indices,
hkl |
2$$\bm{\theta}$$ Angle, deg |
Interplanar
Spacing
d, Å |
FWHM,
Degrees |
Intensity,
imp/s |
Area |
Average
Parameter
a, Å |
A
see
а
|
111 |
43.507 |
2.078 |
0.61 |
8774 |
7890.76 |
3.604 |
| 200 |
50.580 |
1.803 |
0.55 |
11,139 |
9634.35 |
| 220 |
74.340 |
1.275 |
1.10 |
615 |
1116.99 |
| 311 |
90.270 |
1.087 |
0.98 |
2518 |
3973.00 |
| 400 |
117.540 |
0.900 |
1.10 |
685 |
1134.59 |
B
see
b
|
111 |
43.560 |
2.076 |
0.57 |
11,146 |
9074.80 |
3.606 |
| 200 |
50.560 |
1.804 |
0.68 |
4998 |
5363.54 |
| 220 |
74.420 |
1.274 |
1.09 |
1082 |
1772.99 |
| 311 |
90.220 |
1.087 |
1.08 |
2506 |
4241.30 |
| 222 |
95.480 |
1.040 |
1.80 |
309 |
590.32 |
| 400 |
117.30 |
0.902 |
1.38 |
197 |
496.60 |
Data of scanning electron microscopy using an X-ray microanalyser [
24] (see
and
) show that the elemental composition of dendrites and interdendritic spaces is significantly different.
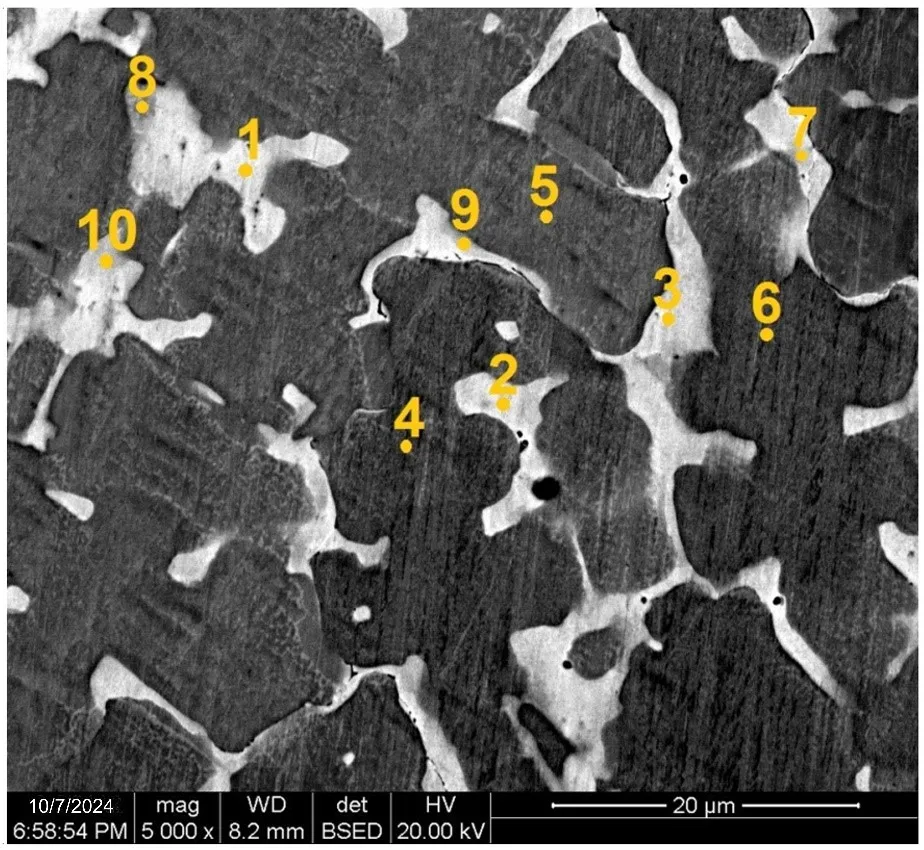
. The data of scanning electron microscopy using an X-ray microanalyser for Al<sub>0.5</sub>CoCrCuFeNi HEA in the initial cast state (I). Points 1–10 denote the measurement sites used for chemical composition analysis.
.
Chemical composition of high-entropy alloy Al0.5CoCrCuFeNi in the initial cast structural state (I) according to X-ray microanalysis data.
| Region |
Point of Scanning |
Chemical Element |
Al,
at % |
Cr,
at % |
Fe,
at % |
Co,
at % |
Ni,
at % |
Cu,
at % |
interdendritic region,
fcc2
|
1 |
14.61 |
3.18 |
3.66 |
3.92 |
10.08 |
64.55 |
| 2 |
14.30 |
2.69 |
3.29 |
3.50 |
8.81 |
67.40 |
| 3 |
14.61 |
3.38 |
4.02 |
4.38 |
11.25 |
62.37 |
| boundary between dendrites and interdendritic region |
7 |
15.27 |
7.46 |
7.85 |
7.96 |
15.98 |
45.47 |
| 9 |
15.66 |
8.23 |
7.86 |
7.80 |
14.06 |
46.38 |
| 10 |
16.42 |
5.73 |
6.24 |
6.43 |
15.45 |
49.72 |
| unidentified region |
8 |
13.98 |
13.55 |
13.58 |
13.45 |
19.21 |
26.23 |
dendrites,
fcc1
|
4 |
8.78 |
21.74 |
21.13 |
20.61 |
17.83 |
9.91 |
| 5 |
7.81 |
22.59 |
22.25 |
21.67 |
16.84 |
8.83 |
| 6 |
7.92 |
22.60 |
22.12 |
21.28 |
17.03 |
9.05 |
The dendrites composition (points
4,
5,
6 in
) is enriched in iron, chromium, and cobalt by more than 20 at.% of each element and depleted in copper and aluminium less than 10 at.%. The interdendritic spaces (points
1,
2,
3 in
) are enriched in copper up to 65 at.% and contain a small amount (less than 4 at.%) of iron, chromium, and cobalt. The aluminium content in the interdendritic spaces is greater (about 15 at.%), which leads to an increase in the fcc lattice parameter. In addition, at the boundary between dendrites and interdendritic region, separate spaces are observed (points
7,
9,
10 in
) to be close in composition to the interdendritic region, but containing less copper and a higher amount of nickel, iron, chromium, and cobalt. Point
8 unidentified region, likely precipitates of intermetallic phases Al₂FeCo and AlNi, with chromium incorporated as a substituting element.
The diffraction pattern of the sample after annealing at 1243 K for 6 h (see
b and
) showed the presence of two fcc phases (fcc
1 and fcc
2), as well as traces of the bcc phase (type B2).
As a result, it was determined that annealing causes substantial alterations in the alloy’s structure and the chemical composition of its structural regions (see
and
).
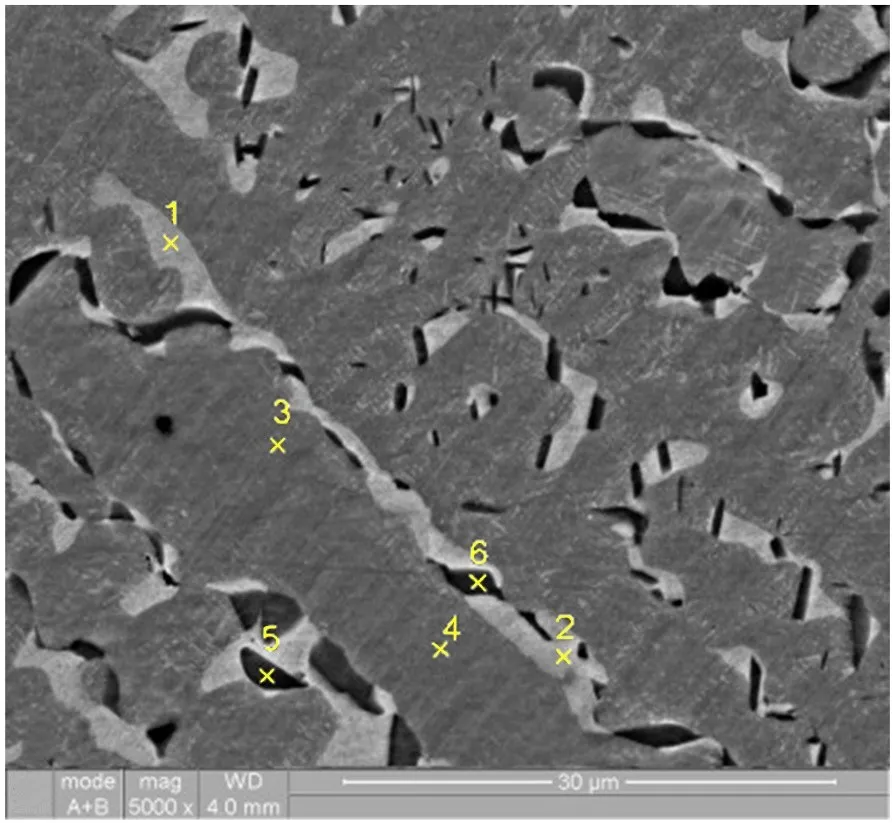
. The data of scanning electron microscopy using an X-ray microanalyser for Al<sub>0.5</sub>CoCrCuFeNi HEA in the structural state (III). Points 1–6 denote the measurement sites used for chemical composition analysis.
The composition of the dendritic regions (points
3 and
4 in
) remains almost unchanged. In contrast, the interdendritic regions (points
1 and
2 in
) exhibit a decrease in copper and aluminium content, while the concentrations of other elements increase. Additionally, bcc phase particles (points
5 and
6 in
) predominantly form at the boundaries between the dendritic and interdendritic regions, enriched with nickel ≈ 30%, aluminium > 20%, and copper >2 0%.
.
Chemical composition of high-entropy alloy Al0.5CoCrCuFeNi in the structural state (III) according to X-ray microanalysis data.
| Region |
Point of Scanning |
Chemical Element |
Al,
at % |
Cr,
at % |
Fe,
at % |
Co,
at % |
Ni,
at % |
Cu,
at % |
interdendritic region,
fcc2
|
1 |
8.92 |
6.39 |
6.37 |
6.28 |
15.48 |
56.56 |
| 2 |
7.51 |
6.21 |
5.88 |
5.79 |
12.55 |
62.05 |
bcc
(type B2)
|
5 |
21.07 |
6.34 |
8.99 |
11.31 |
30.03 |
22.26 |
| 6 |
21.44 |
7.03 |
8.32 |
10.09 |
25.23 |
27.88 |
dendrites,
fcc1
|
3 |
5.99 |
22.39 |
21.48 |
20.58 |
18.17 |
10.79 |
| 4 |
6.04 |
21.72 |
21.22 |
20.64 |
18.84 |
11.54 |
The elevated concentration of copper in the interdendritic region can be attributed to its relatively high enthalpy of mixing with iron (13 kJ/mol), cobalt (10 kJ/mol) and nickel (4 kJ/mol). This indicates that copper has a low affinity for forming solutions with most of the matrix elements in the system [
16,
22]. Additionally, the relatively low melting point of copper likely plays a role in this distribution. The differences in melting points also explain the significant difference in chromium concentration between the dendritic and interdendritic regions. Among all elements in the system, chromium possesses the highest melting point, which is significantly greater than that of other alloy components (see
). As a result, Cr-rich regions are capable of solidifying from the melt at the highest temperature.
The distinctive behaviour of nickel stems from its solubility in both phases. With a melting point comparable to iron and cobalt, nickel differs from copper in that it does not exhibit a positive enthalpy of mixing with cobalt, chromium or iron, allowing it to integrate readily into the dendritic phase. Also, nickel is fully soluble in copper, resulting in its higher concentration in the interdendritic region than cobalt, chromium or iron.
This complex interplay between thermodynamic parameters and solidification kinetics governs the elemental partitioning observed in the alloy microstructure. The segregation of copper into the interdendritic regions is further enhanced by its tendency to remain in the liquid phase during solidification, thereby concentrating in the last-to-freeze areas. Conversely, elements with higher melting points and stronger mutual affinities, like chromium and iron, preferentially incorporate into the early-forming dendritic cores.
Moreover, the observed distribution patterns are consistent with the predictions of the Scheil-Gulliver solidification model [
29], which assumes negligible diffusion in the solid phase and complete mixing in the liquid. Under such conditions, solute rejection during dendrite growth leads to progressive enrichment of the remaining melt in elements like copper and nickel, which are less compatible with the primary solid phase.
These findings underscore the importance of thermodynamic factors—such as enthalpy of mixing and melting point—and kinetic aspects of solidification in determining the final microstructural architecture of HEAs. Understanding these mechanisms is essential for tailoring alloy compositions and processing conditions to achieve desired phase distributions and mechanical properties.
3.2. Dislocation Structure of the High-Entropy Alloy Al0.5CoCrCuFeNi
As seen (
,
), all reflections have a fairly large width at half peak height (greater than 0.5° in 2$$\theta$$). The obtaining reflections set was approximated by the Lorentz function. The Bragg peak experimental breadth $$\beta_{\exp}$$ is a combination of both instrument and sample-dependent effects [
30]. To remove these aberrations, a diffraction pattern must be constructed using the line broadening of a standard material to quantify the instrumental broadening. The instrument-corrected physical value of the Full Width at Half Maximum (FWHM) $$\beta_{h k l}$$ corresponding to the diffraction peak of the studied alloy was estimated using the relation:
where $$\beta_{\exp}$$ is the experimental value of the FWHM of the XRD reflex; $$\beta_{\mathrm{i n s t r}}$$ is the instrumental value of the FWHM of the X-ray reflection, which was determined based on the instrumental standards for crystallite size estimation.
It’s well known that $$\beta_{h k l}$$ is affected by not only particle size but also mechanical stresses that arise due to defects in a crystal structure. According to the Williamson-Hall (W-H) model [
31,
32] broadening $$\beta_{h k l}$$ is determined by the additive contribution of crystallite size $$\beta_{D}$$ and the lattice microstrain $$\beta_{S}$$:
As is generally accepted, the contribution to broadening of crystallite size $$\beta_{D}$$ is determined by the Debye–Scherrer equation [
33]:
$$\lambda$$ is the X-ray wavelength;
K is a dimensionless shape factor, with a value close to 1 [
33],
D is the mean size of the ordered (crystalline) domains, which may be smaller or equal to the grain size, which may be smaller or equal to the particle size (crystallite size); $$\theta$$ is the Bragg angle.
Crystal imperfections and distortion of strain-induced peak broadening within the uniform deformation model are related by $$\left⟨\epsilon\right⟩ \propto \frac{\beta_{S}}{\mathrm{tan} \theta}$$:
where $$\left⟨\epsilon\right⟩$$ is the mean square lattice micro strain. Thus
There is an extraordinary property of
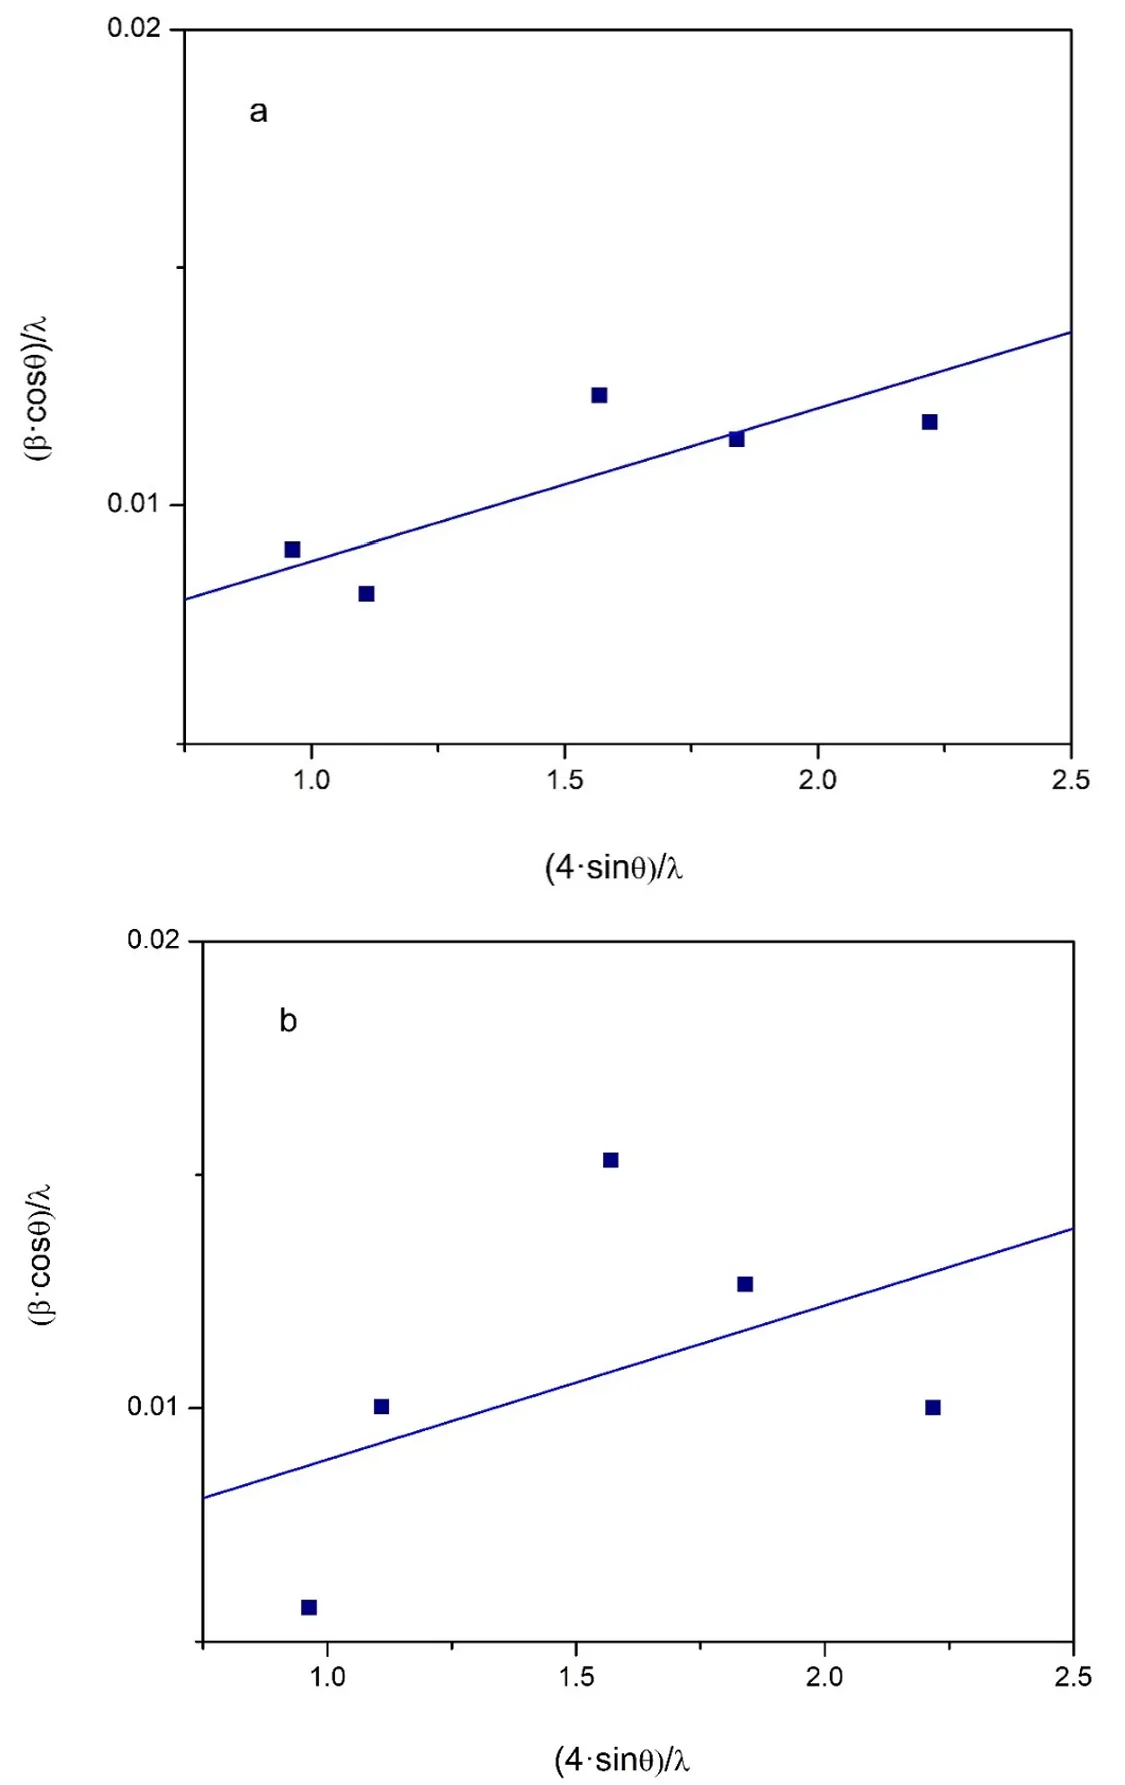
Equation (9) , which has a dependency on the diffraction angle $$\theta$$. The Debye-Scherrer equation follows only a $$\frac{1}{\mathrm{cos} \theta}$$ dependency, but not $$\mathrm{tan} \theta$$ as W-H model. Therefore, both crystallite size and strain can be estimated by plotting $$\frac{\beta_{h k l} \cdot \mathrm{cos} \theta}{\lambda}$$ against $$\frac{4 \cdot \mathrm{sin} \theta}{\lambda}$$ ($$\beta_{h k l}$$ in radian and $$\theta$$ in degree) for all the peaks and fitting the best line, the intercept and slope of the fitting line are $$\frac{K}{D}$$ and $$\left⟨\epsilon\right⟩$$, respectively.
shows the W-H plot for the specimens of the high-entropy alloy Al
0.5CoCrCuFeNi in structural state (IV).
. Williamson–Hall plot for the specimens of the high-entropy alloy Al0.5CoCrCuFeNi in structural state (IV): (<b>a</b>) is part <b>A</b> of the sample; (<b>b</b>) is part <b>B</b>.
The W-H analysis leads to the following empirical estimates: mean size of the ordered crystalline domains (particle size or coherent scattering regions) $$D^{A} = 17 . 7305 \, \mathrm{n m}$$, $$D^{B} = 17 . 857 \, \mathrm{n m}$$ and average value $$\overset{-}{D} \simeq 18 \, \mathrm{n m}$$; lattice micro strain $$\left⟨\epsilon\right⟩^{A} = 3 . 2 \cdot 1 0^{- 3}$$, $$\left⟨\epsilon\right⟩^{B} = 3 . 3 \cdot 1 0^{- 3}$$ and average value $$\left⟨\overset{-}{\epsilon}\right⟩ = 3 . 25 \cdot 1 0^{- 3}$$. The small size of the experimentally observed regions of coherent scattering in a coarse-grained sample may indicate the presence of a large number of low-angle boundaries. The role which can be played by the boundaries of clusters with the same chemical composition; such nanosized clusters were experimentally observed in the works [
13,
15].
Both of these parameters, obtained from W-H analysis, may be used for calculating the dislocation density [
33]. The dislocation density calculated from the particle size will be determined by the ratio:
where $$n$$ is the number of dislocations per block face, the value of
n must be determined or assumed. For our calculation we take $$n = 1$$; this value represents the minimum density of edge dislocations and is applicable to a structural state where the dislocations are almost randomly distributed [
32].
The dislocation density, determined from the strain broadening, is
the coefficient $$k$$ lies in the range 2 to 25. For the broadening effect caused by a screw dislocation $$k = 16 . 1$$ [
33] for fcc lattice with Burgers vector
b along [110].
Equation (11) can only be applied to the experimental results if the interaction factor $$F$$ is either known or assumed. The interaction factor $$F = 1$$ [
33], assuming that each dislocation aligns with the edge of a block. In this case, the dislocations are maximally separated, minimizing their interaction. Relations (10) and (11) lead to the following empirical estimates: $$\rho_{D}^{A} = 9 . 543 \cdot 1 0^{15} \,\mathrm{m}^{- 2}$$, $$\rho_{S}^{A} = 2 . 53 \cdot 10^{15} \,\mathrm{m}^{- 2}$$; $$\rho_{D}^{B} = 9 . 4 \cdot 1 0^{15} \, \mathrm{m}^{- 2}$$, $$\rho_{S}^{B} = 2 . 691 \cdot 1 0^{15} \,\mathrm{m}^{- 2}$$. For the case $$F = n$$, the average value of the dislocation density will be determined as the geometric mean:
Which leads to the following estimates for the studied samples of the high-entropy alloy Al
0.5CoCuNiFe: $$\rho^{A} = 4 . 914 \cdot 1 0^{15} \,\mathrm{m}^{- 2}$$, $$\rho^{B} = 5 . 031 \cdot 1 0^{15} \,\mathrm{m}^{- 2}$$ and $$\overset{-}{\rho} = 4 . 97 \cdot 1 0^{15} \,\mathrm{m}^{- 2}$$.
Although the conventional W-H method was employed to estimate microstrain and crystallite size, the relatively poor linear fitting suggests that the strain distribution may be non-uniform. Modified W-H approaches, such as the Uniform Deformation Model (UDM), Uniform Stress Deformation Model (USDM), and Uniform Deformation Energy Density Model (UDEDM), could provide more accurate and physically meaningful estimates [
34]. However, due to the limited number of diffraction peaks available in this study, the application of these models did not yield statistically reliable results. Future work involving more comprehensive diffraction data may allow for the implementation of these advanced methods.
Rietveld refinement, while widely recognized for its robustness in extracting detailed crystallographic information, was not employed in this study primarily due to the insufficient number of well-resolved diffraction peaks. As noted in previous literature, the reliability of Rietveld analysis significantly depends on the availability of a rich and high-quality diffraction pattern, typically containing numerous overlapping reflections that can be modeled simultaneously [
35]. In our case, the limited peak count and relatively low signal-to-noise ratio would have introduced substantial uncertainty into the refinement process, potentially leading to misleading structural interpretations [
36]. Nevertheless, the diffraction data were acquired using the high-resolution PANalytical X’Pert PRO diffractometer, which offers excellent angular precision and peak definition. This instrument is well-suited for microstructural analysis, including peak broadening studies and phase identification, and has been successfully used in similar investigations of nanocrystalline and multiphase materials [
37]. Its capabilities, such as the Bragg-Brentano geometry and high-speed X’Celerator detector (Malvern Panalytical, Almelo, The Netherlands), ensured the reliability of the peak positions and widths used in our W-H analysis.
In future studies, the use of extended scan ranges, longer acquisition times, and complementary techniques such as synchrotron radiation or neutron diffraction may help overcome current limitations and enable full-profile Rietveld refinement with greater confidence.
An estimate $$\sim 4 \cdot 1 0^{13}\, \mathrm{m}^{- 2}$$ of the total length of dislocation segments per unit volume was obtained within the Koiwa-Hasiguti model for the relaxation process of sound absorption at $$T_{p} = 228\, \mathrm{K}$$ [
28]. The obtained value is less than the value $$\sim 5 \cdot 1 0^{15} \, \mathrm{m}^{- 2}$$ of total dislocation density obtained by the X-ray diffraction analysis. This observation aligns with the well-established concept that a substantial portion of dislocations tends to accumulate along grain boundaries, where they contribute to localized strain fields but remain largely inactive in terms of dynamic mechanical response. In contrast, only those dislocation segments situated within the grain interiors—and possessing a favorable crystallographic orientation relative to the direction of acoustic wave propagation—are capable of effectively coupling with the cyclic deformation of the sample. These intragranular dislocations can resonate with the elastic vibrations, thereby influencing the internal friction and energy dissipation mechanisms observed during mechanical spectroscopy. Their selective activation underscores the anisotropic nature of dislocation mobility and highlights the importance of microstructural configuration in determining the material’s dynamic mechanical behavior.
It is well established that alloying elements such as Al, Cr, and Cu tend to form solid solutions or intermetallic compounds in multi-component systems. These phases can act as dislocation pinning centers, thereby hindering dislocation annihilation during annealing and contributing to the retention of strain hardening. For example [
38], in Al-Cu systems, prolonged annealing leads to the formation of Al
2Cu and Al
4Cu
9 intermetallics, which are known to influence dislocation behavior and mechanical strength at the interface. Similarly, Cr-containing alloys often exhibit stable intermetallic phases that resist recovery processes. These effects are particularly pronounced in high-entropy alloys, where the combination of lattice distortion and chemical complexity stabilizes dislocation structures [
10]. Cu-enriched regions were identified in our investigation and in [
39], where a high-entropy alloy of similar composition was studied. Furthermore, in our previous research on the acoustic properties of the Al
0.5CoCrCuFeNi HEA, we established that, in addition to a relatively high dislocation density, a significant number of dislocation pinning sites were present. The typical dislocation segment length was found to be on the order of 10–20 nm [
28]. These observations strongly suggest that one of the most probable reasons for the retention of a relatively high dislocation density in the annealed sample (structural state (IV)) is the effective pinning of dislocations by atomic clusters with elevated Cu content. This mechanism may play a key role in stabilizing the microstructure and influencing the mechanical behavior of the alloy after annealing.
The authors express their sincere gratitude to Damian Szymański for his valuable contribution to this work through the precise elemental composition analysis of the high-entropy alloy (HEA) Al0.5CoCrCuFeNi. His expertise in spectroscopic techniques and meticulous approach to data acquisition played a crucial role in ensuring the reliability and accuracy of the chemical characterization, which served as a foundation for subsequent structural and microstructural investigations.
Conceptualization, Y.S. and V.N.; Methodology, Y.S., N.G., D.H. V.Z.; Validation, Y.S., V.N. and E.T.; Formal Analysis, V.Z. and P.Z.; Investigation, Y.S., N.G., D.H., T.B. and I.K.; Resources, N.G. and D.H.; Data Curation, E.T.; Writing—Original Draft Preparation, Y.S.; Writing—Review & Editing, Y.S. and V.N.; Visualization, V.Z. and Y.S.; Supervision, X.X.; Project Administration, Y.S.; Funding Acquisition, V.N. and E.T.
The data presented in this study are available upon request from the corresponding author.
This work was partly supported by the NRFU (Grant 2023.03/0012); Projects No.0122U001504 and No.0124U000272 NAS of Ukraine and internship within the framework of scientific cooperation between the National Academy of Sciences of Ukraine and the Polish Academy of Sciences.
The authors declare no conflicts of interest.
 Vasilij Natsik
1
Vasilij Natsik
1