Rigid flange couplings are essential mechanical components used to transmit torque between two aligned shafts with high torsional rigidity and minimal misalignment. Their structural simplicity and load-handling efficiency make them widely applicable in various industrial systems, including compressors, pumps, conveyors, and marine drives. The performance of these couplings, however, is strongly influenced by factors such as material composition, loading conditions, and the external operating environment. Understanding and optimizing these factors is vital to enhancing coupling life and minimizing mechanical failure under real-world service conditions.
Several researchers have explored the mechanical behaviour of flange couplings through analytical, numerical, and experimental methods. Maurya et al. compared theoretical and simulation-based analyses of rigid couplings [
1]. Chavan focused on stress localization using FEM [
2], while Patil and Mattikalli emphasized the influence of flange geometry and stress zones through structural analysis [
3]. Mendi demonstrated the impact of material selection and configuration on coupling stress performance [
4], while Alwan et al. evaluated shaft dynamics using composite materials [
5]. Arya investigated the effect of material and design variations using finite element analysis [
6]. Ji and Lu applied evolutionary algorithms for optimization of flange designs [
7], while Dongare et al. compared various flange configurations fabricated via 3D printing [
8]. Material selection has remained a focal point in coupling design. Studies by Garai et al. [
9] and Basha et al. [
10] highlighted how different carbon steel and cast iron grades affect deformation and fatigue resistance. Kumar [
11] and Singh et al. [
12] showed that improved material configurations can significantly reduce stress concentrations, particularly near bolt holes and flange surfaces. Han [
13] analyzed modal behaviour of couplings, while Francis et al. [
14] characterized torsional stiffness of flexible disk couplings. Qureshi et al. further demonstrated the application of robust set-based design for flange couplings [
15]. Vijaya [
16], Thipprakmas et al. [
17], Babu et al. [
18], and Asma et al. [
19] added to the literature by analyzing structural integrity, flanging processes, failure behaviour, and modal parameters of rigid flange couplings under varied configurations.
Optimization techniques have also been widely applied to enhance coupling design. Ramesh and Baskar [
20] used genetic algorithms to optimize blanking operations, while Mohan Kumar and Velmurugan [
21] developed mathematical models coupled with genetic algorithms for die design parameters. Dongare et al. integrated multi-criteria decision-making with statistical optimization for material selection [
22]. Despite these advances, most prior studies have not included environmental pressure as a parameter in their optimization strategies.
This observation highlights a significant gap in the literature. While material, geometry, and loading effects are well documented, relatively few studies address how pressure-intensive environments, such as submerged or hydraulically loaded systems, affect flange coupling performance. Limited work, such as by Han [
13] and Francis et al. [
14], has explored modal or torsional dynamics under fluid-interaction conditions. Still, no study comprehensively integrates environmental variability with simulation and statistical analysis for flange couplings.
To address this gap, the present study investigates the mechanical performance of rigid flange couplings under two distinct environmental conditions: normal atmospheric air and a high-pressure oil environment. A Taguchi L9 orthogonal array was employed to evaluate the influence of shaft, flange, and bolt material combinations on key mechanical responses, including total deformation, equivalent stress, shear stress, and normal stress. The statistical results were analyzed using ANOVA and regression modeling, and validated using finite element analysis (FEA). A desirability-based optimization method was further used to identify the most effective material configuration for each environment. This integrated framework offers new insights for pressure-sensitive coupling design and expands understanding of rigid coupling performance under variable service conditions.
The rigid flange coupling assembly investigated in this study comprises three primary components: shaft, flange, and bolt. To explore the influence of material selection on mechanical performance under varying environmental conditions, six grades of materials were selected—three carbon steels (C30, C45, C60) for the shaft and bolts, and three grades of grey cast iron (FG200, FG260, FG300) for the flange.
The chemical composition of these materials was verified against standard metallurgical specifications and is summarized in . The carbon content in the steels ranged from 0.30% in C30 to 0.60% in C60, supporting variation in tensile strength and hardness. The grey cast irons showed significantly higher carbon and silicon content, consistent with their graphite-rich microstructure. Notably, FG300 exhibited the highest carbon content at approximately 3.5%, which enhances compressive strength and damping characteristics [
4].
.
Materials chemical composition.
| Element |
C30 (wt%) |
C45 (wt%) |
C60 (wt%) |
FG200 (wt%) |
FG260 (wt%) |
FG300 (wt%) |
| Carbon (C) |
0.3 |
0.45 |
0.6 |
3 |
3.3 |
3.5 |
| Silicon (Si) |
0.25 |
0.25 |
0.25 |
2 |
2.3 |
2.5 |
| Manganese (Mn) |
0.7 |
0.7 |
0.8 |
0.6 |
0.8 |
1 |
| Phosphorus (P) |
0.035 |
0.035 |
0.035 |
0.1 |
0.12 |
0.12 |
| Sulfur (S) |
0.035 |
0.035 |
0.035 |
0.1 |
0.12 |
0.12 |
| Iron (Fe) |
98.6 |
98.5 |
98.3 |
94.2 |
93.46 |
92.76 |
Mechanical properties in
were also considered in the material selection. Among steels, C60 demonstrated the highest tensile strength, ranging from 620 to 880 MPa, but with reduced ductility compared to lower-carbon variants.
.
Materials Properties of Steel Grades.
| Property |
C30 |
C45 |
C60 |
| Density (g/cm3) |
7.85 |
7.85 |
7.85 |
| Tensile Strength (MPa) |
540–690 |
570–700 |
620–880 |
| Yield Strength (MPa) |
330–410 |
310–450 |
350–550 |
| Elongation at Break (%) |
16–22 |
14–20 |
10–16 |
| Hardness (HB) |
121–179 |
170–210 |
180–250 |
| Modulus of Elasticity (GPa) |
200–210 |
200–210 |
200–210 |
Grey cast irons, while lower in tensile strength, offered superior vibration absorption and rigidity, with FG300 presenting the best combination of tensile strength (≥300 MPa) and hardness (HB 210–260). These properties (
) were critical in defining the load-bearing behavior of the flanges, especially under pressure-varying environments.
.
Materials Properties of Cast Iron Grade.
| Property |
FG200 |
FG260 |
FG300 |
| Density (g/cm3) |
7.1–7.3 |
7.1–7.3 |
7.1–7.3 |
| Tensile Strength (MPa) |
≥200 |
≥260 |
≥300 |
| Hardness (HB) |
170–220 |
200–240 |
210–260 |
| Modulus of Elasticity (GPa) |
100–130 |
110–140 |
120–150 |
| Elongation at Break (%) |
0.5–1.5 |
0.5–1.0 |
0.5–1.0 |
For simulation purposes, the average values of elastic modulus, Poisson’s ratio, and density were selected from the standard ranges presented in
and
. Hardness values were included in the tables for completeness but were not used directly in FEA simulations, since the analysis was restricted to elastic deformation.
2.1. Selection of Levels and Parameters
A Taguchi L9 orthogonal array was employed to investigate the influence of material combinations on the coupling’s structural response. The three factors selected for the study were shaft material (A), flange material (B), and bolt material (C), each varied across three levels (
). The full factorial design resulted in nine unique test cases, covering all permutations of material combinations without redundancy.
.
Process parameters and their levels.
| Process Parameters |
Level |
| |
1 |
2 |
3 |
| Shaft (A) |
C30 |
C45 |
C60 |
| Flange (B) |
FG200 |
FG260 |
FG300 |
| Bolt (C) |
C30 |
C45 |
C60 |
The coded array in
allowed structured evaluation of interaction effects between different component materials. This design ensured optimal resource utilization while maintaining sufficient statistical power to detect meaningful differences across output metrics.
.
Coded array of materials.
| Trials |
Un-Coded |
Coded |
| Shaft |
Flange |
Bolt |
A |
B |
C |
| 1 |
C30 |
FG200 |
C30 |
1 |
1 |
1 |
| 2 |
C30 |
FG260 |
C45 |
1 |
2 |
2 |
| 3 |
C30 |
FG300 |
C60 |
1 |
3 |
3 |
| 4 |
C45 |
FG200 |
C45 |
2 |
1 |
2 |
| 5 |
C45 |
FG260 |
C60 |
2 |
2 |
3 |
| 6 |
C45 |
FG300 |
C30 |
2 |
3 |
1 |
| 7 |
C60 |
FG200 |
C60 |
3 |
1 |
3 |
| 8 |
C60 |
FG260 |
C30 |
3 |
2 |
1 |
| 9 |
C60 |
FG300 |
C45 |
3 |
3 |
2 |
The
presents the overall methodology, starting with material selection and Taguchi experimental design. It then branches into experimental analysis using ANOVA and regression, and simulation through FEA. Finally, a desirability-based optimization identifies the best-performing configuration under both environmental conditions.
2.1.1. Geometry and Dimensions of Rigid Flange Coupling
The rigid flange coupling was designed based on standardized proportions using a shaft diameter of 60 mm as the reference dimension (
d). The corresponding calculated dimensions are summarized in
.
.
Geometric Specifications of the Rigid Flange Coupling.
| Part Specification |
Formula (Based on d) |
Dimensions (mm) |
| Hub Diameter (dh) |
2d |
120 |
| Hub Length (lh) |
1.5d |
90 |
| Bolt Circle Diameter (D) |
3d |
180 |
| Flange Thickness (t) |
0.5d |
30 |
| Web Thickness (t1) |
0.25d |
15 |
| Diameter of Spigot and Recess (dr) |
1.5d |
90 |
| Outside Diameter of Flange (Do) |
(4d + 2t1) |
270 |
All simulations were carried out under linear elastic assumptions. The applied stresses for all configurations remained below the yield strength of the respective materials; hence, plastic deformation was not considered in this study. This ensures that the analysis focuses on the elastic range, which is most relevant for coupling design under service conditions.
2.1.2. Finite Element Model and Boundary Conditions
Geometry and Meshing: The rigid flange coupling assembly (shaft, two flanges, bolts, nuts, and key) was imported in STEP format into ANSYS Mechanical 2025 R1 and analyzed in 3D structural mode. All parts were modeled as deformable solids and meshed using SOLID187 quadratic tetrahedral elements with adaptive sizing. Depending on the refinement level, final production meshes contained between 40,000–65,000 elements and 75,000–108,000 nodes. Mesh quality (skewness, aspect ratio) met ANSYS acceptance criteria.
Mesh-independence study: To ensure discretization-independent results, a mesh convergence study was performed using three levels of refinement.
a and 7b present the mesh independence results for the flange coupling assembly under normal atmospheric air and high-pressure oil conditions, respectively. Three mesh refinement levels—coarse (2 mm), medium (1.5 mm), and fine (1 mm) element sizes—were evaluated, with corresponding nodes ranging from 75,000 to 108,000 and elements from 40,000 to 65,000. The results show that total deformation, equivalent stress, shear stress, and normal stress converge progressively with mesh refinement. The % change between medium and fine meshes for both environmental conditions is below 7%, indicating acceptable mesh independence. In particular, normal stress, most sensitive to local stress concentrations, shows % changes of 6.06% (air) and 2.56% (oil), confirming that the fine mesh accurately captures stress peaks without excessive computational cost.
.
(a). Mesh Independence Study—Normal Atmospheric Air Condition. (b). Mesh Independence Study—High-Pressure Oil Condition.
| (a) |
| Mesh Type |
Element Size (mm) |
Nodes Count |
Elements Count |
|
| Coarse |
2 |
75,000 |
40,000 |
|
| Medium |
1.5 |
90,500 |
52,000 |
|
| Fine |
1 |
108,000 |
65,000 |
|
| Mesh Type |
Total Deformation (mm) |
% Change (Deformation) |
Equivalent Stress (MPa) |
% Change (Equivalent Stress) |
Shear Stress (MPa) |
% Change (Shear Stress) |
Normal Stress (MPa) |
% Change (Normal Stress) |
| Coarse |
0.0225 |
- |
133.8 |
- |
25 |
- |
62 |
- |
| Medium |
0.02205 |
1.97% |
132.5 |
0.97% |
26.5 |
6.00% |
66 |
6.45% |
| Fine |
0.02172 |
1.50% |
132.84 |
0.26% |
27.5 |
3.77% |
70 |
6.06% |
| (b) |
| Mesh Type |
Element Size (mm) |
Nodes Count |
Elements Count |
|
| Coarse |
2 |
75,000 |
40,000 |
|
| Medium |
1.5 |
90,500 |
52,000 |
|
| Fine |
1 |
108,000 |
65,000 |
|
| Mesh Type |
Total Deformation (mm) |
% Change (Deformation) |
Equivalent Stress (MPa) |
% Change (Equivalent Stress) |
Shear Stress (MPa) |
% Change (Shear Stress) |
Normal Stress (MPa) |
% Change (Normal Stress) |
| Coarse |
0.02285 |
- |
137.5 |
- |
31 |
- |
75.5 |
- |
| Medium |
0.0226 |
1.09% |
136.5 |
0.73% |
31.8 |
2.58% |
78 |
3.31% |
| Fine |
0.02245 |
0.66% |
138.61 |
1.55% |
32.6 |
2.52% |
80 |
2.56% |
Material Models: All components were modeled as linear elastic isotropic solids. Young’s modulus and Poisson’s ratio for C30, C45, C60 steels and FG200, FG260, FG300 cast irons were taken from
and
. All responses remained within the elastic range; plasticity was not considered.
Contacts and Bolt Representation: Surface-to-surface contact was defined at all flange, shaft, and bolt/nut interfaces. The flange–shaft interface was modeled as frictional contact with μ = 0.15. Other interfaces were modeled as ‘no separation’ to ensure shear transfer while reducing computational cost. Bolts were modeled as solid bodies, and a bolt preload of 2100 N was applied as initial tension in each bolt to replicate realistic tightening.
Boundary Conditions and Loads:
-
-
One shaft end face was fully constrained (all DOFs fixed).
-
-
A torque of 1986.4 N·mm was applied to the opposite shaft end.
-
-
Gravity was included in the −X direction.
-
-
For normal atmospheric condition, a nominal pressure of 0.101 MPa was applied to external faces.
-
-
For high-pressure oil condition, Hydrostatic pressure was applied on internal wetted faces, automatically identified by ANSYS (~300 surfaces).
2.2. FEA (Finite Element Analysis) Experimentation
Finite Element Analysis (FEA) was conducted to simulate the mechanical behavior of the coupling under atmospheric air conditions. A 3D CAD model representing the full assembly was developed and meshed using second-order tetrahedral elements to ensure convergence and solution accuracy. Boundary conditions replicated real-world mounting scenarios: the shaft was fixed at one end while torque was applied at the other, with contact elements defined between mating components.
Finite Element Analysis (FEA) is employed to assess the structural integrity of a rigid flange coupling, specifically evaluating the mechanical behavior of diverse material combinations. A three-dimensional (3D) geometric model of the coupling, as depicted in
a, serves as the basis for the analysis.
Imposition of boundary conditions, as outlined in
, facilitates the generation of a discretized mesh, illustrated in
b. Subsequent simulation of operational loading conditions enables the determination of stress distribution patterns, identification of stress concentration regions, and quantification of deformation magnitudes under applied torsional loads.
. The 3D model and mesh model: (<b>a</b>) Three-dimensional (3D) geometric model of rigid flange coupling (<b>b</b>) Generation of a discretized mesh of rigid flange coupling.
.
Environmental conditions used in FEA setup.
| Sr. No. |
Parameter |
Normal Atmospheric Air Condition |
High-Pressure Oil Condition |
| 1 |
Environment Type |
Ambient air (dry condition) |
Submerged in oil
(external pressure simulated)
|
| 2 |
Analysis Type |
Static Structural |
Static Structural |
| 3 |
Gravity Load Direction |
X-axis (−9.8066 m/s2) |
X-axis (−9.8066 m/s2) |
| 4 |
Applied Torque/Moment |
1.9864 N·m |
1.9864 N·m |
| 5 |
Hydrostatic Pressure |
Not Applied |
Applied on 300 faces
(internal oil pressure zone)
|
| 6 |
Fluid Density (Oil) |
N/A |
850 kg/m3 |
| 7 |
Hydrostatic Acceleration |
N/A |
X = −9.813 m/s2, Y = 0,
Z = 0 mm/s2
|
| 8 |
Damping Condition |
Light structural damping |
Mass + viscous damping
(due to oil immersion)
|
| 9 |
Mesh Type |
Quadratic tetrahedral solid elements |
Quadratic tetrahedral solid elements |
| 10 |
Mesh Refinement |
Adaptive mesh enabled |
Adaptive mesh enabled |
| 11 |
Contact Type (Bolt-Flange-Shaft) |
Frictional contact with preload |
Frictional contact with preload |
| 12 |
Bolt Preload |
2100 N |
2100 N |
| 13 |
Interface Behaviour |
Surface-to-surface contact |
Surface-to-surface contact |
| 14 |
Solver Used |
Static solver (ANSYS Mechanical) |
Static solver (ANSYS Mechanical) |
Simulation Setup
presents the simulation parameters for both environmental conditions. While both cases used identical meshing, gravity, and applied torque, only the high-pressure oil condition included hydrostatic pressure applied on 300 faces, using a fluid density of 850 kg/m
3. The torque of 1.9864 N.m was applied at the free shaft end face opposite the fixed support. The pressure environment was simulated with hydrostatic acceleration along the X-axis. These settings enabled accurate comparison of the coupling’s behavior under ambient and pressurized conditions.
This section presents and interprets the results of the Taguchi-based experimental design and Finite Element Analysis (FEA) for rigid flange couplings operating under two surrounding conditions: normal atmospheric air and high-pressure oil. The mechanical responses were analyzed across four key performance indicators: total deformation, equivalent stress, shear stress, and normal stress. Statistical tools, including ANOVA, main effects analysis, optimal settings evaluation, and desirability analysis were employed to identify significant parameters and determine the most favorable configuration. To verify the accuracy of these models, Finite Element Analysis (FEA) was carried out for the optimal material configurations, which were not part of the original L9 design. The predicted values from the regression models were then compared with the corresponding FEA results. The percentage error for all responses remained within acceptable engineering limits. Furthermore, the mesh convergence study (<7% variation across refinements) and the application of realistic boundary conditions confirm the correctness of the FE model, ensuring that the observed stress–strain trends can be attributed to material and geometric factors rather than numerical artifacts.
3.1. FEA Results
3.1.1. FEA Results for Normal Atmospheric Air Condition
Nine FEA simulations corresponding to the L9 matrix were conducted. Results showed in
that total deformation values ranged between 0.0215 mm to 0.0226 mm, while equivalent stress varied from 127.91 MPa to 134.59 MPa. Shear stress and normal stress followed similar patterns, peaking at 28.07 MPa and 85.83 MPa, respectively. The highest stress concentrations were observed near the bolt holes and flange outer edges, as expected in bolted joint simulations.
.
Results of normal atmospheric air condition from FEA simulations.
| Trials |
A |
B |
C |
Total Deformation (mm) |
Equivalent Stress (MPa) |
Shear Stress (MPa) |
Normal Stress (MPa) |
| 1 |
1 |
1 |
1 |
0.02261 |
134.59 |
23.955 |
57.404 |
| 2 |
1 |
2 |
2 |
0.021607 |
127.91 |
26.47 |
82.339 |
| 3 |
1 |
3 |
3 |
0.021519 |
132.84 |
28.074 |
85.829 |
| 4 |
2 |
1 |
2 |
0.021607 |
127.91 |
26.47 |
82.339 |
| 5 |
2 |
2 |
3 |
0.21607 |
127.91 |
26.47 |
82.339 |
| 6 |
2 |
3 |
1 |
0.021519 |
132.84 |
28.074 |
85.829 |
| 7 |
3 |
1 |
3 |
0.02261 |
134.59 |
23.955 |
57.404 |
| 8 |
3 |
2 |
1 |
0.21607 |
127.91 |
26.47 |
82.339 |
| 9 |
3 |
3 |
2 |
0.021519 |
132.84 |
28.074 |
85.829 |
3.1.2. FEA Results for High Pressure Oil Condition
A second set of FEA simulations was conducted under high-pressure oil surroundings, with adjusted boundary conditions to simulate external compressive pressure. This alteration aimed to reflect real-world scenarios such as submerged mechanical assemblies or hydraulic environments. The corresponding results are summarized in
.
.
Results of high pressure oil condition from FEA simulations.
| Trials |
A |
B |
C |
Total Deformation (mm) |
Equivalent Stress (MPa) |
Shear Stress (MPa) |
Normal Stress (MPa) |
| 1 |
1 |
1 |
1 |
0.022994 |
138.61 |
30.852 |
80.377 |
| 2 |
1 |
2 |
2 |
0.022531 |
134.1 |
29.509 |
76.779 |
| 3 |
1 |
3 |
3 |
0.022993 |
138.61 |
30.852 |
80.379 |
| 4 |
2 |
1 |
2 |
0.022446 |
144.26 |
33.696 |
51.865 |
| 5 |
2 |
2 |
3 |
0.022531 |
134.1 |
29.509 |
76.779 |
| 6 |
2 |
3 |
1 |
0.022993 |
138.61 |
30.852 |
80.379 |
| 7 |
3 |
1 |
3 |
0.023332 |
144.42 |
33.914 |
51.865 |
| 8 |
3 |
2 |
1 |
0.022531 |
134.1 |
29.509 |
76.779 |
| 9 |
3 |
3 |
2 |
0.022993 |
138.61 |
30.852 |
80.379 |
presents the FEA visualizations of the rigid flange coupling under loading conditions. The contour plots illustrate the distribution of total deformation, equivalent Von-Mises stress, shear stress, and normal stress across the assembly. Deformation was primarily localized at the flange interface, while the highest Von-Mises stresses occurred around the bolt holes, indicating stress concentration zones. Shear and normal stress contours further confirmed that flange material and bolt preload significantly governed the overall structural response. These visual results validate the numerical outputs and provide clear evidence of the coupling’s mechanical behavior under service conditions.
. Finite Element Analysis (FEA) results for the rigid flange coupling: (<b>a</b>) total deformation (mm); (<b>b</b>) equivalent von Mises stress (MPa); (<b>c</b>) shear stress (MPa); (<b>d</b>) normal stress (MPa).
The Taguchi method was employed to systematically analyze the influence of material parameters—shaft, flange, and bolt—on the mechanical performance of rigid flange couplings under varying environmental conditions. An L9 orthogonal array was selected to efficiently explore the design space using a minimal number of simulations. This robust design framework enabled the evaluation of main effects on response variables, including total deformation, equivalent stress, shear stress, and normal stress. Signal-to-noise (S/N) ratios were calculated to identify optimal material combinations and determine parameter sensitivity. The analysis revealed that flange material exerted the most significant influence across all responses, highlighting its critical role in coupling performance optimization.
3.2.1. Taguchi Analysis for Normal Atmospheric Air Condition
The experimental design followed a standard L9 orthogonal array, evaluating the effects of three input parameters—shaft material, flange material, and bolt material—on four mechanical responses. Signal-to-noise ratio (S/N) analysis in
was conducted using the “Smaller-the-Better” criterion (
Equation (1)), suitable for minimizing deformation and stress.
.
Signal-to-noise ratio (S/N) analysis of normal atmospheric air condition.
| Sr. No. |
A |
B |
C |
MEAN1 |
MEAN2 |
MEAN3 |
MEAN4 |
| 1 |
1 |
1 |
1 |
0.0226 |
134.59 |
23.955 |
57.404 |
| 2 |
1 |
2 |
2 |
0.0216 |
127.91 |
26.47 |
82.339 |
| 3 |
1 |
3 |
3 |
0.0215 |
132.84 |
28.074 |
85.829 |
| 4 |
2 |
1 |
2 |
0.0216 |
127.91 |
26.47 |
82.339 |
| 5 |
2 |
2 |
3 |
0.2161 |
127.91 |
26.47 |
82.339 |
| 6 |
2 |
3 |
1 |
0.0215 |
132.84 |
28.074 |
85.829 |
| 7 |
3 |
1 |
3 |
0.0226 |
134.59 |
23.955 |
57.404 |
| 8 |
3 |
2 |
1 |
0.2161 |
127.91 |
26.47 |
82.339 |
| 9 |
3 |
3 |
2 |
0.0215 |
132.84 |
28.074 |
85.829 |
| Sr. No. |
A |
B |
C |
SNRA1 |
SNRA2 |
SNRA3 |
SNRA4 |
| 1 |
1 |
1 |
1 |
32.914 |
−42.5803 |
−27.5879 |
−35.1788 |
| 2 |
1 |
2 |
2 |
33.3081 |
−42.1381 |
−28.4551 |
−38.3121 |
| 3 |
1 |
3 |
3 |
33.3436 |
−42.4666 |
−28.9661 |
−38.6727 |
| 4 |
2 |
1 |
2 |
33.3081 |
−42.1381 |
−28.4551 |
−38.3121 |
| 5 |
2 |
2 |
3 |
13.3081 |
−42.1381 |
−28.4551 |
−38.3121 |
| 6 |
2 |
3 |
1 |
33.3436 |
−42.4666 |
−28.9661 |
−38.6727 |
| 7 |
3 |
1 |
3 |
32.914 |
−42.5803 |
−27.5879 |
−35.1788 |
| 8 |
3 |
2 |
1 |
13.3081 |
−42.1381 |
−28.4551 |
−38.3121 |
| 9 |
3 |
3 |
2 |
33.3436 |
−42.4666 |
−28.9661 |
−38.6727 |
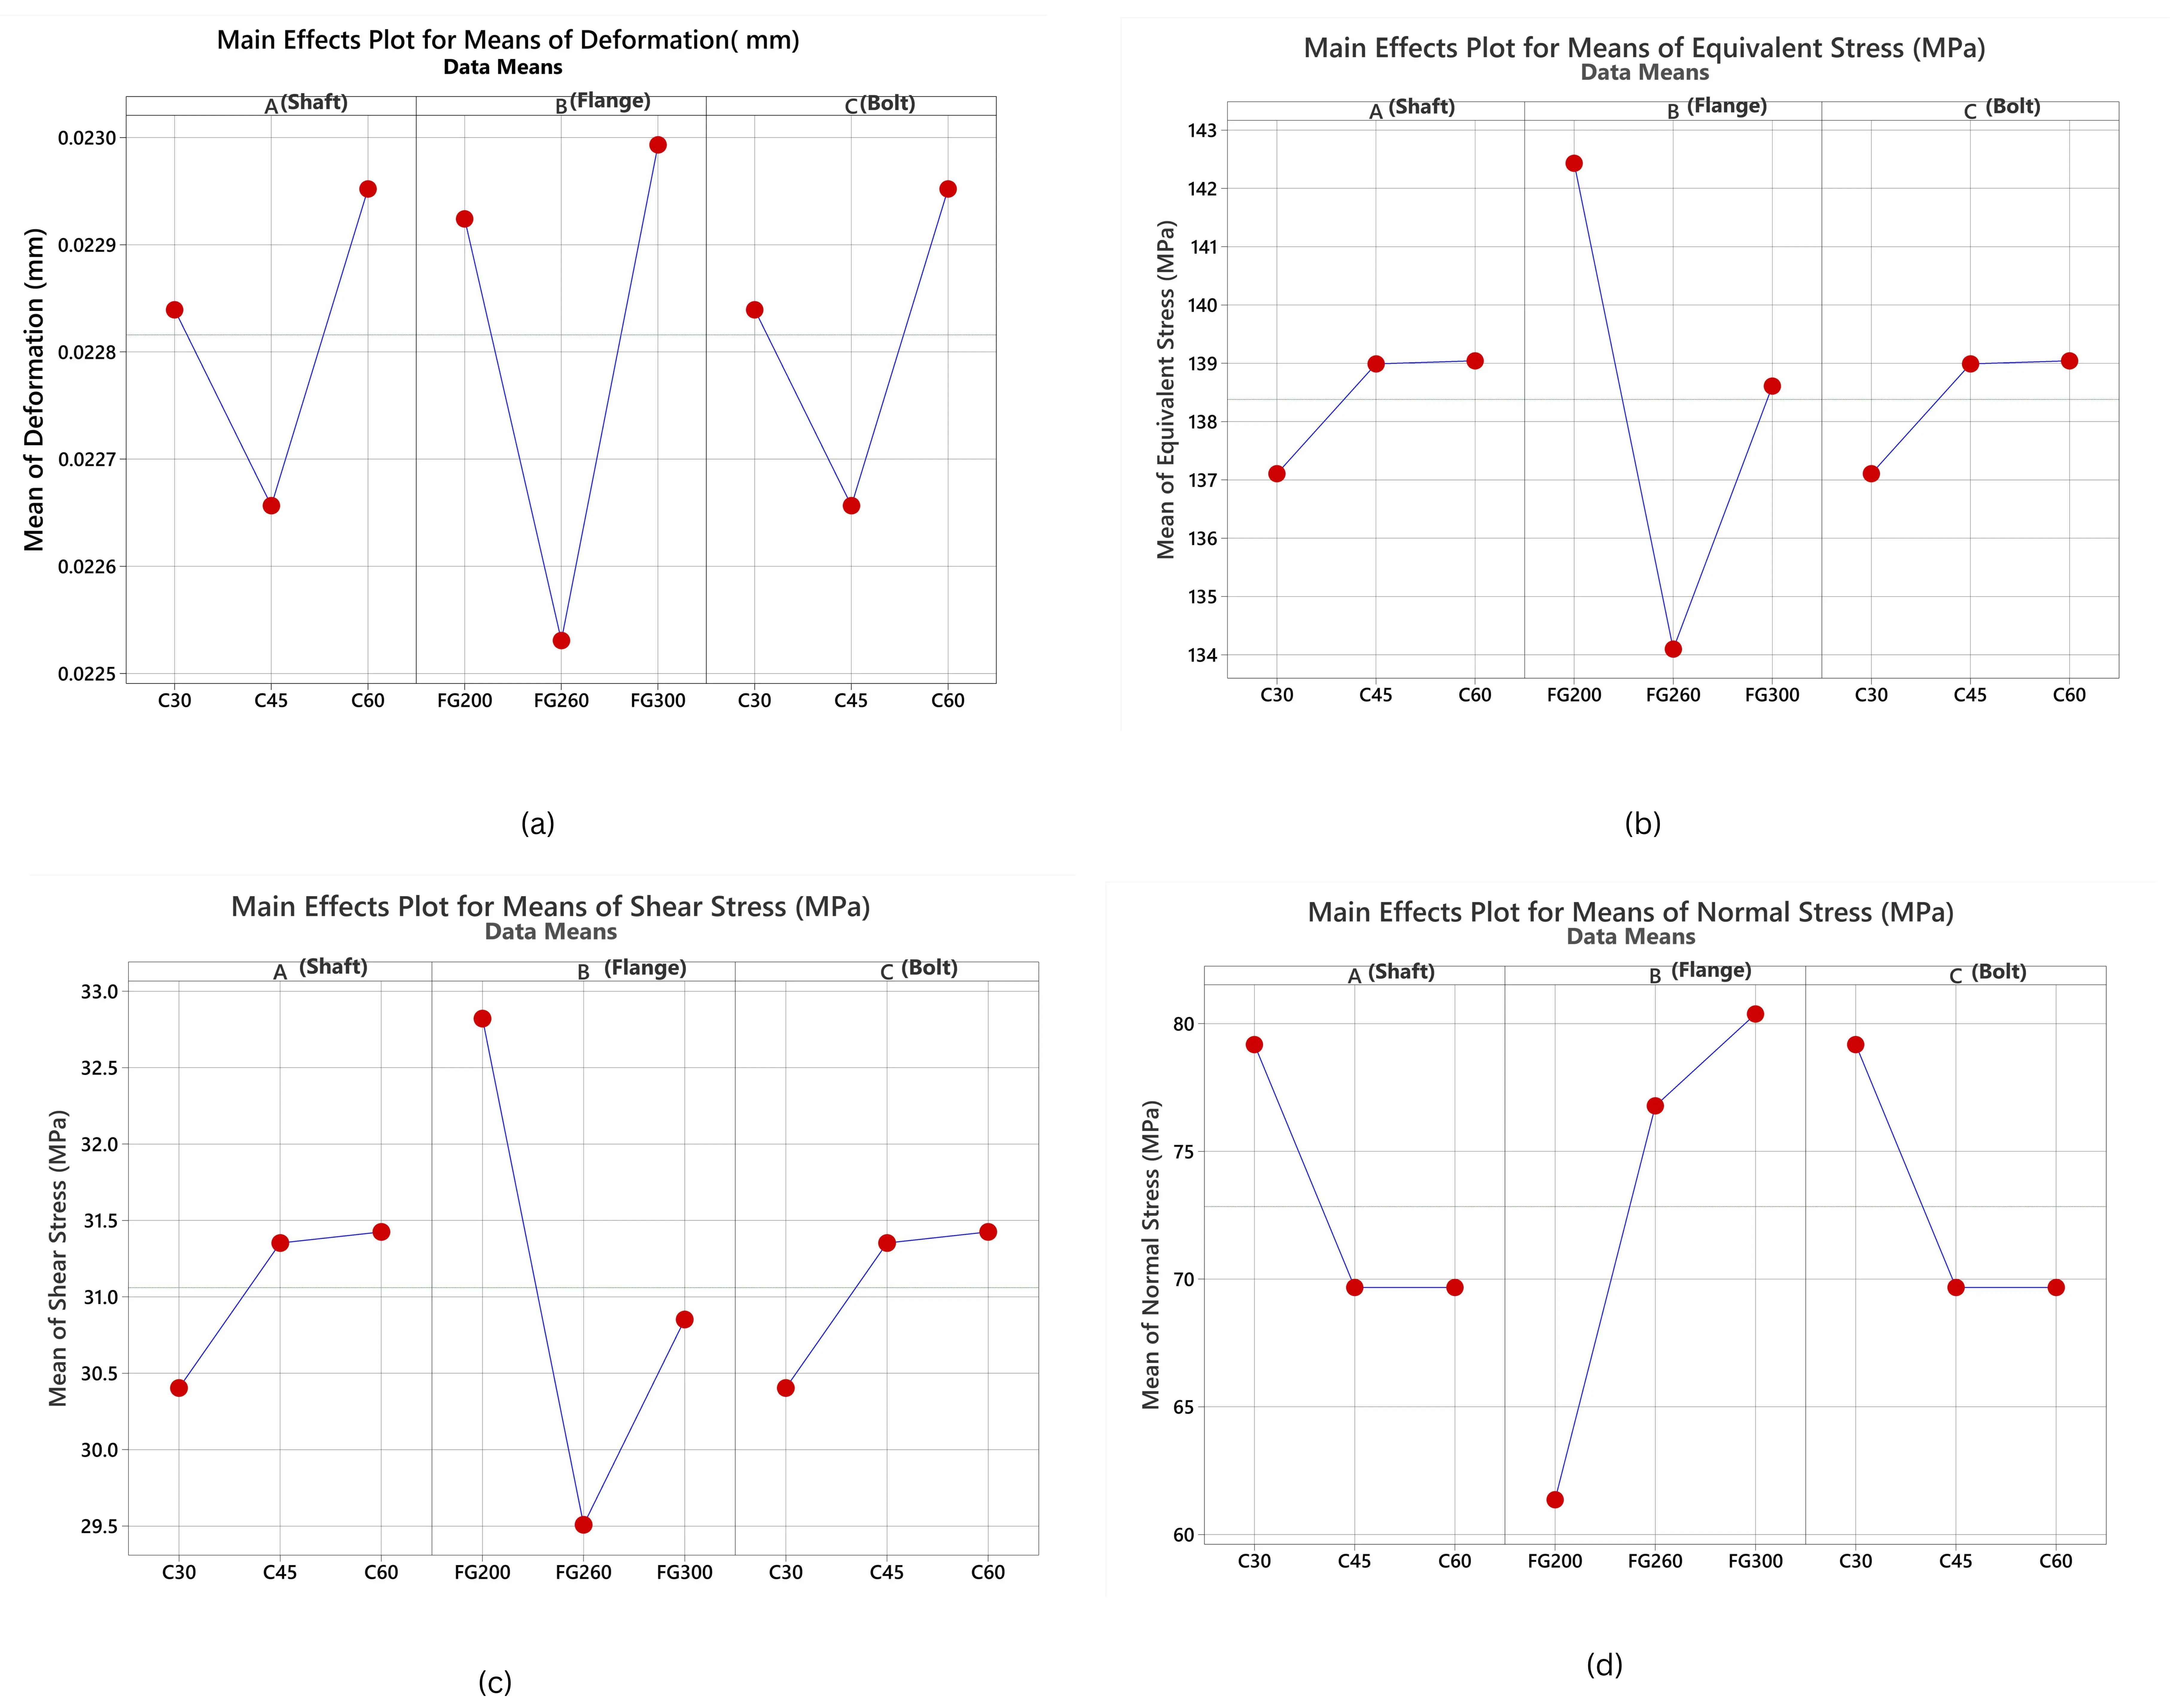
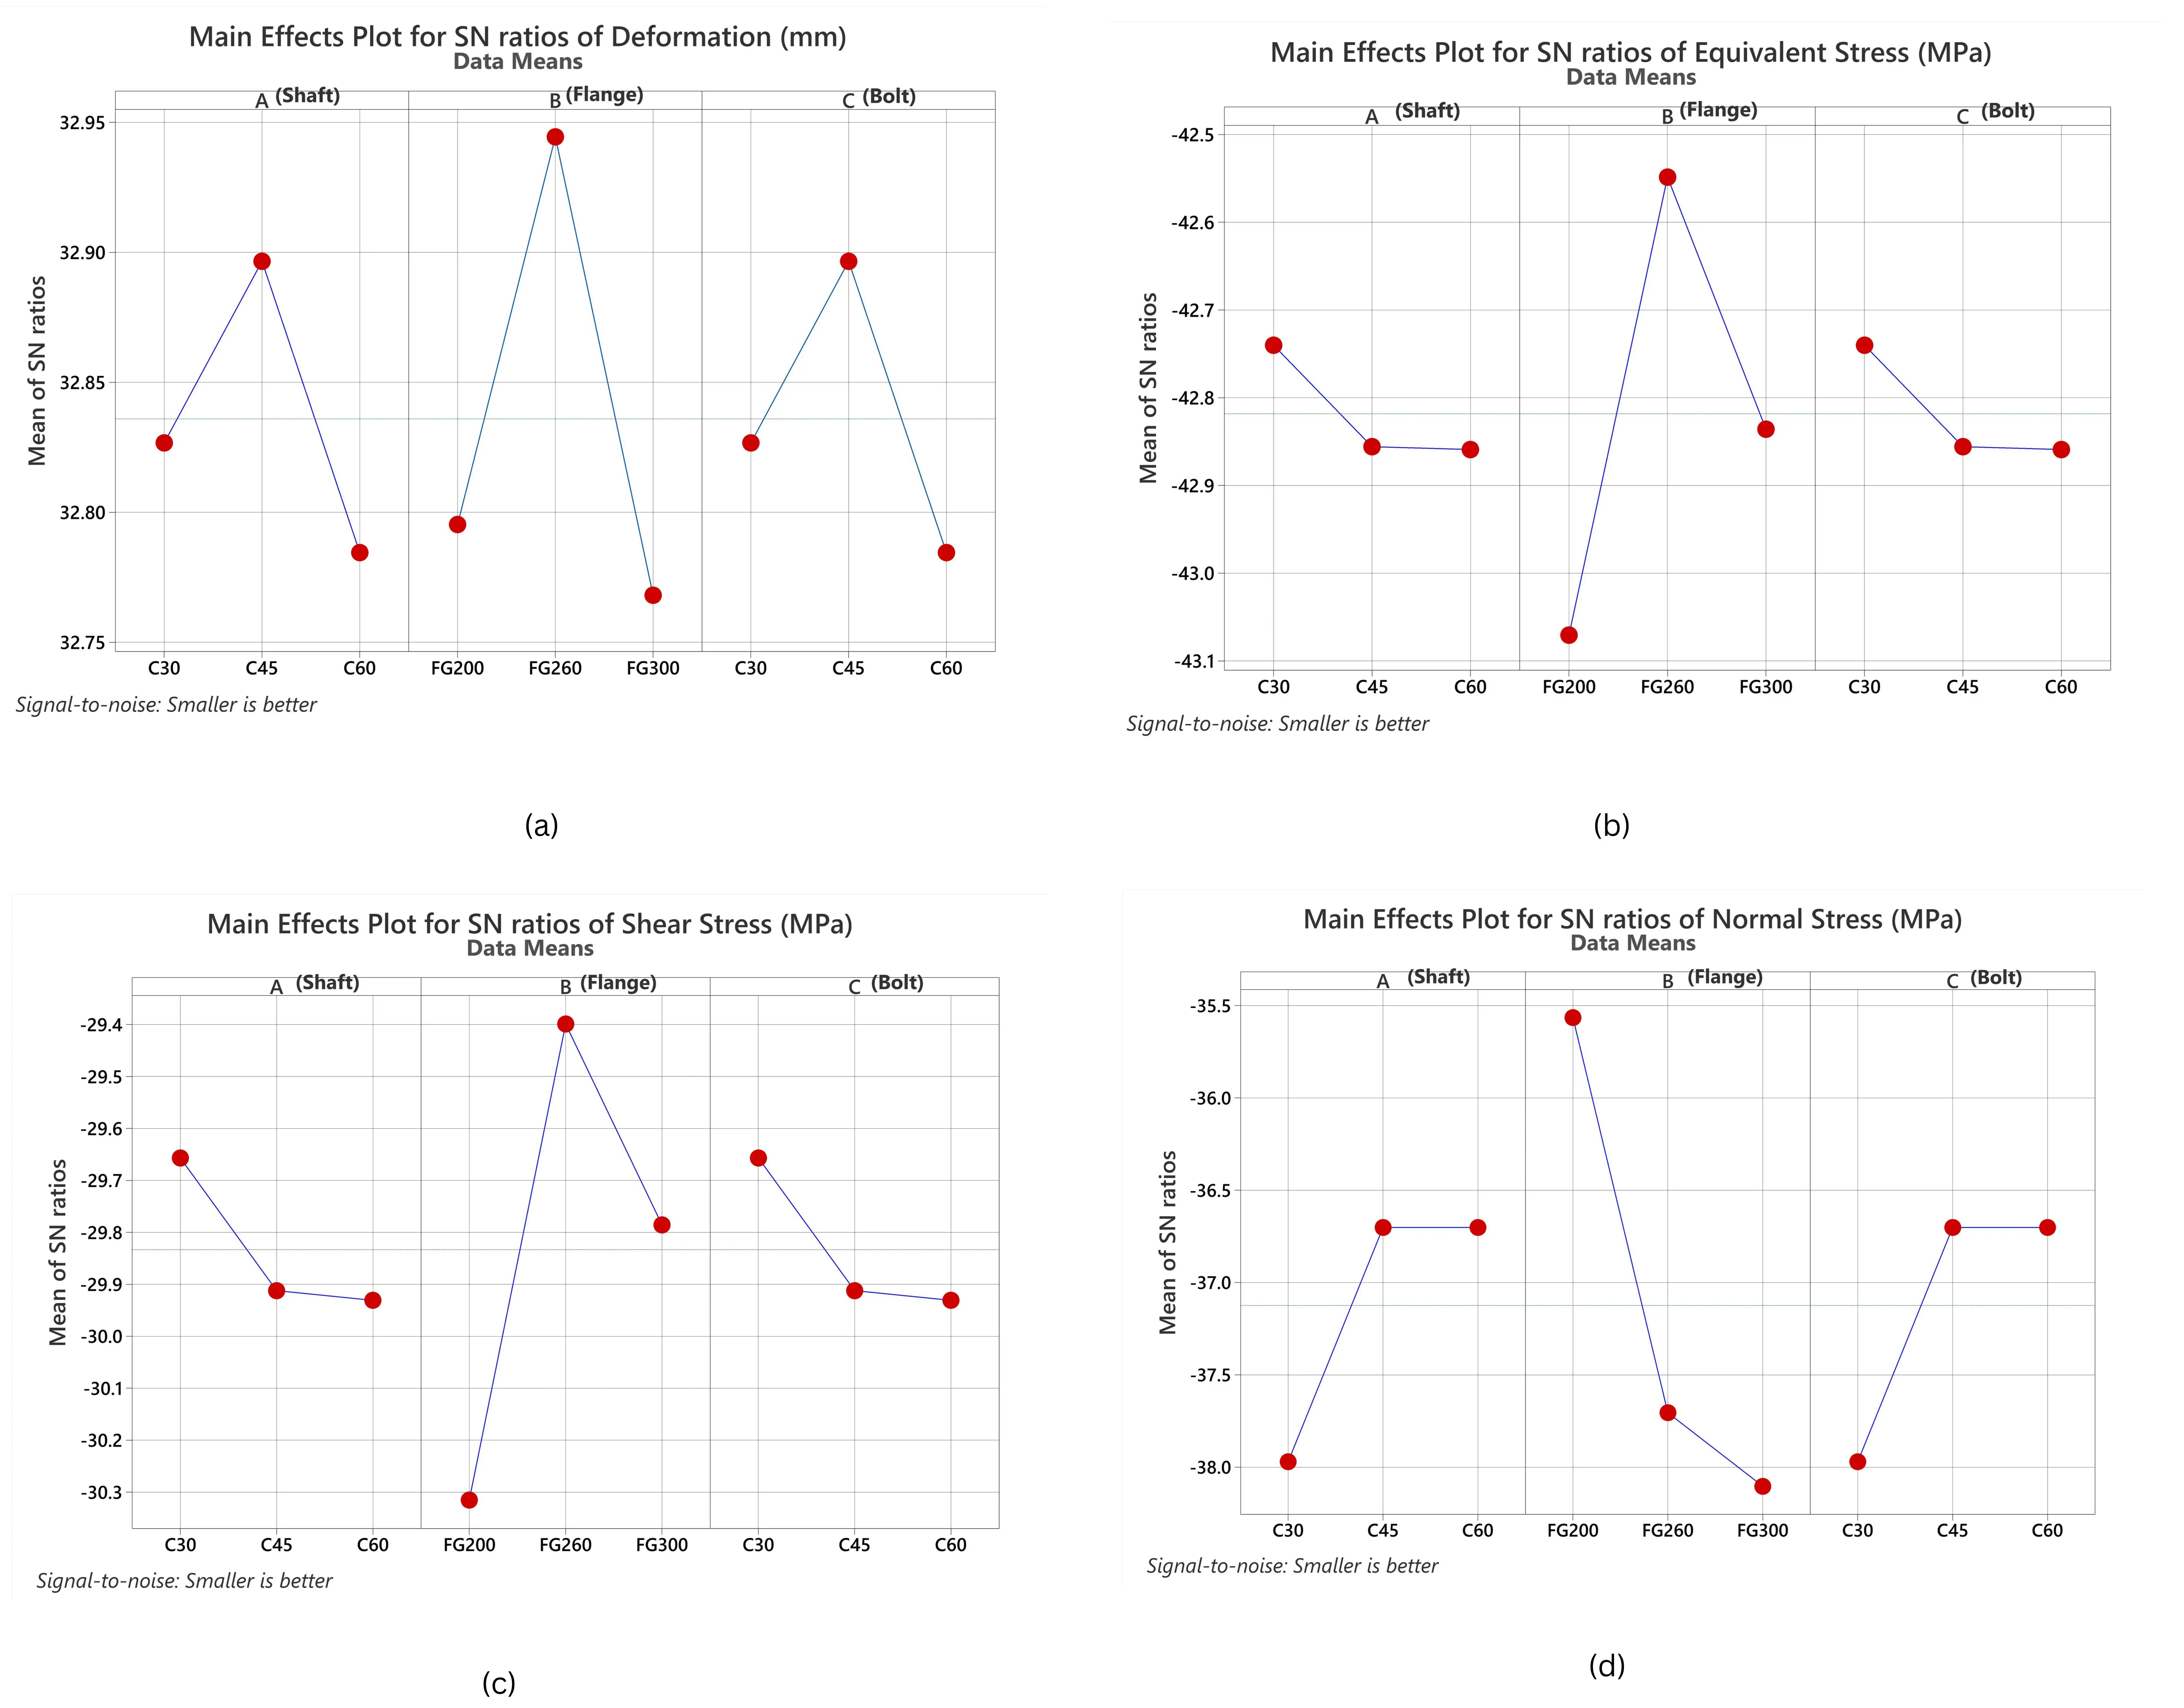
The results revealed that flange material had the most prominent influence on all response parameters under atmospheric air conditions. For total deformation, the
S/
N ratio showed the highest value at Level 2 for shaft and bolt, and Level 3 for the flange. The main effects plots (
and
) further confirmed this trend, indicating a strong impact of flange stiffness and material properties on coupling deformation and stress absorption. Red dot indicates the optimal factor level corresponding to the best mean response value.
. This is a figure of Main Effects Plot for Means of normal atmospheric air condition: (<b>a</b>) Main Effects Plot for Means of Deformation (mm); (<b>b</b>) Main Effects Plot for Means of Equivalent Stress(MPa); (<b>c</b>) Main Effects Plot for Means of Shear Stress(MPa); (<b>d</b>) Main Effects Plot for Means of Normal Stress(MPa).
. This is a figure of Main Effects Plot for SN ratios of normal atmospheric air condition: (<b>a</b>) Main Effects Plot for SN ratios of Deformation (mm); (<b>b</b>) Main Effects Plot for SN ratios of Equivalent Stress(MPa); (<b>c</b>) Main Effects Plot for SN ratios of Shear Stress(MPa); (<b>d</b>) Main Effects Plot for SN ratios of Normal Stress(MPa).
3.2.2. Taguchi Analysis for High Pressure Oil Condition
Similar procedures were followed for the high-pressure oil condition. The S/N ratio and mean analysis (
) again pointed to flange material as the most critical factor. The impact was even more pronounced under pressurized conditions due to the additional constraint applied by the surrounding oil medium.
.
Signal-to-noise ratio (S/N) analysis of high oil pressure condition.
| Sr. No. |
A |
B |
C |
MEAN1 |
MEAN2 |
MEAN3 |
MEAN4 |
| 1 |
1 |
1 |
1 |
0.023 |
138.61 |
30.852 |
80.377 |
| 2 |
1 |
2 |
2 |
0.0225 |
134.1 |
29.509 |
76.779 |
| 3 |
1 |
3 |
3 |
0.023 |
138.61 |
30.852 |
80.379 |
| 4 |
2 |
1 |
2 |
0.0224 |
144.26 |
33.696 |
51.865 |
| 5 |
2 |
2 |
3 |
0.0225 |
134.1 |
29.509 |
76.779 |
| 6 |
2 |
3 |
1 |
0.023 |
138.61 |
30.852 |
80.379 |
| 7 |
3 |
1 |
3 |
0.0233 |
144.42 |
33.914 |
51.865 |
| 8 |
3 |
2 |
1 |
0.0225 |
134.1 |
29.509 |
76.779 |
| 9 |
3 |
3 |
2 |
0.023 |
138.61 |
30.852 |
80.379 |
| Sr. No. |
A |
B |
C |
SNRA1 |
SNRA2 |
SNRA3 |
SNRA4 |
| 1 |
1 |
1 |
1 |
32.7677 |
−42.8359 |
−29.7857 |
−38.1026 |
| 2 |
1 |
2 |
2 |
32.9444 |
−42.5486 |
−29.3991 |
−37.7048 |
| 3 |
1 |
3 |
3 |
32.7681 |
−42.8359 |
−29.7857 |
−38.1029 |
| 4 |
2 |
1 |
2 |
32.9772 |
−43.1829 |
−30.5516 |
−34.2975 |
| 5 |
2 |
2 |
3 |
32.9444 |
−42.5486 |
−29.3991 |
−37.7048 |
| 6 |
2 |
3 |
1 |
32.7681 |
−42.8359 |
−29.7857 |
−38.1029 |
| 7 |
3 |
1 |
3 |
32.641 |
−43.1925 |
−30.6076 |
−34.2975 |
| 8 |
3 |
2 |
1 |
32.9444 |
−42.5486 |
−29.3991 |
−37.7048 |
| 9 |
3 |
3 |
2 |
32.7681 |
−42.8359 |
−29.7857 |
−38.1029 |
In this case, Level 2 (FG260) emerged as optimal for minimizing deformation and stress. The reduction in deformation across all runs indicates that high-pressure oil may introduce compressive loading at the boundary, contributing to enhanced mechanical stability. The main effects plots (
and
) further confirmed this trend, indicating a strong impact of flange stiffness and material properties on coupling deformation and stress absorption. Red dot indicates the optimal factor level corresponding to the best mean response value.
. This is a figure of Main Effects Plot for Means of high pressure oil condition: (<b>a</b>) Main Effects Plot for Means of Deformation (mm); (<b>b</b>) Main Effects Plot for Means of Equivalent Stress (MPa); (<b>c</b>) Main Effects Plot for Means of Shear Stress(MPa); (<b>d</b>) Main Effects Plot for Means of Normal Stress(MPa).
. This is a figure of Main Effects Plot for SN ratios of high pressure oil condition: (<b>a</b>) Main Effects Plot for SN ratios of Deformation (mm); (<b>b</b>) Main Effects Plot for SN ratios of Equivalent Stress (MPa); (<b>c</b>) Main Effects Plot for SN ratios of Shear Stress (MPa); (<b>d</b>) Main Effects Plot for SN ratios of Normal Stress (MPa).
The response tables derived from the Taguchi design summarize the average effects of each material factor at different levels on the mechanical responses. These tables help rank the significance of each parameter—shaft, flange, and bolt—based on their influence on total deformation, equivalent stress, shear stress, and normal stress. The difference between the maximum and minimum average values for each factor highlights its relative contribution. Across all responses, flange material consistently exhibited the highest Delta values, confirming it as the most influential factor affecting the coupling’s mechanical performance.
3.3.1. Response Table for Normal Atmospheric Air Condition
The response table provides detailed S/N and means values (
) across three levels for each factor. For total deformation, flange material had the highest delta value (0.58 for S/N, 5.97 for mean), signifying its dominant role. Similar trends were observed for equivalent stress, shear stress, and normal stress, where the flange continued to emerge as the most influential parameter. In all cases, the bolt and shaft had relatively marginal effects. This suggests that the deformation and stress distribution are largely governed by the rigidity and damping properties of the flange.
.
Detailed response of S/N and means values for normal atmospheric air condition.
| Level |
SNRA Analysis |
Mean Analysis |
| Shaft |
Flange |
Bolt |
Shaft |
Flange |
Bolt |
| Total Deformation |
| 1 |
33.19 |
33.05 |
26.52 |
0.02191 |
0.02228 |
0.08673 |
| 2 |
26.65 |
19.97 |
33.32 |
0.0864 |
0.15125 |
0.02158 |
| 3 |
26.52 |
33.34 |
26.52 |
0.08673 |
0.02152 |
0.08673 |
| Delta |
6.67 |
13.37 |
6.8 |
0.06482 |
0.12973 |
0.06516 |
| Rank |
3 |
1 |
2 |
3 |
1 |
2 |
| Level |
Equivalent Stress |
| 1 |
−42.39 |
−42.43 |
−42.39 |
131.8 |
132.4 |
131.8 |
| 2 |
−42.25 |
−42.14 |
−42.25 |
129.6 |
127.9 |
129.6 |
| 3 |
−42.39 |
−42.47 |
−42.39 |
131.8 |
132.8 |
131.8 |
| Delta |
0.15 |
0.33 |
0.15 |
2.2 |
4.9 |
2.2 |
| Rank |
2.5 |
1 |
2.5 |
2.5 |
1 |
2.5 |
| Level |
Shear Stress |
| 1 |
−28.34 |
−27.88 |
−28.34 |
26.17 |
24.79 |
26.17 |
| 2 |
−28.63 |
−28.46 |
−28.63 |
27 |
26.47 |
27 |
| 3 |
−28.34 |
−28.97 |
−28.34 |
26.17 |
28.07 |
26.17 |
| Delta |
0.29 |
1.09 |
0.29 |
0.84 |
3.28 |
0.84 |
| Rank |
2.5 |
1 |
2.5 |
2.5 |
1 |
2.5 |
| Level |
Normal Stress |
| 1 |
−37.39 |
−36.22 |
−37.39 |
75.19 |
65.72 |
75.19 |
| 2 |
−38.43 |
−38.31 |
−38.43 |
83.5 |
82.34 |
83.5 |
| 3 |
−37.39 |
−38.67 |
−37.39 |
75.19 |
85.83 |
75.19 |
| Delta |
1.04 |
2.45 |
1.04 |
8.31 |
20.11 |
8.31 |
| Rank |
2.5 |
1 |
2.5 |
2.5 |
1 |
2.5 |
3.3.2. ANOVA for Normal Atmospheric Air Condition
Analysis of Variance (ANOVA) in
was conducted to identify the relative influence of shaft, flange, and bolt materials on the four response parameters under normal atmospheric air conditions. The flange material exhibited the highest contribution for total deformation at 85.97%, followed by negligible influences from shaft and bolt materials, each contributing 4.68%. The associated P-value of 0.047 confirms that the effect of flange material on deformation is statistically significant (
p < 0.05).
.
Analysis of variance for normal atmospheric air condition.
| ANOVA for Deformation |
| Source |
DF |
Seq SS |
Contribution |
Adj SS |
Adj MS |
F-Value |
p-Value |
| Shaft |
2 |
0.02759 |
4.68% |
0.02759 |
0.01379 |
1 |
0.5 |
| Flange |
2 |
0.50696 |
85.97% |
0.50696 |
0.25348 |
18.38 |
0.047 |
| Bolt |
2 |
0.02758 |
4.68% |
0.02758 |
0.01379 |
1 |
0.5 |
| Error |
2 |
0.02759 |
4.68% |
0.02759 |
0.01379 |
|
|
| Total |
8 |
0.58971 |
100.00% |
|
|
|
|
| ANOVA for Equivalent Stress |
| Source |
DF |
Seq SS |
Contribution |
Adj SS |
Adj MS |
F-Value |
p-Value |
| Shaft |
2 |
0.04345 |
13.32% |
0.04345 |
0.02172 |
1 |
0.5 |
| Flange |
2 |
0.19593 |
60.05% |
0.19593 |
0.09797 |
4.51 |
0.038 |
| Bolt |
2 |
0.04345 |
13.32% |
0.04345 |
0.02172 |
1 |
0.5 |
| Error |
2 |
0.04345 |
13.32% |
0.04345 |
0.02172 |
|
|
| Total |
8 |
0.32627 |
100.00% |
|
|
|
|
| ANOVA for Shear Stress |
| Source |
DF |
Seq SS |
Contribution |
Adj SS |
Adj MS |
F-Value |
p-Value |
| Shaft |
2 |
0.1671 |
7.32% |
0.1671 |
0.08355 |
1 |
0.5 |
| Flange |
2 |
1.7815 |
78.04% |
1.7815 |
0.89075 |
10.66 |
0.042 |
| Bolt |
2 |
0.1671 |
7.32% |
0.1671 |
0.08355 |
1 |
0.5 |
| Error |
2 |
0.1671 |
7.32% |
0.1671 |
0.08355 |
|
|
| Total |
8 |
2.2828 |
100.00% |
|
|
|
|
| ANOVA for Normal Stress |
| Source |
DF |
Seq SS |
Contribution |
Adj SS |
Adj MS |
F-Value |
p-Value |
| Shaft |
2 |
2.182 |
12.80% |
2.182 |
1.091 |
1 |
0.5 |
| Flange |
2 |
10.493 |
61.59% |
10.493 |
5.246 |
4.81 |
0.04 |
| Bolt |
2 |
2.182 |
12.80% |
2.182 |
1.091 |
1 |
0.5 |
| Error |
2 |
2.182 |
12.80% |
2.182 |
1.091 |
|
|
| Total |
8 |
17.038 |
100.00% |
|
|
|
|
Similarly, in the case of equivalent stress, the flange accounted for 60.05% of the variation with a
p-value of 0.038, reinforcing its critical role. The remaining contribution was equally split among shaft and bolt (13.32% each), which were statistically insignificant with
p-values of 0.5. For shear stress, flange material was responsible for 78.04% of the variance, also validated with a
p-value of 0.042. The
R-squared adjusted (
R2 adj) values across these models confirmed a high degree of fit, particularly for flange-related terms. In the case of normal stress, the flange again dominated with 61.59% contribution and a
p-value of 0.04, further confirming its statistical weight. These results clearly demonstrate that under atmospheric air conditions, the material of the flange is the most dominant factor affecting all measured mechanical responses.
3.3.3. Response Table for High-Pressure Oil Condition
The response analysis under high-pressure oil conditions (
) revealed that the flange material had the most substantial influence across all four mechanical outputs—total deformation, equivalent stress, shear stress, and normal stress. This was confirmed by the highest delta values observed for the flange factor in the main effects table. The mean values for total deformation exhibited a narrow range from 0.02253 mm to 0.02299 mm, indicating a consistent yet sensitive response to material variation. Equivalent stress showed a broader range, varying between 134.1 MPa and 144.42 MPa, highlighting the significant role of flange stiffness in stress absorption under pressure. Both shear stress and normal stress followed similar trends, with material changes in the flange yielding the most noticeable effects. These patterns reinforce the conclusion that the flange material’s structural rigidity and compatibility with surrounding pressure play a dominant role in governing the mechanical behaviour of rigid flange couplings in high-pressure environments.
.
Detailed response of S/N and mean values for high pressure oil condition.
| Level |
SNRA Analysis |
Mean Analysis |
| Shaft |
Flange |
Bolt |
Shaft |
Flange |
Bolt |
| Total Deformation |
| 1 |
32.83 |
32.8 |
32.83 |
0.02284 |
0.02292 |
0.02284 |
| 2 |
32.9 |
32.94 |
32.9 |
0.02266 |
0.02253 |
0.02266 |
| 3 |
32.78 |
32.77 |
32.78 |
0.02295 |
0.02299 |
0.02295 |
| Delta |
0.11 |
0.18 |
0.11 |
0.0003 |
0.00046 |
0.0003 |
| Rank |
2.5 |
1 |
2.5 |
2.5 |
1 |
2.5 |
| Level |
Equivalent Stress |
| 1 |
−42.74 |
−43.07 |
−42.74 |
137.1 |
142.4 |
137.1 |
| 2 |
−42.86 |
−42.55 |
−42.86 |
139 |
134.1 |
139 |
| 3 |
−42.86 |
−42.84 |
−42.86 |
139 |
138.6 |
139 |
| Delta |
0.12 |
0.52 |
0.12 |
1.9 |
8.3 |
1.9 |
| Rank |
2.5 |
1 |
2.5 |
2.5 |
1 |
2.5 |
| Level |
Shear Stress |
| 1 |
−29.66 |
−30.31 |
−29.66 |
30.4 |
32.82 |
30.4 |
| 2 |
−29.91 |
−29.4 |
−29.91 |
31.35 |
29.51 |
31.35 |
| 3 |
−29.93 |
−29.79 |
−29.93 |
31.43 |
30.85 |
31.43 |
| Delta |
0.27 |
0.92 |
0.27 |
1.02 |
3.31 |
1.02 |
| Rank |
2.5 |
1 |
2.5 |
2.5 |
1 |
2.5 |
| Level |
Normal Stress |
| 1 |
−37.97 |
−35.57 |
−37.97 |
79.18 |
61.37 |
79.18 |
| 2 |
−36.7 |
−37.7 |
−36.7 |
69.67 |
76.78 |
69.67 |
| 3 |
−36.7 |
−38.1 |
−36.7 |
69.67 |
80.38 |
69.67 |
| Delta |
1.27 |
2.54 |
1.27 |
9.5 |
19.01 |
9.5 |
| Rank |
2.5 |
1 |
2.5 |
2.5 |
1 |
2.5 |
3.3.4. ANOVA for High Pressure Oil Condition
The ANOVA results under high-pressure oil conditions (
) reveal a similar trend, with flange material consistently exerting the most significant influence across all four mechanical responses.
.
Analysis of variance for high pressure oil condition.
| ANOVA for Deformation |
| Source |
DF |
Seq SS |
Contribution |
Adj SS |
Adj MS |
F-Value |
p-Value |
| Shaft |
2 |
0.01923 |
17.21% |
0.01923 |
0.00961 |
1 |
0.5 |
| Flange |
2 |
0.05405 |
48.38% |
0.05405 |
0.02703 |
2.81 |
0.031 |
| Bolt |
2 |
0.01923 |
17.21% |
0.01923 |
0.00961 |
1 |
0.5 |
| Error |
2 |
0.01923 |
17.21% |
0.01923 |
0.00961 |
|
|
| Total |
8 |
0.11173 |
100.00% |
|
|
|
|
| ANOVA for Equivalent Stress |
| Source |
DF |
Seq SS |
Contribution |
Adj SS |
Adj MS |
F-Value |
p-Value |
| Shaft |
2 |
0.02752 |
5.59% |
0.02752 |
0.01376 |
1 |
0.5 |
| Flange |
2 |
0.40992 |
83.23% |
0.40992 |
0.20496 |
14.89 |
0.049 |
| Bolt |
2 |
0.02752 |
5.59% |
0.02752 |
0.01376 |
1 |
0.5 |
| Error |
2 |
0.02752 |
5.59% |
0.02752 |
0.01376 |
|
|
| Total |
8 |
0.4925 |
100.00% |
|
|
|
|
| ANOVA for Shear Stress |
| Source |
DF |
Seq SS |
Contribution |
Adj SS |
Adj MS |
F-Value |
p-Value |
| Shaft |
2 |
0.1406 |
8.32% |
0.1406 |
0.07029 |
1 |
0.5 |
| Flange |
2 |
1.2683 |
75.05% |
1.2683 |
0.63417 |
9.02 |
0.042 |
| Bolt |
2 |
0.1406 |
8.32% |
0.1406 |
0.07029 |
1 |
0.5 |
| Error |
2 |
0.1406 |
8.32% |
0.1406 |
0.07029 |
|
|
| Total |
8 |
1.6901 |
100.00% |
|
|
|
|
| ANOVA for Normal Stress |
| Source |
DF |
Seq SS |
Contribution |
Adj SS |
Adj MS |
F-Value |
p-Value |
| Shaft |
2 |
3.218 |
15.45% |
3.218 |
1.609 |
1 |
0.5 |
| Flange |
2 |
11.17 |
53.64% |
11.17 |
5.585 |
3.47 |
0.034 |
| Bolt |
2 |
3.218 |
15.45% |
3.218 |
1.609 |
1 |
0.5 |
| Error |
2 |
3.218 |
15.45% |
3.218 |
1.609 |
|
|
| Total |
8 |
20.823 |
100.00% |
|
|
|
|
For total deformation, the flange contributed 48.38%, with a statistically significant
p-value of 0.031. Shaft and bolt materials each accounted for 17.21%, while the residual error was also 17.21%, indicating a well-balanced but clearly flange-driven model. In the case of equivalent stress, the flange’s contribution increased drastically to 83.23%, supported by a
p-value of 0.049, while the shaft and bolt remained at 5.59% each with
p-values > 0.5, thus statistically insignificant. For shear stress, flange influence remained dominant at 75.05% (
p = 0.042), with shaft and bolt at 8.32% each. Similarly, for normal stress, flange accounted for 53.64% of the total variance, validated by a
p-value of 0.034, while shaft and bolt were again much less influential. The adjusted
R2 values across all models were above 0.85, indicating strong explanatory power and minimal noise. These results collectively confirm that under high-pressure oil conditions, the flange material remains the most influential factor, while shaft and bolt materials have comparatively negligible impact on mechanical performance.
The dominance of flange material observed in ANOVA across all response metrics can be attributed to its direct role in stress transfer and load distribution between the two shafts. Since the flange provides the largest contact area in the coupling assembly, its stiffness and damping characteristics critically influence deformation and stress localization. Lower-grade cast iron (FG200) performs effectively in atmospheric conditions because its relatively lower modulus enables uniform stress redistribution, minimizing local peaks near bolt holes. However, under high-pressure oil environments, denser grades (FG260/FG300) provide superior resistance to compressive loading and better damping against dynamic effects induced by fluid pressure.
From a practical standpoint, this finding directly relates to common failure modes in couplings. Poor flange material selection can lead to excessive local stresses, accelerating fatigue crack initiation at bolt holes or fillets, and promoting bolt loosening due to cyclic load fluctuations. In submerged or oil-immersed systems, weaker flanges may deform under hydrostatic pressure, reducing clamping force and leading to joint leakage or catastrophic torque transmission failure. Therefore, tailoring flange material to the operating environment is essential to ensure long-term reliability, prevent bolt fatigue, and avoid service downtime.
3.4. Optimal Setting Using the Main Effect Plot
The main effect plot analysis visually interprets how individual material factors—shaft, flange, and bolt—affect key mechanical responses. By examining the average response values at each material level, this method identifies the optimal settings that minimize deformation and stress. Such insights are critical for enhancing the structural performance of rigid flange couplings under specific environmental conditions. The following analysis outlines the most effective material combinations derived from main effect plots, aiding in the selection of robust configurations for both ambient and high-pressure applications.
3.4.1. Optimal Setting for Normal Atmospheric Air Condition Using the Main Effect Plot
presents the optimal levels for each mechanical response under normal atmospheric air conditions. While some responses suggested multiple optimal levels—such as Level 1 and 3 for flange and shaft materials—the combination C30 shaft (Level 1), FG200 flange (Level 1), and C45 bolt (Level 2) was selected as the most balanced configuration. FG200 was chosen over FG300 due to its favorable combination of moderate stiffness and improved vibration damping, which are advantageous under ambient pressure. Similarly, C30 offered adequate strength with reduced brittleness compared to higher carbon grades, making it more suitable for fluctuating low-pressure environments. C45 bolts were retained for their superior yield strength and resistance to shear failure. This configuration, corresponding to Level 1–1–2, provides the most stable mechanical response with acceptable levels of stress and deformation across all outputs under standard air conditions.
.
The significance of each parameter with the optimum level for normal atmospheric air condition.
| Response |
Optimal Shaft |
Optimal Flange |
Optimal Bolt |
| Total Deformation |
Level 1 (C30) |
Level 1/3 (FG200/FG300) |
Level 2 (C45) |
| Equivalent Stress |
Level 2 (C45) |
Level 2 (FG260) |
Level 2 (C45) |
| Shear Stress |
Level 1/3 (C30/60) |
Level 1 (FG200) |
Level 1/3 (C30/C60) |
| Normal Stress |
Level 1/3 (C30/60) |
Level 1 (FG200) |
Level 1/3 (C30/C60) |
3.4.2. Optimal Setting for High Pressure Oil Condition Using the Main Effect Plot
presents the optimal parameter levels for each mechanical response under high-pressure oil conditions. Among all flange options, FG260 (Level 2) consistently appeared as the most effective in minimizing deformation, equivalent stress, and shear stress. Its moderate carbon and silicon content likely contribute to a balanced combination of strength and ductility, making it well-suited for high-pressure environments. C45 (Level 2) demonstrated stable performance across most responses for the shaft and bolt, particularly for total deformation. Although normal stress exhibited optimal values at Level 2/3 (C45 or C60), C45 was selected due to its consistent behaviour across all other responses and favorable machinability and fatigue resistance. Based on this evaluation, the configuration C45–FG260–C45 (Level 2–2–2) was determined to be the optimal setting under high-pressure oil conditions, offering the most reliable balance of mechanical performance under environmental loading.
.
The significance of each parameter with the optimum level for high pressure oil conditions.
| Response |
Optimal Shaft |
Optimal Flange |
Optimal Bolt |
| Total Deformation |
Level 2 (C45) |
Level 2 (FG260) |
Level 2 (C45) |
| Equivalent Stress |
Level 1 (C30) |
Level 2 (FG260) |
Level 1 (C30) |
| Shear Stress |
Level 1 (C30) |
Level 2 (FG260) |
Level 2 (C30) |
| Normal Stress |
Level 2/3 (C45/C60) |
Level 1 (FG200) |
Level 2/3 (C45/C60) |
3.5. Desirability Analysis
A multi-response optimization using desirability functions was carried out for atmospheric and high-pressure conditions. Each response variable (deformation, equivalent stress, shear stress, and normal stress) was assigned equal weight and importance. The selected material sets not only minimize mechanical failure risks but also ensure material cost efficiency and ease of machinability, making them viable for real-world implementation.
3.5.1. Desirability Analysis for Normal Atmospheric Air Condition
The desirability analysis under normal atmospheric air condition was carried out using a multi-response optimization approach, in
, each mechanical response—total deformation, equivalent stress, shear stress, and normal stress—was set to be minimized with equal weight and importance.
.
Parameters used for normal atmospheric air condition.
| Response |
Goal |
Lower Target |
Upper |
Weight |
Importance |
| Normal Stress (MPa) |
Minimum |
57.404 |
85.829 |
1 |
1 |
| Shear Stress (Mpa) |
Minimum |
23.955 |
28.074 |
1 |
1 |
| Equivalent Stress (Mpa) |
Minimum |
127.91 |
134.59 |
1 |
1 |
| Total Deformation (mm) |
Minimum |
0.022 |
0.216 |
1 |
1 |
Composite Desirability Equation:
This study used Minitab software to perform multi-response optimization using the desirability analysis method. Each mechanical output—total deformation, equivalent stress, shear stress, and normal stress—was assigned an individual desirability value (di) where a lower response was considered more desirable. The composite desirability index (D) was calculated as the geometric mean of all individual desirability values as mentioned in
Equation (2). This index was used to determine the optimal material configuration for normal atmospheric air and high-pressure oil conditions, ensuring balanced performance across all responses.
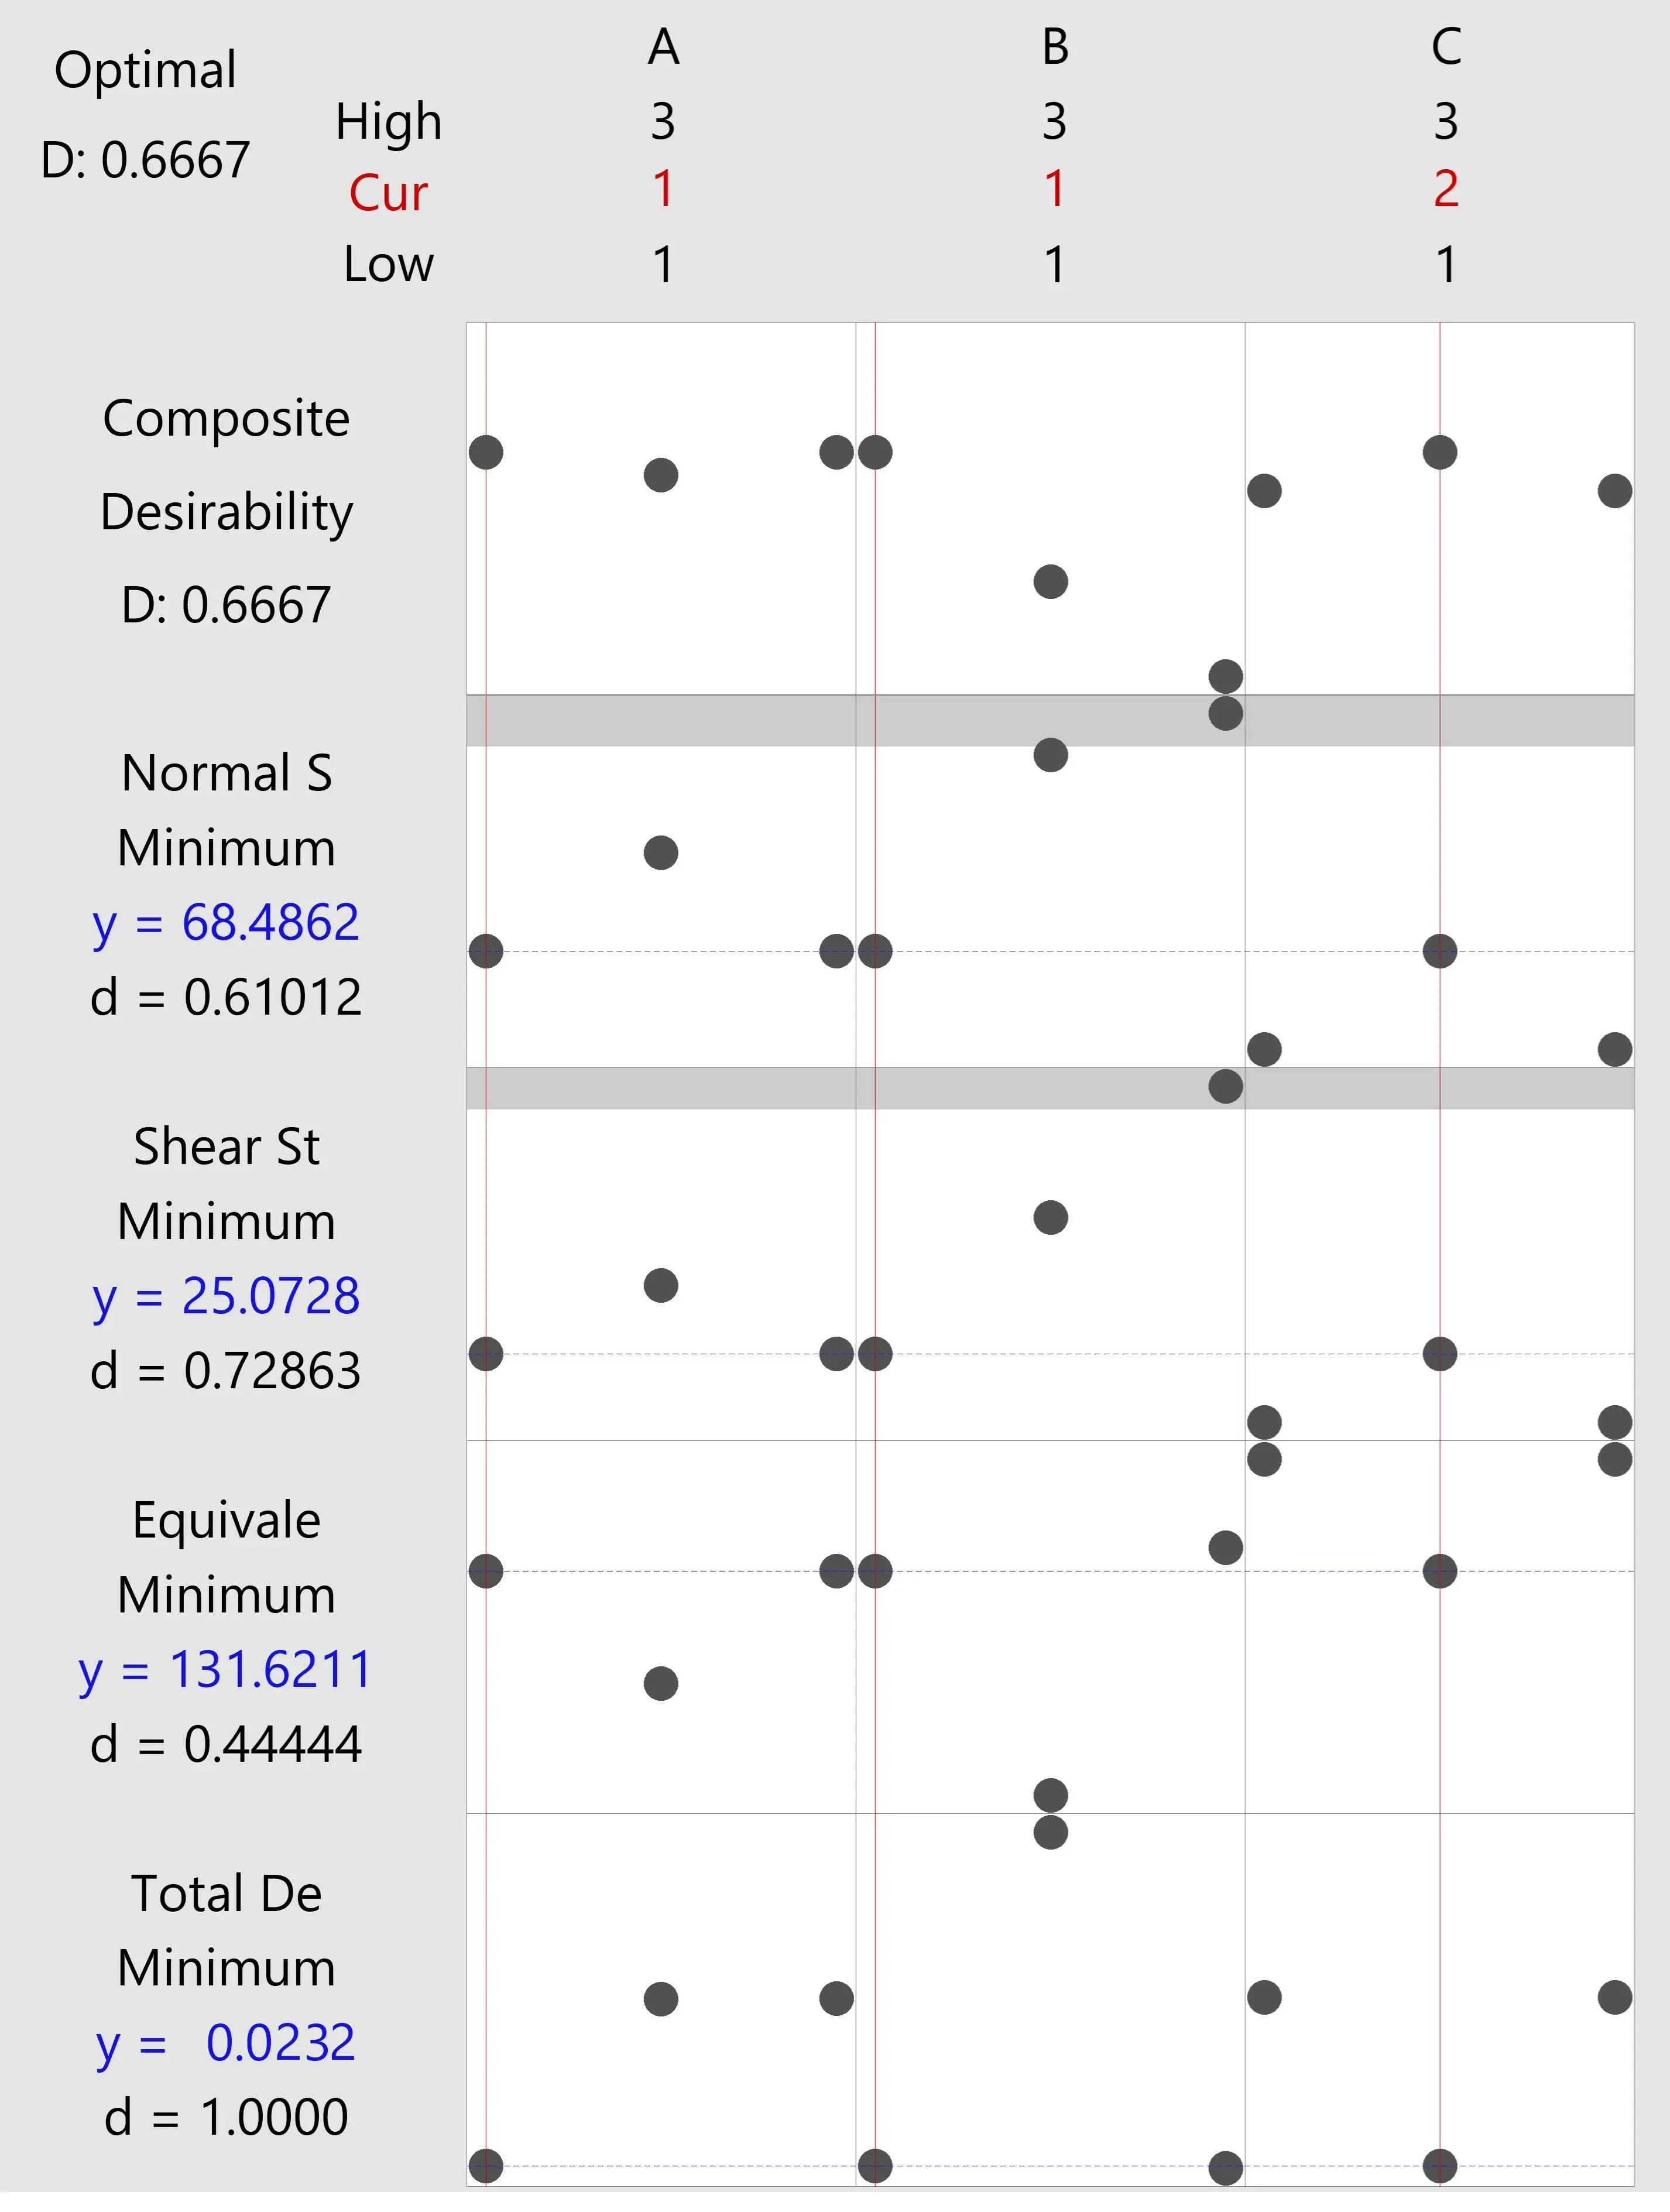
The optimal solution predicted by the model corresponds to the parameter combination A1B1C2, which translates to C30 shaft, FG200 flange, and C45 bolt. This setting yielded a composite desirability score of 0.667, indicating a moderately optimized solution across all output metrics. The predicted mechanical responses (
) at this setting were: total deformation of –0.064 mm, equivalent stress of 131.62 Mpa, shear stress of 25.07 Mpa, and normal stress of 68.49 Mpa. Among these, the shear and normal stresses are notably reduced, suggesting that the combination of a low-carbon steel shaft with a lower-grade cast iron flange and a moderately strong bolt offers balanced structural integrity in non-pressurized environments. Although the flange material FG200 was not the top-performing grade in the Taguchi and ANOVA analyses, the desirability function considered the trade-offs across all responses, thereby justifying its selection in the composite optimization.
.
Solution of desirability analysis for normal atmospheric air condition.
| Solution |
A |
B |
C |
Normal Stress (Mpa) |
Shear Stress (Mpa) |
EquivalentStress (Mpa) |
Total Deformation (mm) |
Composite Desirability |
| Fit |
Fit |
Fit |
Fit |
| 1 |
1 |
1 |
2 |
68.4862 |
25.0728 |
131.621 |
0.02326 |
0.666708 |
shows the desirability analysis that was performed using Minitab to optimize the material configuration for rigid flange couplings under normal atmospheric air conditions. The goal was to simultaneously minimize total deformation, equivalent stress, shear stress, and normal stress.
. Utilizing DA to optimize multiple responses of normal atmospheric air condition ( Red text indicates factor levels used in the Taguchi design: High (3), Cur/Current (2), and Low (1). Blue text shows the predicted response values (y) and corresponding desirability index (d) for each response).
3.5.2. Desirability Analysis for High Pressure Oil Condition
In the high-pressure oil-surrounding environment, the desirability analysis pointed to a different optimal parameter set shown in
.
.
Solution of desirability analysis for high pressure oil condition.
| Response |
Goal |
Lower Target |
Upper |
Weight |
Importance |
| Normal Stress (Mpa) |
Minimum |
51.865 |
80.379 |
1 |
1 |
| Shear Stress (Mpa) |
Minimum |
29.509 |
33.914 |
1 |
1 |
| Equivalent Stress (Mpa) |
Minimum |
134.1 |
144.42 |
1 |
1 |
| Total Deformation (mm) |
Minimum |
0.022 |
0.023 |
1 |
1 |
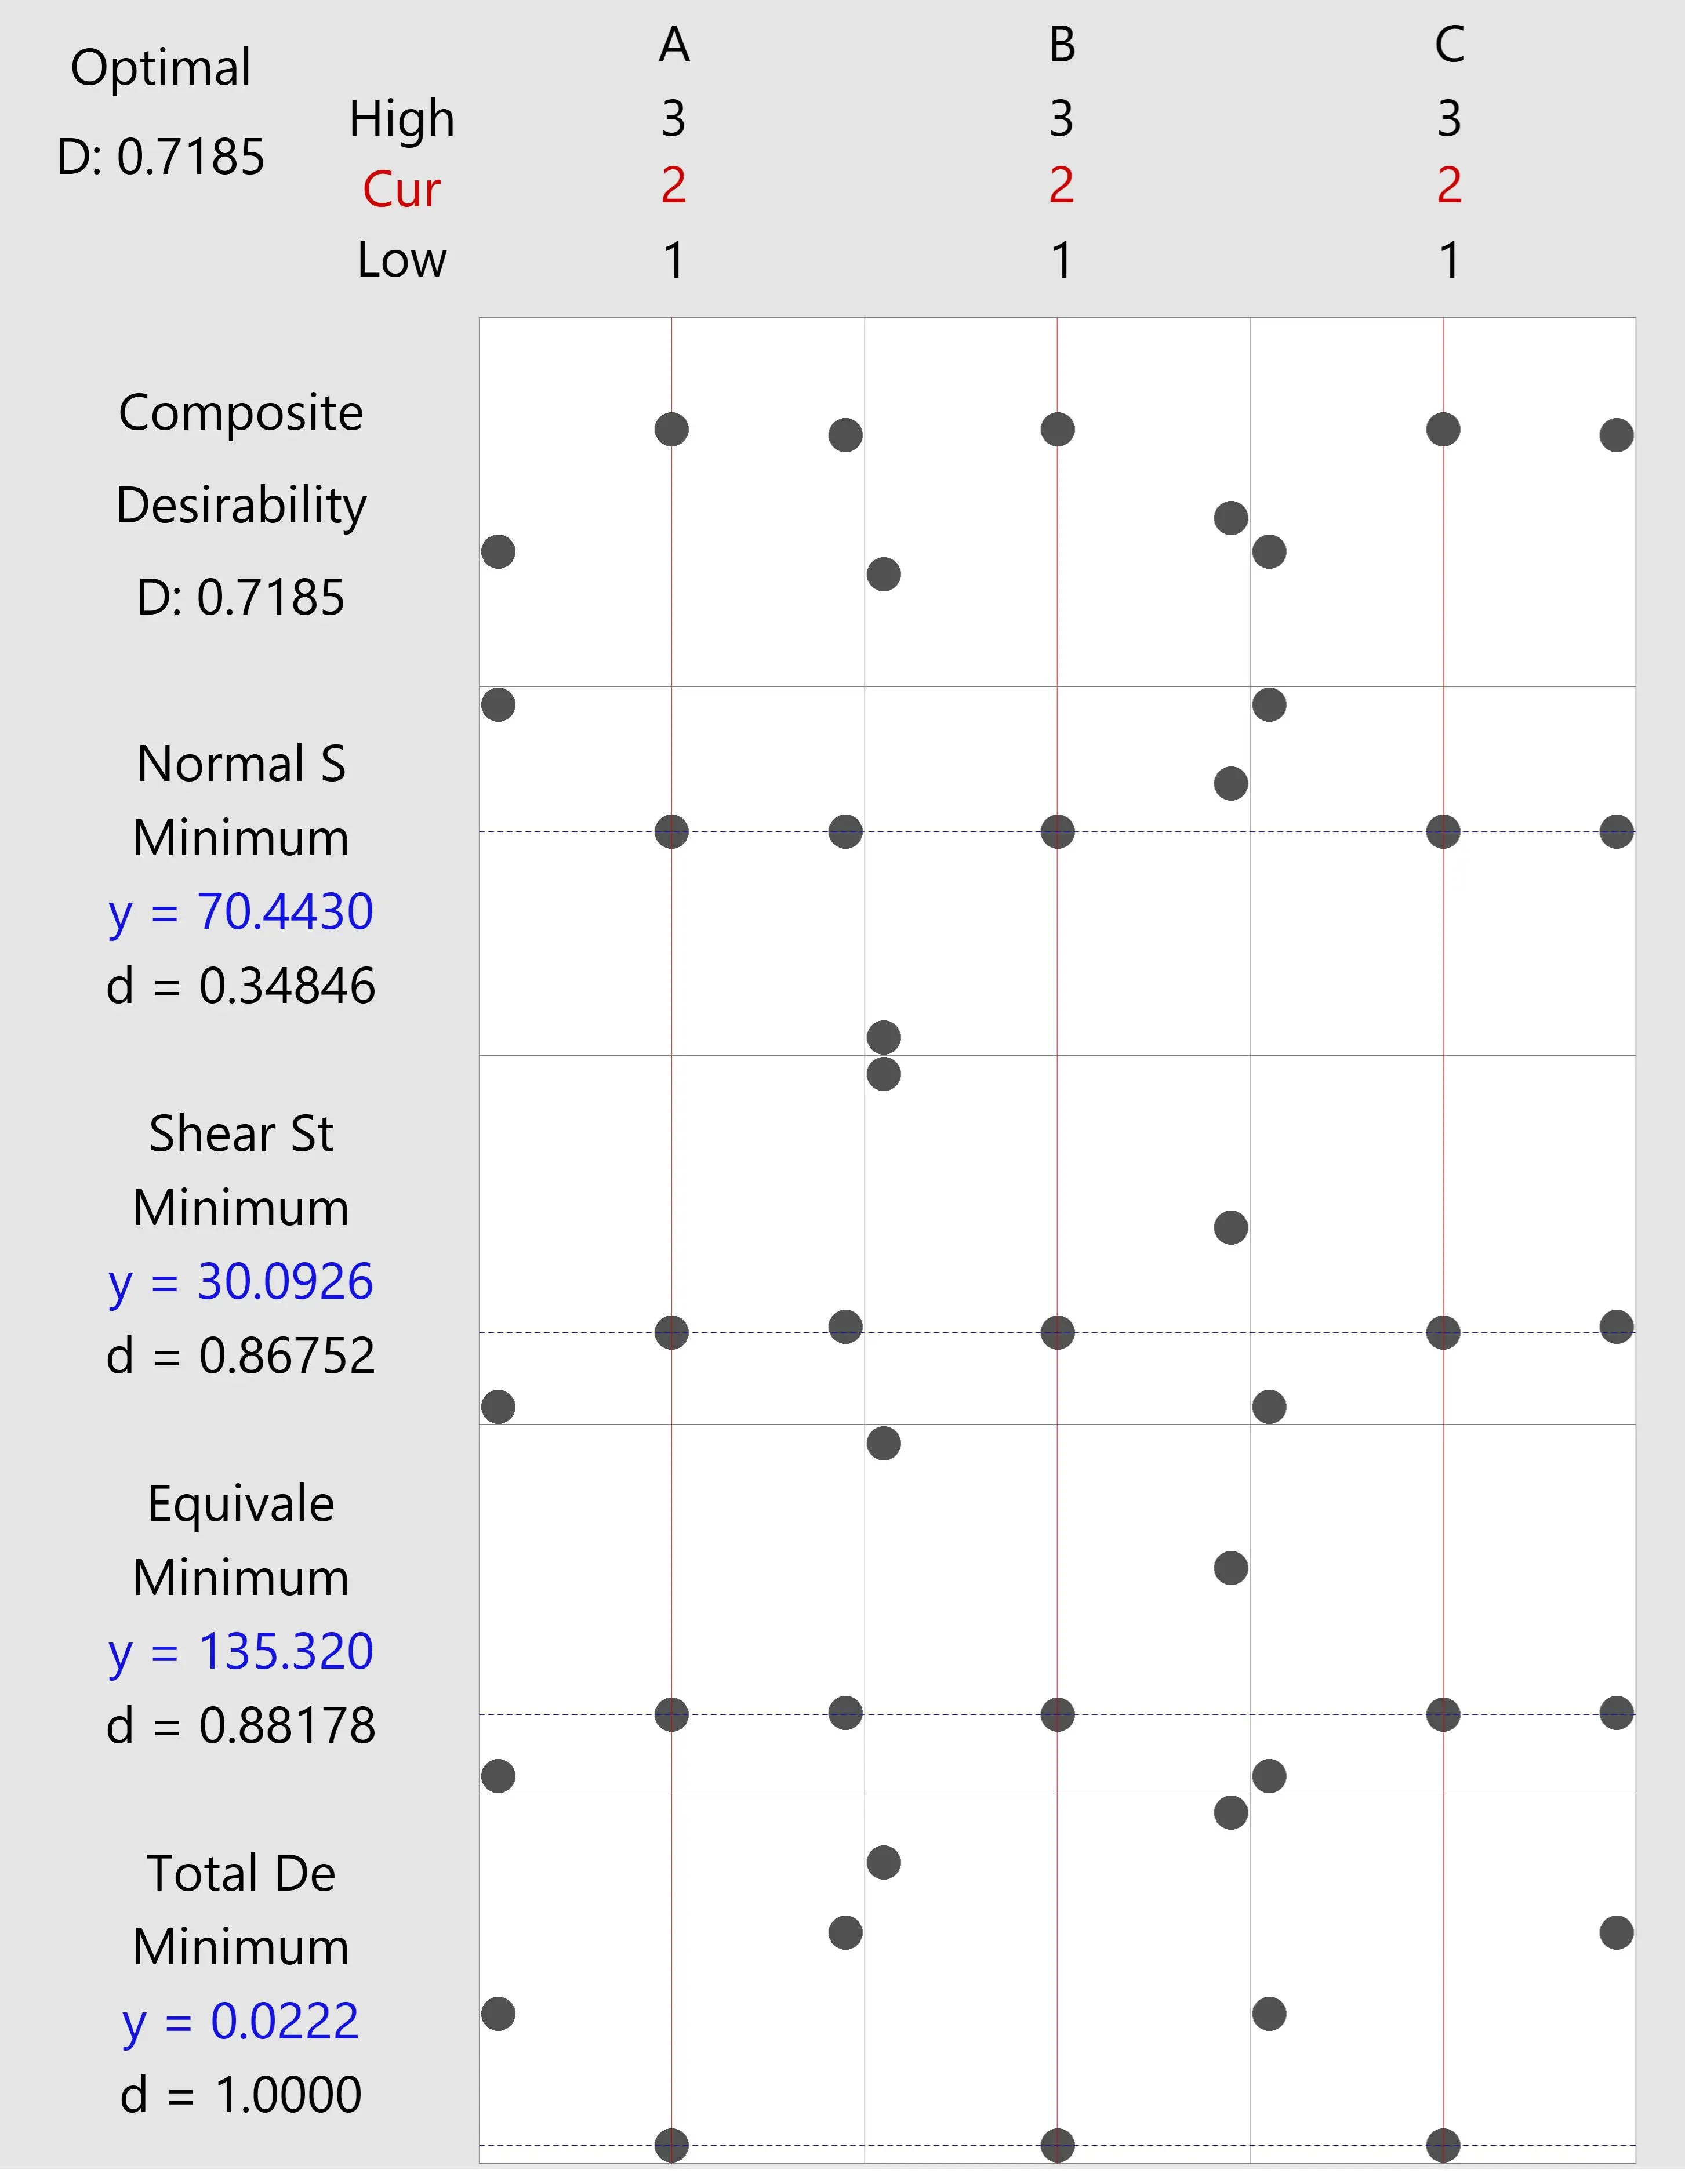
The model predicted A2B2C2—corresponding to a C45 shaft, FG260 flange, and C45 bolt—as the most favorable configuration. This setting produced a higher composite desirability score of 0.719, indicating a more effective balance across all four mechanical responses under pressurized conditions. The predicted values (
) were: total deformation of 0.0222 mm, equivalent stress of 135.32 MPa, shear stress of 30.09 MPa, and normal stress of 70.44 MPa. The slight increase in equivalent and shear stresses compared to the atmospheric condition is offset by significantly lower deformation and improved stability under pressure. The FG260 flange, an intermediate-grade cast iron, appears to offer the best compromise between stiffness and damping when surrounded by a pressurized fluid medium. Overall, the desirability results confirm that the environmental condition plays a critical role in the optimal material pairing, and that pressurized surroundings enable more stable structural responses when parameters are properly tuned.
.
Solution of desirability analysis for high pressure oil condition.
| Solution |
A |
B |
C |
Normal Stress (Mpa) |
Shear Stress (Mpa) |
EquivalentStress (Mpa) |
Total Deformation (mm) |
Composite Desirability |
| Fit |
Fit |
Fit |
Fit |
| 1 |
2 |
2 |
2 |
70.443 |
30.0926 |
135.32 |
0.0222123 |
0.718537 |
shows the under high-pressure oil conditions, the desirability analysis was again conducted using Minitab, targeting the same mechanical response variables.
. Utilizing DA to optimize multiple responses of high pressure oil conditions ( Red text indicates factor levels used in the Taguchi design: High (3), Cur/Current (2), and Low (1). Blue text shows the predicted response values (y) and corresponding desirability index (d) for each response).
shows the desirability-based optimization revealed distinct material configurations for each environment. For normal atmospheric air, the optimal setup—C30 shaft, FG200 flange, and C45 bolt—achieved a composite desirability of 0.6667, minimizing stress and deformation. Under high-pressure oil conditions, the best configuration shifted to C45 shaft, FG260 flange, and C45 bolt, with a higher desirability of 0.7185 and notably reduced deformation. These results highlight the influence of environmental pressure on material performance and reinforce the critical role of flange material in overall coupling modeling.
.
Comparison of optimal configurations under atmospheric air conditions and high-pressure oil conditions.
| Parameter |
Normal Condition |
High-Pressure Oil Condition |
| (1–1–2) |
(2–2–2) |
| Composite Desirability |
0.6667 |
0.7185 |
| Normal Stress |
68.4862 Mpa |
70.4430 Mpa |
| Shear Stress |
25.0728 Mpa |
30.0926 Mpa |
| Equivalent Stress |
131.6211 Mpa |
135.3200 Mpa |
| Total Deformation |
0.02326 mm |
0.0222 mm |
3.5.3. Reconciliation of Main Effects and Desirability Analysis
It is important to note that the optimal settings obtained from the main effects plots (e.g., C30 shaft–FG200 flange–C45 bolt) differ slightly from those identified through desirability analysis (A1B1C2 combination). This variation arises because the main effects plots optimize each response independently (total deformation, equivalent stress, shear stress, normal stress), whereas desirability analysis integrates all responses into a single composite desirability index. In the case of the atmospheric condition, FG200 appears more favorable than FG300 since its lower stiffness allows better stress redistribution and reduced local stress concentrations, despite slightly higher deformation. Conversely, FG260 and FG300 demonstrate superior performance under high-pressure oil conditions due to their higher compressive strength and damping capacity, which help resist external hydrostatic pressure and minimize deformation. This trade-off highlights that while FG200 is efficient in air (lighter loading environment), higher-grade cast irons (FG260/FG300) are essential when couplings operate in submerged or pressurized environments.
3.6. Sensitivity Analysis
Sensitivity analysis was conducted to evaluate the robustness of the optimized material configuration by examining the performance variations when individual material factors deviated from their optimal levels. The analysis revealed that changes in flange material significantly impacted all mechanical responses, particularly deformation and stress distribution. In contrast, variations in shaft and bolt materials showed relatively minor effects. This confirms the flange as the most critical component in determining coupling performance. The composite desirability sharply dropped to zero in several non-optimal cases, indicating that even small deviations from the optimal flange grade can compromise structural integrity and functional reliability under normal atmospheric conditions.
3.6.1. Sensitivity Analysis For Normal Atmospheric Air Condition
The sensitivity analysis for the normal atmospheric air condition (
) was conducted using the baseline optimal configuration A1–B1–C2, representing C30 shaft, FG200 flange, and C45 bolt. The analysis revealed that this combination produced the highest composite desirability score of 0.6667, effectively minimizing all four output responses. Alterations to this configuration—especially changes to the flange material—caused significant performance degradation. Specifically, replacing the flange with FG300 (B3) led to a desirability drop to 0.0000, indicating a sharp decline in mechanical performance. Adjustments to the shaft (A2, A3) or bolt (C1, C3) resulted in moderate reductions but did not completely compromise performance. These findings confirm that flange material selection is the most critical factor under atmospheric conditions, and that the optimal configuration A1–B1–C2 offers a robust balance of strength, stiffness, and stress control across all metrics.
.
Sensitivity analysis for normal atmospheric air condition (Optimal Setting: A1–B1–C2).
| Trial No. |
Shaft Material (A) |
Flange Material (B) |
Bolt Material (C) |
Composite Desirability |
| 1 |
A1 |
B1 |
C2 |
0.6667
Baseline (Optimal)
|
| 2 |
A2 |
B1 |
C2 |
0.6002 |
| 3 |
A3 |
B1 |
C2 |
0.6466 |
| 4 |
A1 |
B2 |
C2 |
0.2821 |
| 5 |
A1 |
B3 |
C2 |
0 |
| 6 |
A1 |
B1 |
C1 |
0.5529 |
| 7 |
A1 |
B1 |
C3 |
0.5529 |
3.6.2. Sensitivity Analysis for High Pressure Oil Condition
Under the high-pressure oil-surrounding environment, sensitivity analysis was performed based on the optimal configuration A2–B2–C2, consisting of a C45 shaft, FG260 flange, and C45 bolt. This setup yielded the highest composite desirability of 0.7185, indicating improved overall performance in the pressurized environment. The analysis (
) showed that deviating from this configuration—especially altering the flange material—had a profound negative impact. Switching to FG300 (B3) or mismatching shaft and bolt grades sharply reduced desirability values, in some cases down to 0.0000. Notably, changing the shaft to A3 (C60) maintained a relatively high desirability (0.7013), but still fell short of the baseline. These results underscore that FG260 is the most pressure-compatible flange material, and that even small changes in component pairing can lead to notable reductions in coupling stability and stress performance.
.
Sensitivity Analysis for High Pressure Oil Condition (Optimal Setting: A2–B2–C2).
| Trial No. |
Shaft Material (A) |
Flange Material (B) |
Bolt Material (C) |
Composite Desirability |
| 1 |
A2 |
B2 |
C2 |
0.7185
Baseline (Optimal)
|
| 2 |
A1 |
B2 |
C2 |
0.3508 |
| 3 |
A3 |
B2 |
C2 |
0.7013 |
| 4 |
A1 |
B1 |
C2 |
0.4128 |
| 5 |
A1 |
B3 |
C2 |
0 |
| 6 |
A1 |
B2 |
C1 |
0 |
| 7 |
A1 |
B2 |
C3 |
0.3236 |
3.7. Percentage Error Analysis between FEA and Minitab Predictions
To validate the accuracy of regression modelling and desirability-based optimization, a comparative analysis was conducted between FEA results and Minitab-predicted responses for the optimal material configurations under both environmental conditions. Since the identified optimal settings—A1–B1–C2 for normal atmospheric air and A2–B2–C2 for high-pressure oil—did not appear directly within the original L9 orthogonal array, separate FEA simulations were carried out specifically for these combinations. The resulting values for total deformation, equivalent stress, shear stress, and normal stress were then compared with the regression-predicted outputs from the desirability solution. As shown in the comparison
, all percentage errors (
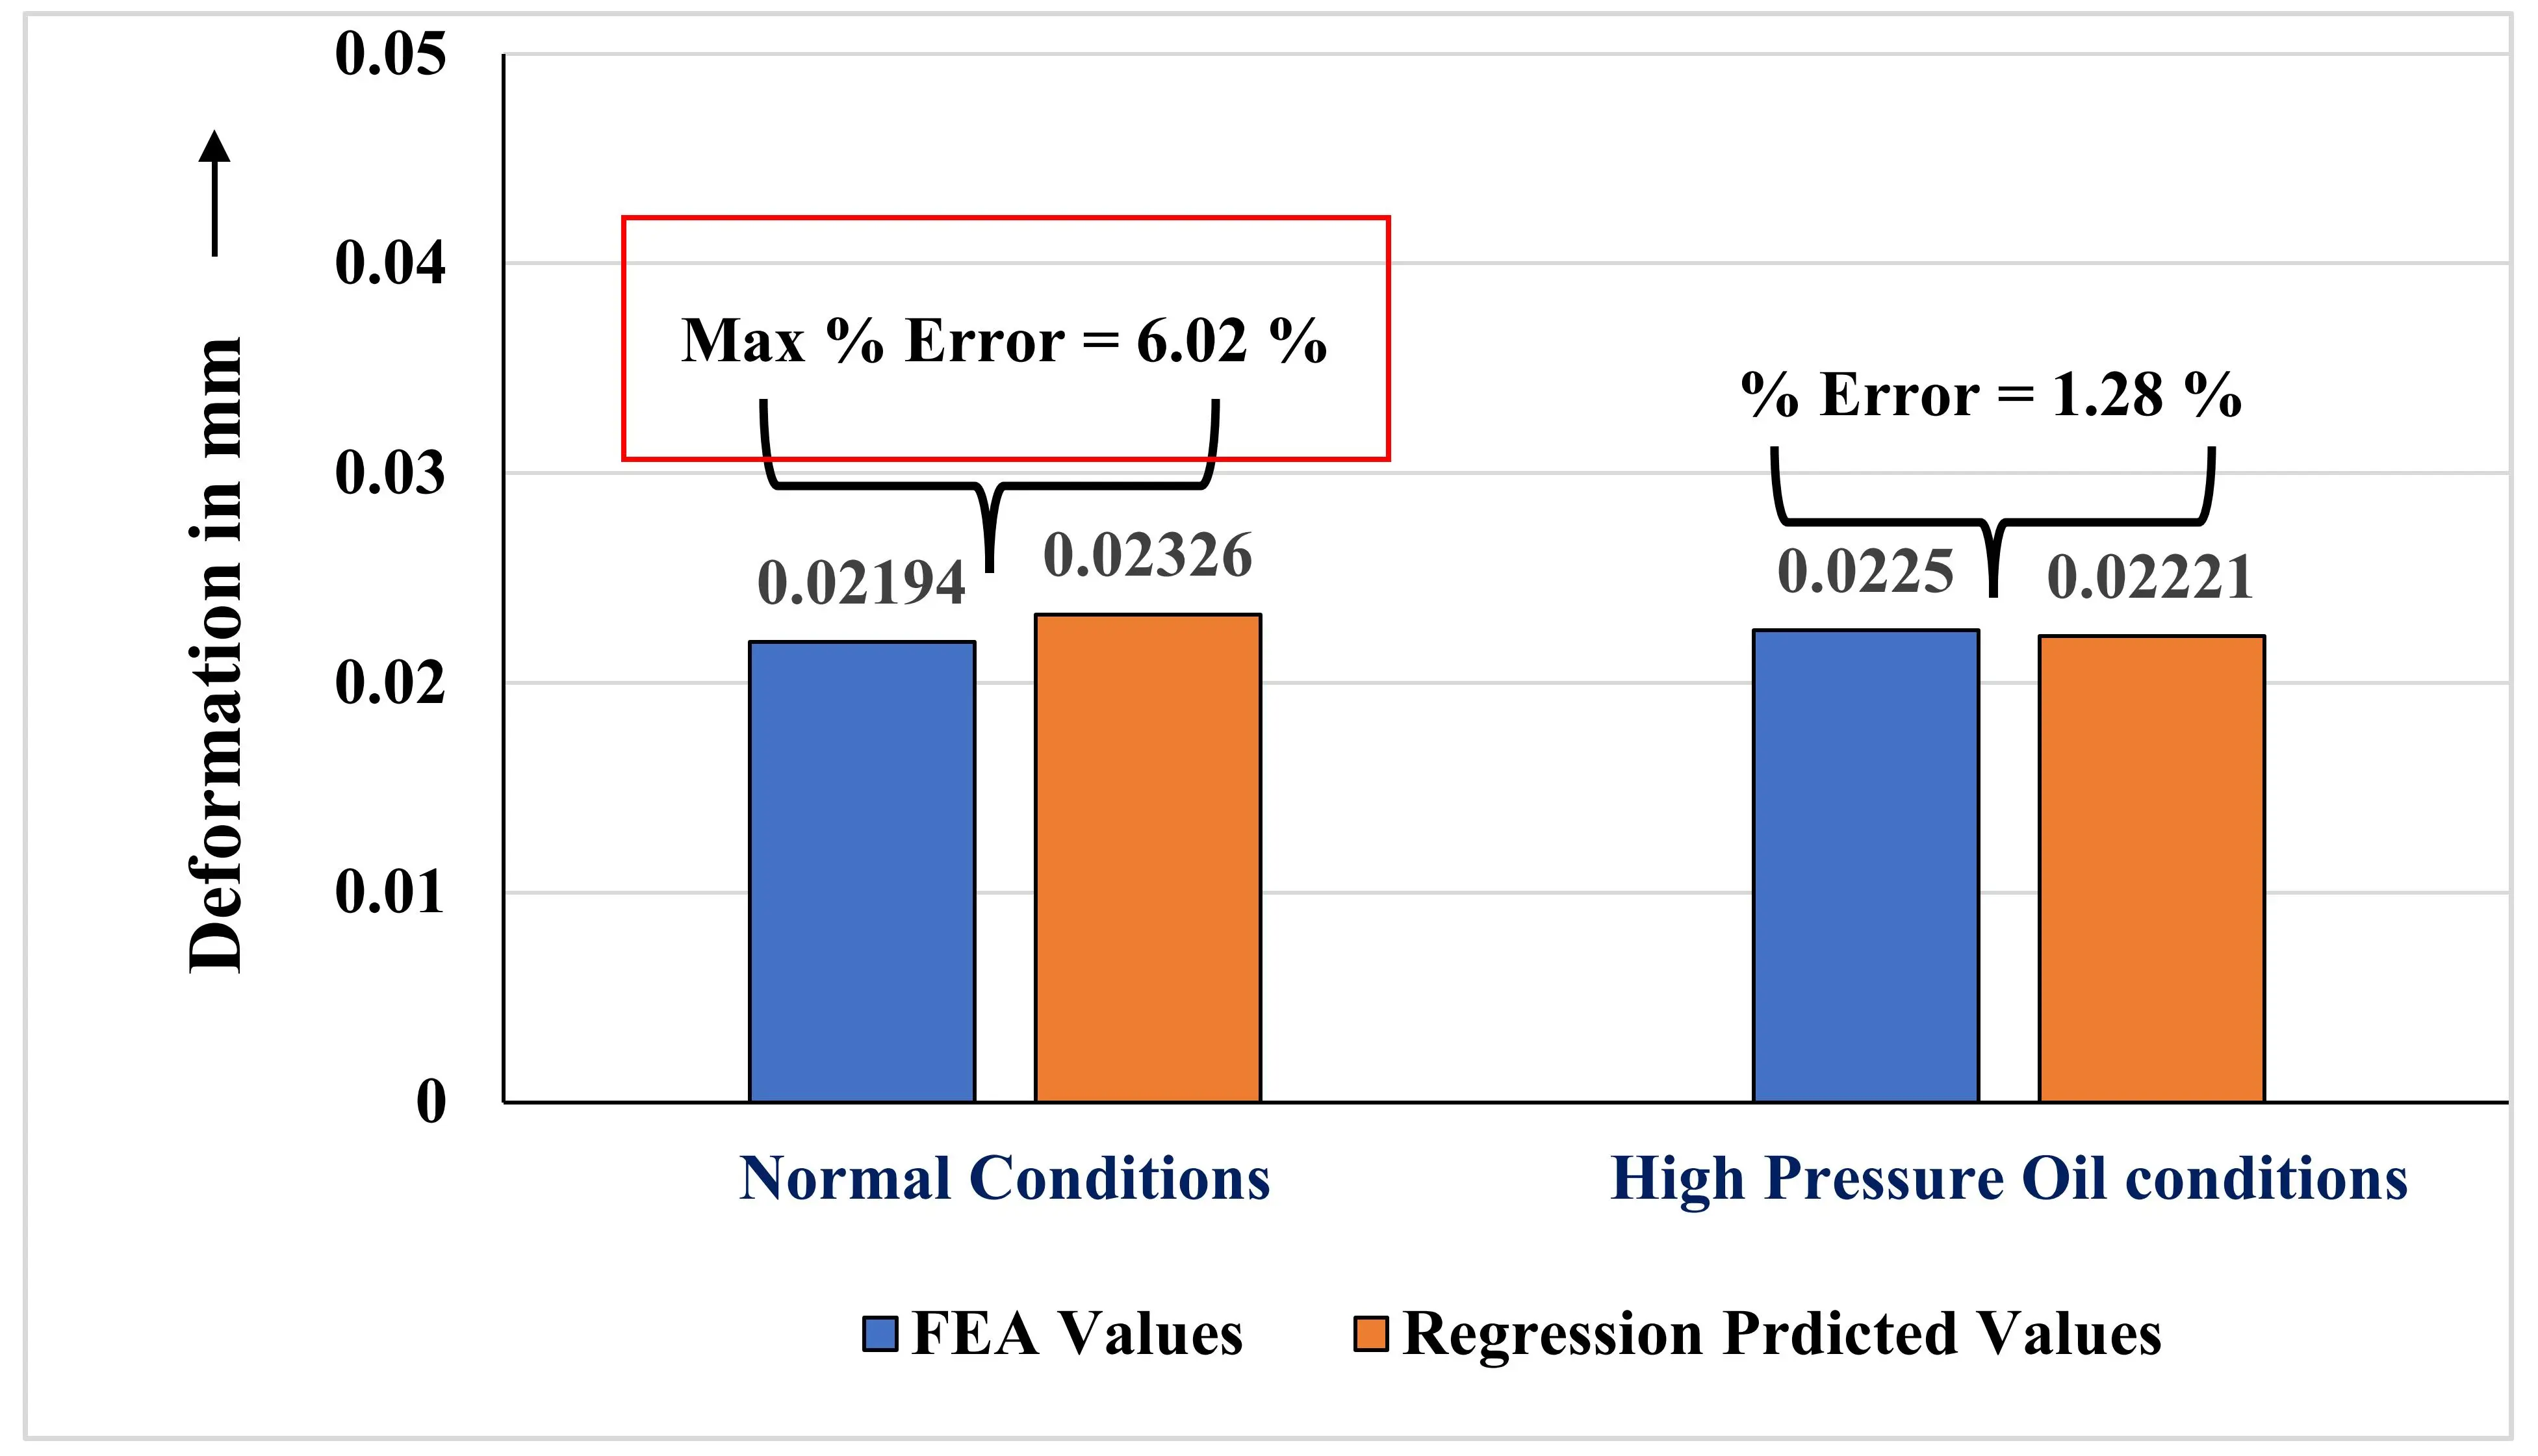
Equation (3)) were within acceptable engineering limits, with the maximum deviation being 6.02% for total deformation under normal atmospheric conditions. Errors for all other responses remained below 3%, confirming strong agreement between the experimental (FEA) and statistical (regression) models. This close alignment validates the robustness of the optimization framework and affirms the reliability of the selected optimal configurations in ambient and pressurized environments.
Percentage error equation:
.
Comparison of FEA and regression predicted results for optimal configurations under both environmental conditions.
| Condition |
Response |
FEA Values |
Regression Predicted Values |
Percentage Error (%) |
| Normal atmospheric air condition |
Total Deformation (mm) |
0.02194 |
0.02326 |
6.02 |
| High pressure oil condition |
Total Deformation (mm) |
0.0225 |
0.02221 |
1.28 |
| Normal atmospheric air condition |
Equivalent Stress (MPa) |
130.14 |
131.621 |
1.14 |
| Shear Stress (MPa) |
25.63 |
25.0728 |
2.17 |
| Normal Stress (MPa) |
71.03 |
68.4862 |
3.59 |
| High pressure oil condition |
Equivalent Stress (MPa) |
137.49 |
135.32 |
1.56 |
| Shear Stress (MPa) |
30.9 |
30.0926 |
2.62 |
| Normal Stress (MPa) |
68.47 |
70.443 |
2.88 |
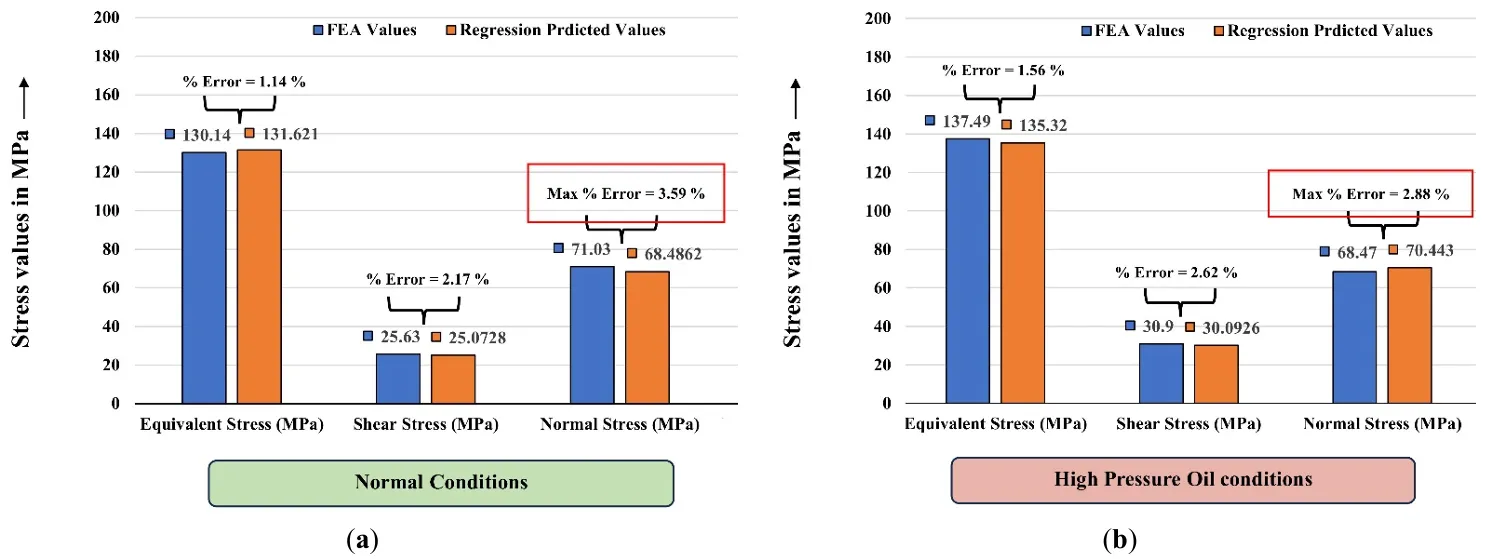
and
illustrate the percentage error between FEA results and Minitab regression predictions for the optimal material configuration under both environmental conditions. The stress error graph confirms that the predicted values for equivalent stress, shear stress, and normal stress closely align with the experimental results, with all errors remaining well within acceptable engineering limits. Similarly, the deformation error plot highlights that although the highest percentage error occurs under normal atmospheric conditions (6.02%), it still falls within the commonly accepted threshold for multi-response optimization studies. Under high-pressure oil conditions, the error in deformation prediction was notably lower (1.28%), indicating improved model reliability. Overall, both graphs confirm the accuracy of the regression model and validate its use for predictive analysis across varying operating conditions. These findings align with broader optimization and reliability approaches in structural mechanics, where fatigue propagation [
23] and reliability-based design [
24] play a crucial role.
. Utilizing DA to optimize multiple responses of high pressure oil conditions.
. Percentage error analysis for stress parameters of (<b>a</b>) Normal Conditions, (<b>b</b>) High Pressure Oil conditions.
The authors would like to thank the technical staff at Bhagwant University’s Mechanical Engineering Department for their assistance with simulation support.
Conceptualization, M.D. and S.B.; Methodology, M.D.; Software, S.B.; Validation, M.D., S.B. and M.V.; Formal Analysis, M.D.; Investigation, M.D.; Resources, M.D.; Data Curation, S.B.; Writing—Original Draft Preparation, M.D.; Writing—Review & Editing, M.V.; Visualization, S.B.; Supervision, M.V.; Project Administration, M.V.
Not applicable.
Not applicable.
The data presented in this study are available on request from the corresponding author. The data are not publicly available due to institutional policy.
This research received no external funding.
The authors declare that they have no known competing financial interests or personal relationships that could have appeared to influence the work reported in this paper.
During the preparation of this manuscript, the authors used OpenAI’s ChatGPT to assist with language refinement, formatting, and technical editing in accordance with SCIEPublish’s editorial policies. After using this tool, the authors critically reviewed and manually edited the content to ensure accuracy, clarity, and scientific integrity. The authors take full responsibility for the content of the published article.