1. Introduction
With the constantly growing global energy demand, wind energy, acknowledged as a highly promising renewable energy source [
1], has garnered increasing recognition and popularity, especially in the realm of offshore wind energy. In 2019, the offshore wind power market broke through the milestone of 6.0 GW, accounting for 10% of the new installed capacity in the same year. In 2022, the world’s offshore wind power capacity will increase by 9.4 GW, and the total global installed capacity of offshore wind power is expected to reach 57.6 GW by the end of 2022 [
2]. The development and utilization of offshore wind energy have been recognized as key priorities in helping address global energy depletion issues.
Although offshore wind power has made significant progress on a global scale and has become a crucial component of renewable energy, there are still unresolved issues regarding its reliability and maintenance. Offshore wind farms are exposed to extremely harsh environmental conditions such as strong winds, waves, and salt fog [
3]. These natural conditions critically affect wind turbine components, increasing their vulnerability to corrosion, fatigue, and damage from salt spray on metal parts and strong winds/waves, causing structural wear. Secondly, according to reports, the operation and maintenance costs of wind turbines are quite high, accounting for about 25–30% of the total power generation cost and 75% to 90% of the investment cost [
4]. This data reflects the maintenance difficulty and cost pressure of offshore wind power. Moreover, the service life of wind turbine components is usually only 20–30 years [
5], which means that multiple large-scale component replacements and repairs may be required throughout the life cycle of the wind farm. Each maintenance operation may entail substantial economic and time expenses, especially when considering the integration of technological advancements and component upgrades, which can necessitate adjustments in technology and strategy, further complicating and heightening risks in long-term operations.
Due to the harsh environmental conditions, the offshore wind turbine has a variety of damage modes and damaged components, which in turn affects the selection of the algorithm applied to it [
6]. The traditional defect detection for offshore wind turbines primarily relies on two methods [
7]. On one hand, technicians conduct on-site visual inspections where they observe the surface of the wind turbine using their naked eyes and auxiliary equipment such as telephoto cameras to identify visible cracks, wear, corrosion, or other forms of damage. While this approach is intuitive and relatively easy to implement, its limitations lie in its ability to detect only surface-level defects, which are subject to the experience and technical proficiency of the inspectors, thereby limiting its effectiveness in identifying internal structural issues or minute flaws. On the other hand, modern wind energy facilities often employ sensor monitoring systems to track their operating status and potential problems continuously. These systems collect data in real time and analyze changes in the performance of turbine components during operation, thus providing early warnings of impending failures. Fiber Bragg Grating (FBG) sensing technology represents an advanced non-destructive testing method that embeds FBGs into the structures of turbine components to sense strain and temperature variations, thereby reflecting geometric deformations and optical property changes of the material under working conditions, which allows for assessing the overall health condition of the component [
8]. However, the application of this technology faces certain challenges, including high costs, complex installation requirements, and difficulties in transporting and deploying interrogation devices, all of which have to some extent restricted its widespread adoption within the wind energy industry [
9].
2. Literature Review
Many researchers have conducted in-depth research on Structural Health Diagnosis in recent years. Hutchinson et al. [
10] proposed a statistical analysis method based on Bayesian decision theory, which is specifically used to evaluate images and detect damage in concrete structures. This method provides a new perspective for structural health monitoring and helps to locate and evaluate damage more accurately. At the same time, Ashley Foste et al. [
11] used modern deep learning technology to use yolov5 to detect surface damage of wind turbines. This method has achieved great success in the field of image recognition, so its application in wind turbine damage detection also shows high accuracy. Jinyu Li et al. [
12] outline a general procedure for developing biomimetic robotic fish-type submersibles by drawing insights from a recent 2000 m biomimicry prototype study. This also helps the health detection of the underwater part of the offshore wind turbine to provide data acquisition support. From another perspective, Narendhar Gugulothu et al. [
13] proposed the use of a recurrent neural network (RNN) to train the sensor data of wind turbines. This method aims to estimate the remaining useful life (RUL) of a system or machine, thereby providing a decision-making basis for maintenance and replacement. In addition, Majid Morshedizadeh and other researchers have explored the fusion methods of various algorithms. They proposed to use a combination of multi-layer perceptron (MLP) and adaptive neuro-fuzzy inference system (ANFIS) networks to predict the power generation of wind turbines. This fusion method aims to combine the advantages of the two algorithms to improve prediction accuracy. The research of Matei et al. [
14] is more cutting-edge. They are committed to integrating physical principles into machine learning problems, which provides new ideas for solving practical engineering problems. The research of Wang et al. [
15] is more practical. They proposed a case study involving the use of drone detection images for crack detection. Finally, some researchers have also explored traditional machine-learning techniques. They use Haar-like features [
16] and ensemble classifiers from various basic models, such as logitBoost [
17], decision tree [
18], and support vector machine [
19], to automatically extract damage information. Although these methods may not be as advanced as deep learning methods in some applications, they still show high effectiveness in specific applications such as crack detection. The health monitoring and prediction of offshore wind turbines is a multidisciplinary project incorporating various algorithms and technologies. Over time, there will be an ongoing increase in the demand for precise monitoring and prediction results.
Ren et al. introduced Faster R-CNN, a technology that significantly improves object detection in maritime environments. Faster R-CNN uses a Region Proposal Network (RPN) to quickly generate candidate bounding boxes for targets in vast image datasets, which improves both the speed and accuracy of detections. However, with contemporary applications requiring real-time performance, the multi-stage nature of this technology is less than optimal in terms of computational resource utilization.
Redmon et al. developed the YOLO (You Only Look Once) architecture for object detection, which analyzes the entire image in a single pass during training and testing, minimizing background misclassifications [
20]. Wang et al. have continued to improve the YOLO architecture with the YOLOv7 model, which boasts a 75% reduction in the number of parameters and requires 36% less computational resources than its predecessors [
21]. YOLOv7 also has better detection accuracy, but it has limitations in accurately localizing small objects [
22]. It is conducive to accurately identifying and positioning various complex surface damage types of offshore wind turbine structures.
In addition, E Zavvar et al. [
23] conducted a detailed analysis and offered compelling evidence on the significance of lifetime extension for Long-Term Evolution in reducing the Levelized Cost of Energy (LCOE) and enhancing resource utilization. Moreover, they predicted that the artificial–intelligence–driven real–time damage assessment system will be one of the key technologies in future lifetime extension research. However, the traditional method that uses a Physical Information Neural Network (PINN) may have limitations in expressing complex nonlinear relationships and capturing long-term dependence on time series data. Therefore, it is necessary to improve the traditional PINN architecture. One way to do this is by increasing the number of layers of Multi-Layer Perceptron (MLP) to improve the model’s ability to fit internal physical laws and microstructure evolution processes. This is important for simulating and predicting the process of fatigue life under cyclic loading accurately. Another way is to introduce the Long Short-Term Memory Network (LSTM) layer into the PINN design. This can effectively capture the temporal dynamic characteristic between fatigue damage accumulation and historical load path, enabling a more accurate reflection of the remaining service life of key components in the actual service process.
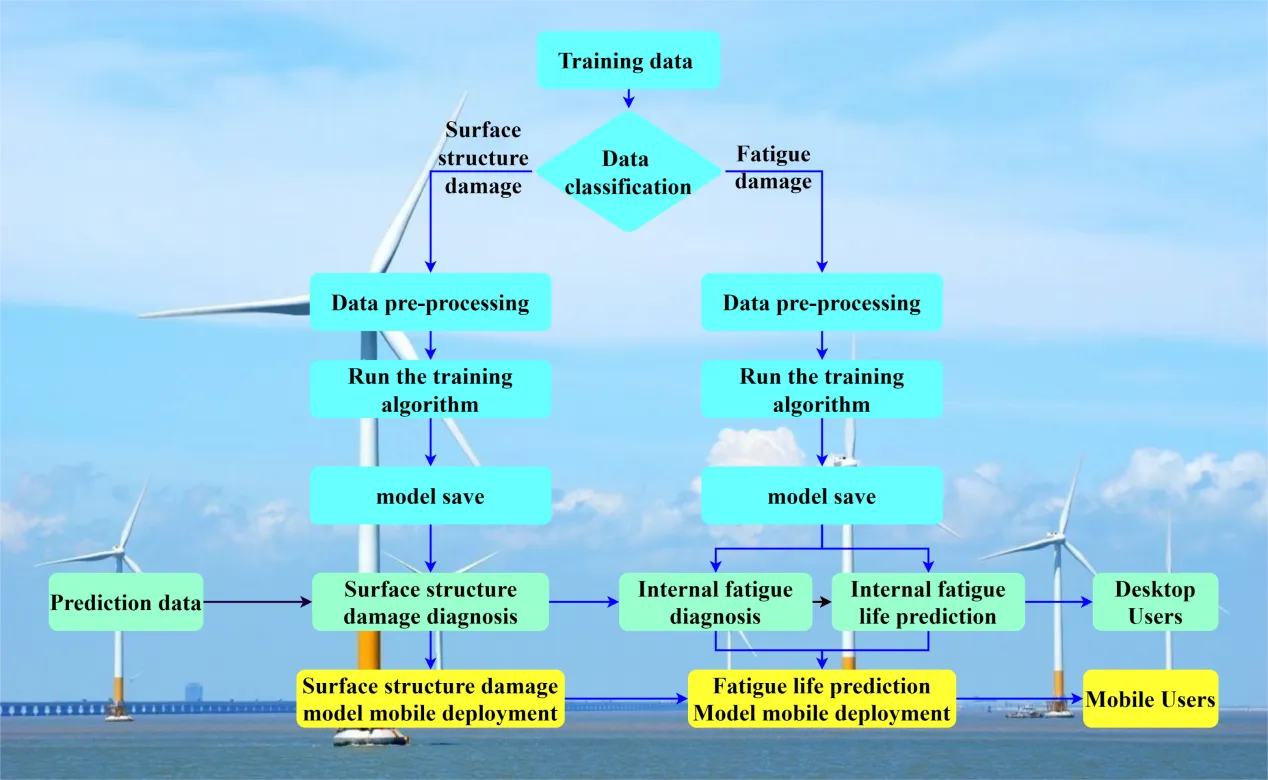
We designed a comprehensive offshore wind turbine health monitoring platform framework by combining structural health monitoring (SHM) and AI, as shown in . We construct the corresponding artificial intelligence evaluation model according to the unique characteristics of each key component and damage type. For example, we have integrated the Modified YOLOv7 and Deep-LSTM Physics-Informed Neural Networks (PINNs) into this health monitoring platform. This method helps to identify potential problem components early, thereby helps to enhance their decision-making ability. The main contributions of this paper include:
- (1)
-
An intelligent framework is specifically proposed and designed for offshore wind turbine health monitoring, as shown in . The framework constructs the corresponding artificial intelligence evaluation model according to the input damage data type and the unique characteristics of the target key components.
- (2)
-
The YOLOV7 model has been improved by adding an attention mechanism.
- (3)
-
The YOLOV7 has been updated with the Weighted Intersection over Union (WioU Loss) function.
. The ABWD structure diagram (Fatigue Life prediction module is given in another paper).
In this paper, an offshore wind turbine health detection platform called Ai-Based Windmill Doctor (ABWD), which combines structural health monitoring (SHM) and AI, is proposed to assist in the decision-making of wind turbine operation and maintenance. ABWD denotes in-house software that has been custom-developed by our internal resources. The following chapters are arranged as follows. The second section describes and introduces the enhanced YOLOV algorithm, the constructed damage detection module, and its workflow in the platform. Section 3 presents a case study of several functional modules of the platform. Finally, Section 4 summarizes the research results, draws conclusions, and proposes future research directions.
3. Intelligent Surface Damage Diagnosis Using Computer Vision
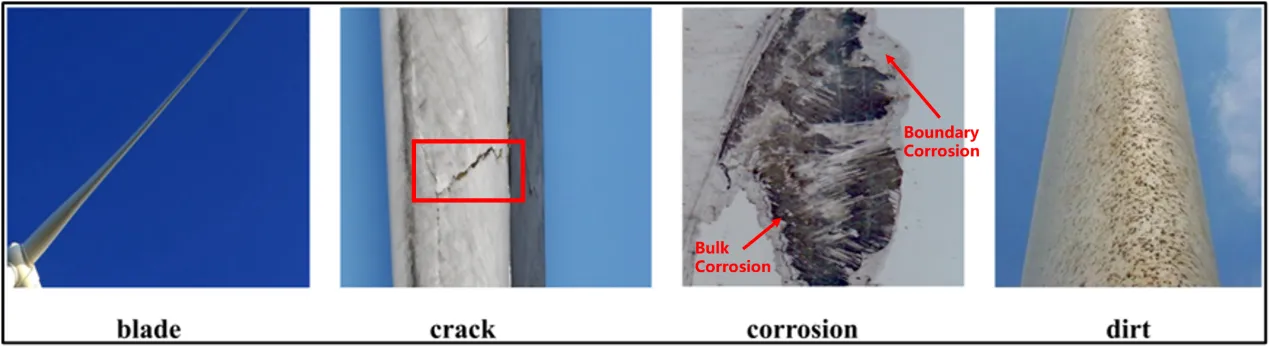
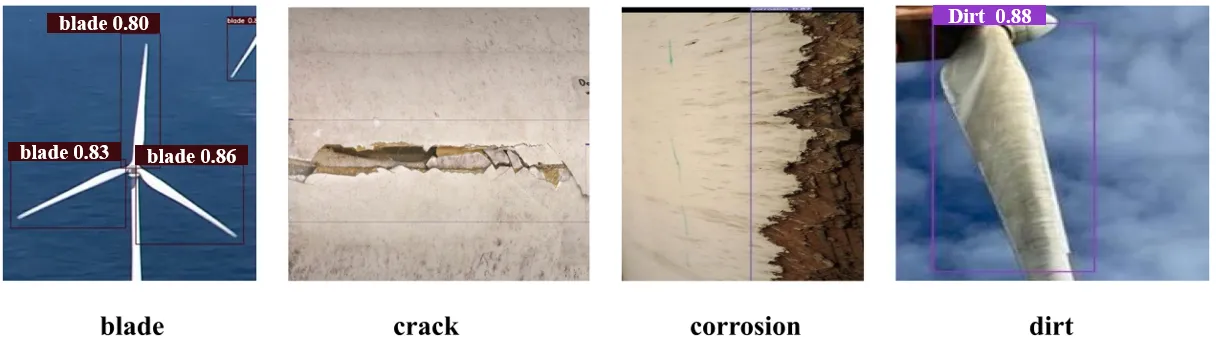
Visual image, as an intuitive and easy-to-obtain information source, plays an indispensable role in the surface damage detection of wind turbines. This detection method provides us with instant feedback on the health status of wind turbines. However, the surface damage of wind turbines is highly complex and diverse. For example, as shown in , the damage categories of wind turbine blades alone include normal, crack, corrosion, and fouling. Traditional image processing and analysis methods, such as threshold segmentation, edge detection, or feature-based matching, are usually hand-crafted and dependent on specific parameter settings, which may lead to limitations in accuracy and reliability in the face of complex and diverse surface damage [
24]. These limitations make it difficult to meet the needs of high-precision and real-time detection.
. Types of defects in offshore wind turbine blade.
To overcome these challenges, we turned to object detection technology and chose the YOLO (You Only Look Once) algorithm in particular. The YOLO algorithm is a revolutionary method that can quickly and accurately identify multiple objects in an image or video [
25]. Compared with the traditional region-based method, the uniqueness of YOLO is that it transforms the object detection task into a regression problem, thus achieving faster detection speed [
26]. This inherent speed advantage makes it the first choice when dealing with real-time video streams and large amounts of image data.
We especially chose YOLOV7 as the object detection method because it is the latest iterative version in the YOLO series, providing faster processing speed and higher accuracy. YOLOV7 has been optimized and improved in random sampling, data enhancement, and multi-scale detection, thus significantly improving its detection performance. With YOLOV7, we can efficiently and accurately identify and locate various damages on the surface of wind turbines in real time. This highly automated and accurate detection provides strong technical support for subsequent maintenance, repair, and decision-making, ensuring the stable operation and long life of wind turbines.
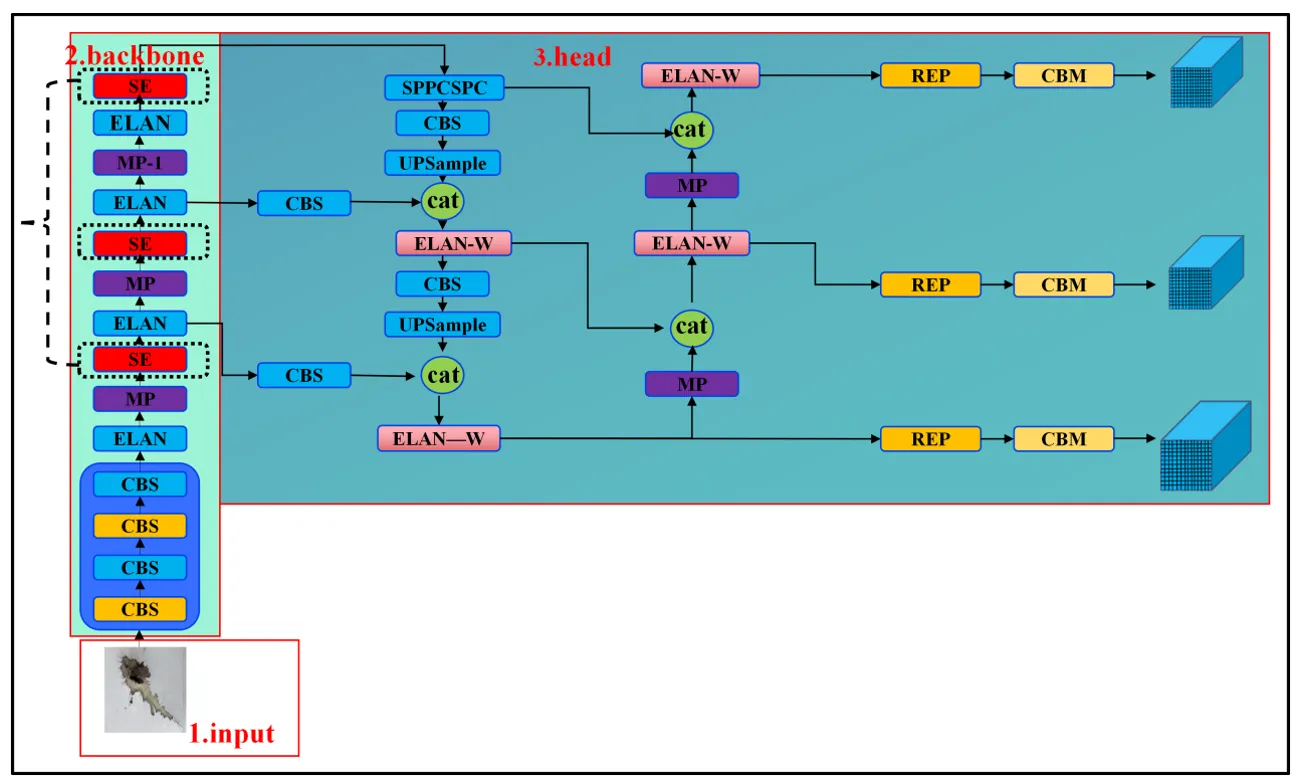
The YOLOV7 model comprises three main components: the input module, the backbone network, and the head output module. The input side mainly contained data preprocessing, including data enhancement and adaptive image padding [
21].
The backbone network is vital for visual feature extraction, mainly employing CBS, Efficient Layer Aggregation Network (ELAN), and MP. The CBS module, composed of a Convolutional Layer, a Batch Normalization Layer, and a Sigmoid-weighted Linear Unit, is key in the backbone for channel adjustment, feature extraction, and downsampling. The ELAN module enhances model robustness by optimizing the shortest and longest gradient—propagation paths in the network for more comprehensive feature extraction. It has two branches: the first uses a 1×1 convolution layer for channel transformation; the second first adjusts channels via a 1×1 convolution module and then extracts features through four 3×3 convolution modules, fusing their outputs [
27]. The MP module, with two branches for downsampling, has its first branch use a maxpool layer for initial downsampling, followed by a 1×1 convolution layer for channel transformation. The second branch starts with a 1×1 convolution layer for channel adjustment, then uses a 3×3 convolution kernel and a stride-2 convolution block for further downsampling. The outputs of the two branches are added to yield highly enhanced downsampling features.
The Head model is crucial for object detection, which detects objects of different sizes on multi-dimensional feature maps. Key modules include MP, SPPCSPC, ELAN-W, UPSample, REP, Concat, and CBM. The MP module’s two branches downsample: one via max—pooling and 1×1 convolution, the other through 1×1 convolution, 3×3 kernel, and stride-2 block, then combines outputs. SPPCSPC fuses SPP and CSP. SPP expands receptive fields (e.g., 5, 9, 13, 1) for different-resolution images; CSP splits features. Their combination reduces computation and improves accuracy. ELAN—W is similar to ELAN but selects five second branch outputs. UPSample uses nearest-neighbor interpolation for upsampling. Concat fuses features by superimposing channels. REP enhances network representation at a low cost, capturing multi-scale features for better task performance. CBM differs from CBS in that it has a sigmoid activation for robustness.
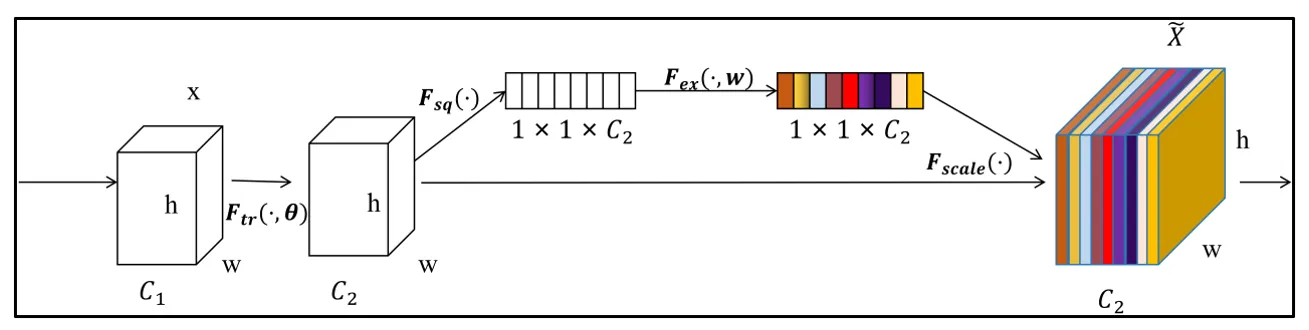
To further improve mAP (mean average precision), we choose to introduce the SE (Squeeze Excitation) attention mechanism into the backbone. By using the weight matrix, the mechanism can assign different weights according to the channel information at different positions in the image, to obtain more important feature information. As shown in , the SE attention mechanism is mainly composed of two parts, namely compression and excitation. The workflow of the model is as follows: first, input the feature map, then perform spatial feature compression on it, which is achieved by global average pooling on the spatial dimension. Next, channel feature learning is performed on the compressed feature map, which is achieved by using the FC (fully connected) layer to obtain a feature map with channel attention. Finally, the feature map of channel attention is multiplied by the original input feature map channel by channel, multiplied by the weight coefficient. Finally, the feature map with channel attention is output [
28]. The yolov7 network structure diagram of inserting the attention module in the backbone is shown in .
In addition, we also add Wise-IoU, a new loss function for bounding box regression (BBR) in target detection, including a dynamic focusing mechanism (FM). Compared with other high-quality anchor frames, Wise-IoU will give a higher gradient gain to ordinary-quality anchor frames, and assign a smaller gradient gain to low-quality anchor frames, thus effectively reducing the influence of low-quality examples on bounding box regression. Through the intelligent gradient gain allocation strategy of dynamic non-monotone FM, Wise-IoU realizes the emphasis on ordinary quality anchor frames, while reducing the competitiveness of high-quality anchor frames and the harmful gradients generated by low-quality examples. This makes Wise-IoU pay more attention to the anchor frame of ordinary quality in training, thus improving the overall performance of the detector.
Among them, $$L_{w i s e - I o U v_{1}}$$ is the value of Wise-IoU, $$R_{w i s e - I o U}$$ is the IoU with specified weight, and$$ L_{I o U}$$ is the traditional IoU. By introducing the weight factor $$R_{w i s e - I o U}$$, the IoU loss of the ordinary mass anchor frame can be significantly amplified, while the $$R_{w i s e - I o U}$$ of the high-quality anchor frame can be reduced by $$L_{I o U}$$
.$$x_{g t}$$ is the horizontal coordinate of the center point of the target box. $$y_{g t }$$ is the vertical coordinate of the center point of the target box. $$W_{g}$$ represents the width of the target box. $$H_{g }$$ represents the height of the target box.
. The yolov7 structure with SE Attention Mechanism.
The ABWD platform has been comprehensively integrated with the enhanced YOLOV7 model. This integration empowers users to effortlessly conduct automatic damage detection on a vast number of offshore wind turbine blade images and promptly generate detailed damage reports. Leveraging the robust capabilities of the ABWD platform, we can substantially reduce the period from data collection to result analysis, thereby remarkably enhancing the efficiency of health assessment for offshore wind power facilities.
As depicted in , this paper presents the establishment of a comprehensive health detection framework for offshore wind turbines, which is closely associated with the ABWD platform and the main AI-based functional modules. The framework encompasses a series of key processes: data acquisition, data classification, data preprocessing, training algorithm implementation, model preservation, prediction and diagnosis, and user interaction.
In the data acquisition phase, the system sources data from multiple channels, including surface structural and fatigue damage data. Subsequently, the gathered data is classified into two distinct types to facilitate subsequent processing. Data preprocessing is a crucial step in guaranteeing data quality, ensuring the trained model’s high accuracy.
The system uses preprocessed data to train the model during the training algorithm phase. This process may incorporate advanced machine learning or deep–learning techniques, which are core components of the AI-based functional modules associated with the ABWD platform. The data classification and label-setting module, an important part of the overall framework, classifies data according to their features and types (such as image datasets and SCADA datasets). It also assigns appropriate tags to verify the data’s validity and consistency [
29].
Once the model is trained, it is stored for future prediction or diagnosis. In the prediction and diagnosis stage, the system deploys the trained model to analyse new data. By doing so, it can offer real-time health assessments of wind turbines, which showcases the practical application of the ABWD platform and the AI-based functional modules in the field of offshore wind turbine health monitoring.
4. Case Study
4.1. Wind Turbine Surface Defects Diagnosis
Database: In this study, we collected 5000 images of wind turbines. From the “industry collaboration collection”, we gathered a total of 2000 samples. These data were sourced through our long-standing partnerships with several leading companies in the industry. These companies provided us with real-world data that was highly relevant to the research problem we aimed to address. On the other hand, the “Open-resource collection” contributed 1000 samples. These open-source datasets are well-known in the academic community and can be publicly accessed.
Data preprocessing: all the data from both sources underwent essential procedures. First, we cleaned the data to remove any missing values. For the data with partial missing information, we used interpolation methods based on the characteristics of the data to fill in the gaps. Then, we conducted normalisation to standardise the data, ensuring that all features were on a comparable scale. This step was crucial for improving the performance and stability of our model. After normalisation, we performed feature selection to identify the most relevant features and reduce the dimensionality of the data, which helped to avoid overfitting and speed up the training process.
Data Labelling and Utilisation: We manually examine these images to identify regular blades and damage categories such as cracks, corrosion, and dirt. The corrosion and cracks of blades directly affect the safety and healthy production of offshore floating wind turbines. Both situations can lead to unexpected shutdowns and huge losses of wind turbine assets. In addition, pollution is also very harmful to offshore floating wind turbines, which will increase blade load, deteriorate the performance of wind turbines, reduce energy output, and increase noise emissions. To improve the robustness of the dataset, we also use data enhancement techniques to randomly adjust the image’s brightness, contrast, saturation, mirroring, and rotation. We mix the original and enhanced images to obtain diverse training data. We divide the data set into the training set, validation set, and test set according to the ratio of 7:2:1. All datasets maintain the same percentage distribution of defect categories to compare the final mAP accuracy of yolov7, yolov7 with SE attention mechanism, yolov7 with SE attention mechanism wise iou, other mainstream yolo algorithms under the same conditions. We used 300 epochs and 4 batches to optimize the model.
Results: presents the training performance of three different target detection models, namely YOLOV7, Single Shot MultiBox Detector (SSD), and Faster Region-based Convolutional Neural Network (Faster R-CNN). The horizontal axis represents the number of training rounds or “epochs”. In contrast, the vertical axis denotes the mean Average Precision (mAP), a commonly used metric for evaluating the performance of object detection algorithms. Out of these models, YOLOV7 is a part of the YOLO series, SSD is a single-stage detection model, while Faster R-CNN belongs to the two-stage detection model. This paper aims to compare these three target detection models and evaluate their performance during the training process. The analysis showed that YOLOV7 displayed excellent performance in the early stages of training and sustained consistency throughout the process. This training result indicates that YOLOV7 outperforms other target detection models and is better suited for identifying surface damage in offshore wind turbines.
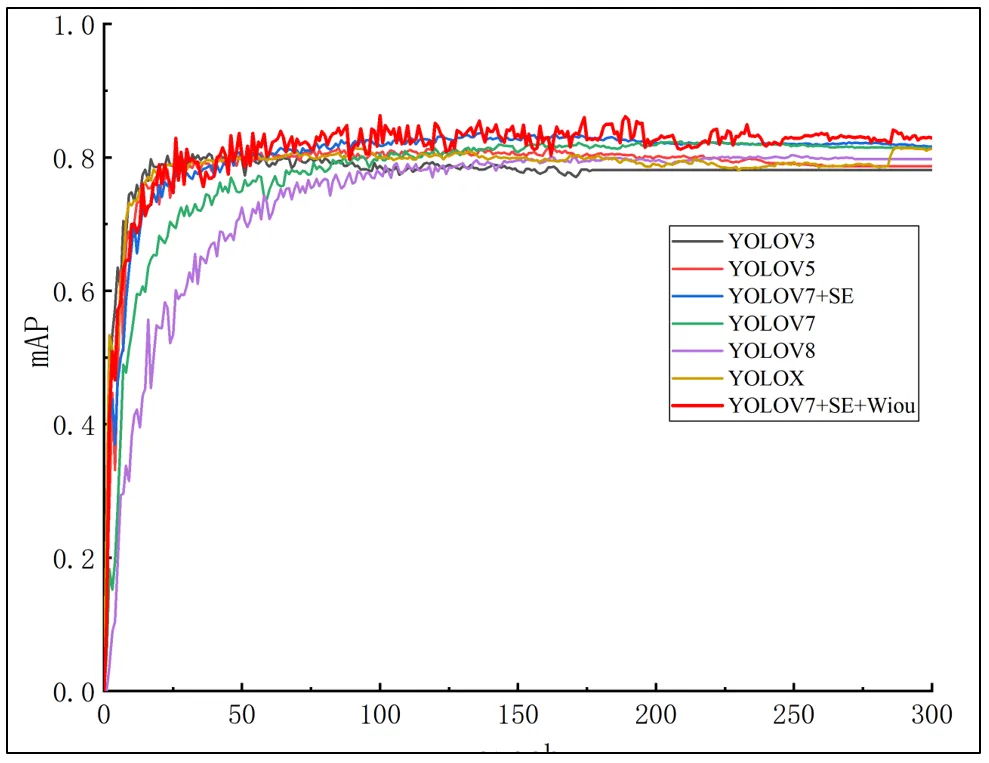
illustrates the performance of various versions of the YOLO (You Only Look Once) object detection models during the training process. The graph shows that all these YOLO variants consistently improve their mAP values as the training progresses, indicating an ongoing enhancement in their performance. However, different models exhibit distinct trends and rates of improvement throughout the training. Notably, the YOLOV7 variant incorporates the SE attention mechanism, and Wiou demonstrates the most outstanding performance during the training phase. Its mAP value surpasses other models within the first 50 epochs and maintains a relatively stable trend throughout the training process. Upon completing 300 epochs, its mAP reaches 86.24%, the highest among all models. Hence, it is evident that the YOLOV7 model with added SE attention mechanism and Wiou learns faster and more stably during the training, ultimately achieving the best overall performance.
We calculated six models’ mean average precision (mAP) during the training process. The mAP results of each model are shown in . It can be seen from the table that as the number of iterations increases, the mAP of the YOLOv7 model is better than that of other YOLO models, and the mAP of the YOLOv7 model with SE is better than YOLOv7. The final training results are summarized in . Therefore, compared with other models, YOLOV7 has higher detection accuracy in offshore wind turbine damage detection, providing evidence of its effectiveness. Therefore, we incorporate the YOLOv7 model with SE and Wise IoU into the ABWD platform for damage identification in wind turbine surface damage. illustrates the detection effect of Improved YOLOV7.
. Training results of different detecting models.
. Training results of different YOLO models.
.
Comparison of the parameters of each algorithm.
| Models |
YOLOV3 |
YOLOV5 |
YOLOV7 |
YOLOV7 + SE |
YOLOV8 |
| mAP [%] |
79.7 |
81.3 |
82.44 |
83.71 |
80.14 |
| Models |
Faster R-CNN |
SSD |
YOLOX |
YOLOV7 + SE + Wise IoU |
- |
| mAP [%] |
64.96 |
57.67 |
81.5 |
86.24 |
- |
. The detection results of offshore wind turbine blade defects.
Furthermore, to determine the statistical significance of the improvement, we conducted a paired-sample
t-test. This test is appropriate as our experiments were conducted under similar conditions, and the results from the original YOLOv7 and our improved model are paired observations. We repeated the experiments multiple times to obtain sufficient data points for a reliable analysis. The results of the paired-sample
t-test indicated a
p-value of 0.01. Since the
p-value is less than the commonly used significance level of 0.05, we can conclude that the improvement in mAP from 82.44% to 86.24% is statistically significant. This means that the difference in performance is not likely due to random chance but rather to the modifications we made to the original YOLOv7 model.
4.2. Mobile Deployment of the Improved Diagnosis Model
4.2.1. Facilitating Efficient Model Deployment in Diverse Scenarios
TorchScript, a technology within PyTorch, enables the creation of serializable and optimized models for versatile deployment. It converts PyTorch models into an intermediate representation (IR) that is both execution-ready and deployable across frameworks, ideally suited for resource-constrained environments like mobile devices and embedded systems. This process involves a three-part architecture: the front transforms models using scripting, which translates Python code directly, or tracing, which records model operations during execution; the IR, a graph-based depiction of the model structure, facilitates optimizations for enhanced efficiency; and a runtime environment, independent of Python, executes the transformed models on diverse platforms. TorchScript supports model serialization, allowing storage and retrieval with minimal environmental dependencies, and through its graph optimizations, it reduces computational demands, thereby accelerating model performance. Ultimately, TorchScript empowers model deployment detached from the Python ecosystem, streamlining integration into varied frameworks and especially benefiting deployment in mobile and embedded scenarios where resources are scarce.
4.2.2. Model Quantization Based on NCNN
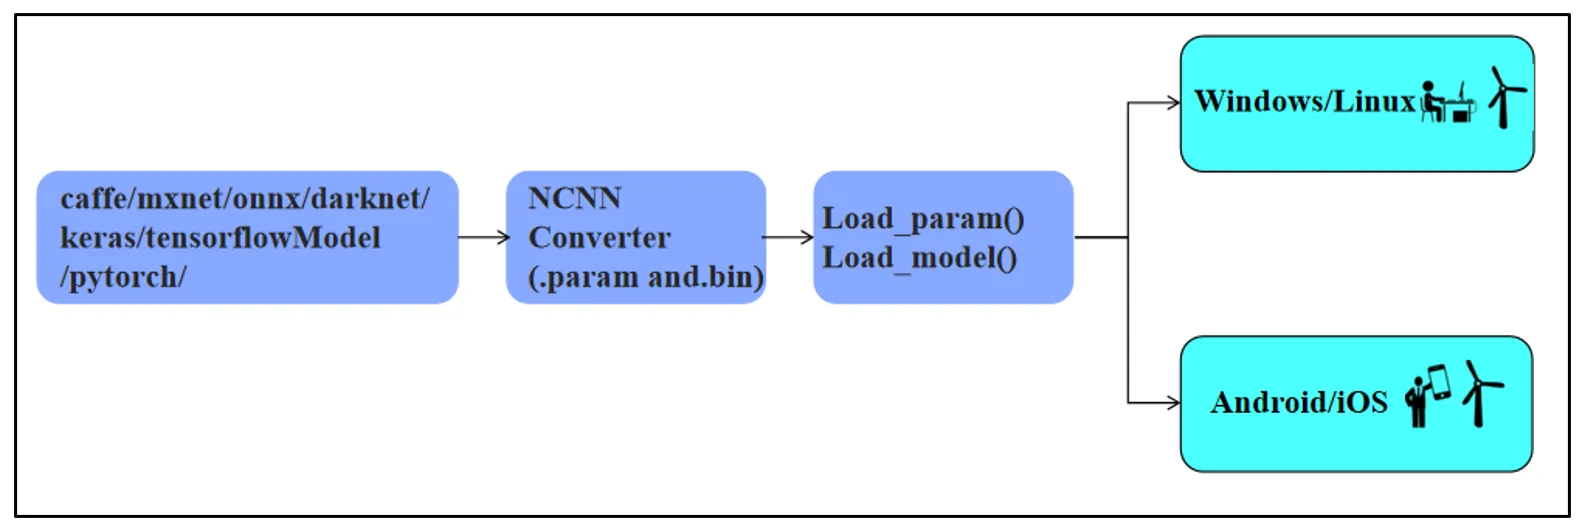
NCNN, as shown in , is a high-performance framework designed for neural network inference on mobile and embedded devices. It is optimized for these platforms’ low-power, high-performance needs, efficiently running complex ML models. Lightweight and easy to integrate, NCNN is compatible across systems like Android, iOS, and various embeddings, making it a versatile tool. Its strengths lie in efficient resource use, crucial for constrained devices, ensuring smooth operation without draining batteries. Cross-platform support eases deployment across different devices while its simple APIs speed up model integration into apps, reducing development time and costs. With diverse model types, including object detection, NCNN is adaptable to various applications, enhancing its practical value in the mobile and embedded domains.
The optimized TorchScript model is converted into NCNN format and deployed to mobile devices. The two advantages are integrated: the hardware resources are efficiently utilized, the energy consumption is optimized, and the PyTorch model is rapidly deployed on the mobile terminal. Through quantitative techniques, such as converting FP32 to INT8, NCNN reduces model size and speeds up, because integer operations are faster. Quantization needs to be customized based on models and scenarios to ensure optimal performance.
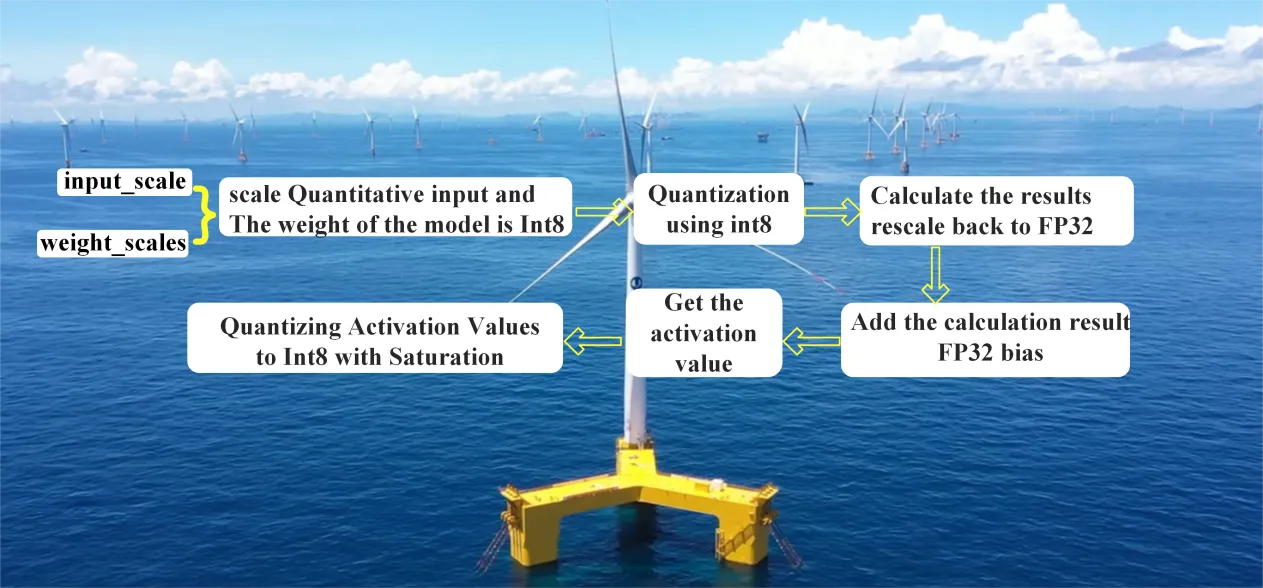
illustrates the NCNN quantization workflow, encompassing preprocessing for calibration data to estimate scaling and zero-point parameters, strategic selection of quantization levels (e.g., INT8, INT16) based on model and hardware specifics, precise computation of these parameters, transformation of model weights and activations into integers via formulated equations for compactness and efficiency, and, if necessary, fine-tuning the quantized model with a subset of training data to mitigate accuracy loss, thereby systematically optimizing models for mobile and embedded deployment with a keen focus on balancing efficiency and precision.
. Process of Quantized Convolution.
4.3.3. Development Environment Configuration and Model Deployment
The development of the mobile application required a well-equipped desktop environment. A high-performance laptop running on Windows 10 was employed, and it was powered by a Ryzen 7 CPU, 16GB of Random Access Memory (RAM), and an RTX 4060 GPU. Additionally, an Android 12 smartphone was used for testing purposes. In terms of the development tools and frameworks, the project harnessed Java 8, JDK 1.8, and NCNN v20210525(a high-performance neural network forward computation framework that is extremely optimized for mobile devices). Android Studio was utilized as the integrated development environment (IDE) to manage the project. This setup ensured not only efficient development but also streamlined debugging processes.
Before deployment, several crucial preparatory steps were carried out. OpenCV was configured to handle computer vision tasks, and Protocol Buffers were set up for data serialization. These two components were of vital importance for NCNN’s model handling capabilities. A strategic model conversion path was adopted to optimize the model for mobile inference. The model was first converted from the PyTorch format (.pt) to the ONNX format and then further transformed into the NCNN format. This approach bridged the gap between different frameworks and made full use of NCNN’s hardware acceleration techniques. The mobile app was developed in Android Studio with Native C++ support to enhance its performance. It was designed to target API level 29. The app boasted a user-friendly interface and the ability to capture real-time video through the Camera API.
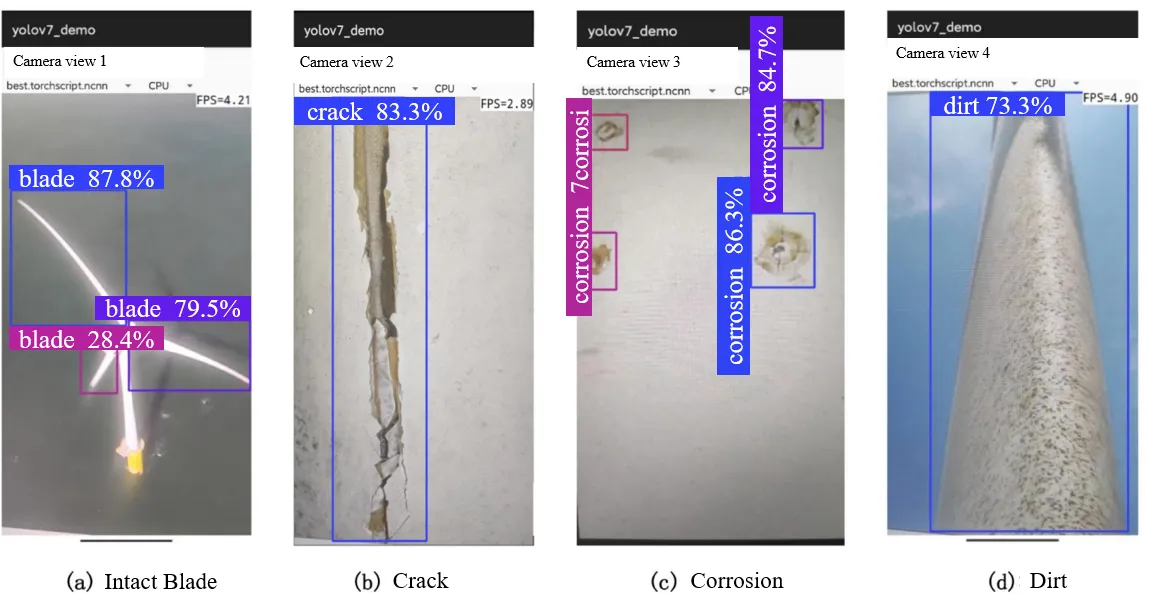
The YOLOV7-SE-WiseIoU damage detection model was successfully integrated into the app. The app operated through distinct modules for video acquisition, analysis, and result visualization. During the operation, it presented live classification results, confidence scores, and damage boundaries. In essence, it encapsulated a sophisticated yet practical solution for mobile inspection. At last, the effectiveness of damage detection on the mobile terminal is illustrated in .
. Mobile-end damage detection illustration.
5. Conclusions and Future Work
This study refined the YOLOv7 algorithm for floating wind turbine blade damage diagnosis by integrating SE attention mechanisms and Wise-IoU loss functions. Empirical results show that this method can more accurately identify offshore wind turbine damage, with the mean Average Precision (mAP) rising from 82.44% to 86.24%. Establishing a comprehensive database integrating diverse damage data and compatibility labels is crucial. It facilitates model training and testing, enriches learning content, and boosts generalization ability. The inclusion of image data, sensor-collected descriptions, and physical model info makes it a valuable resource for AI-based health monitoring. We successfully deployed a mobile intelligent diagnosis system for wind turbine structural damage. Future plans include expanding fault diagnosis and optimization modules. Ongoing enhancements will improve identification and detection, increasing accuracy and reliability for offshore wind turbine health management.
Author Contributions
X.J.: Writing—review & editing, Writing—original draft, Methodology, Investigation, Formal analysis, Data curation, Conceptualization. W.Z.: Writing—review & editing, Writing—original draft, Methodology, Investigation, Formal analysis, Validation. J.L.: Writing—review & editing, Supervision. H.T.: advise &review. L.J.: advise &review.
Ethics Statement
Not applicable.
Informed Consent Statement
Not applicable.
Data Availability Statement
The data that has been used is confidential.
Funding
This work was financially supported by the National Natural Science Foundation of China (No. 4276230).
Declaration of Competing Interest
The authors declare that they have no known competing financial interests or personal relationships that could have appeared to influence the work reported in this paper.
References
-
1.
Wu X, Hu Y, Li Y, Yang J, Duan L, Wang T, et al. Foundations of offshore wind turbines: A review.
Renew. Sustain. Energy Rev. 2019,
104, 379–393.
[Google Scholar]
-
2.
GWEC. Global Wind Energy Council, Report. 2022. Available online: https://gwec.net/global-wind-report-2022/ (accessed on 8 April 2022).
-
3.
Gatzert N, Kosub T. Risks and risk management of renewable energy projects: The case of onshore and offshore wind parks.
Renew. Sustain. Energy Rev. 2016,
60, 982–998.
[Google Scholar]
-
4.
Memarzadeh M, Pozzi M, Zico Kolter J. Optimal planning and learning in uncertain environments for the management of wind farms.
J. Comput. Civ. Eng. 2015,
29, 04014076.
[Google Scholar]
-
5.
Carvalho D, Rocha A, Gómez-Gesteira M, Santos CS. Potential impacts of climate change on European wind energy resource under the CMIP5 future climate projections.
Renew. Energy 2017,
101, 29–40.
[Google Scholar]
-
6.
Stetco A, Dinmohammadi F, Zhao X, Robu V, Flynn D, Barnes M, et al. Machine learning methods for wind turbine condition monitoring: A review.
Renew. Energy 2019,
133, 620–635.
[Google Scholar]
-
7.
Li D, Ho SM, Song G, Ren L, Li H. A review of damage detection methods for wind turbine blades.
Smart Mater. Struct. 2015,
24, 033001.
[Google Scholar]
-
8.
Krebber K, Habel W, Gutmann T, Schram C. Fiber Bragg grating sensors for monitoring of wind turbine blades. In Proceedings of the 17th International Conference on Optical Fibre Sensors, Bruges, Belgium, 23–27 May 2005; Volume 5855.
-
9.
Yu Y, Cao H, Yan X, Wang T, Ge SS. Defect identification of wind turbine blades based on defect semantic features with transfer feature extractor.
Neurocomputing 2020,
376, 1–9.
[Google Scholar]
-
10.
Hutchinson TC, Chen ZQ. Improved image analysis for evaluating concrete damage.
J. Comput. Civ. Eng. 2006,
20, 210–216.
[Google Scholar]
-
11.
Foster A, Best O, Gianni M, Khan A, Collins K, Sharma S. Drone Footage Wind Turbine Surface Damage Detection. In Proceedings of the 2022 IEEE 14th Image, Video, and Multidimensional Signal Processing Workshop (IVMSP), Nafplio, Greece, 26–29 June 2022; pp. 1–5.
-
12.
Li J, Li W, Liu Q, Luo B, Cui W. Current status and technical challenges in the development of biomimetic robotic fish-type submersible.
Ocean -Land-Atmos. Res. 2024,
3, 0036. doi:10.34133/olar.0036.
[Google Scholar]
-
13.
Gugulothu N, Tv V, Malhotra P, Vig L, Agarwal P, Shroff G. Predicting remaining useful life using time series embeddings based on recurrent neural networks.
arXiv 2017, arXiv:1709.01073.
[Google Scholar]
-
14.
Matei I, de Kleer J, Feldman A, Zhenirovskyy M, Rai R. Classification based diagnosis: Integrating partial knowledge of the physical system. In Proceedings of the 2019 Annual Conference of the PHM Society, Scottsdale, AZ, USA, 21–26 September 2019.
-
15.
Wang L, Zhang Z. Automatic detection of wind turbine blade surface cracks based on UAV-taken images.
IEEE Trans. Ind. Electron. 2017,
64, 7293–7303.
[Google Scholar]
-
16.
Shihavuddin A, Arefin MMN, Ambia MN, Haque SA, Ahammad T. Development of real time Face detection system using Haar like features and Adaboost algorithm.
Int. J. Comput. Sci. Netw. (IJCSNS) 2010,
10, 171–178.
[Google Scholar]
-
17.
Friedman J, Hastie T, Tibshirani R. Additive logistic regression: a statistical view of boosting (with discussion and a rejoinder by the authors).
Ann. Stat. 2000,
28, 337–407.
[Google Scholar]
-
18.
Liaw A, Wiener M. Classification and regression by randomForest.
R News 2002,
2, 18–22.
[Google Scholar]
-
19.
Kim H, Pang S, Je H, Kim D, Bang SY. Constructing support vector machine ensemble.
Pattern Recognit. 2003,
36, 2757–2767.
[Google Scholar]
-
20.
Redmon J, Divvala S, Girshick R, Farhadi A. You only look once: Unified, real-time object detection. In Proceedings of the IEEE Conference on Computer Vision and Pattern Recognition, Las Vegas, NV, USA, 26 June–1 July 2016.
-
21.
Wang CY, Bochkovskiy A, Liao HY. YOLOv7: Trainable bag-of-freebies sets new state-of-the-art for real-time object detectors. In Proceedings of the IEEE/CVF Conference on Computer Vision and Pattern Recognition, Vancouver, BC, Canada, 17–24 June 2023.
-
22.
Zhao L, Zhu M. MS-YOLOv7: YOLOv7 based on multi-scale for object detection on UAV aerial photography.
Drones 2023,
7, 188.
[Google Scholar]
-
23.
Zavvar E, Rosa-Santos P, Taveira-Pinto F, Ghafoori E. Lifetime extension of offshore support structures of wind turbines: A review.
Renew. Sustain. Energy Rev. 2025,
217, 115788.
[Google Scholar]
-
24.
O’Mahony N, Campbell S, Carvalho A, Harapanahalli S, Hernandez GV, Krpalkova L, et al. Deep learning vs. traditional computer vision. Advances in Computer Vision. In Proceedings of the 2019 Computer Vision Conference (CVC), Las Vegas, NV, USA, 25–26 April 2020; Volume 1 1, pp. 128–144.
-
25.
Jiang P, Ergu D, Liu F, Cai Y, Ma B. A Review of Yolo algorithm developments.
Procedia Comput. Sci. 2022,
199, 1066–1073.
[Google Scholar]
-
26.
Li W, Feng XS, Zha K, Li S, Zhu HS. Summary of object detection algorithms.
J. Phys. Conf. Ser. 2021,
1757, 012003.
[Google Scholar]
-
27.
Wang CY, Liao HYM, Yeh IH. Designing network design strategies through gradient path analysis.
arXiv 2022, arXiv:2211.04800.
[Google Scholar]
-
28.
Hu J, Shen L, Sun G. Squeeze-and-excitation networks. In Proceedings of the IEEE Conference on Computer Vision and Pattern Recognition, Salt Lake City, UT, USA, 18–22 June 2018; pp. 7132–7141.
-
29.
Liu H, Chen C. Data processing strategies in wind energy forecasting models and applications: A comprehensive review.
Appl. Energy 2019,
249, 392–408.
[Google Scholar]