1. Introduction
With the growth of renewable energy, wind power plays an important role in the global energy transition. The demand for wind energy has increased to mitigate global warming caused by CO
2 emissions from fossil fuels [
1]. This motivation became even more evident after implementing the Kyoto Protocol, which introduced limits on greenhouse gas emissions. Wind energy plays an essential role in helping countries meet the requirements of this protocol, which is reflected in the number of wind farms in operation and planning [
2]. Anaya-Lara et al. [
3] detailed that the energy from offshore wind turbines could replace fossil fuel-based power generation, reducing CO
2 emissions by approximately 300 g per kilowatt-hour when substituting natural gas, and about 700 g per kilowatt-hour when replacing coal-fired power plants. However, it is essential to mention that emission savings depend on how the wind farm is integrated into the overall power system.
The main advantage of offshore wind over onshore wind is the availability of greater wind resources. In offshore environments, wind speeds are higher and more uniform, improving power output. Due to the lower surface roughness, the turbulence is further reduced, resulting in a steady energy source for the grid [
1,
4]. In addition, because the air near the sea surface is less turbulent than on land, and the only design limitation is that the blades must remain above the maximum wave height expected in the sea state, offshore wind turbines can be placed lower, improving efficiency and stability. However, more challenges are involved in offshore floating wind turbines, such as the high costs [
5], difficulties in installation and maintenance [
6], and the harsh marine environment [
7]. Despite these challenges, the market for this type of energy still looks promising [
8].
The mooring system plays a crucial role in ensuring the reliability and safety of the floating system. The high Levelized Cost of Energy (LCOE) for floating offshore wind is currently three times that of fixed-bottom offshore wind, posing a significant barrier to commercial deployment. Since mooring systems, including installation, account for approximately 20% of the capital expenditure (CAPEX) [
9], optimising their design and deployment is crucial in lowering overall project costs and enhancing the commercial viability of floating wind farms.
The dynamic analysis of FOWTs involves evaluating the coupled behaviour of aerodynamic, hydrodynamic, structural, and control system dynamics. A common approach is aero-hydro-servo-elastic simulations, integrating wind turbine aerodynamics with platform hydrodynamics, mooring system dynamics, and control algorithms. Chen et al. [
10] developed DARwind (Dynamic Analysis for Response of Wind Turbines), employing Kane’s dynamical method and Cardan angles for kinematics while using the Blade Element Momentum (BEM) method for aerodynamics. Hydrodynamics were modelled through linear potential-flow theory, the Morison equation with strip theory, and additional damping corrections, while the mooring system followed a quasi-static procedure. Ramos-García et al. [
11] implemented a hybrid lifting-line aerodynamic model with MIRAS and HAWC2, incorporating a filament-particle-mesh wake simulation. Their study demonstrated improved accuracy over traditional BEM but relied on Morison’s equation and Airy wave theory for hydrodynamic interactions, though potential-flow theory outputs were also considered.
One important method for FOWT analysis is the low-fidelity frequency-domain modelling, which linearises system dynamics to assess natural frequencies, damping, and resonance effects. Dou et al. [
12] used the QuLAF frequency-domain model to optimise floater responses under wind and wave loads. While the frequency-domain approach remains relevant for optimisation due to its better computational efficiency, the mid-fidelity time-domain method captures system nonlinearities, such as geometric and material effects. It enables both decoupled and coupled dynamic analyses [
13]. Ma et al. [
13] identified the coupled dynamic analysis as the offshore industry standard, as it improves upon decoupled methods by simultaneously computing the responses of all system components: mooring lines and floating platforms. High-fidelity Computational Fluid Dynamics (CFD) approaches, such as OpenFOAM, simulate air-ocean interactions using the Finite Volume Method (FVM) and Volume of Fluid (VOF) techniques [
14].
To model rigid and flexible offshore body interactions, time-domain coupled dynamic analysis mid-fidelity software, such as SIMA (v4.8-01), OpenFAST (v8.16), OrcaFlex (v11.5e), and SIMPACK (v2024), may be used [
15]. Thomsen et al. [
16] used OpenFAST and OrcaFlex to simulate a TetraSpar FOWT, showing good agreement despite slight variations in pitch motion and natural periods due to differences in structural flexibility modelling. Chen and Hall [
17] studied the coupling between the lumped-mass model code MoorDyn and the open-source CFD code OpenFOAM, showing that the results obtained from their coupled model had good agreement with experimental data. A benchmark study comparing many of the available codes was reported by Robertson et al. [
18], which identifies the variety of formulations used and was used to quantify the uncertainty in those predictions [
19].
In addition to numerical analysis, there have been many experimental investigations. Duan et al. [
20] conducted an experimental investigation into the dynamic response of a single spar system. This study used a 1:50 scale model of the OC3 spar design, adapted for a water depth of 200 m. The results showed a significant influence of rotor rotation on yaw oscillation response. Furthermore, the tower-top bending moment oscillates primarily by a resonant response under wind-only excitation. They also found that the axial rotor thrust and the tower-top shear force exhibit similar behaviour. In wind-only conditions, both oscillate at the rotor’s rotational frequency, the tower’s first-mode natural frequency, and three times the rotor’s speed, with the tower’s first mode being dominant. However, when wind and waves act together, incident waves mainly drive their responses. Ahn and Shin [
21] conducted experimental tests on a three-leg catenary spread mooring system in catenary configuration, showing a significant agreement between the experimental results and numerical simulations, such as those performed using OpenFAST. Similarly, Xu and Day [
22] experimented on a spar platform under different environmental loads. Their study revealed a non-linear snatching behaviour in the mooring lines during regular wave tests, possibly leading to cable failure due to increased tension.
For many offshore floating platforms and other energy devices, due to large movements under extreme waves, snap loads appear on the mooring ropes, which damage the moorings and even reduce the entire system’s life [
23]. Examples of mooring line failure due to snap loads can be found in Kvitrud [
24]. Therefore, for floating renewable energy systems, studying the ultimate load of mooring lines under survival conditions is of great significance to the development of the systems. Synthetic fibre ropes in hybrid moorings provide substantial economic and operational advantages, making them the preferred alternative to traditional chains in offshore renewable energy (ORE) mooring configurations [
25,
26,
27,
28], however the typical fibre ropes in marine applications, such as polyester, HMPE and nylon ropes exhibit complex non-linear mechanical behaviours [
29,
30,
31]. Proper consideration of mooring rope material nonlinearity can lead to more accurate predictions when exploring the coupled hydrodynamic performance of FOWTs [
32] and shallow water ORE devices [
33].
On the other hand, to reduce the costs of anchors and moorings in Floating Offshore Wind Farms (FOWFs), shared mooring and anchor system have gained increasing interest in academia and industry in recent years. Liang et al. [
34] propose a two-turbine layout. The design is based on the OC3 Hywind project from the National Renewable Energy Laboratory (NREL). The spacing between turbines is set at 1000 m, and the anchor radius is increased by 100 m compared to the original single-spar model. The angle between the anchor lines from the same spar is set at 120°. The study compares the dynamic results with the single-turbine system under extreme environmental conditions. Goldschmidt and Muskulus [
35] investigate row, triangular, and rectangular layouts of FOWTs to reduce project costs. The study employs coupled catenary mooring and analyses the dynamic behaviour in the frequency domain. A 60% reduction in mooring costs and an 8% reduction in the total system cost were estimated in the rectangular configuration. Goldschmidt and Muskulus [
35] concluded that the row layout is optimal for a three-spar system. The dynamic behaviour of Floating Offshore Wind Turbines (FOWTs) with shared mooring was also investigated by Lopez-Olocco et al. [
36]. Experimental simulations were conducted using a 1:47 scale spar model with catenary mooring under operational and extreme sea conditions. The results for a dual-spar system with a shared line were compared to those of a single-spar system. One important finding was that the surge natural period is about 51% longer for the dual system than for the single one, likely due to differences in mooring stiffness and restoring forces. In addition, they observed through spectral analysis that the tension in the shared line presents a dominant peak response in the first-order wave frequency range. Hall et al. [
37] also investigated shared mooring lines. Their study modelled a system with ten FOWTs using MoorPy, an open-source code for quasi-static analysis. The results show that combining shared lines with shared anchors may significantly reduce installation costs. The present study investigates platform motions and mooring line tensions under different shared mooring layouts. The quasi-static analysis for several layouts is performed using the open-source code MoorPy. The fully coupled dynamic analysis is conducted using SIMA while considering the dynamic stiffness of synthetic ropes, modelling using the Syrope model from DNV [
38]. The motions of the floaters and the mooring tensions at the fairleads and anchor points are compared and discussed.
2. Methodology
The present study performs a fully coupled dynamic analysis using the commercial software SIMA (v4.8-01), part of the DNV SESAM package [
39]. It enables coupled analysis by integrating RIFLEX for line dynamics and SIMO for body dynamics, offering a comprehensive simulation framework.
2.1. Body Forces
The forces are modelled in SIMO to represent the interactions between the body and the environment accurately. These models incorporate various forces, including hydrodynamic, hydrostatic, and aerodynamic forces, as well as forces from mooring systems or other station-keeping mechanisms. The general equation of motion for a system experiencing sinusoidal motion is expressed as in Equation (1).
where:
M is the frequency-dependent mass matrix, which can be rewritten with the body mass matrix and added mass, as (m + A(ω));
C is the frequency-dependent potential damping matrix;
D1 is the linear damping matrix;
D2 is the quadratic damping matrix;
K is the hydrostatic stiffness.
Excitation forces are the summation of external forces, including wind drag, first- and second-order wave excitation, current drag, wave drift damping, and other external forces. These forces are represented in the relation present in
Equation (2).
2.2. Mooring Calculation
Initially, the RIFLEX module solves the catenary equation by considering any number of segments of different materials, the rigid-body equilibrium of articulated elements, clump weights and buoys, and seabed contact [
39]. Then, the mooring lines are discretised in bar elements, and a finite element analysis (FEA) is conducted to find static and dynamic solutions. The FEA procedure considers the damping, current drag, and additional mass, which are calculated using Morison’s equation and the axial stiffness of the element. Notably, the particularities of the synthetic material must be well modelled for polyester mooring lines due to their importance in the proposed farm designs.
The shared lines, key to system response, particularly the surge, are entirely made of polyester, eliminating the need for a clumped weight required in chain legs, which is cost-effective. However, synthetic fibre ropes have non-linear load-elongation curves, exhibit plastic deformation, and present significantly higher stiffness in dynamic conditions. Vidal et al. [
40] state the Syrope as the most accurate polyester stiffness model, covering the identified traits, and it is implemented following their procedure.
2.3. Wave Load
In addition to the body forces, SIMO is also responsible for generating time series and modelling the equations of motion for environmental loads. According to the SIMA manual [
39], the irregular wave model may consider the summation of two spectra: the wind sea and swell contributions [
41]. This study considers an irregular wind wave modelled as a three-parameter JONSWAP spectrum, which is defined as:
where: γ is the peakedness parameter; σ and α are the spectral parameters, defined as a function of the significant wave height
Hs and peak period
Tp:
3. Description of the FOWFs
3.1. Platform and Wind Turbine
Both the platform and wind turbine are from the OC3 project [
42] as a design basis. The spar floater is commonly used in deepwater projects due to its low centre of mass, enhancing the overall platform stability. The reduced waterline area makes the platform less responsive to the waves. The main properties of the platform can be found in
. The NREL wind turbine [
43] has a power capacity of 5 MW, and it is placed 10 m above the still waterline. The specifications of the structure are detailed in
.
.
Properties of the OC3 spar platform.
| Parameter |
Value |
Unit |
| Depth to platform base below SWL |
120.00 |
m |
| Water displaced volume |
8029.20 |
m3 |
| Depth to top and bottom of taper below SWL |
4.00, 12.00 |
m |
| Platform diameter above and below taper |
6.50, 9.40 |
m |
| Platform mass, including ballast |
7466.33 |
tonnes |
| Centre of mass height |
−89.92 |
m |
.
Properties of the 5-MW wind turbine.
| Parameter |
Value |
Unit |
| Hub height |
90.00 |
m |
| Hub diameter |
3.00 |
m |
| Blade length |
61.50 |
m |
| Tower mass |
249.72 |
tonnes |
| Blade mass |
17.74 |
tonnes |
3.2. System Layouts
The three-spar system layouts were based on the study by Fu et al. [
44], which examines the aerodynamic performance and wake characteristics of three fixed wind turbines using Large Eddy Simulation (LES) and the Actuator Line Model (ALM). Their research aimed to understand how the varying interactions of wake influence the efficiency of power generation and the overall aerodynamic performance of wind farms.
Fu et al. [
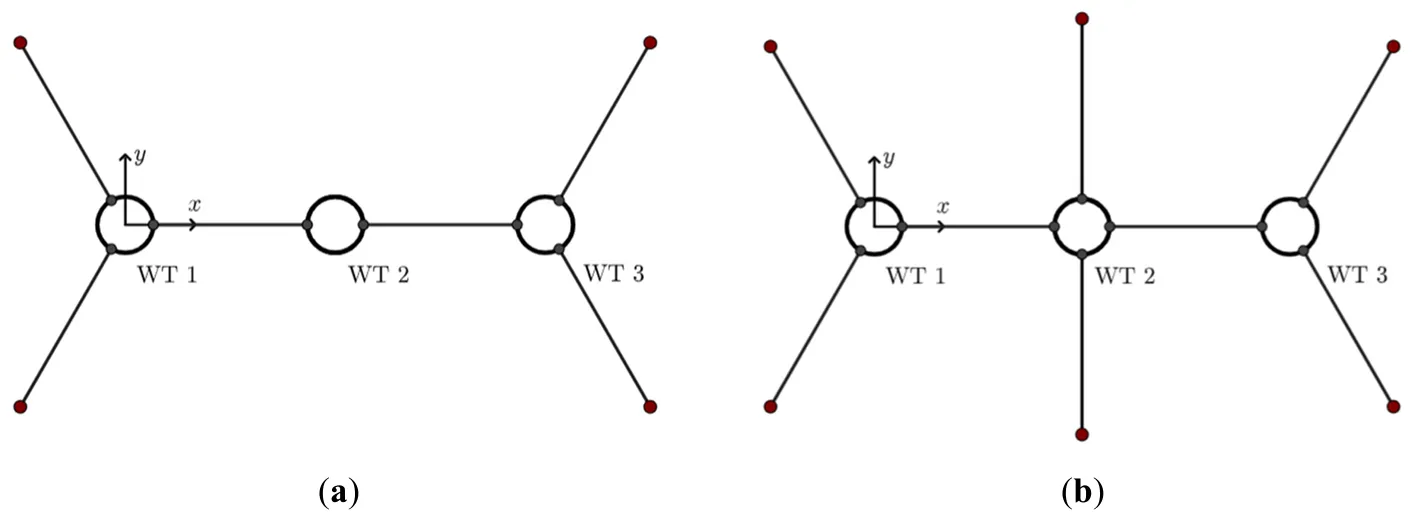
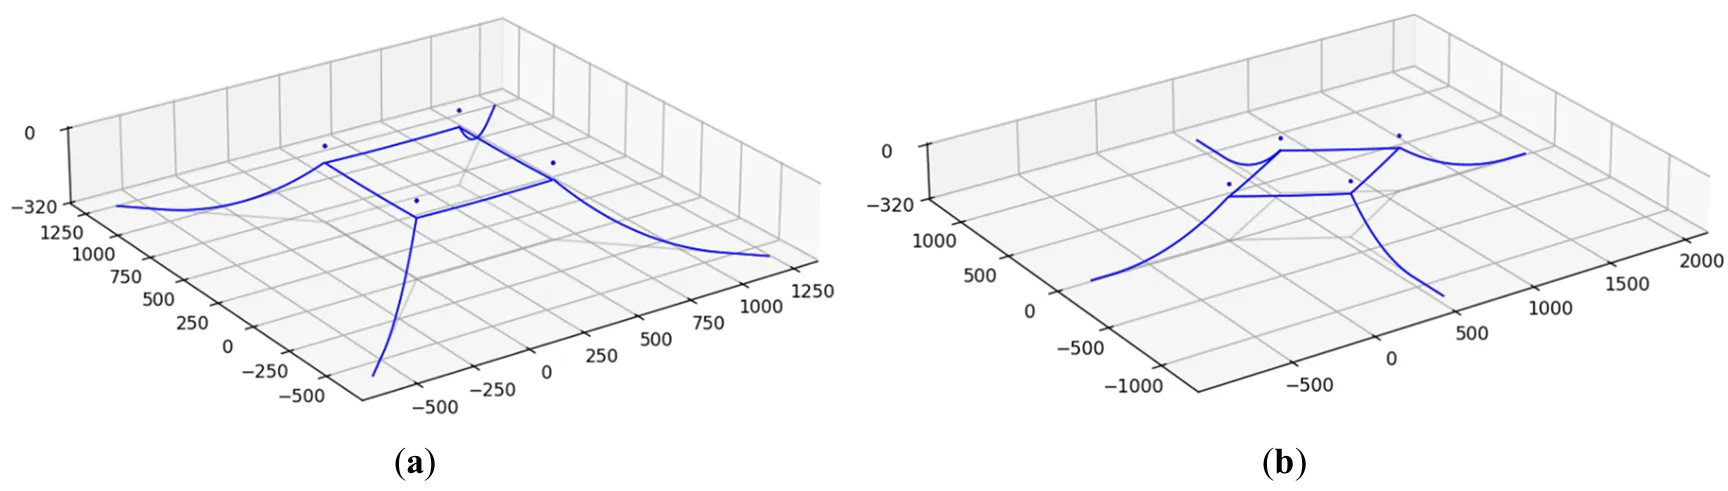
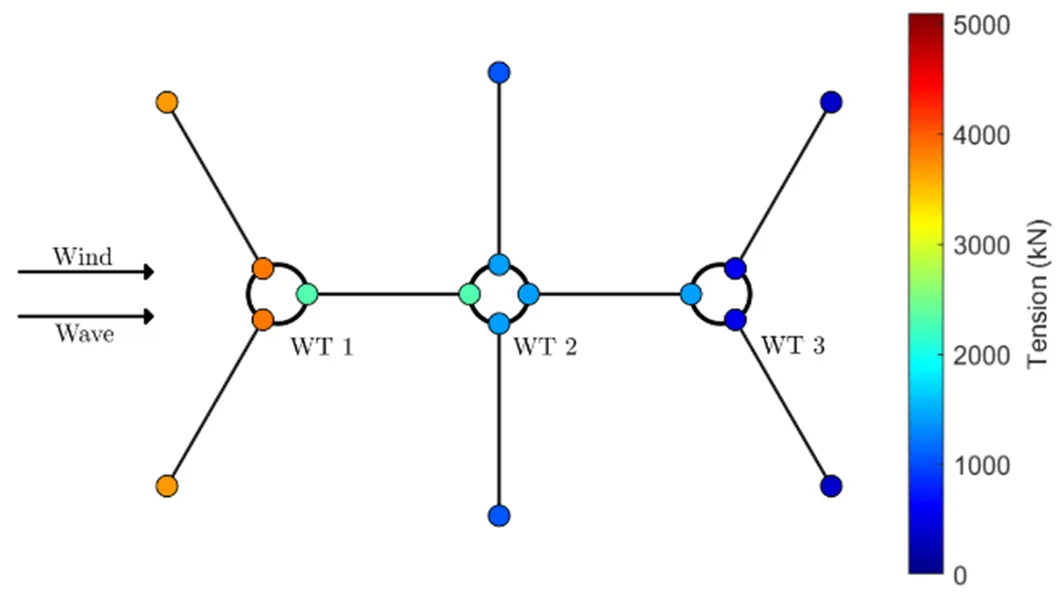
44] found the most efficient set-up was the tandem arrangement, where the three turbines were aligned. In a full wind wake condition, the distance between the turbines has little effect on the power and thrust of the middle turbine, but it significantly impacts the downstream turbine. Moreover, when the distance between the first and middle turbines is reduced, the total power of the three-turbine system tends to increase. The system was modelled with 4 and 6 anchors (
), with an angle of 120° between anchor lines, to assess the effect of the middle lines on the restoring forces.
. A three-spar system is in tandem arrangement, with (<b>a</b>) four anchors and (<b>b</b>) six anchors.
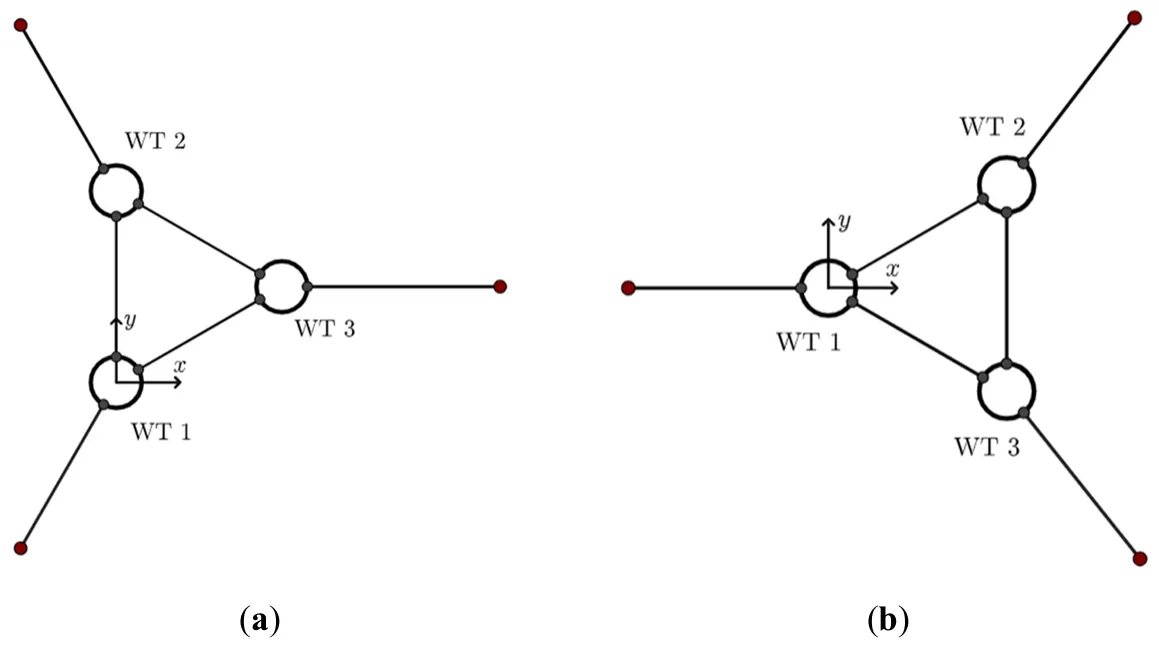
In a staggered setup of three turbines, two configurations are proposed: with two downstream wind turbines or with two upstream. In the first case, the turbulence affects the downstream turbines from one side, causing notable changes in thrust and torque. However, when the turbulence comes from both sides, the thrust and torque are more stable in the case of two upstream turbines. The two turbines in front speed up the wind for the downstream turbine, leading to a noticeable increase in its power output.
Since the platforms were studied as fixed turbines, it is important to perform simulations for all configurations to obtain the tensions from the floating systems and analyse the pitch motion, which directly affects the farm’s energy production [
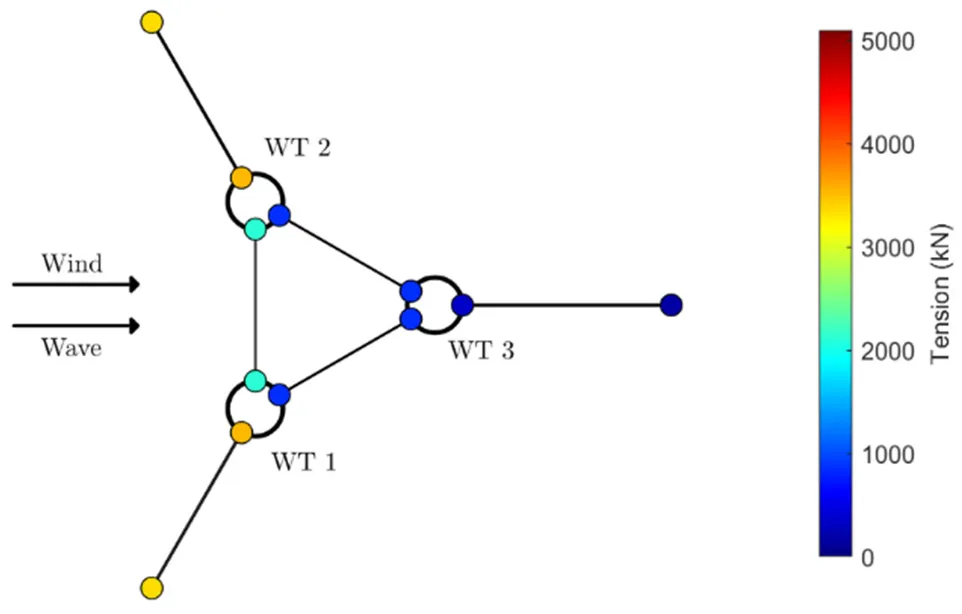
45]. Both staggered systems are modelled triangularly, where the anchor line is aligned with the triangle’s median. The layouts are displayed in .
. A three-spar system is in a staggered arrangement, with (<b>a</b>) two upstream wind turbines and (<b>b</b>) two downstream wind turbines.
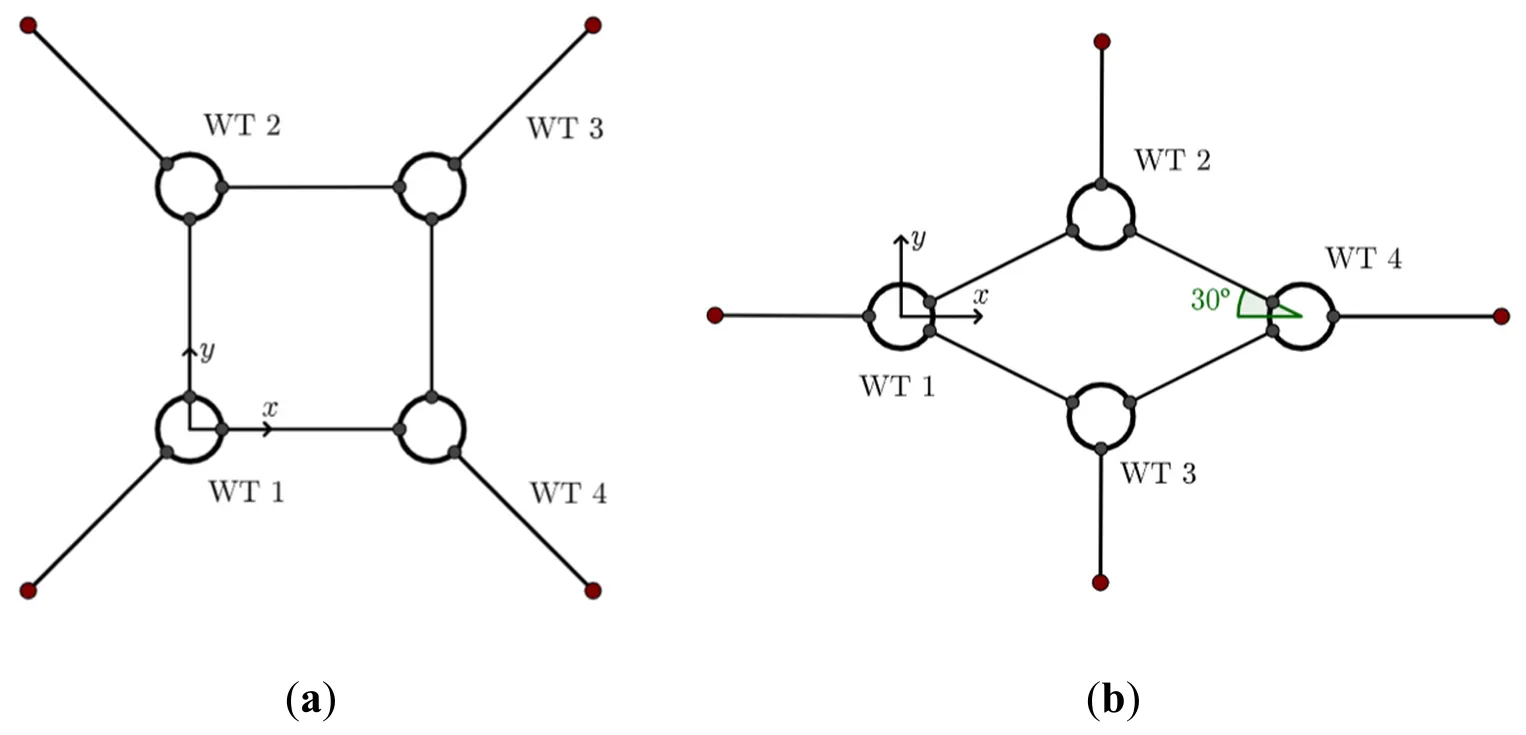
In addition to the three-spar system, two new concepts of four-spar systems are proposed (). The first one consists of perpendicular shared lines, where each turbine has two shared moorings and one anchor. The anchor moorings present an angle of 45° in relation to the axes. The second system presents shared lines at an angle of 30 degrees in relation to the
x-axis. This concept guarantees that turbines 2 and 3 have the same distance between them and between the other two turbines.
. A four-spar system, with an angle between the shared line and x-axis of: (<b>a</b>) 90 degrees; (<b>b</b>) 30 degrees.
The mooring properties for the anchored lines are taken from Jonkman [
42]. This material, used in the OC3 project, is a multisegmented mooring with the properties shown in , simplified by the weighted-average values of the parameters displayed. The shared lines between platforms are composed entirely of polyester, with properties from the Bridon Fiber Rope catalogue [
46]. The polyester length equals the initial spacing between floaters, which is defined as five times the rotor diameter, or 630 m. The diameter originates from the results of Biroli et al. [
47], where a numerical study of a dual-spar system was performed, and the polyester with a 139 mm diameter showed stable results with low tensions at the fairleads. The anchor radius is set at a horizontal distance of 853.87 m from the platform’s centreline.
.
Mooring main parameters.
| Parameter |
OC3 Mooring |
Polyester |
Unit |
| Diameter |
90.00 |
139.00 |
mm |
| Length |
902.20 |
630.00 |
m |
| Mass density |
77.71 |
12.10 |
kg/m |
| Weight in water |
698.09 |
29.43 |
N/m |
| Extensional stiffness |
3.84 × 10⁸ |
* |
N |
| Maximum breaking load |
- ** |
4.91 × 10⁶ |
N |
3.4. Environmental Parameters
The irregular waves are modelled using a JONSWAP three-parameter model. The significant wave height (Hs) and peak period are defined based on average sea states observed in experimental studies [
20,
21]. Wind speed is set at the rated speed of 11.4 m/s and modelled as a stationary uniform flow. The peak-spectra parameter (γ) is obtained from the design load condition defined by Balakrishnan et al. [
48]. A regular sea current of 1 m/s is implemented. All environmental loads are unidirectional; therefore, the dynamic forces are applied only along the
x-axis. The parameters are shown in
.
.
Environmental parameters.
| Hs |
Tp |
γ |
Wind Speed |
Current Speed |
| m |
S |
- * |
m/s |
m/s |
| 5.49 |
11.30 |
2.00 |
11.40 |
1.00 |
4. Results and Discussion
4.1. Static Results
The static results are obtained with the SIMA (v4.8-01) software without considering any environmental loads and are then verified with MoorPy, an open-source code for quasi-static analysis [
49]. This code does not support the Syrope model. Thus, following Vidal et al.’s [
40] approach, a representative constant axial stiffness (from the load-elongation curve) was identified and used for each quasi-static comparison. The points studied in this test are the anchored line fairlead (Fairlead AL), the shared line fairlead (Fairlead SL), and the anchor. The motion results are related to the platform’s initial position.
Firstly, both tandem systems were evaluated. The defined axial stiffness for the system with four and six anchors was 26.8 MN and 28.0 MN, respectively. The tension values in each point are detailed in
. In addition, for these systems, the initial displacements in the
x and
z directions are obtained and presented in
. The Moorpy static plots are shown in
.
.
Static tensions for three-spar systems in tandem arrangement.
| Turbine |
Point |
Tandem Four Anchors |
Tandem Six Anchors |
| SIMA [kN] |
MoorPy [kN] |
Difference [kN] |
SIMA [kN] |
MoorPy [kN] |
Difference [kN] |
| WT1 & WT3 |
Fairlead AL |
772.66 |
774.20 |
1.54 |
776.97 |
778.62 |
1.65 |
| Fairlead SL |
584.44 |
584.20 |
0.24 |
589.19 |
589.08 |
0.12 |
| Anchor |
599.18 |
598.58 |
0.60 |
603.49 |
603.02 |
0.47 |
| WT2 |
Fairlead AL |
- * |
- * |
- * |
925.35 |
926.32 |
0.97 |
| Fairlead SL |
584.52 |
584.28 |
0.24 |
589.18 |
589.07 |
0.11 |
| Anchor |
- * |
- * |
- * |
752.00 |
751.00 |
1.00 |
.
Static initial displacement for three-spar systems in tandem arrangement.
| Initial Displacement |
Turbine |
Tandem Four Anchors |
Tandem Six Anchors |
| SIMA [m] |
MoorPy [m] |
Difference [m] |
SIMA [m] |
MoorPy [m] |
Difference [m] |
| X |
WT1 |
−13.72 |
−13.56 |
0.15 |
−13.26 |
−13.10 |
0.16 |
| WT2 |
−0.09 |
0.00 |
0.09 |
−0.08 |
0.00 |
0.08 |
| WT3 |
13.60 |
13.56 |
0.04 |
13.10 |
13.10 |
0.00 |
| Z |
WT1 |
2.03 |
1.94 |
0.09 |
2.01 |
1.92 |
0.09 |
| WT2 |
4.92 |
4.83 |
0.09 |
1.69 |
1.60 |
0.09 |
| WT3 |
2.03 |
1.94 |
0.09 |
2.01 |
1.92 |
0.09 |
Due to the system’s symmetry, wind turbines 1 and 3 (upstream and downstream) have the same values for tension and displacement. The SIMA results show a small difference in the surge motion values. This discordance is likely due to the platform definition of centre of mass on the SIMA model, where the wind turbine hub and blades shift the centre of mass away from the centreline, causing mass asymmetry on the system. The polyester shared line presents a different tension at each end since the platforms connected have a different displacement in the
z-axis.
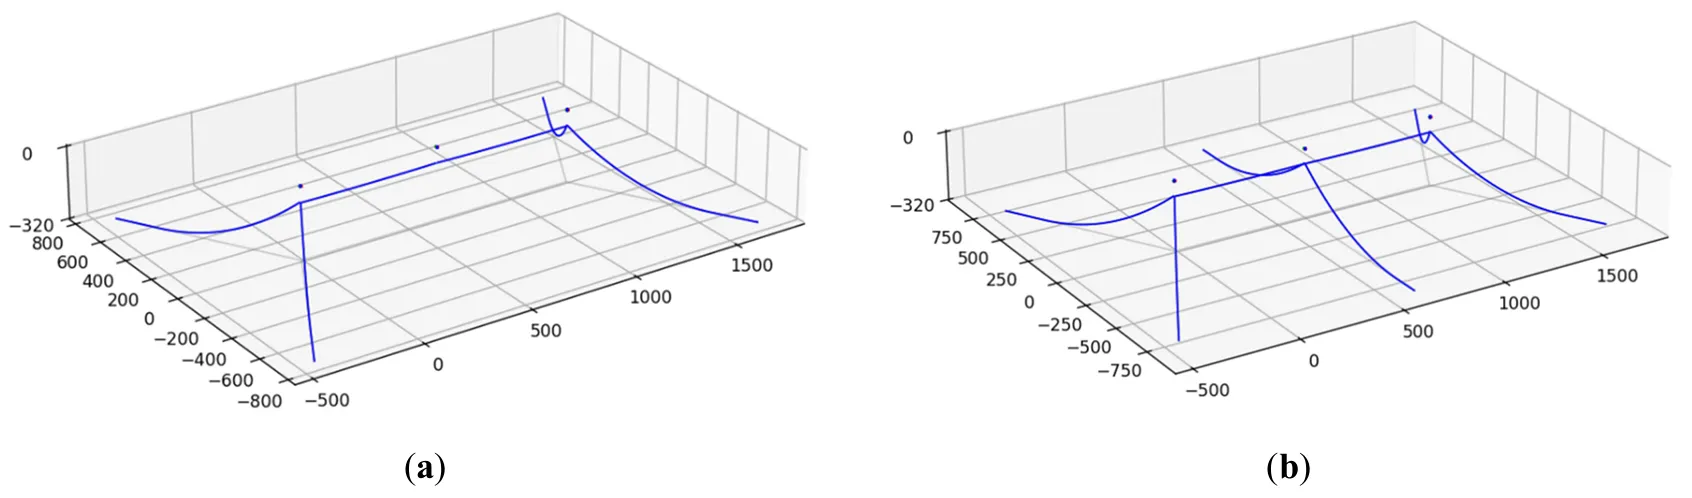
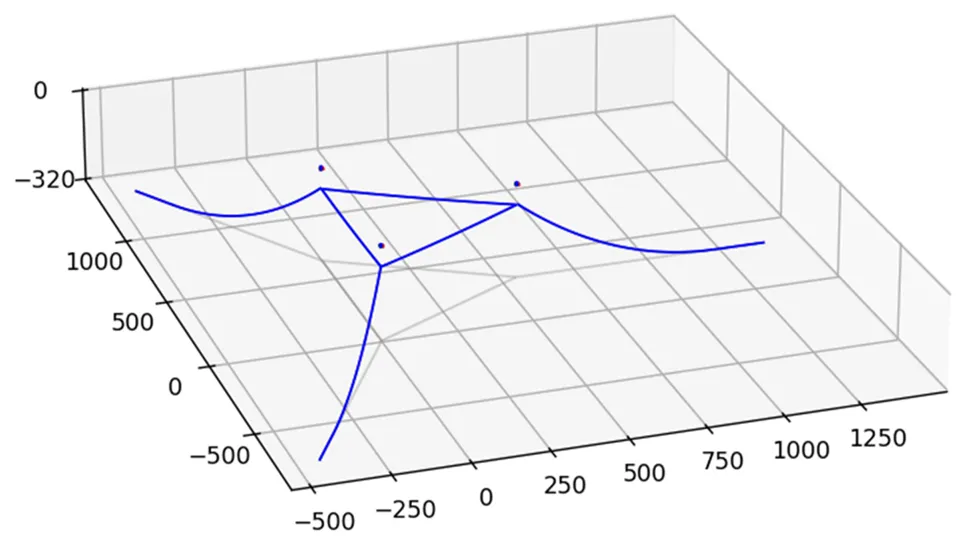
The staggered configurations have the same mooring design. The main difference between the systems’ models is the coordinate system and turbine orientation. Therefore, for both systems, the axial stiffness is defined as 26.3 MN, and the tensions are displayed together in
. For convenience, the translational motions are shown in
only for the system with two upstream wind turbines. The system representation is shown in
.
. MoorPy static plot for three-spar system in tandem arrangement, with: (<b>a</b>) four anchors; (<b>b</b>) six anchors.
.
Static tensions for three-spar systems in staggered arrangement.
| Turbine |
Point |
SIMA [kN] |
MoorPy [kN] |
Difference [kN] |
WT1, WT2
& WT3
|
Fairlead AL |
815.98 |
820.50 |
4.52 |
| Fairlead SL |
370.44 |
368.78 |
1.66 |
| Anchor |
641.51 |
643.94 |
2.43 |
.
Static initial displacement for three-spar system in staggered arrangement with two upstream wind turbines.
| Initial Displacement |
Turbine |
SIMA [m] |
MoorPy [m] |
Difference [m] |
| X |
WT1 |
−2.72 |
−2.53 |
0.19 |
| WT2 |
−2.72 |
−2.53 |
0.19 |
| WT3 |
5.18 |
5.07 |
0.12 |
| Y |
WT1 |
−4.57 |
−4.39 |
0.18 |
| WT2 |
4.57 |
4.39 |
0.18 |
| WT3 |
0.00 |
0.00 |
0.00 |
| Z |
WT1 |
3.42 |
3.33 |
0.09 |
| WT2 |
3.42 |
3.33 |
0.09 |
| WT3 |
3.42 |
3.33 |
0.09 |
. MoorPy static plot for a three-spar system in staggered arrangement.
In static equilibrium, the three turbines have the same values for tension since the system is symmetric and exhibits the same vertical displacement. The tension at the anchor line fairlead presents values twice as large as those of the shared line. It was found that, for the four-spar systems, the constant axial stiffness of 33.0 MN and 34.8 MN were good representations for the configurations with 90- and 30-degree orientations, respectively. The tensions are displayed in
, and the platform displacement in all directions is detailed in
. The MoorPy models are shown in
.
The tension results for the four-spar system with shared moorings at 90 degrees are the same for all floaters, since the system is symmetric in every direction. However, the system at 30 degrees exhibits symmetry between wind turbines 1 & 4 and turbines 2 & 3. Because of this, the tensions are better distributed in the first system (
a) than in the second (
b), where the maximum static tension is 17.41% higher.
.
Static tensions for four-spar systems.
| Turbine |
Point |
Four-Spar 90 Degrees |
Four-Spar 30 Degrees |
| SIMA [kN] |
MoorPy [kN] |
Difference [kN] |
SIMA [kN] |
MoorPy [kN] |
Difference [kN] |
| WT1 & WT4 |
Fairlead AL |
798.10 |
803.34 |
5.24 |
937.04 |
939.06 |
2.02 |
| Fairlead SL |
440.97 |
438.13 |
2.84 |
445.87 |
445.92 |
0.05 |
| Anchor |
623.62 |
626.76 |
3.14 |
762.58 |
762.63 |
0.05 |
| WT2 & WT3 |
Fairlead AL |
798.10 |
803.34 |
5.24 |
636.69 |
638.83 |
2.14 |
| Fairlead SL |
440.97 |
438.13 |
2.84 |
445.88 |
445.91 |
0.03 |
| Anchor |
623.62 |
626.76 |
3.14 |
462.24 |
462.05 |
0.19 |
.
Static initial displacement for four-spar systems.
| Initial Displacement |
Turbine |
Four-Spar 90 Degrees |
Four-Spar 30 Degrees |
| SIMA [m] |
MoorPy [m] |
Difference [m] |
SIMA [m] |
MoorPy [m] |
Difference [m] |
| X |
WT1 |
−4.41 |
−4.15 |
0.25 |
−0.37 |
−0.19 |
0.18 |
| WT2 |
−4.41 |
−4.15 |
0.25 |
−0.09 |
0.00 |
0.09 |
| WT3 |
4.24 |
4.15 |
0.09 |
−0.09 |
0.00 |
0.09 |
| WT4 |
4.24 |
4.15 |
0.09 |
0.21 |
0.19 |
0.02 |
| Y |
WT1 |
−4.32 |
−4.15 |
0.17 |
0.00 |
0.00 |
0.00 |
| WT2 |
4.32 |
4.15 |
0.17 |
15.51 |
15.43 |
0.08 |
| WT3 |
−4.32 |
−4.15 |
0.17 |
−15.51 |
−15.43 |
0.08 |
| WT4 |
4.32 |
4.15 |
0.17 |
0.00 |
0.00 |
0.00 |
| Z |
WT1 |
3.43 |
3.34 |
0.09 |
3.30 |
3.20 |
0.09 |
| WT2 |
3.43 |
3.34 |
0.09 |
3.61 |
3.52 |
0.09 |
| WT3 |
3.43 |
3.34 |
0.09 |
3.61 |
3.52 |
0.09 |
| WT4 |
3.43 |
3.34 |
0.09 |
3.30 |
3.20 |
0.09 |
. MoorPy static plot for four-spar system, with an angle between shared line and x-axis: (<b>a</b>) 90 degrees; (<b>b</b>) 30 degrees.
The fully coupled dynamic simulations are conducted for 3 h; however, the results are analysed from 7200 to 10,800 s. The tensions at symmetric x-axis points are practically the same; thus, the values presented in this section are the largest mean value. The tensions are analysed at the fairleads and anchors for all systems. In addition, the system’s maximum global tension is defined to study the system’s critical points. The six degrees of freedom (DOF) results obtained from SIMA, surge, and pitch motions are discussed in this section, since they are the most important DOF when analysing environmental loads applied along the
x-axis.
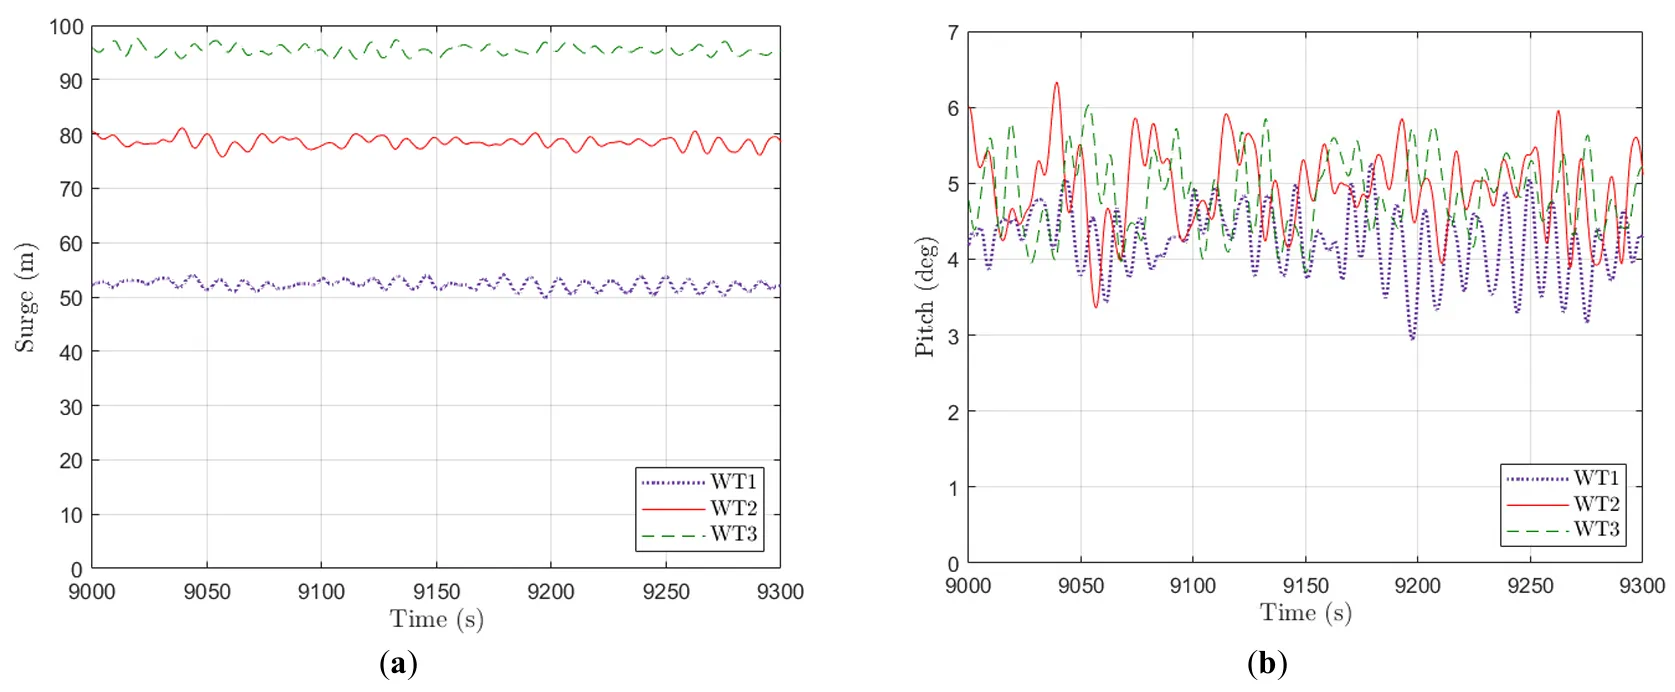
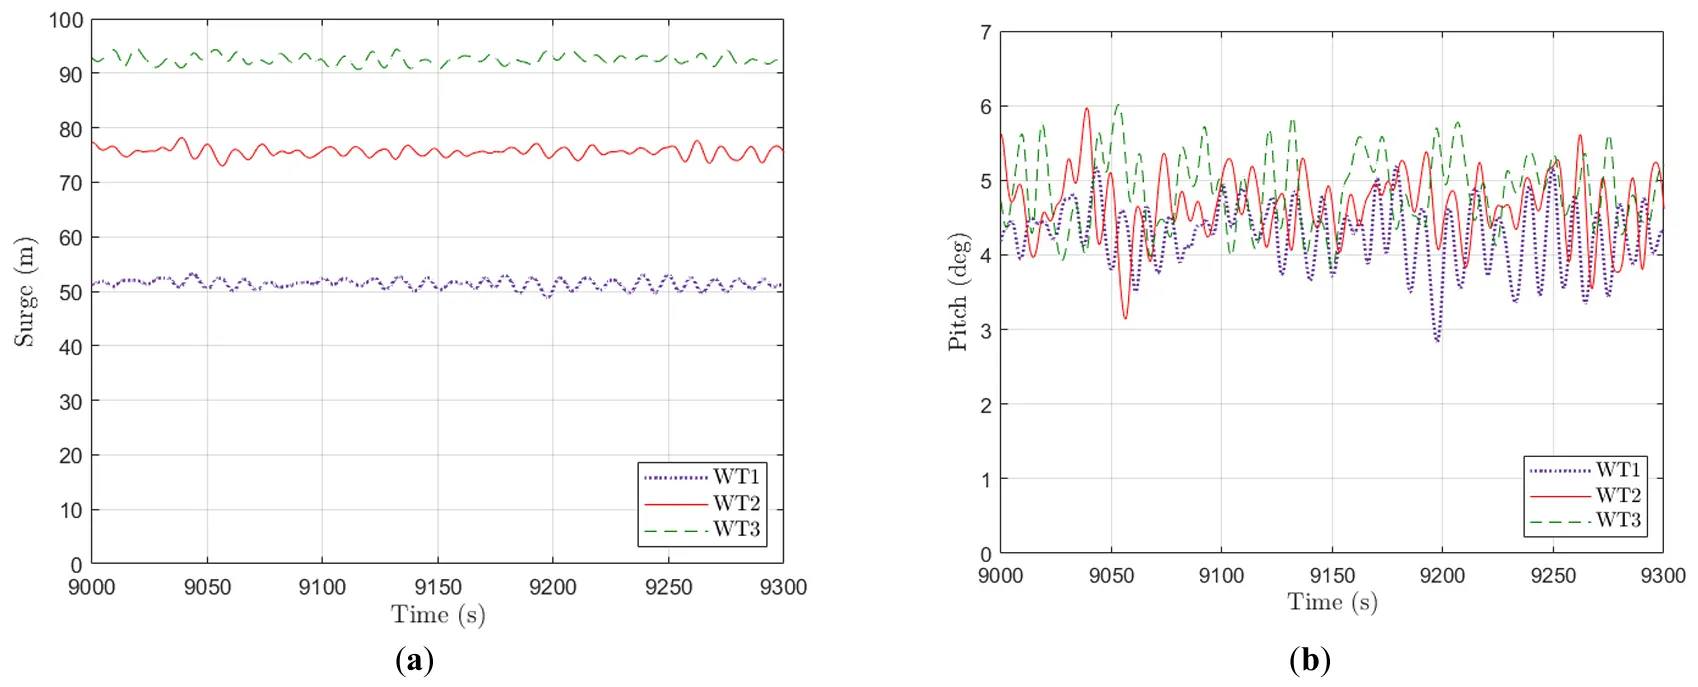
The first system tested is the tandem arrangement with four anchors. The motion results are presented in
, with the mean, maximum, minimum, and standard deviation values. A sample of their behaviour is displayed in
. The surge motion is shown in relation to the initial position. Wind turbine 1 presents the smallest offset from the initial position compared to the other two turbines. This is due to the two anchored lines that apply a restoring force over the two upstream fairleads. This is also noticeable in the pitch motion, where the upstream turbine presents a lower inclination.
.
Surge and pitch motions for three-spar system in tandem arrangement with four anchors.
| Motion |
Turbine |
Mean |
Max |
Min |
Std |
|
WT1 |
52.42 |
55.06 |
49.91 |
0.781 |
| Surge [m] |
WT2 |
78.50 |
81.12 |
75.59 |
0.822 |
|
WT3 |
95.53 |
97.60 |
92.70 |
0.819 |
|
WT1 |
4.32 |
5.40 |
2.94 |
0.392 |
| Pitch [deg] |
WT2 |
4.94 |
6.33 |
3.36 |
0.440 |
|
WT3 |
4.90 |
6.10 |
3.37 |
0.451 |
. Three-spar system in tandem arrangement with 4 anchors: (<b>a</b>) Surge motion; (<b>b</b>) Pitch motion.
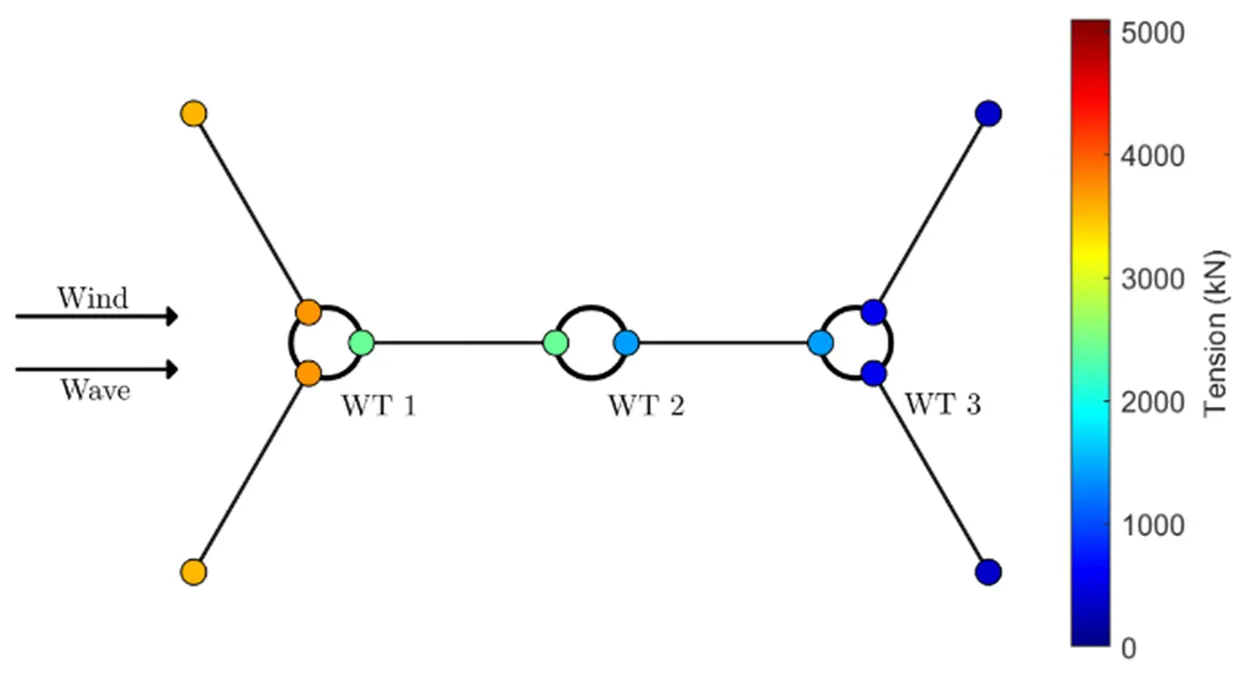
The tensions for this simulation are presented in
. In addition, a maximum tension distribution along the system is shown in
. The higher tensions are concentrated on the upstream area, where the upstream fairleads have the highest values in the entire system. In this model, there are no restoring forces on the middle turbine (WT2), therefore, the tension at the shared mooring between WT1 and WT2 reaches about 50% of the polyester’s maximum breaking strength.
Table 12.
Dynamic tension for a three-spar system in tandem arrangement with four anchors.
| Location |
Point |
Mean [kN] |
Max [kN] |
Min [kN] |
Std [kN] |
| Fairlead |
Upstream (WT1) |
3132.40 |
3715.10 |
2559.00 |
165.02 |
| Shared WT1-WT2 |
2143.90 |
2429.80 |
1840.70 |
91.16 |
| Shared WT2-WT3 |
1167.50 |
1416.90 |
906.89 |
81.61 |
| Downstream (WT3) |
401.43 |
535.78 |
296.07 |
24.24 |
| Anchor |
Upstream (WT1) |
2962.30 |
3547.60 |
2382.40 |
165.74 |
| Downstream (WT3) |
228.03 |
365.20 |
94.07 |
30.55 |
. Maximum tension distribution for a three-spar system in tandem arrangement with four anchors.
The second model tested is the tandem configuration with six anchors. This system adds two new anchor lines to the middle wind turbine. The motion results are detailed in
, and their response is displayed in
. Compared to the 4 anchors layout, this system shows a lower mean displacement in surge due to the restoring forces now applied by the middle anchor lines. Because of this addition to the system, the value of the pitch motion of wind turbine 2 decreases, showing a more stable system. The obtained tensions, in both the fairlead and the anchor, are shown in
. The tension distribution is displayed in
. The tensions are better distributed with the additional moorings. Therefore, the mean tension at the upstream fairleads and on the shared lines decreases.
.
Surge and pitch motions for the three-spar system in tandem arrangement with six anchors.
| Motion |
Turbine |
Mean |
Max |
Min |
Std |
| Surge [m] |
WT1 |
51.56 |
54.16 |
48.86 |
0.789 |
| WT2 |
75.69 |
78.18 |
72.70 |
0.823 |
| WT3 |
92.68 |
94.90 |
89.80 |
0.826 |
| Pitch [deg] |
WT1 |
4.32 |
5.45 |
2.84 |
0.396 |
| WT2 |
4.67 |
5.97 |
3.14 |
0.428 |
| WT3 |
4.89 |
6.14 |
3.47 |
0.453 |
. Three-spar system in tandem arrangement with six anchors: (<b>a</b>) Surge motion; (<b>b</b>) Pitch motion.
. Maximum tension distribution for a three-spar system in tandem arrangement with six anchors.
.
Dynamic tension for a three-spar system in tandem arrangement with six anchors.
| Location |
Point |
Mean [kN] |
Max [kN] |
Min [kN] |
Std [kN] |
| Fairlead |
Upstream (WT1) |
3018.10 |
3863.70 |
2335.80 |
246.67 |
| Shared WT1-WT2 |
2023.00 |
2305.20 |
1742.70 |
90.15 |
| Middle (WT2) |
1010.20 |
1201.00 |
797.24 |
69.53 |
| Shared WT2-WT3 |
1174.80 |
1418.00 |
890.23 |
82.09 |
| Downstream (WT3) |
408.22 |
509.22 |
301.37 |
22.93 |
| Anchor |
Upstream (WT1) |
2847.90 |
3697.90 |
2166.00 |
247.42 |
| Middle (WT2) |
837.02 |
1051.90 |
625.40 |
70.49 |
| Downstream (WT3) |
234.83 |
343.50 |
134.04 |
27.08 |
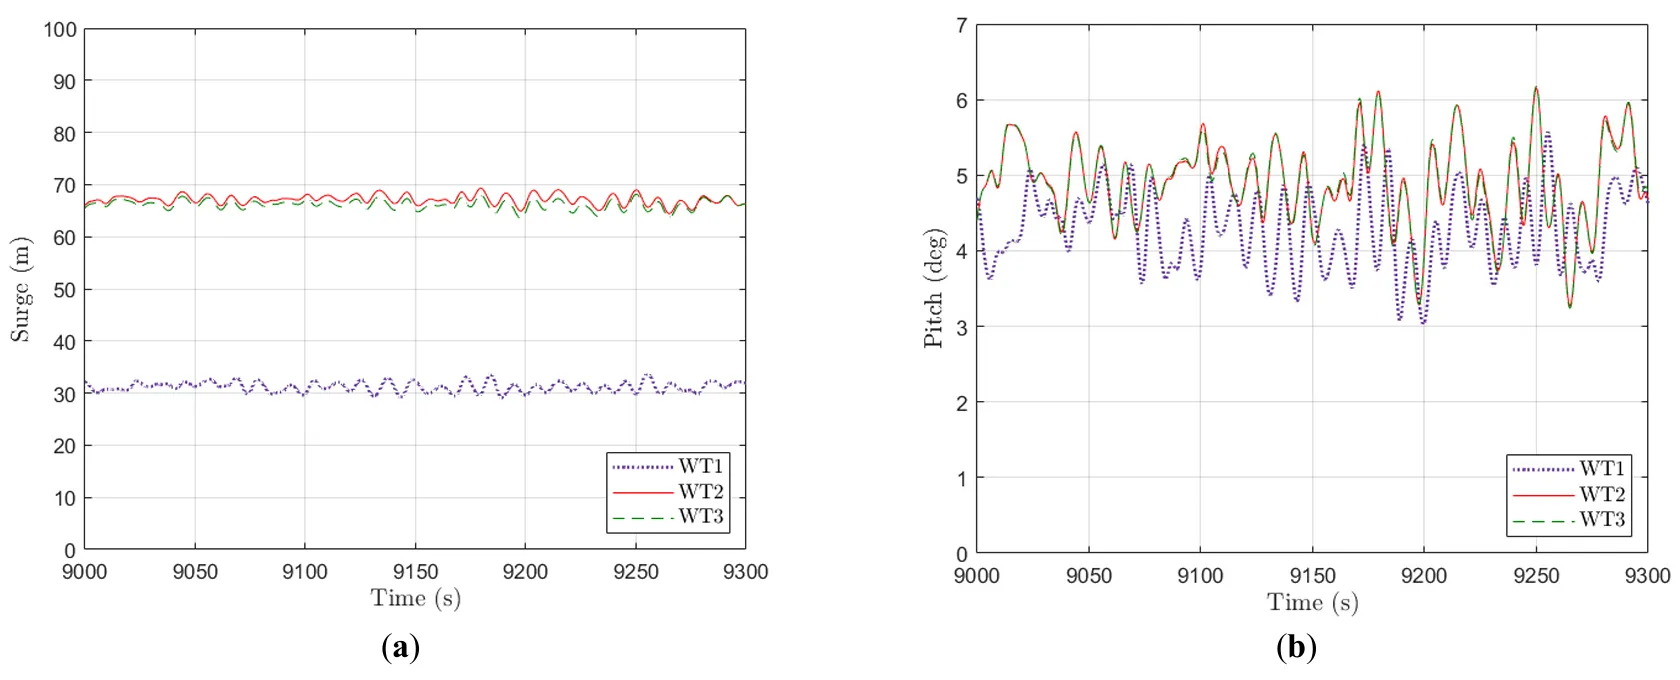
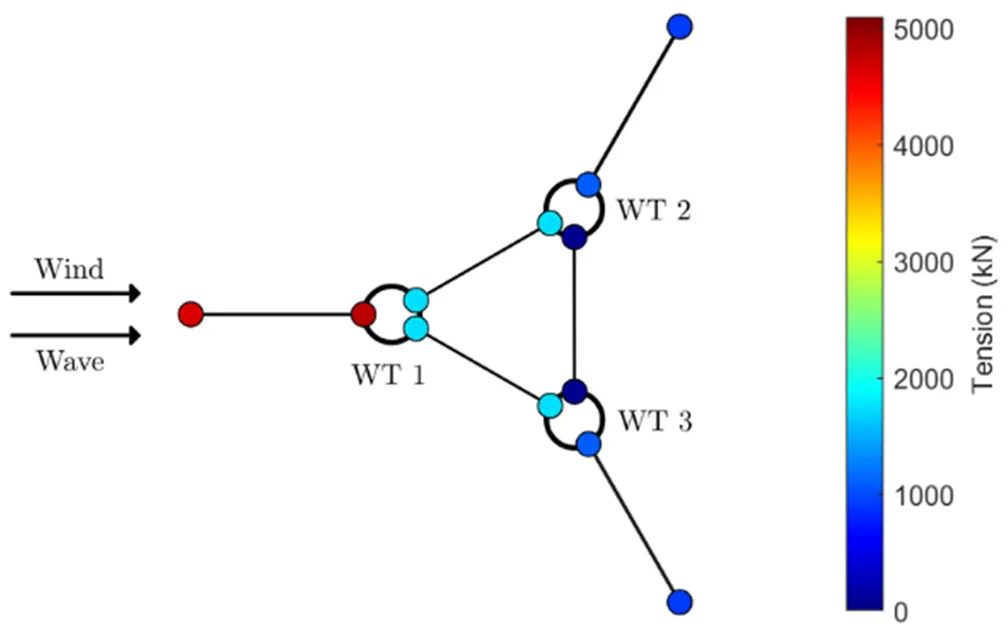
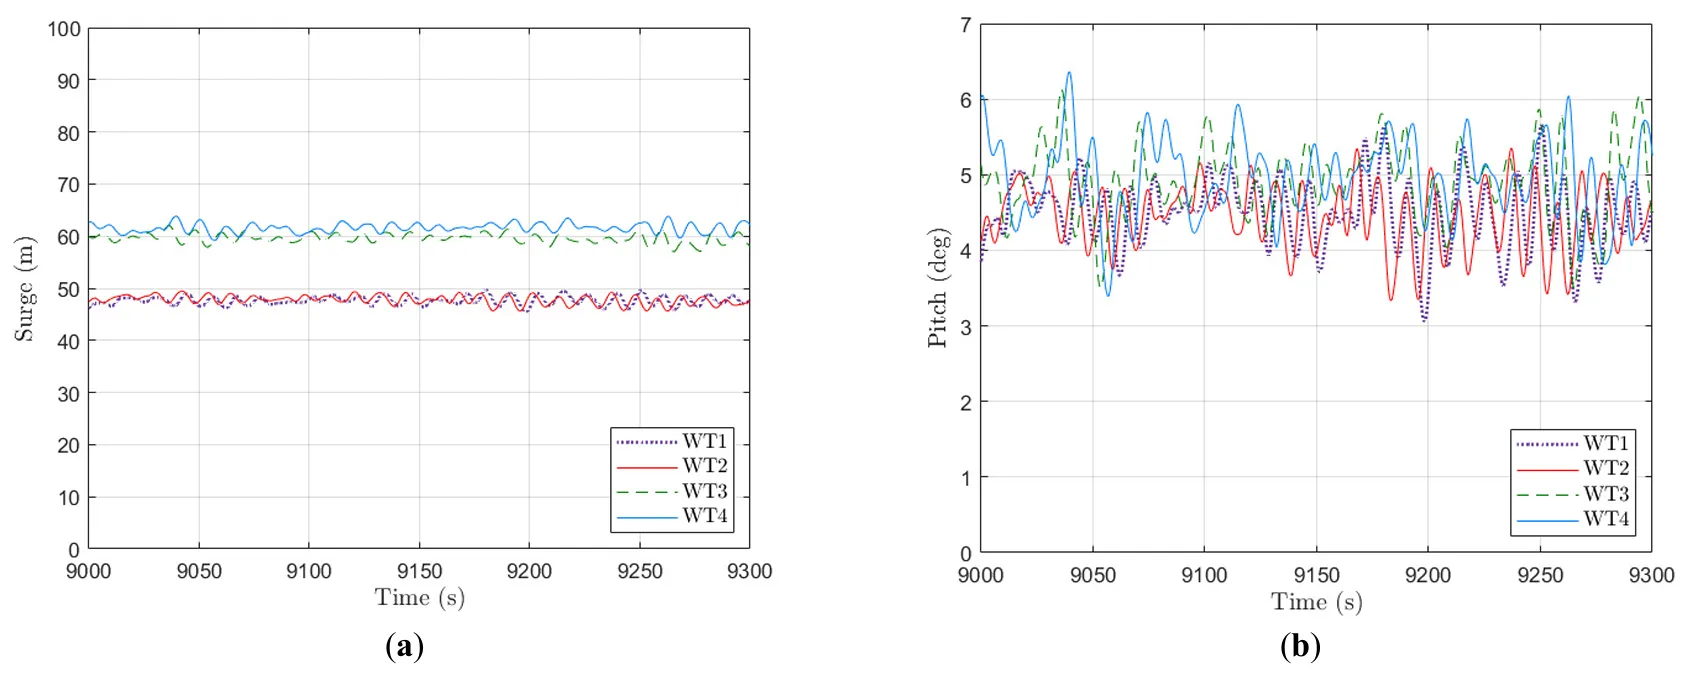
The first staggered arrangement analysed is modelled with two upstream wind turbines. The surge and pitch motions are displayed in
, and their plots are shown in
. Due to the system’s symmetry, upstream wind turbines show similar surge and pitch motion values. However, the downstream turbine presents a higher mean displacement with the same motion amplitude. The distribution of the dynamic tensions is shown in
, focusing on the maximum tension presented in
.
.
Surge and pitch motions for a three-spar system in a staggered arrangement with two upstream wind turbines.
| Motion |
Turbine |
Mean |
Max |
Min |
Std |
| Surge [m] |
WT1 |
67.37 |
69.84 |
64.54 |
0.824 |
| WT2 |
67.66 |
69.97 |
64.84 |
0.794 |
| WT3 |
73.12 |
75.40 |
70.06 |
0.825 |
| Pitch [deg] |
WT1 |
4.62 |
5.85 |
3.10 |
0.423 |
| WT2 |
4.61 |
6.00 |
2.91 |
0.432 |
| WT3 |
4.98 |
6.31 |
3.29 |
0.468 |
.
Dynamic tension for a three-spar system in staggered arrangement with two upstream wind turbines.
| Location |
Point |
Mean [kN] |
Max [kN] |
Min [kN] |
Std [kN] |
| Fairlead |
Upstream (WT1/WT2) |
3021.70 |
3530.70 |
2576.20 |
134.55 |
| Shared WT1-WT2 |
2006.30 |
2113.60 |
1884.30 |
30.42 |
| Shared WT2-WT3 |
643.22 |
851.99 |
429.74 |
6.44 |
| Downstream (WT3) |
296.06 |
331.78 |
263.74 |
8.20 |
| Anchor |
Upstream (WT1/WT2) |
2849.30 |
3362.90 |
2399.60 |
135.05 |
| Downstream (WT3) |
122.29 |
155.74 |
87.42 |
9.84 |
. A three-spar system is in a staggered arrangement with two upstream wind turbines: (<b>a</b>) surge motion and (<b>b</b>) pitch motion.
. Maximum tension distribution for a three-spar system in a staggered arrangement with two upstream wind turbines.
As with the other systems, the tensions are concentrated on the upstream elements, with a maximum tension of 3530.7 kN on the upstream fairleads. The mean tension values are close to those observed in the tandem configuration with 6 anchors. For comparison, the second staggered model has only one upstream wind turbine and two downstream. The floaters’ displacements are detailed in
and plotted in
.
.
Surge and pitch motions for a three-spar system in a staggered arrangement with two downstream wind turbines.
| Motion |
Turbine |
Mean |
Max |
Min |
Std |
| Surge [m] |
WT1 |
31.30 |
33.75 |
28.95 |
0.815 |
| WT2 |
66.93 |
69.59 |
64.00 |
0.815 |
| WT3 |
66.50 |
69.06 |
63.52 |
0.806 |
| Pitch [deg] |
WT1 |
4.35 |
5.62 |
3.02 |
0.421 |
| WT2 |
4.91 |
6.29 |
3.27 |
0.435 |
| WT3 |
4.92 |
6.28 |
3.24 |
0.436 |
Figure 13. Three-spar system in a staggered arrangement with two downstream wind turbines: (<b>a</b>) Surge motion; (<b>b</b>) Pitch motion.
The upstream wind turbine has a lower offset value, with a mean surge of 31.3 m. The downstream turbines show a similar behaviour to the two upstream turbines (
) from the previous model. Moreover, the amplitude of motion is shorter for the upstream wind turbine. Due to the restoring forces applied by the upstream anchor line, which are aligned with the environmental loads, the pitch motion for the first platform has a lower inclination than the other two. The dynamic tensions are described in
for each element of the system. The representation of the maximum global tension can be seen in
. With only one upstream anchor mooring, the maximum tension at the upstream fairleads is 36.2% higher than that of the other staggered configuration with two upstream turbines. However, the maximum tension at the shared fairleads is lower, meaning less tension is applied to the polyester ropes.
.
Dynamic tension for a three-spar system in a staggered arrangement with two downstream wind turbines.
| Location |
Point |
Mean [kN] |
Max [kN] |
Min [kN] |
Std [kN] |
| Fairlead |
Upstream (WT1) |
3877.20 |
4808.50 |
3076.40 |
35.03 |
| Shared WT1-WT2 |
1458.40 |
1738.40 |
1193.20 |
79.22 |
| Shared WT2-WT3 |
32.38 |
59.58 |
16.94 |
6.53 |
| Downstream (WT2/WT3) |
916.41 |
1082.10 |
759.84 |
52.08 |
| Anchor |
Upstream (WT1) |
3705.50 |
4640.40 |
2897.70 |
352.03 |
| Downstream (WT2/WT3) |
742.21 |
916.87 |
591.15 |
52.74 |
. Maximum tension distribution for a three-spar system in a staggered arrangement with two downstream wind turbines.
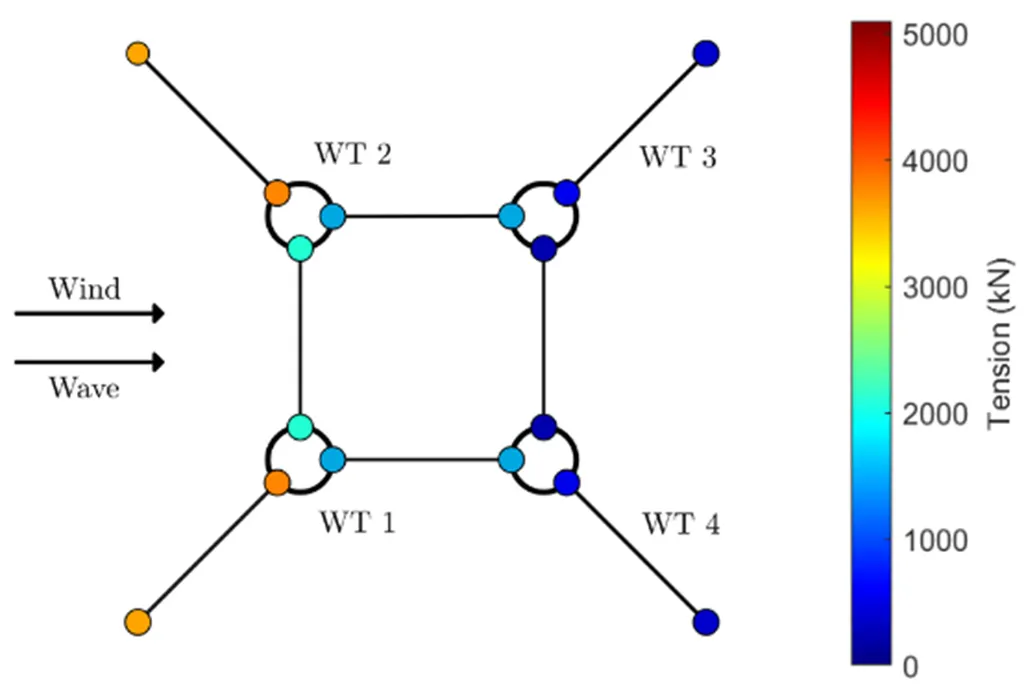
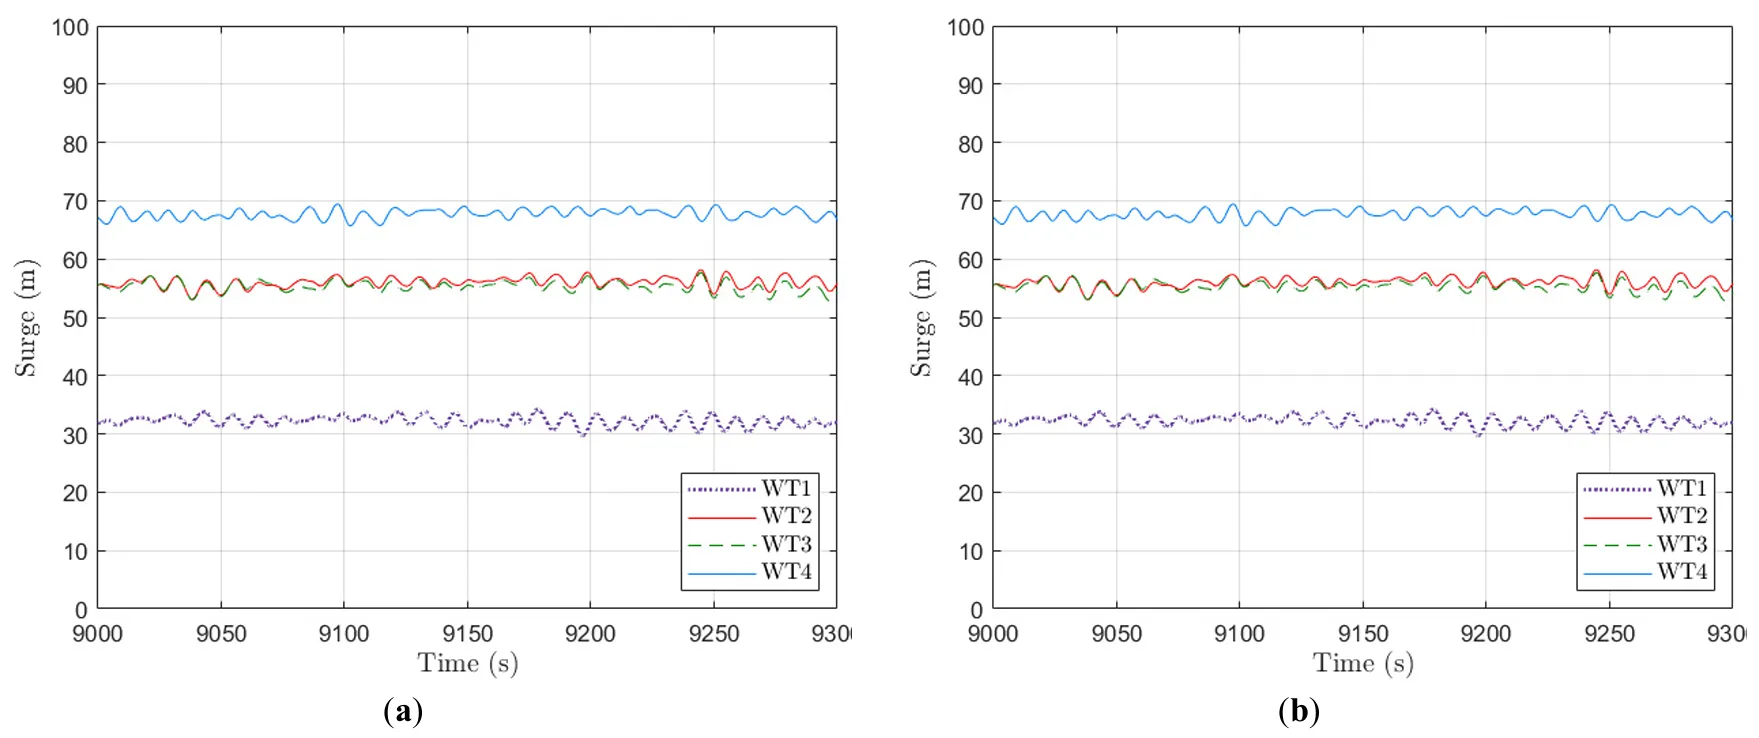
Finally, the four-spar systems were modelled and simulated. For the system with perpendicular shared lines, the main motions obtained from the three-hour simulation are displayed in
. Their motion behaviour is shown in
. The results reveal the system symmetry, with the two upstream wind turbines showing similar motion values for surge and pitch to the two downstream turbines. The tensions are described in detail in
, and the distribution of the maximum tension is presented in
. The upstream fairleads and anchor show a high tension, reaching 3797.4 kN in the highest peak response. The shared line between wind turbines 1 and 2 has a higher tension than the other polyester moorings; however, this value represents 42.2% of the material’s maximum breaking load.
.
Surge and pitch motions for a four-spar system with 90 degrees.
| Motion |
Turbine |
Mean |
Max |
Min |
Std |
|
WT1 |
47.62 |
50.27 |
44.98 |
0.810 |
| Surge [m] |
WT2 |
48.09 |
51.08 |
45.39 |
0.804 |
| WT3 |
59.88 |
62.18 |
56.88 |
0.828 |
|
WT4 |
61.46 |
64.26 |
58.73 |
0.836 |
|
WT1 |
4.54 |
5.72 |
3.05 |
0.411 |
| Pitch [deg] |
WT2 |
4.52 |
5.94 |
2.89 |
0.423 |
| WT3 |
4.96 |
6.31 |
3.26 |
0.483 |
|
WT4 |
4.96 |
6.36 |
3.39 |
0.441 |
Figure 15. A four-spar system with 90 degrees: (<b>a</b>) Surge motion; (<b>b</b>) Pitch motion.
.
Dynamic tension for a four-spar system with 90 degrees.
| Location |
Point |
Mean [kN] |
Max [kN] |
Min [kN] |
Std [kN] |
| Fairlead |
Upstream (WT1/WT2) |
3171.20 |
3797.40 |
2698.90 |
159.72 |
| Shared WT1-WT2 |
1981.90 |
2070.50 |
1850.40 |
286.12 |
| Shared WT2-WT3 |
1164.40 |
1458.00 |
906.44 |
78.53 |
| Shared WT3-WT4 |
196.37 |
222.75 |
173.24 |
7.34 |
| Downstream (WT3/WT4) |
419.91 |
514.80 |
321.83 |
22.42 |
| Anchor |
Upstream (WT1/WT2) |
2998.80 |
3629.90 |
2521.70 |
160.80 |
| Downstream (WT3/WT4) |
245.94 |
358.03 |
133.90 |
27.49 |
. Maximum tension distribution for a four-spar system with 90 degrees.
Lastly, the four-spar system with shared lines at 30 degrees about the x-axis is tested. The surge and pitch motion are shown in
and illustrated in
. Because of the single upstream line, the first wind turbine behaves like the wind turbine 1 from the staggered system with only one upstream turbine (
). Wind turbines 2 and 3 show matching surge and pitch, since they are symmetric to the environmental loads. The downstream turbine shows a higher motion in both degrees of freedom since low restoring forces come from the anchor lines because they are oriented opposite to the dynamic load’s direction. The summarised system tensions are detailed in
, and the maximum column is represented in
. The upstream elements apply most of the restoring force in the system, presenting the highest values of maximum tension. Moreover, the shared lines show a better tension distribution with lower tension at the fairlead in comparison to the system with perpendicular shared moorings.
.
Surge and pitch motions for a four-spar system with 30 degrees.
| Motion |
Turbine |
Mean |
Max |
Min |
Std |
|
WT1 |
32.43 |
35.16 |
29.69 |
0.797 |
| Surge [m] |
WT2 |
56.09 |
58.64 |
53.08 |
0.811 |
| WT3 |
55.51 |
58.61 |
52.74 |
0.859 |
|
WT4 |
67.91 |
70.41 |
64.81 |
0.891 |
|
WT1 |
4.37 |
5.62 |
2.86 |
0.405 |
| Pitch [deg] |
WT2 |
4.81 |
6.23 |
3.38 |
0.440 |
| WT3 |
4.81 |
6.23 |
3.31 |
0.450 |
|
WT4 |
4.97 |
6.57 |
3.42 |
0.456 |
.
Dynamic tension for a four-spar system with 90 degrees.
| Location |
Point |
Mean [kN] |
Max [kN] |
Min [kN] |
Std [kN] |
| Fairlead |
Upstream (WT1) |
4226.00 |
5048.10 |
3386.50 |
309.27 |
| Shared WT1-WT2 |
1682.10 |
1969.90 |
1447.20 |
76.69 |
| Middle (WT2/WT3) |
1279.50 |
1621.00 |
969.40 |
100.20 |
| Shared WT2-WT4 |
640.75 |
867.74 |
404.07 |
66.46 |
| Downstream (WT4) |
311.64 |
348.43 |
276.17 |
7.97 |
| Anchor |
Upstream (WT1) |
4054.60 |
4883.70 |
3205.30 |
311.08 |
| Middle (WT2/WT3) |
1105.30 |
1482.70 |
765.58 |
106.05 |
| Downstream (WT4) |
137.86 |
179.25 |
95.25 |
10.62 |
. A four-spar system with 30 degrees: (<b>a</b>) Surge motion; (<b>b</b>) Pitch motion.
. Maximum tension distribution for a four-spar system with 90 degrees.
5. Conclusions
This study focuses on the dynamic analysis of offshore wind farms using shared lines. Different mooring layouts are modelled with SIMA, and their static results are verified using the MoorPy code. The main conclusions obtained from the dynamic response are as follows
-
-
For the tandem arrangement, the motion values for the system with six anchors are more stable since the middle anchor lines apply a restoring force to the second wind turbine. In addition, these elements can likely prevent large sway motions in environmental loads that are not aligned with the x-axis. When analysing the mean tensions, there is a better distribution along the system, with less concentrated values on the upstream elements.
-
-
On the staggered model, it is noticeable that the system presenting two upstream turbines has a lower value of maximum tension compared to the system with only one upstream turbine. Nevertheless, the tensions applied to the polyester material are lower for the second system, which may allow a smaller mooring diameter, contributing to savings on the material cost. In relation to the platform motions, the layout with two upstream turbines shows a similar surge displacement for all floaters, with matching amplitude. For the layout with two downstream turbines, the upstream floater showed a smaller value of motion in both surge and pitch degrees of freedom.
-
-
The four-spar systems showed a similar behaviour to the staggered layout. The system with perpendicular shared lines showed closer surge and pitch motion values for all buoys. Meanwhile, the system with 30 degrees showed a first turbine with more stable results due to the restoring upstream anchor line and a less stable motion for the fourth turbine. When the layout uses a single upstream anchor, the system concentrates tension on this line, reducing tension on the shared lines.
-
-
Overall, the staggered layout with two upstream wind turbines and the four-spar system with 90 degrees are the most realistic layouts for wind farm shared subsystems. These models show a more uniform platform’s motion response and lower values of maximum tension along the system.
Acknowledgements
This work was performed within the scope of the Strategic Research Plan of the Centre for Marine Technology and Ocean Engineering (CENTEC), which is financed by the Portuguese Foundation for Science and Technology (Fundação para a Ciência e Tecnologia—FCT) under contract UIDB/UIDP/00134/2020.
Author Contributions
Conceptualization, S.W. and C.G.S.; Methodology, M.V.B., F.J.V., J.D., S.W. and C.G.S.; Software, M.V.B., F.J.V., J.D., S.W. and C.G.S.; Validation, M.V.B., F.J.V., J.D. and S.W.; Formal Analysis, M.V.B., F.J.V. and J.D.; Investigation, M.V.B., F.J.V., J.D.; Resources, S.W. and C.G.S.; Data Curation, M.V.B., F.J.V., J.D., S.W. and C.G.S.; Writing—Original Draft Preparation, M.V.B., F.J.V., J.D. and S.W.; Writing—Review & Editing, M.V.B., F.J.V., J.D., S.W. and C.G.S.; Visualization, M.V.B., F.J.V. and J.D.; Supervision, S.W. and C.G.S.; Project Administration, C.G.S.; Funding Acquisition, C.G.S.
Ethics Statement
Not applicable.
Informed Consent Statement
Not applicable.
Data Availability Statement
Access to the data examined in this study can be obtained by contacting the corresponding author.
Funding
This research received no external funding.
Declaration of Competing Interest
The authors declare that they have no known competing financial interests or personal relationships that could have appeared to influence the work reported in this paper.
References
-
1.
Esteban MD, Diez JJ, López JS, Negro V. Why offshore wind energy?
Renew Energy 2011,
36, 444–450.
[Google Scholar]
-
2.
Diaz HM, Guedes Soares C. Review of the current status, technology and future trends of offshore wind farms.
Ocean Eng. 2020,
209, 107381.
[Google Scholar]
-
3.
Anaya-Lara O, Tande JO, Uhlen K, Merz K. Offshore Wind Energy Technology; John Wiley & Sons: Hoboken, NJ, USA, 2018; pp. 1–320.
-
4.
Li J, Yu XB. Onshore and offshore wind energy potential assessment near Lake Erie shoreline: A spatial and temporal analysis.
Energy 2018,
147, 1092–1107.
[Google Scholar]
-
5.
Diaz HM, Guedes Soares C. Cost and financial evaluation model for the design of floating offshore wind farms.
Ocean Eng. 2023,
287, 115841.
[Google Scholar]
-
6.
Kang JC, Guedes Soares C. An opportunistic maintenance policy for the offshore wind farms.
Ocean Eng. 2020,
216, 108075.
[Google Scholar]
-
7.
Guedes Soares C, Bento AR, Goncalves M, Silva D, Martinho P. Numerical evaluation of the wave energy resource along the Atlantic European coast.
Comput. Geosci. 2014,
71, 37–49.
[Google Scholar]
-
8.
Diaz HM, Serna J, Nieto J, Guedes Soares C. Market needs, opportunities and barriers for the floating wind industry.
J. Mar. Sci. Eng. 2022,
10, 934.
[Google Scholar]
-
9.
Montes A, Fournely D, Sørensen JN, Larsen GC. Techno-Economic Modeling of Floating Wind Farms.
Energies 2025,
18, 967. doi:10.3390/en18040967.
[Google Scholar]
-
10.
Chen J, Hu Z, Liu G, Wan D. Coupled aero-hydro-servo-elastic methods for floating wind turbines.
Renew Energy 2019,
130, 139–153.
[Google Scholar]
-
11.
Ramos-García N, Sessarego M, Horcas SG. Aero-hydro-servo-elastic coupling of a multi-body finite-element solver and a multi-fidelity vortex method.
Wind Energy 2021,
24, 481–501.
[Google Scholar]
-
12.
Dou S, Pegalajar-Jurado A, Wang S, Bredmose H, Stolpe M. Optimization of floating wind turbine support structures using frequency-domain analysis and analytical gradients.
J. Phys. Conf. Ser. 2020,
1618, 042028.
[Google Scholar]
-
13.
Ma KT, Luo Y, Kwan CTT, Wu Y. Mooring System Engineering for Offshore Structures; Gulf Professional Publishing: Houston, TX, USA, 2019; pp. 1–512.
-
14.
Zhang W, Calderon-Sanchez J, Duque D, Souto-Iglesias A. Computational fluid dynamics (CFD) applications in floating offshore wind turbine (FOWT) dynamics: A review.
Appl. Ocean Res. 2024,
150, 104075.
[Google Scholar]
-
15.
Otter A, Murphy J, Pakrashi V, Robertson A, Desmond C. A review of modelling techniques for floating offshore wind turbines.
Wind Energy 2022,
25, 831–857.
[Google Scholar]
-
16.
Thomsen JB, Bergua R, Jonkman J, Robertson A, Mendoza N, Brown C, et al. Modeling the TetraSpar floating offshore wind turbine foundation as a flexible structure in OrcaFlex and OpenFAST.
Energies 2021,
14, 7866.
[Google Scholar]
-
17.
Chen H, Hall M. CFD simulation of floating body motion with mooring dynamics: Coupling MoorDyn with OpenFOAM.
Appl. Ocean Res. 2022,
124, 103210.
[Google Scholar]
-
18.
Robertson AN, Wendt F, Jonkman JM, Popko W, Dagher H, Gueydon S, et al. OC5 Project Phase II: Validation of global loads of the DeepCwind floating semisubmersible wind turbine.
Energy Procedia. 2017,
137, 38–57.
[Google Scholar]
-
19.
Uzunoglu E, Guedes Soares C. On the model uncertainty of wave induced platform motions and mooring loads of a semisubmersible based wind turbine.
Ocean Eng. 2018,
148, 277–285.
[Google Scholar]
-
20.
Duan F, Hu Z, Niedzwecki JM. Model test investigation of a spar floating wind turbine.
Mar. Struct. 2016,
49, 76–96.
[Google Scholar]
-
21.
Ahn HJ, Shin H. Model test and numerical simulation of OC3 spar type floating offshore wind turbine.
Int. J. Nav. Archit. Ocean Eng. 2019,
11, 1–10.
[Google Scholar]
-
22.
Xu X, Day S. Experimental investigation on dynamic responses of a spar-type offshore floating wind turbine and its mooring system behaviour.
Ocean Eng. 2021,
236, 109488.
[Google Scholar]
-
23.
Hsu WT, Thiagarajan KP, Manuel L. Extreme mooring tensions due to snap loads on a floating offshore wind turbine system.
Mar. Struct. 2017,
55, 182–199.
[Google Scholar]
-
24.
Kvitrud A. Lessons learned from Norwegian anchor line failures 2010–2013. In Proceedings of the 33rd International Conference on Ocean, Offshore and Arctic Engineering, San Francisco, CA, USA, 8–13 June 2014.
-
25.
Xu S, Wang S, Guedes Soares C. Review of mooring design for floating wave energy converters.
Renew. Sustain. Energy Rev. 2019,
111, 595–621.
[Google Scholar]
-
26.
Xu S, Wang S, Guedes Soares C. Experimental study of the influence of the rope material on mooring fatigue damage and point absorber response.
Ocean Eng. 2021,
232, 108667.
[Google Scholar]
-
27.
Lin TH, Yang RY. Stability analysis and environmental influence evaluation on a hybrid mooring system for a floating offshore wind turbine.
J. Mar. Sci. Eng. 2023,
11, 2236.
[Google Scholar]
-
28.
Lian Y, Zhong F, Zheng J, Chen W, Ma G, Wang S, et al. Effects of mooring line with different materials on the dynamic response of offshore floating wind turbine.
J. Mar. Sci. Eng. 2023,
11, 2302.
[Google Scholar]
-
29.
Xu S, Wang S, Liu H, Zhang Y, Li L, Guedes Soares C. Experimental evaluation of the dynamic stiffness of synthetic fibre mooring ropes.
Appl. Ocean Res. 2021,
112, 102709.
[Google Scholar]
-
30.
Lian Y, Liu H, Zhang Y, Li L. An experimental investigation on fatigue behaviors of HMPE ropes.
Ocean Eng. 2017,
139, 237–249.
[Google Scholar]
-
31.
Feng L, Wang Q, Wang S, Xu S. Experimental characterization of stiffness of a polyester mooring rope for a CFPSO.
J. Mar. Sci. Eng. 2024,
12, 1435.
[Google Scholar]
-
32.
Pham HD, Cartraud P, Schoefs F, Soulard T, Berhault C. Dynamic modelling of nylon mooring lines for a floating wind turbine.
Appl. Ocean Res. 2019,
87, 1–8.
[Google Scholar]
-
33.
Depalo F, Wang S, Xu S, Soares CG, Yang SH, Ringsberg JW. Effects of dynamic axial stiffness of elastic moorings for a wave energy converter.
Ocean Eng. 2022,
251, 111132.
[Google Scholar]
-
34.
Liang G, Jiang Z, Merz K. Dynamic analysis of a dual-spar floating offshore wind farm with shared moorings in extreme environmental conditions.
Mar. Struct. 2023,
90, 103441.
[Google Scholar]
-
35.
Goldschmidt M, Muskulus M. Coupled mooring systems for floating wind farms.
Energy Procedia 2015,
80, 255–262.
[Google Scholar]
-
36.
Lopez-Olocco T, Liang G, Medina-Manuel A, Ynocente LS, Jiang Z, Souto-Iglesias A. Experimental comparison of a dual-spar floating wind farm with shared mooring against a single floating wind turbine under wave conditions.
Eng. Struct. 2023,
292, 116475.
[Google Scholar]
-
37.
Hall M, Lozon E, Housner S, Sirnivas S. Design and analysis of a ten-turbine floating wind farm with shared mooring lines.
J. Phys. Conf. Ser. 2022,
2362, 012016.
[Google Scholar]
-
38.
Falkenberg E, Ahjem V, Yang L. Best practice for analysis of polyester rope mooring systems. In Proceedings of the Offshore Technology Conference; OTC: Houston, TX, USA, 2017; p. D031S034R006. doi:10.4043/27761-MS.
-
39.
SINTEF Ocean. SIMA 4.8.0 Documentation; SINTEF Ocean: Trondheim, Norway, 2024.
-
40.
Vidal FJ, Wang S, Guedes Soares C. Dynamic modelling of synthetic moorings for a wave energy converter. In Innovations in Renewable Energies Offshore; CRC Press: Boca Raton, FL, USA, 2024; pp. 437–445. doi:10.1201/9781003558859-48.
-
41.
Guedes Soares C. Representation of double-peaked sea wave spectra.
Ocean Eng. 1984,
11, 185–207.
[Google Scholar]
-
42.
Jonkman J. Definition of the Floating System for Phase IV of OC3. NREL/TP-500-47535; National Renewable Energy Lab (NREL): Golden, CO, USA, 2010.
-
43.
Jonkman J, Butterfield S, Musial W, Scott G. Definition of a 5-MW Reference Wind Turbine for Offshore System Development. NREL/TP-500-38060; National Renewable Energy Lab (NREL): Golden, CO, USA, 2009.
-
44.
Fu C, Zhang Z, Yu M, Zhou D, Zhu H, Duan L, et al. Research on Aerodynamic Characteristics of Three Offshore Wind Turbines Based on Large Eddy Simulation and Actuator Line Model.
J. Mar. Sci. Eng. 2024,
12, 1341.
[Google Scholar]
-
45.
Cottura L, Caradonna R, Novo R, Ghigo A, Bracco G, Mattiazzo G. Effect of pitching motion on production in a OFWT.
J. Ocean Eng. Mar Energy 2022,
8, 319–330.
[Google Scholar]
-
46.
Bridon. Fibre Rope Catalogue. Available online: https://www.yumpu.com/en/document/read/33598438/fibre-rope-catalogue-bridon (accessed on 21 March 2025).
-
47.
Biroli MV, Wang S, Guedes Soares C. Dynamic analysis comparison of shared mooring system for offshore wind turbine platforms. In Innovations in Renewable Energies Offshore; CRC Press: Boca Raton, FL, USA, 2024; pp. 369–378. doi:10.1201/9781003558859-41.
-
48.
Balakrishnan K, Arwade SR, DeGroot DJ, Fontana C, Landon M, Aubeny CP. Comparison of multiline anchors for offshore wind turbines with spar and with semisubmersible.
In. J. Phys. Conf. Ser. 2020,
1452, 012032.
[Google Scholar]
-
49.
Hall M, Housner S, Sirnivas S, Wilson S. MoorPy (Quasi-Static Mooring Analysis in Python); USDOE Office of Energy Efficiency and Renewable Energy: Washington, DC, USA, 2021. doi:10.11578/dc.20210726.1.