1. Introduction
Since the late 1960s, Brazil has advanced remote sensing capabilities through the National Institute for Space Research (INPE), establishing infrastructure and training professionals to apply these techniques effectively [
1]. Remote sensing enables non-contact data collection from the Earth’s surface by capturing reflected or emitted electromagnetic energy, which is transformed into actionable information about the target area. Applications include environmental monitoring, agriculture, and urban planning, among others.
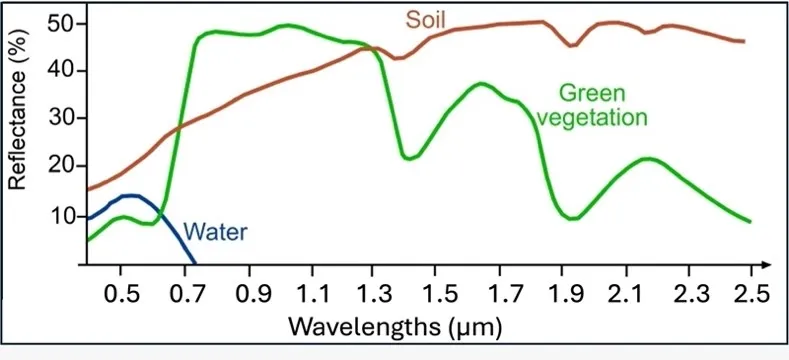
Remote sensors, mounted on platforms such as aircraft, unmanned aerial vehicles (UAVs), or satellites, convert electromagnetic energy into signals that reveal insights about the study site. When electromagnetic energy interacts with surfaces, it may be reflected, absorbed, or transmitted, depending on the surface’s physical and chemical properties, the wavelength of the incident radiation, and the angle of incidence. These interactions produce unique spectral signatures for different materials (e.g., vegetation, soil, water), enabling their identification in multispectral imagery, as shown in .
. Spectral signatures of vegetation, soil and water [
2].
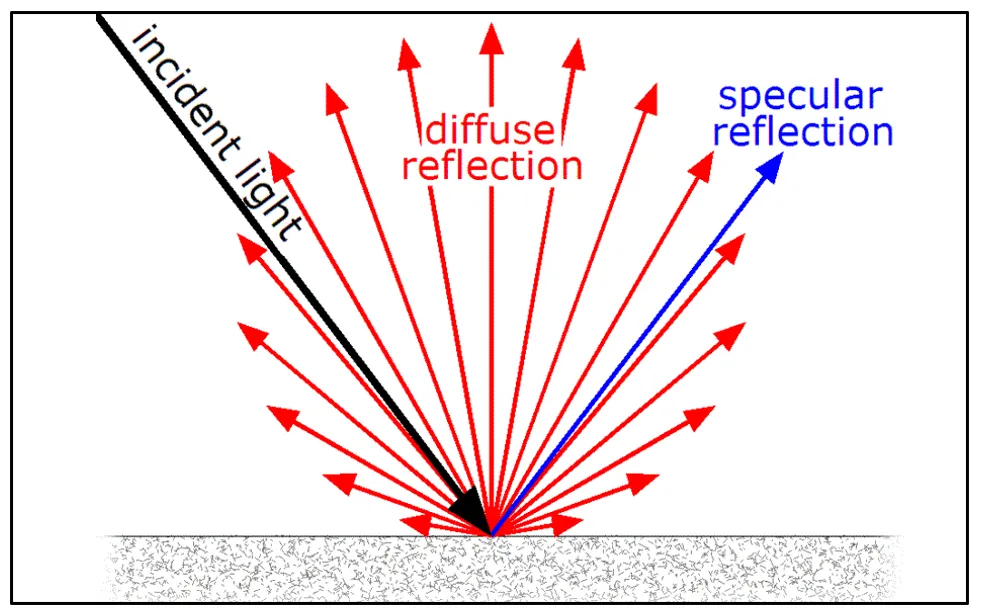
Therefore, accurate interpretation of multispectral images requires precise calibration of the cameras to ensure reliable data. Calibration involves using a Lambertian surface—A surface with ideal diffuse reflectance that exhibits uniform radiance regardless of viewing angle ().
. Radiation intensity measured as a function of the viewing angle [
3].
According to [
4], typically, an integrating sphere coated with highly reflective materials like magnesium oxide, barium sulfate (BaSO
4), or polytetrafluoroethylene (PTFE) is used to measure diffuse reflectance. Spectralon, a fluoropolymer with near-perfect diffuse reflectance (99%) and exceptional whiteness, is the standard material for such calibrations [
5] but is costly.
As UAVs expand in popularity and application, the need for affordable and effective calibration methods grows. Multispectral camera calibration enhances image quality, reduces processing time, and improves integration with systems like Global Navigation Satellite Systems (GNSS), leading to greater efficiency and lower operational costs [
6]. Recent comprehensive studies have also emphasized the critical role of radiometric calibration in ensuring data reliability for UAV-based remote sensing applications. For instance, ref. [
7] provide practical guidance for environmental mapping using UAS, highlighting the fundamental importance of calibration surfaces to achieve consistent and trustworthy reflectance data under varying field conditions. However, existing calibration systems are often expensive or inaccessible, limiting their adoption.
Therefore, this study is of particular importance, given that the calibration of cameras on board drones is currently expensive or does not yet have an adequate system with affordable prices to ensure the best image acquisition, which would allow for accurate data on the object and/or phenomenon under study.
The main objective was to develop a low-cost Lambertian surface using BaSO
4 for calibrating UAV-mounted multispectral cameras and validate its performance against a Spectralon plate, the industry standard for calibrating such cameras.
2. Materials and Methods
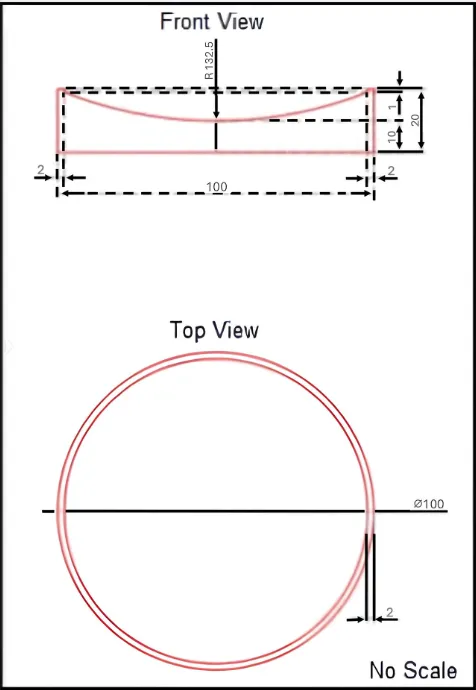
First, a stainless steel part was developed, a material resistant to oxidation, for compacting BaSO
4, a low-cost chemical material, white in color and not harmful to health, which can be handled without the use of personal protective equipment (PPE). The design of the part, front and top view, is shown in .
. Stainless steel part design—Millimeter units.
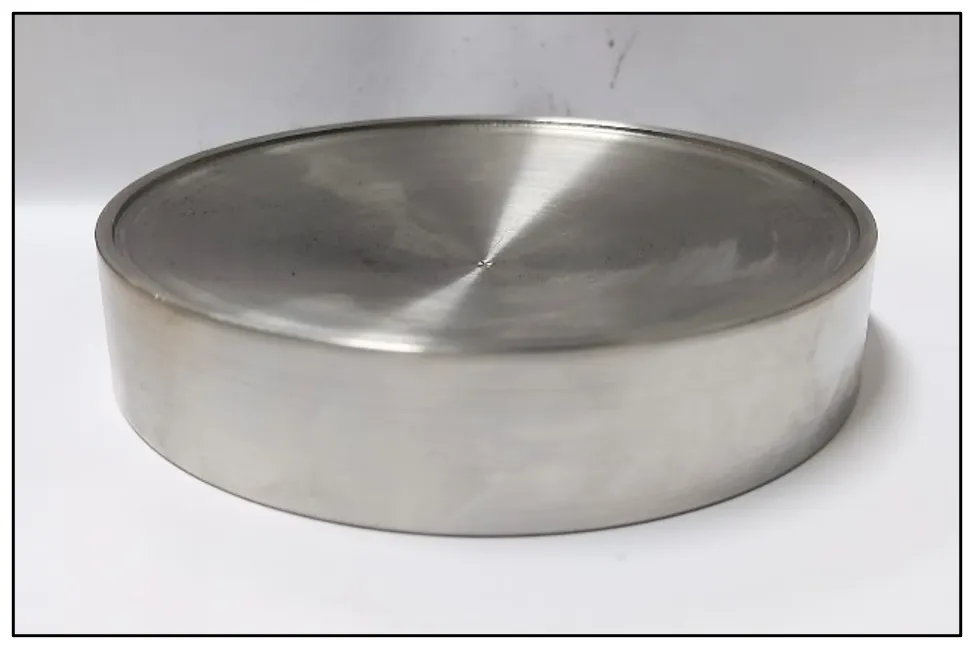
In , you can see the machined stainless steel part, according to the design and dimensions shown in .
. Machined stainless steel part.
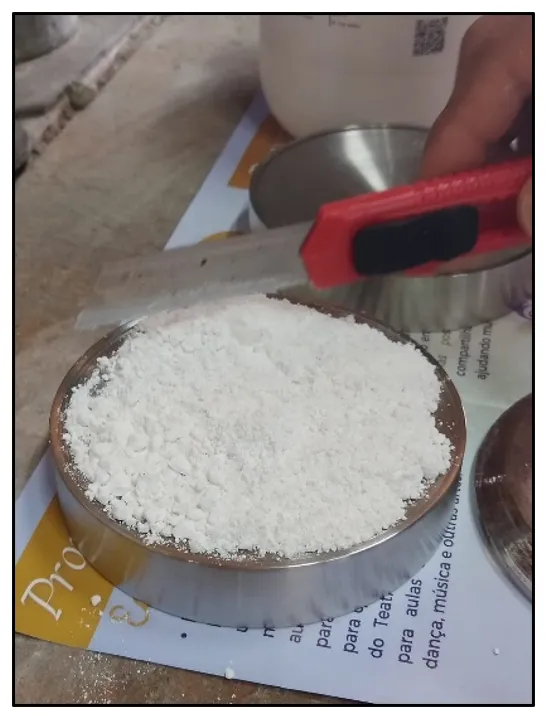
The part was then filled with BaSO
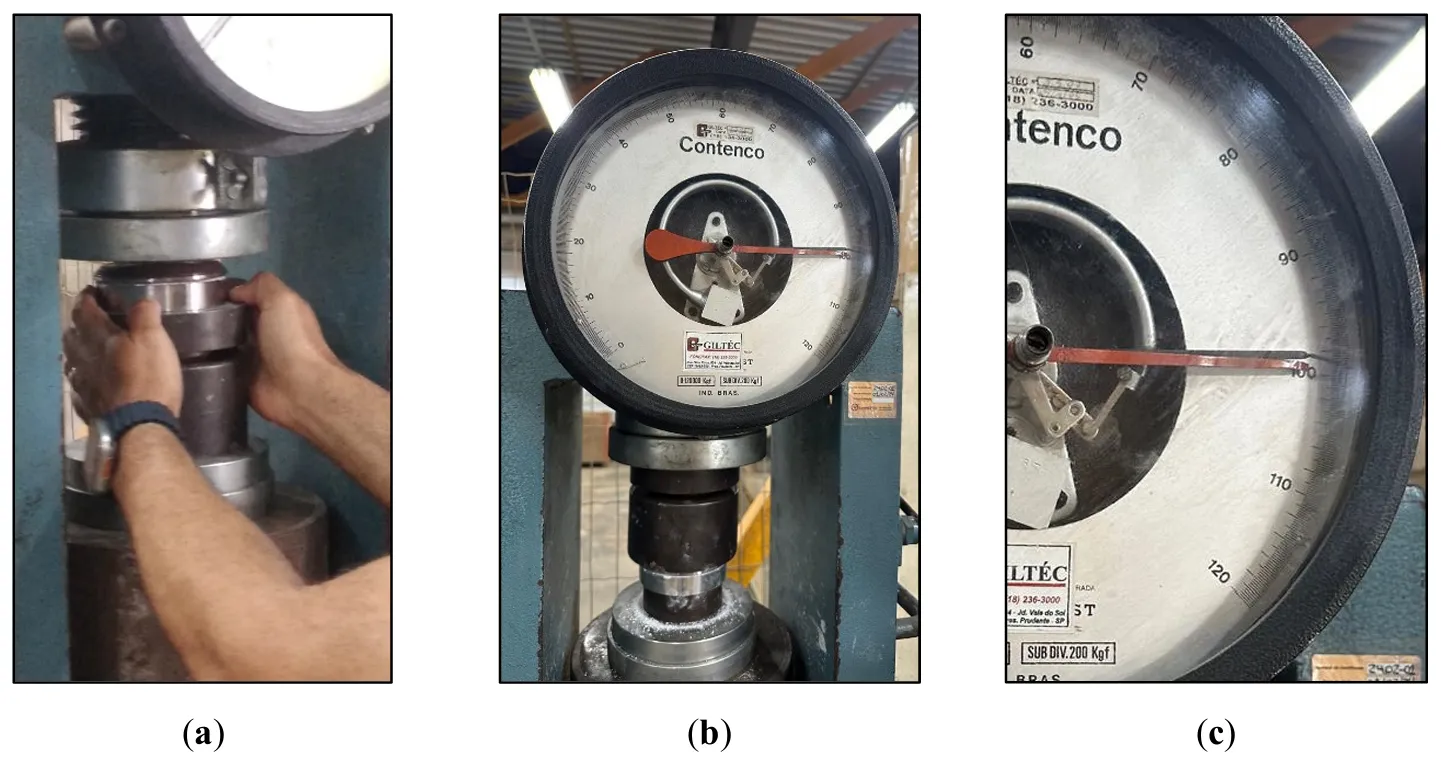
4 () up to the upper edge, later adjusted in the hydraulic-mechanical press (a)—Belonging to the Concrete Laboratory of the Federal Technological University of Paraná—Pato Branco Campus. After adjusting the stainless steel part in the press (b), a pressure of 100 tons-force (tf) was applied (c) for compaction, equivalent to 124,861.676 N/mm
2. The tests carried out proved that this was the pressure considered ideal since the compacted material did not present cracks or superficial fissures, which is important for the homogenization of the BaSO
4 in the stainless steel part.
. Stainless steel part filled with BaSO<sub>4</sub>.
. (<b>a</b>) Adjustment of the part in the hydraulic press. (<b>b</b>). Stainless steel part adjusted in the hydraulic press. (<b>c</b>) Pressure of 100 tf for compacting BaSO<sub>4</sub>.
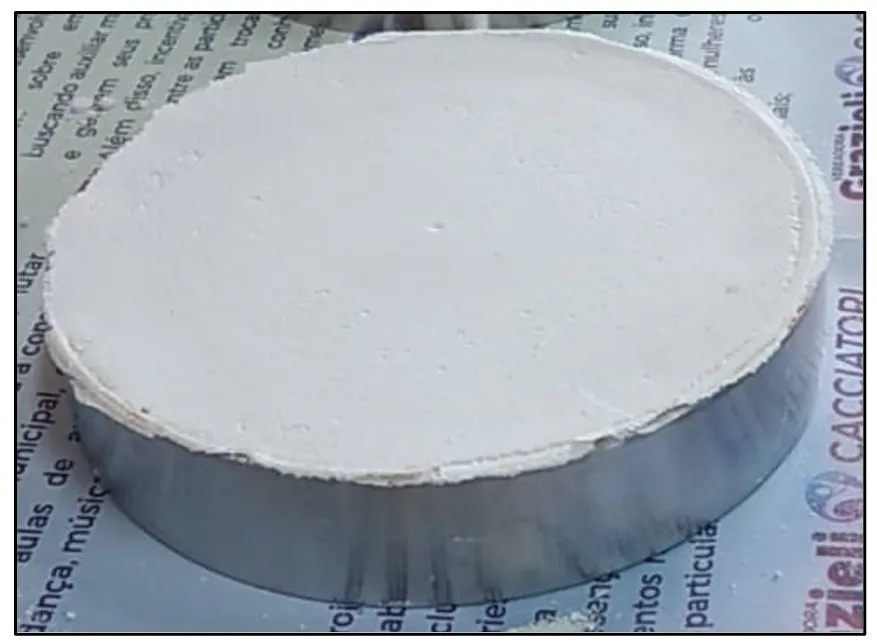
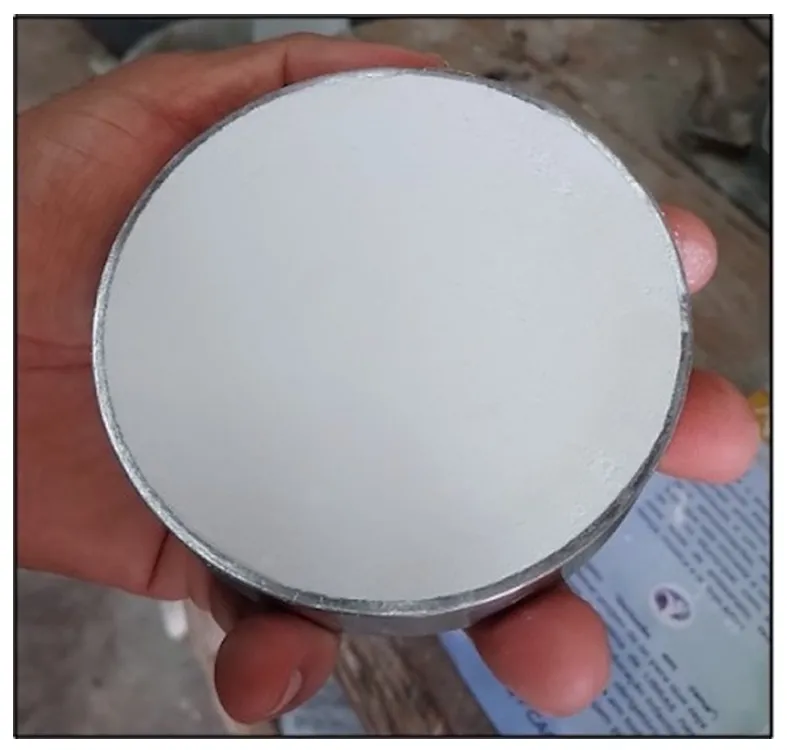
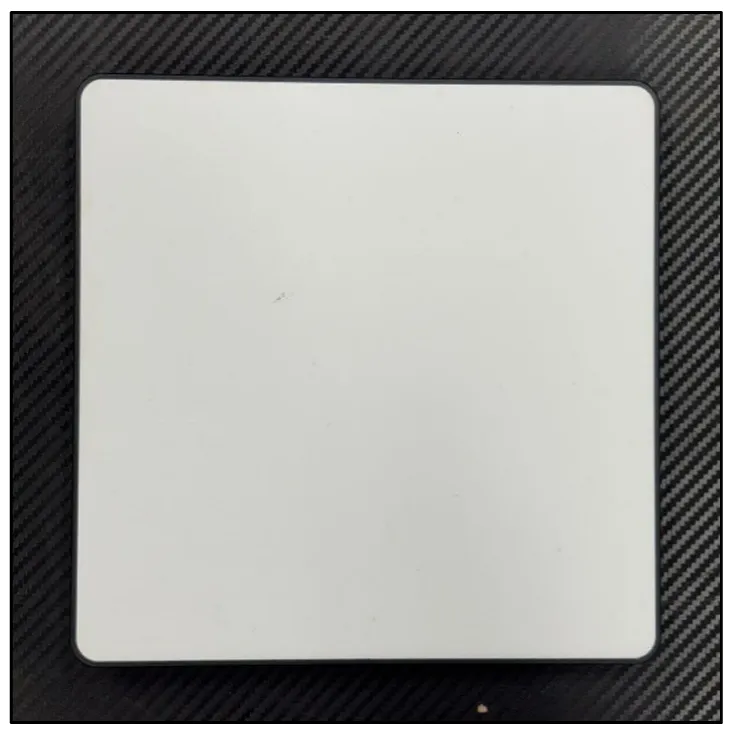
The surface of the compacted BaSO
4 presented irregularities due to the removal of the upper part of the part (). Sandpaper with grits 2000 and 3000 was used to remove these imperfections in order to obtain a homogeneous finish free from compression marks () in the hydraulic press, which could interfere with the final texture of the Lambertian surface.
. Irregularities on the surface of compacted BaSO<sub>4</sub>.
. Irregularities on the BaSO<sub>4</sub> surface removed with 2000 and 3000 grit water sandpaper.
The next step was the calibration of the compressed BaSO
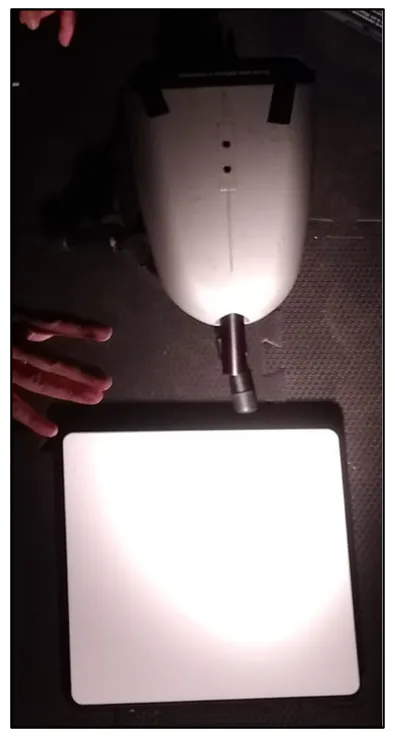
4, using the ASD FieldSpec HandHeld UV/NIR spectroradiometer and the Labsphere Spectralon plate (25 × 25) cm (), both belonging to the Sensor Integration Laboratory of the Department of Certography of the Universidade Estadual Paulista Júlio de Mesquita Filho (UNESP)—Presidente Prudente Campus, state of São Paulo, Brazil.
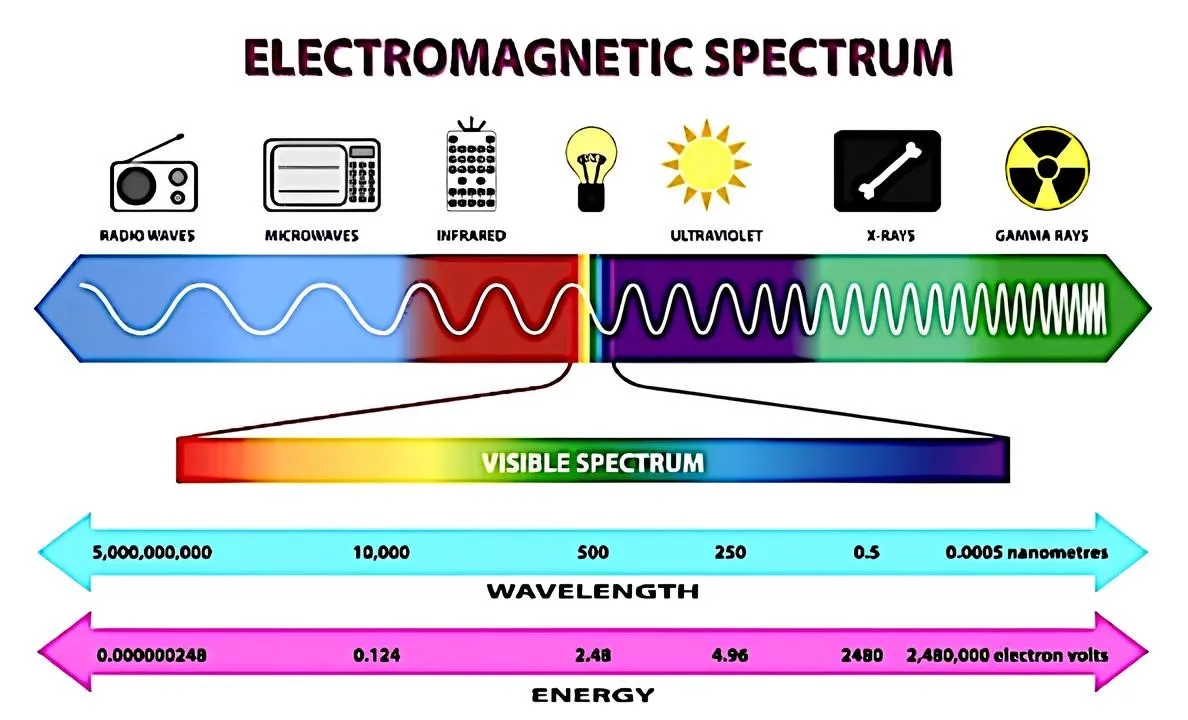
The calibration was performed in a dark room whose entire interior was painted matte black so that there would be no reflection of the light source in the environment nor interference from external light, with only one light source falling on the Spectralon plate (), which was maintained throughout the process with the same intensity and angle, in order to provide results under the same conditions for the objects used in the experiment. In addition, care was taken not to remain close to the equipment since reflective surfaces could interfere with the spectroradiometer reading process. This equipment provides results in the electromagnetic spectrum range () between wavelengths 325 to 1075 nm, that is, from ultraviolet to near infrared.
. Light source on the Spectralon plate.
. Electromagnetic spectrum [
9].
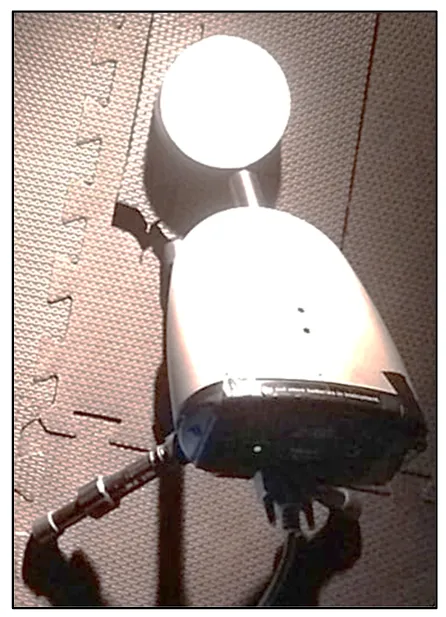
The spectroradiometer, with a 1º IFOV (Instantaneous Field of View) lens on the Spectralon plate and BaSO
4, was configured using the Malvern Panalytical RS3 software to perform 10 reading sessions, capturing the reflectance for each wavelength. First, the readings were performed on the Spectralon plate (), which was adopted as the standard for the other observations, and then on the BaSO
4 compressed in the stainless steel piece ().
. Spectroradiometer making observations on BaSO<sub>4</sub>.
After the observations were performed, the data obtained were transferred to the computer using the ASD Viewspec Pro software, version 6.2. The raw data were corrected using equations to calculate the elements needed to obtain the corrected reading values for the Spectralon plate and BaSO
4. For this step, the data were tabulated in a spreadsheet, and the averages between the 10 reading sessions for each wavelength were calculated. Next, the reflectance correction factors were calculated for each average between the Spectralon plate and BaSO
4 (Equation (1)), adapted from [
10]:
where:
Fc—correction factor;
M
S—average between Spectralon readings for each wavelength;
Mp—average between barium sulfate readings for each wavelength.
Therefore, to obtain the corrected readings of the observed electromagnetic spectrum (325 to 1075 nm) for BaSO
4, Equation (2) [
10] is adopted:
where:
C—corrected reading for the wavelengths obtained for BaSO
4.
To calculate the reflectance (R), Equation (3) is used.
where:
F
CMP—correction factor of the averages between the BaSO
4 readings.
3. Results and Discussions
Since the tabulated wavelengths are listed every 1 nm, it is impossible to reproduce the data in full since they total 752 lines of the spreadsheet. Therefore, a partial reproduction of these data is made every 50 nm. presents the means and respective standard deviations for the dimensionless reflectance factors of the Spectralon plate and BaSO
4, as a function of the wavelengths, in the range of 350 to 1050 nm.
.
Reflectance factors for wavelengths.
| Wavelength (nm) |
Averages of Reflectance Factors |
Standard Deviations * |
| Spectralon |
BaSO4 |
σS |
σB |
| 350 |
0.000010483 |
0.000005812 |
±0.001148534 |
±0.000862482 |
| 400 |
0.000066462 |
0.000036626 |
| 450 |
0.000185969 |
0.000107591 |
| 500 |
0.000396167 |
0.000242135 |
| 550 |
0.000693409 |
0.000440373 |
| 600 |
0.001047372 |
0.000692338 |
| 650 |
0.001402429 |
0.000953264 |
| 700 |
0.001761664 |
0.001229098 |
| 800 |
0.002357676 |
0.001707109 |
| 850 |
0.002543110 |
0.001867201 |
| 900 |
0.002807288 |
0.002088002 |
| 950 |
0.003055473 |
0.002301816 |
| 1000 |
0.003174858 |
0.002403606 |
| 1050 |
0.003232645 |
0.002510302 |
From the data in
, the graph shown in
was obtained.
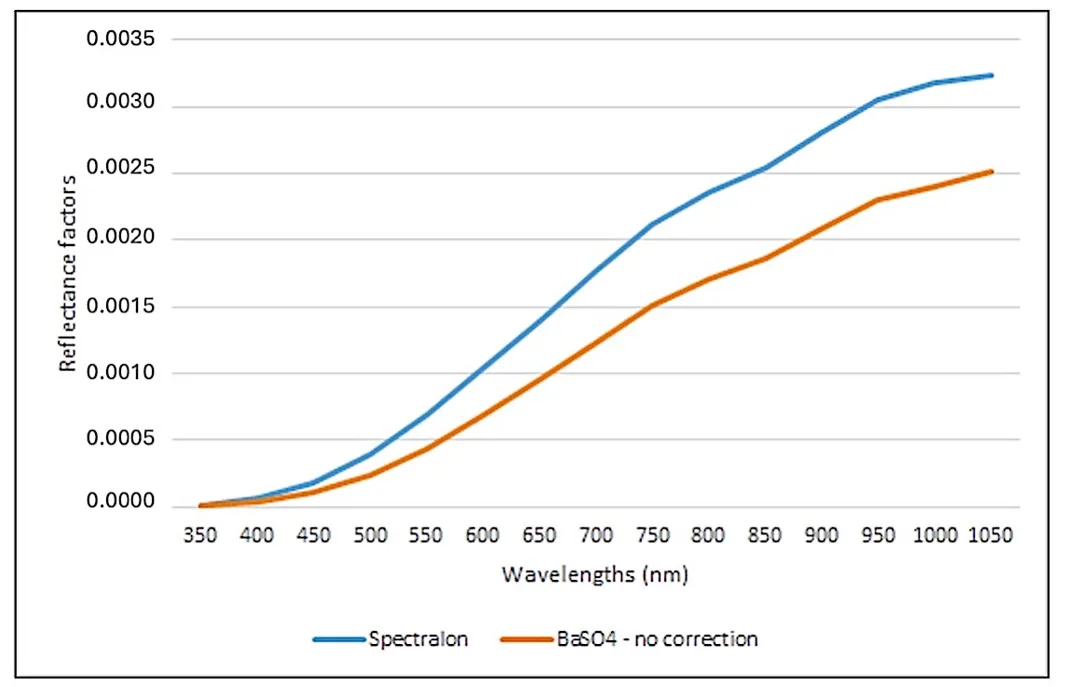
. Averages of the reflectance factors of Spectralon and BaSO<sub>4</sub> as a function of wavelengths.
Although the corrections for the reflectance factors have not yet been applied, shows a direct relationship between the Spectralon and BaSO
4 graphs, with a value of 0.9988 for Pearson’s correlation, i.e., a strong linear relationship, according to [
11]. It is also possible to infer from the data, reproduced in part in and observed in , that the maximum difference between these is 0.00071 and the minimum is −0.000004, which, due to its magnitude, ends up corroborating the correlation above.
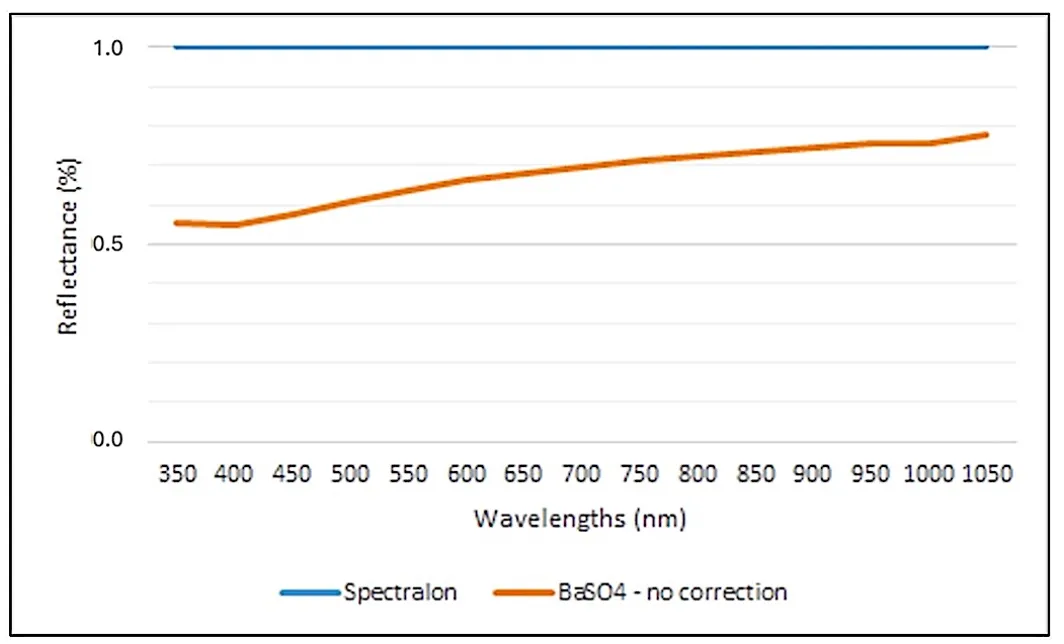
By applying Equation (3), it is possible to calculate the
R-value of BaSO
4, even without correction, in order to compare it with the R of the Spectralon plate, whose value is 1 ().
. Reflectance of Spectralon and BaSO<sub>4</sub> plate—Without correction—as a function of wavelengths.
Since the Spectralon plate is the standard for obtaining R, there is a correlation of 0.9620 between the reflectances of these two elements, that is, a strong linear relationship, according to [
11], which was expected, given that already demonstrated this trend.
Therefore, in order to have a perfect relationship between these elements, the corrections for the reflectance factors of BaSO
4 were calculated, given by Equations (1) and (2), presented in .
.
Corrections for the reflectance factors of BaSO4.
| Wavelength (nm) |
BaSO4 |
Correction Factors (FC) |
BaSO4 |
| (No Correction) |
(Corrected) |
| 350 |
0.000005812 |
1.803586628 |
0.000010483 |
| 400 |
0.000036626 |
1.814606393 |
0.000066462 |
| 450 |
0.000107591 |
1.728482347 |
0.000185969 |
| 500 |
0.000242135 |
1.636141962 |
0.000396167 |
| 550 |
0.000440373 |
1.57459658 |
0.000693409 |
| 600 |
0.000692338 |
1.512804132 |
0.001047372 |
| 650 |
0.000953264 |
1.471186638 |
0.001402429 |
| 700 |
0.001229098 |
1.433298616 |
0.001761664 |
| 800 |
0.001707109 |
1.40446804 |
0.002122530 |
| 850 |
0.001867201 |
1.381092323 |
0.002357676 |
| 900 |
0.002088002 |
1.361990888 |
0.002543110 |
| 950 |
0.002301816 |
1.344485405 |
0.002807288 |
| 1000 |
0.002403606 |
1.327418407 |
0.003055473 |
| 1050 |
0.002510302 |
0.002510302 |
0.003174858 |
Equation (1) provides the values for the CFs, while
Equation (2) allows the calculation of the corrected reflectance factors for BaSO
4. After that, these factors were compared with those of the Spectralon plate (
) in order to verify the possibility of BaSO
4 being adopted as a Lambertian surface.
.
Comparison between reflectance factors of Spectralon and BaSO4.
| Wavelength (nm) |
Spectralon |
BaSO4
(Corrected) |
Differences |
| 350 |
0.000010483 |
0.000010483 |
0.000000000 |
| 400 |
0.000066462 |
0.000066462 |
0.000000000 |
| 450 |
0.000185969 |
0.000185969 |
0.000000000 |
| 500 |
0.000396167 |
0.000396167 |
0.000000000 |
| 550 |
0.000693409 |
0.000693409 |
0.000000000 |
| 600 |
0.001047372 |
0.001047372 |
0.000000000 |
| 650 |
0.001402429 |
0.001402429 |
0.000000000 |
| 700 |
0.001761664 |
0.001761664 |
0.000000000 |
| 800 |
0.002122530 |
0.002122530 |
0.000000000 |
| 850 |
0.002357676 |
0.002357676 |
0.000000000 |
| 900 |
0.002543110 |
0.002543110 |
0.000000000 |
| 950 |
0.002807288 |
0.002807288 |
0.000000000 |
| 1000 |
0.003055473 |
0.003055473 |
0.000000000 |
| 1050 |
0.003174858 |
0.003174858 |
0.000000000 |
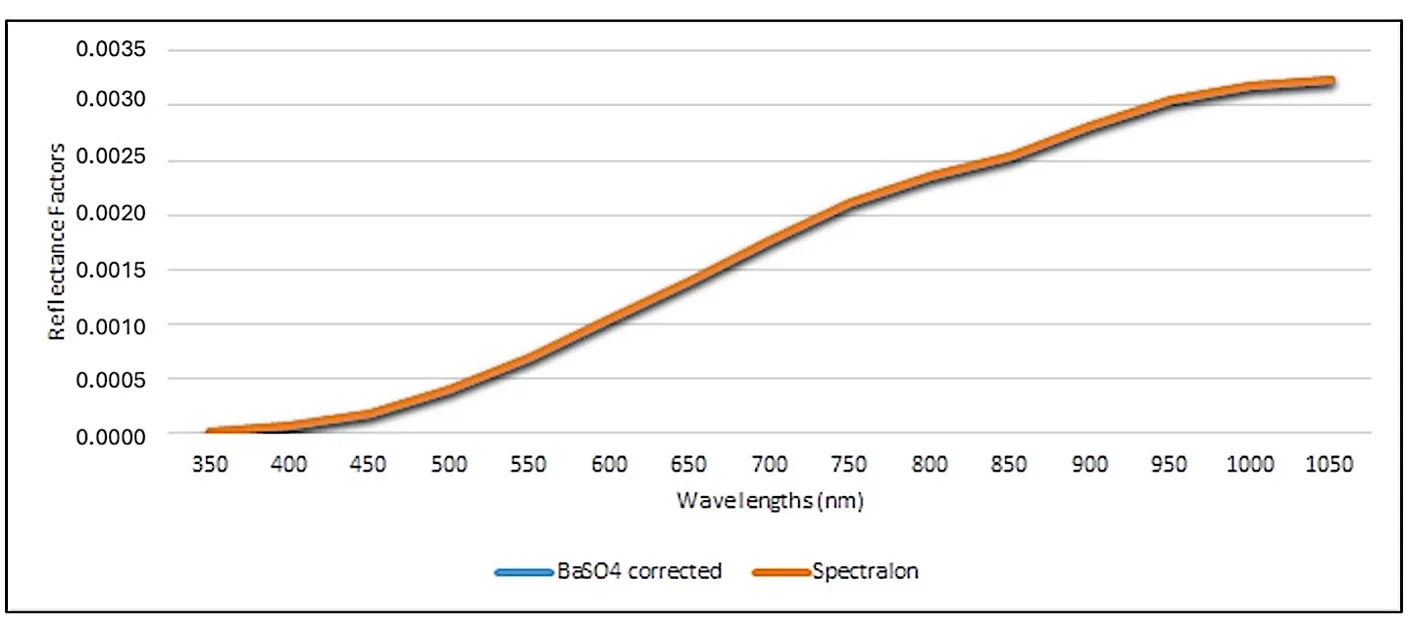
The differences observed in
indicate that BaSO
4 can be used as a Lambertian surface, as it presents results identical to the Spectralon plate, as shown in
.
. Reflectance factors of Spectralon and corrected BaSO<sub>4</sub>.
The overlap of the graphs of Spectralon and corrected BaSO
4 demonstrate the perfect agreement between their reflectance factors, corroborating what was stated in the previous paragraph.
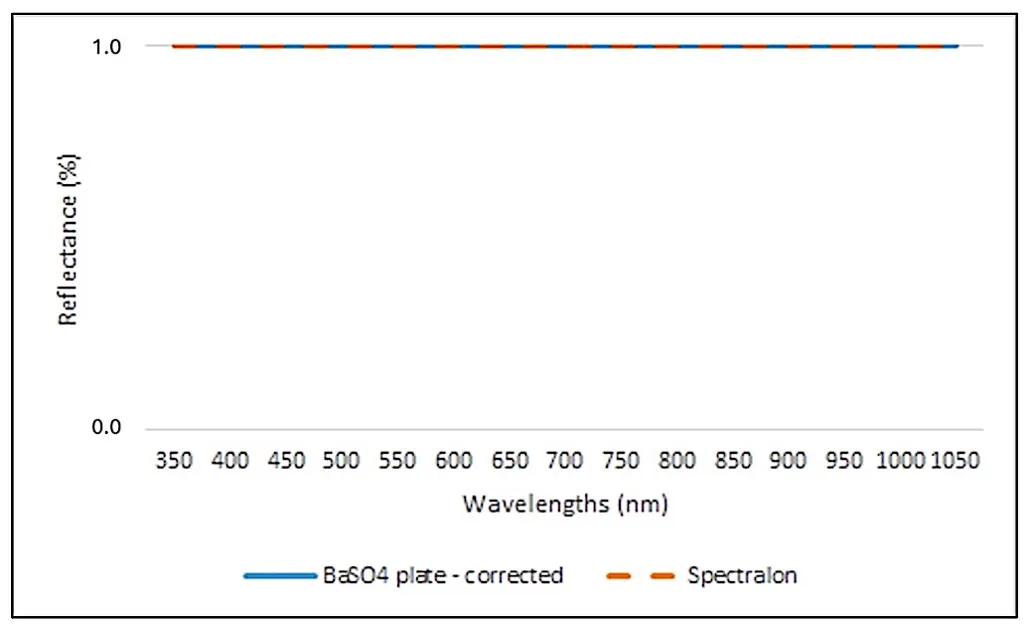
In turn, shows the graphs of the reflectances of Spectralon and BaSO
4, which, as previously stated, were expected to overlap with R equal to 1 since there is a strong linear correlation between them.
. Reflectance of the Spectralon and BaSO<sub>4</sub> plate—corrected—as a function of wavelengths.
4. Conclusions
The development and calibration of a low-cost Lambertian surface using barium sulfate (BaSO4) demonstrated performance comparable to the industry-standard Spectralon plate, with a Pearson’s correlation of 0.9988. This BaSO4-based surface offers an economically viable alternative for radiometric calibration of multispectral cameras mounted on unmanned aerial vehicles (UAVs), enabling high-quality image acquisition at reduced costs.
To further validate the BaSO4 surface, additional testing with diverse multispectral sensors under varied field conditions is recommended. Such studies will confirm its reliability across real-world applications and environmental settings, potentially broadening its adoption in remote sensing workflows.
Furthermore, the approach developed in this study can be adapted for the calibration of different types of optical sensors, including hyperspectral cameras and portable field spectrometers, provided that the spectral and geometric specifications of each device are considered. Likewise, its application under varying operational conditions—such as changes in natural lighting, ambient temperature, or relative humidity—should be evaluated in future investigations to validate the stability and robustness of the BaSO4 surface in realistic data acquisition scenarios.
Acknowledgements
To my colleague Gabriela Zanchetta, a PhD student in the Postgraduate Course in Cartographic Sciences at UNESP —Presidente Prudente, for her support and guidance in using the ASD FieldSpec HandHeld UV/NIR spectroradiometer and Spectralon plate. To Fábio Larini, owner of the company WD Tron, for his support in the project. To the Brazilian Center for UAVs for Aerolifting—NUBRAVA, for his support of the project.
Author Contributions
Conceptualization and Writing, D.C.G.; Methodology and Supervision, A.R.E.; Software, F.S.Y.W.; Review, H.d.S.F., E.L.P.
Ethics Statement
Not applicable.
Informed Consent Statement
Not applicable.
Data Availability Statement
The data supporting the findings of this study are available from upon reasonable request.
Funding
This research received no external funding.
Competing Interest Statement
The authors declare that they have no known competing financial interests or personal relationships that could have influenced the work reported in this article.
AI Usage Statement
During the preparation of this work, the authors used ChatGPT-4 to improve readability and language. After using this tool/service, the authors reviewed and edited the content as necessary and assume full responsibility for the content of the publication.
References
-
1.
NOVO EMLM. Introdução ao sensoriamento remoto. Divisão de Processamento de Imagens. Instituto Nacional de Pesquisas Espaciais. São José dos Campos, 2001. Available online: http://www.dpi.inpe.br/Miguel/AlunosPG/Jarvis/SR_DPI7.pdf (accessed on 18 May 2024).
-
2.
Campbell JB, Wynne RH. Introduction to Remote Sensing, 5th ed.; Guildford Press: New York, NY, USA, 2011.
-
3.
UFRGS—CENTRO DE REFERÊNCIA PARA O ENSINO DE FÍSICA. Confusão entre reflexão especular e difusa, 2021. Available online: https://cref.if.ufrgs.br/?contact-pergunta=confusao-entre-reflexao-especular-e-difusa (accessed on 15 April 2025).
-
4.
Souza MA, Silva EM, Gomes JFS, Guedes MB, Alvarenga AD. Implantação de um sistema de medição em reflectância espectral difusa. 7º Congresso Brasileiro de Metrologia. Ouro Preto, MG. 2013. Available online: file:///C:/Users/Daniel/Downloads/Metrologia2013_Muriel-EsferaIntegradora.pdf (accessed on 18 June 2024).
-
5.
LABSPHERE —Spectralon® diffuse reflectance standards—Unequalled Lambertian reflectance from 250–2500 nm. Available online: https://www.labsphere.com/product/Spectralon-diffuse-reflectance-standards (accessed on 5 March 2025).
-
6.
AERO—Quais são os 7 benefícios da calibração de câmeras em drones? 2023. Available online: https://aeroengenharia.com/glossario/quais-sao-os-7-beneficios-da-calibracao-de-cameras-em-drones/#:~:text=A%20calibra%C3%A7%C3%A3o%20das%20c%C3%A2meras%20dos%20drones%20tamb%C3%A9m%20contribui%20para%20aumentar,e%20a%20consist%C3%AAncia%20dos%20resultados (accessed on 18 June 2024).
-
7.
Tmušić G, Manfreda S, Aasen H, James MR, Gonçalves G, Ben-Dor E, et al. Current Practices in UAS-Based Environmental Monitoring.
Remote Sens. 2020,
12, 1001. Available online: https://doi.org/10.3390/rs12061001 (accessed on 6 June 2025).
[Google Scholar]
-
8.
UNESP. Placa de Spectralon. Laboratório de integração de sensores. Curso de pós-graduação em ciências cartográficas. Universidade Estadual Paulista Júlio de Mesquita Filho, Presidente Prudente, 2025.
-
9.
Franciolle M. O que é Espectro Eletromagnético? Gaia Ciência, 2022. Available online: https://gaiaciencia.com.br/o-que-e-espectro-eletromagnetico-espaco--fisica (accessed on 15 April 2025).
-
10.
Jensen JR. Sensoriamento remoto do ambiente: Uma perspectiva em recursos terrestres; Epiphanio JCN, Formaggio AR, Santos AR, Rudorff BFT, Almeida CM, Galvão LS, Translators; Parêntese: São José dos Campos, Brazil, 2009; p. 598.
-
11.
Rumsey DJ. What is r value correlation? Statistics for dummies. 2023. Available online: https://www.dummies.com/article/academics-the-arts/math/statistics/how-to-interpret-a-correlation-coefficient-r-169792 (accessed on 27 March 2025).

 Henrique dos Santos Felipetto
2
Henrique dos Santos Felipetto
2