1. Introduction
To improve the precision of an orthophoto mosaic, it is essential to integrate the most accurate geospatial data available. One effective method involves using Global Positioning System (GPS) technology to pinpoint precise x and y coordinates across the terrain. GPS is a worldwide navigation system that uses satellite signals to compute the position (x and y coordinates) of each location on the earth. Differential GPS (DGPS) is a method to correct the various inaccuracies in the GPS system [
1], and it involves two units: a stationary unit (
i.e., base station) and a rover unit [
2]. The base station is a long-term, very accurately surveyed point, and it measures the timing errors of the satellite signals [
2]. The base station provides the information on positional error corrections to the rover unit by transmitting it later (
i.e., post-processing, or Post-Processed Kinematic [PPK]) [
2,
3] or in real-time (Real-Time Kinematic [RTK] [
3].
One way of increasing the accuracy of orthophoto mosaics created from UAV images is obtaining accurate ground control points (GCPs) at the time of a UAV image collection in the field. GCPs are any location on the earth’s surface with known coordinates [
4] and are used to improve the locational accuracy of the remotely sensed images. Ground control points can be measured using a traditional board with a checkerboard pattern painted or GNSS-enabled GCPs [
5], such as AeroPoints 2 GCPs. AeroPoints 2 are GNSS-enabled smart ground control points that provide precise ground coordinates, making them suitable for use as GCPs or even as local base stations. Each AeroPoint 2 comes with a solar panel and plug-in charger, with GPS and Wi-Fi enclosed in a sealed shell that can be easily identified with high spatial resolution drone imagery due to its checkerboard black and white pattern. Using GCPs requires accurately surveying each GCP location and adding the GCP coordinates to the UAV image processing. Before each UAV image acquisition, the GCP boards (usually five GCPs) are laid out throughout the study area, and the geographic coordinates of the center of each GCP board are attained using a GPS receiver. Traditionally, the GCP coordinates attained from a GPS receiver are further post-processed using differential correction. In the case of using AeroPoints 2 GCPs, the coordinate readings from each AeroPoints 2 GCP can be uploaded to their correction network (through a subscription) for differential correction. Users can download the differential correction coordinates of each AeroPoints 2 GCP, eliminating the need to apply the differential correction manually.
Another method to increase the accuracy of orthophoto mosaics created from the UAV images is through the use of a Real-Time Kinematic (RTK) UAV. An RTK Un-manned Aircraft System (UAS) consists of an RTK-enabled UAV and an RTK base station. The base station continuously provides real-time positional error corrections to the UAV, enhancing its positional accuracy. This eliminates the need to lay down GGPs on the ground. When obtaining UAV images using an RTK UAV, ground control points (GCPs), whether they are traditional GCP boards or AeroPoints 2 GCPs, can also be used in combination with the RTK UAV to improve the accuracy of the orthophoto mosaic further.
This study’s overall objective was to test the accuracy of orthophoto mosaics derived with an RTK UAV versus an RTK UAV combined with AeroPoints 2 ground control points based on a known position that was professionally surveyed for its geographic coordinates. Specific objectives were: (1) to ascertain if the way base station coordinates are set for an RTK UAV (
i.e., manually assigned vs. self-determined) would affect positional accuracy; (2) to determine if different times of the day would affect positional accuracy while letting the GPS unit of a base station self-determine the coordinates of the base station; and, (3) to determine which cardinal direction (
i.e., North, East, South, or West) from a known central point would result in the most accurate positional accuracy when self-recording the location of each AeroPoints 2 locations.
2. Materials and Methods
2.1. Study Area
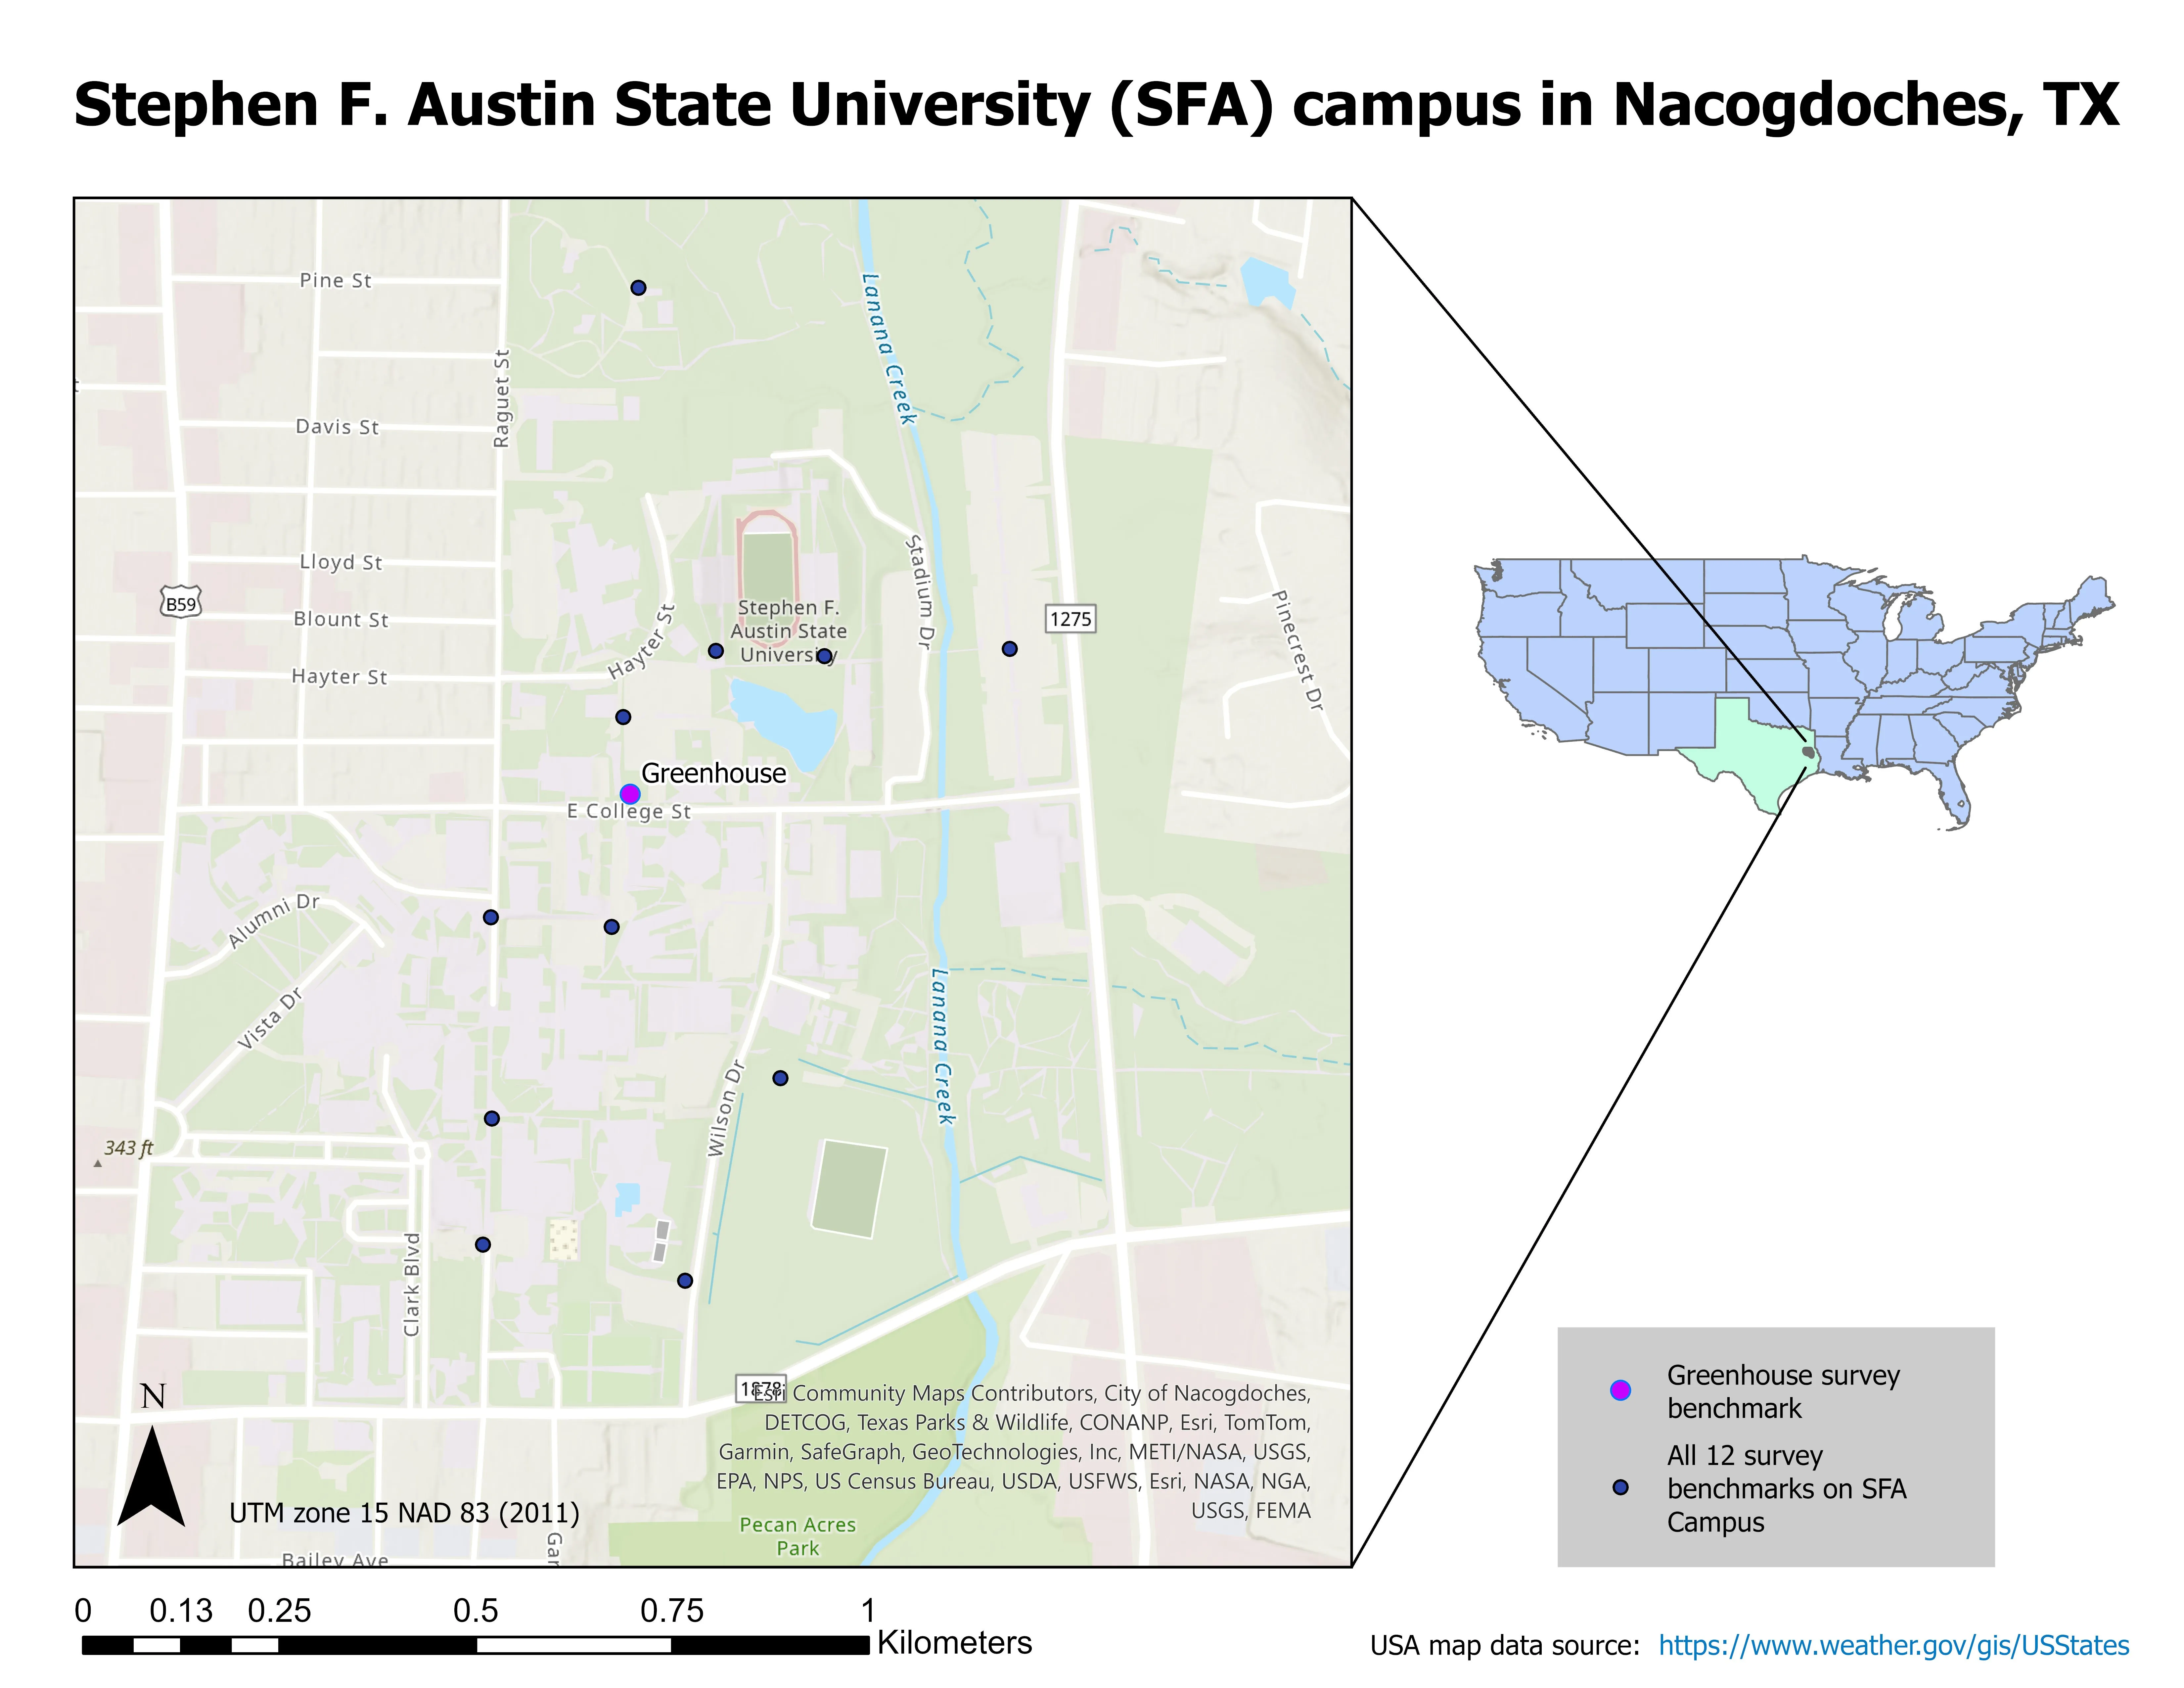
The study was conducted near the Arthur Temple College of Forestry and Agriculture (ATCOFA) building on the Stephen F. Austin State University (SFA) campus in Nacogdoches, Texas, USA. A known surveyed point (or the benchmark) served as the central location of the study. The surveyed point,
i.e., Greenhouse point, is located near the intersection of East College Street and Raguet Street, in between the Forestry building (ATCOFA) and Steen Hall, and the coordinates for the surveyed location are latitude: 31.6232174°, longitude: −094.6462075°. The study area is surrounded by loblolly pines (
Pinus taeda) and various oak trees, including Post Oak (
Quercus stellata), and the surface of most of the study area is covered with gravel and concrete.
shows a map of the study area.
2.2. Data Collection and Processing
2.2.1. Phase 1: Phantom 4 RTK
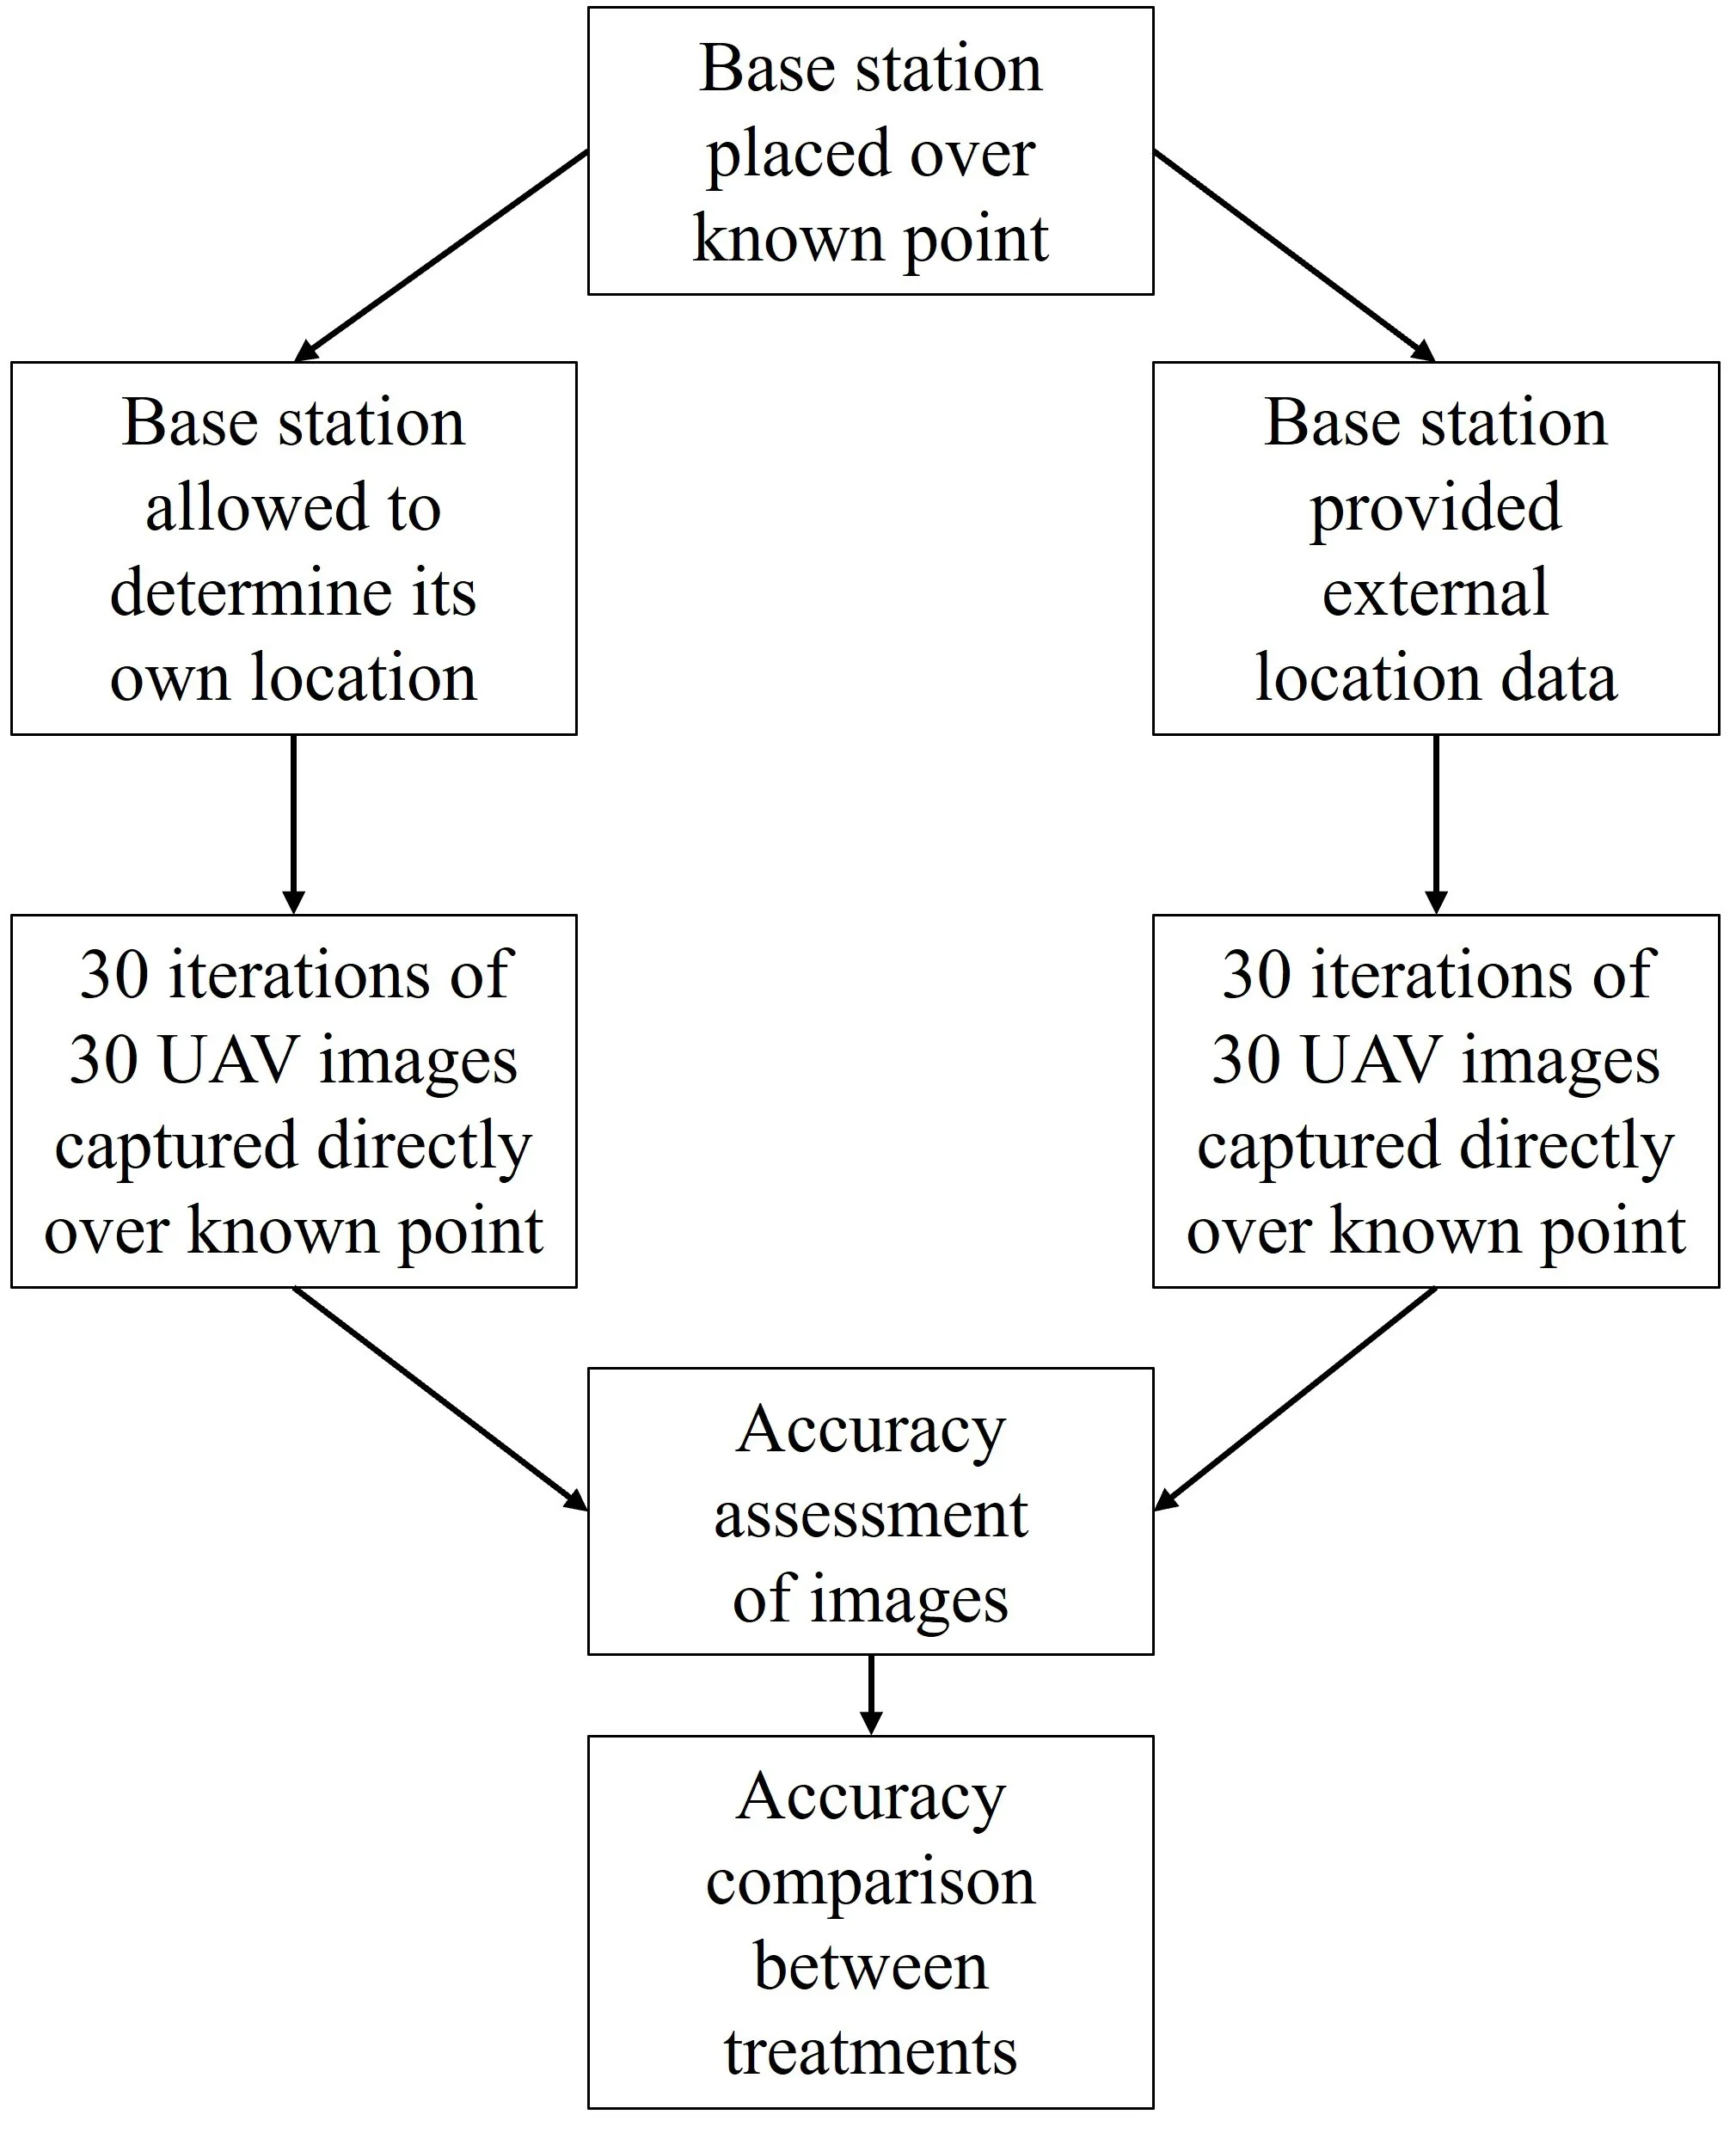
Phase 1’s goal was to assess the positional accuracy of the UAV images using two different ways of assigning the base station coordinates. We used a DJI Phantom 4 drone with a real-time kinetic (RTK) unit enabled for the first phase. As seen in
, phase 1 involved the following two ways of determining the coordinates of the base station: one with the user assigning the coordinates manually and the other by letting the base station GPS unit determine the coordinates. In the first method, we manually assigned the base location using the surveyed coordinates of the benchmark. We placed the base station of the RTK unit at the known surveyed point. Once the RTK system was activated, we waited for the base station to run until the reading position of the base station stopped changing for 10 min. The second way involved letting the base station’s GPS unit self-determine the base station’s coordinates while placed on the known survey point. We used the DJI GS Go application on the tablet to input the base station manually coordinates before each flight. The coordinates of the base station, self-determined by its GPS unit, were captured via a screenshot from the DJI GS Pro interface prior to each UAV launch. In each flight, the DJI Phantom 4 drone flew to the base station and hovered above to take an image aiming vertically down with the base station at the center of each frame. Then, the UAV was brought back to its launch point.
. The map of the study area. The purple circles indicate the location of the surveyed point or the benchmark used in the study. The study area is located on the north side of the Stephen F. Austin State University (SFA) campus. (All the campus benchmark information can be found on the following webpage: https://sfa.maps.arcgis.com/apps/instant/attachmentviewer/index.html?appid=d0ec7ceb0da9492ab788200bee887d4c, accessed on 11 October 2023).
For each of the two different assignment methods, to see the effect of the number of visible satellites and the Position of Dilution of Precision (PDOP) [
6,
7], the UAV was flown three different times of the day, at 9 a.m., 12 p.m., and 3 p.m. each day for ten days. For each of the three different periods, we flew the UAV directly over the base station, hovered over the base station, and took an image of the base station 30 times per each period. The groups of 30 images were all taken successively during a single hover rather than on 30 separate approaches. The flights throughout the 10-day phase 1 study period resulted in 30 iterations (3 times per day ∗ 10 days) of 30 UAV images, which created 900 images for each of the 2 cases. We attempted to account for sources of variation by collecting data over different days and at different times of the day.
In processing the UAV images, we did not post-process any of the base station coordinates determined by the base station GPS unit. The primary reason is that the DJI correction network was not established in North America [
8]. Therefore, we assumed that the coordinates of the base station determined by the DJI RTK unit were reliable and comparable to the post-processing result of a regular DJI UAV with combined use of the ground control points.
The first step in processing the UAV images was to create a point feature of the base station location obtained from each UAV image (
i.e., observed locations). Regardless of which coordinate assigning method was used, we read each set of 900 UAV images into ArcGIS Desktop 10.8.2 [
9] and extracted the X and Y coordinates of the center of the base station in each UAV image. To obtain the coordinates of the base station location, we used the “Geotagged Photos To Points” tool in ArcGIS. This first step resulted in 900 point features for Case 1 and another 900 point features for Case 2.
As a second data processing step, for each of the 30 images taken at each period (
i.e., 9 a.m., 12 p.m., or 3 p.m.), using the 30 pairs of X and Y coordinates for the center of the base station extracted from the 30 UAV images, the mean center location was calculated for each 30 pairs of X and Y coordinates, creating 1 data point for each group of 30 UAV images for each period, 9 a.m., 12 p.m., and 3 p.m. This mean center calculation step resulted in 30 data points for the entire 10-day phase 1 period (
i.e., 3 time periods ∗ 10 days = 30 data points).
For each of the 2 cases, the third step was to calculate the error distance and the root mean squared error between each mean center of the observed base station position and its known surveyed position for the actual base station location. This was conducted for each period for each day. Statistical Analysis System (SAS) software (version 9.4) [
10] was used for statistical analysis. Descriptive statistics of standard deviation, standard error, mean error, and Root Mean Squared Error (RMSE) of the error distances were calculated for assessing positional accuracy in the two cases (manually assigned vs. self-determined). Furthermore, we conducted an Analysis of Variance (ANOVA) on error distances with the 2 cases (manually assigned vs self-determined) as the factor. Although we did not perform a formal normalcy test for the data, the analyzed data was averaged and a relatively large data set. Due to this fact, we believe the data is normally distributed and does not violate any assumptions.
2.2.2. Phase 2: AeroPoints 2 Ground Control Points
The objective of the second phase was to evaluate the positional accuracy of the AeroPoints 2 ground control points (GCPs) relative to a known surveyed location. We used five AeroPoints 2 GCP units for this phase. We first placed the central AeroPoints 2 GCP directly over the same known, surveyed position. We also placed each of the four AeroPoints 2 GCPs 3.5 m (or 10 feet) away from the center point of the AeroPoints 2 GCP location (which was placed to the top of the known survey point) at each cardinal direction (90 degrees to each other). Once each of the five AeroPoints 2 GCPs was activated, we left it to record its coordinates for twenty minutes. Twenty minutes is beyond the manufacturer’s recommended record time (10 minutes without the known surveyed point and 2 minutes when having a known surveyed point) [
11]. We uploaded the position data we recorded for each of the 5 AeroPoints 2 GCPs for twenty minutes to the Propeller Correction Network to post-process the data (
i.e., the differential corrections).
We repeated the above process 30 times for each of the five AeroPoints 2 GCPs. We collected data randomly and assumed that any effects due to satellite positions and GNSS ephemeral data were not a significant source of variation. To ensure that each AeroPoints 2 GCP was placed at the exact same location, we spray-painted the boundary of each AeroPoints 2 location at our first data collection (1 out of 30 replications).
Once the post-processing of each of the 30-position data sets for the 5 AeroPoints 2 GCPs was complete, we imported all 150 data points (30 positions for each of the 5 GCPs) to ArcGIS Desktop 10.8.2 as point features. In converting the downloaded text file (from the Propeller Correction Network) containing all the x and y coordinates of 150 points, we imported the text file as a point shapefile.
We assessed the positional accuracy for each of the five 30-point-feature datasets. For the data from the central AeroPoints 2 GCP, the accuracy of the 30 positions was tested against the known coordinates of the survey nail position (the benchmark). For the rest of the four AeroPoints 2 GCPs (north, east, south, and west) that are located 3.5 m away from the survey nail in each of the four cardinal directions, the following two analyses were performed: (1) Post-processed coordinates from 30 replications of the four peripheral AeroPoints 2 GCPs were used to see if each AeroPoints 2 GCP can be used to determine the relative distance from a known surveyed location; and, (2) The overall precision was calculated for the 30 replications of each of the four peripheral AeroPoints 2 GCPs
3. Results
3.1. Phase 1
In comparing the statistics of error distances between the two cases, the standard deviation, standard error, and mean of error distances were all lower for the manually assigned than those of the self-determined (). This indicates that the positional accuracy is higher when the base station position is manually assigned with the known coordinates than when determined by the RTK base station GPS unit. In examining the RMSE for both cases, it was lower for the manually assigned case (RMSE = 0.0729 m) compared to that of the self-determined case (RMSE = 1.9762 m), further confirming that the positional accuracy is higher when the base station position was manually assigned (). The result of the ANOVA test in comparing the two cases revealed that the positional accuracy of the manually assigned (mean error distance = 0.0588 m) outperformed the self-determined (mean error distance = 1.7579 m) significantly (
p-value: 1.93208 × 10⁻¹⁴; ).
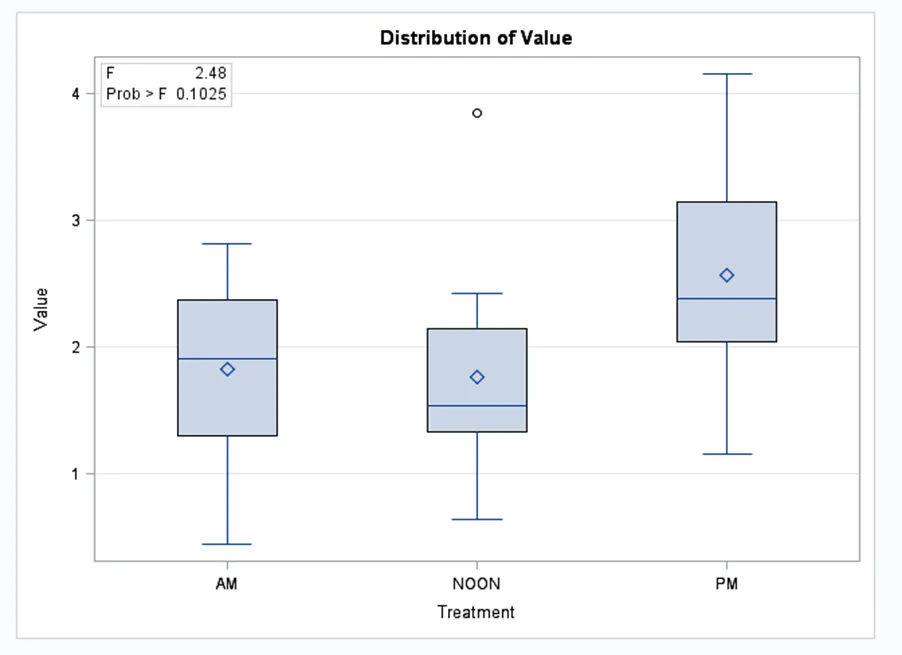
However, knowing that the manually determined case was more accurate than the self-determined case, we wanted to know if the time of the day significantly differed in the resulting positional accuracy. Therefore, another ANOVA was conducted on the error distances of the 30 mean centers from only the self-determined case (10 for each of the three periods, 9 a.m., 12 p.m. and 3 p.m.), where time was set for the factor. The results showed that time of the day did not play a significant role in achieving positional accuracy (
p-value = 0.1025; and ).
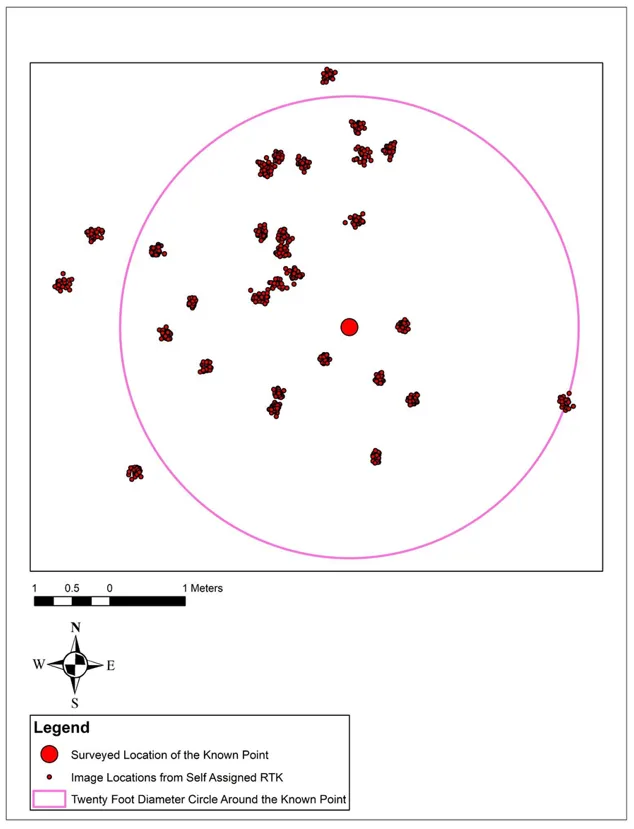
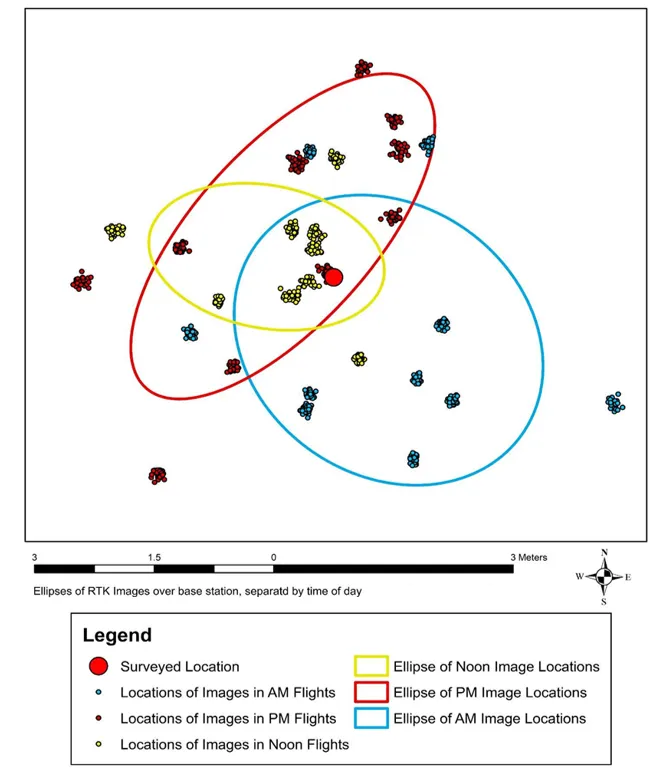
When viewing all 900 positions (30 iterations of each time period of each day) of the base station where the coordinates were self-determined, each 30 images form a cluster of point features, and most of the clusters are within a 10 feet radius from the known surveyed point position (). When the 900 positions were differentiated by the time of the day and the directional ellipse of each time was superimposed, we observed that most clusters of the same time group were located within similar distances to the known surveyed point (). The overlapping of the three directional ellipses indicates that the benchmark positions obtained from the RTK UAV images with the self-determined base station had minimal spatial variation regarding when the day the positioning of the base station was performed.
.
Summary statistics of error distances for two RTK base station positioning methods.
| Accuracy Comparison between the Two RTK Settings (Unit: m, n = 30) |
| Points Measured by RTK |
Standard Deviation |
Standard Error |
Mean Error |
RMSE |
| Self-determined |
0.9184 |
0.1677 |
1.7579 |
1.9762 |
| Manually-assigned |
0.0359 |
0.0021 |
0.0588 |
0.0729 |
.
Analysis of Variance (ANOVA) of error distances for two RTK base station positioning methods: self-determined and manually-assigned.
| Single Factor ANOVA: RTK over Known Point |
|
|
|
|
|
|
| SUMMARY |
|
|
|
|
|
|
| Groups |
Count |
Sum |
Average |
Variance |
|
|
| Self-determined |
30 |
52.7364 |
1.7579 |
0.8434 |
|
|
| Manually-assigned |
30 |
1.7625 |
0.0588 |
0.0009 |
|
|
| ANOVA |
|
|
|
|
|
|
| Source of Variation |
Sum of Squares (SS) |
df |
Mean Square (MS) |
F |
p-Value |
F Crit |
| Between Groups |
43.3057 |
1 |
43.3057 |
102.58 |
1.93208 × 10⁻¹⁴ |
4.0069 |
| Within Groups |
24.4856 |
58 |
0.4222 |
|
|
|
| Total |
67.7912 |
59 |
|
|
|
|
.
ANOVA statistics on error distances of the self-determined RTK setting by time of day.
| Source |
df |
Sum of Squares (SS) |
Mean Square (MS) |
F |
p-Value |
| Model |
2 |
3.95818624 |
1.97909312 |
2.48 |
0.1025 |
| Error |
27 |
21.53655602 |
0.79765022 |
|
|
| Corrected Total |
29 |
25.49474225 |
|
|
|
| R-Square |
Coefficient Var |
Root MSE |
Mean |
|
|
| 0.15255 |
43.49961 |
0.893113 |
2.053151 |
|
|
| Source |
df |
Anova SS |
Mean Square |
F |
p-Value |
| Treatment |
2 |
3.95818624 |
1.97909312 |
2.48 |
0.1025 |
. Box and whisker plot error distances of the self -determined RTK setting by time of day.
. 900 point locations captured with self-determined RTK base station position. Each of the 30 clusters contains 30 point locations.
. 900 point positions grouped by time of day captured with self-determined RTK base station position. Each of the three time groups (indicated by blue, yellow, or red color) contains 10 clusters, and each of the 30 clusters includes 30 positions.
In the second phase, the central AeroPoints 2 GCP was placed directly over the known surveyed point, and the other four AeroPoints 2 GCPs were placed 3.5 m (or 10 feet) away from the center of the central AeroPoints 2 GCP at each cardinal direction (north, east, south, and west; 90 degrees to each other). After the coordinates were attained repeatedly for 30 times on each of the five GCPs through a course of 10 days, 3 time periods per day, we then calculated the mean and standard deviation of error distance and RMSE for each of the 30 AeroPoints 2 GCP readings for each of the 5 AeroPoints 2 GCPs (
).
Among the five AeroPoints 2 GPCs (Center, North, East, South, and West), the Center has the lowest RMSE (at 0.0136 m). The mean error distance for the Center was 0.01047 m, indicating that the positions determined by AeroPoints 2 have a mean error of 1.05 cm from the surveyed point. The four surrounding GPCs also showed low standard deviations and low average error distances to their intended position. For the coordinates determined by each of the four AeroPoints 2 GCPs, the mean error distance ranged from the most accurate South, followed by North and East, to the least accurate West. For the 4 surrounding AeroPoints 2 GCPs, the RMSE was quite comparable for each directional GCP.
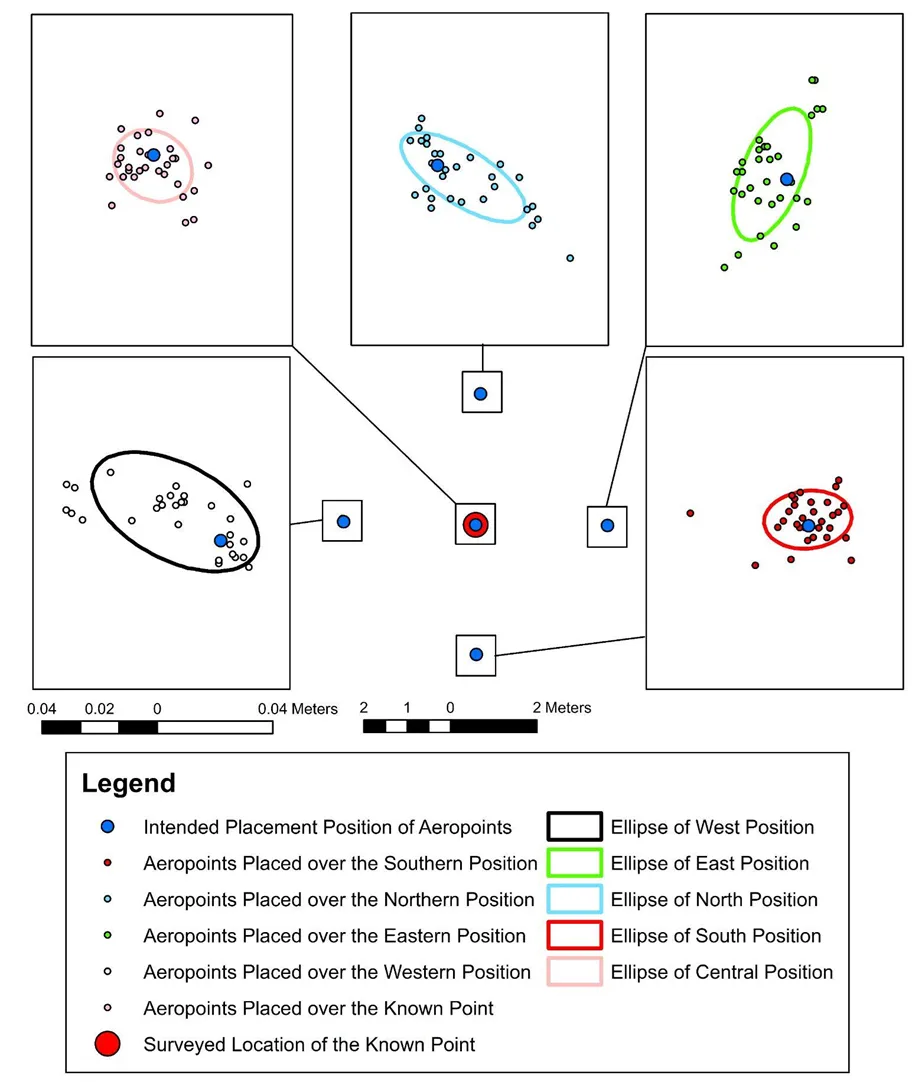
When viewing the 30 positions for each of the 5 AeroPoints 2 GCP, most of them are located close to their intended position (
). When a directional ellipse of one standard deviation derived from the 30 positions of each GCP was superimposed for each of the 5 GCPs, the size of the ellipse for the Center was the smallest, and most positions were contained within the ellipse (
). For the four surrounding AeroPoints 2 GCPs, the size of the ellipse for the South was the smallest, indicating the highest positional precision, while that of the West was the biggest with the least positional precision (
).
.
Summary statistics of error distances for five AeroPoints 2 GCP positions (unit: m, n = 30).
| Self-Recorded Location Data of Peripheral Points Placed around Central Point |
| Points as Measured by GCP |
Standard Deviation |
Mean Error Distance |
RMSE |
| Center |
0.0063 |
0.0105 |
0.0136 |
| North |
0.0130 |
0.0125 |
0.1151 |
| East |
0.0092 |
0.0148 |
0.1072 |
| South |
0.0078 |
0.0085 |
0.0718 |
| West |
0.0194 |
0.0183 |
0.1715 |
. Positions of AeroPoints 2 results with ellipses plotted at one standard deviation. At each AeroPoints 2 location, we obtained 30 coordinate readings and post-processed.
4. Discussion
To summarize the results, we found that for the RTK UAV phase 1, when the position of the base station was manually assigned, the accuracy was higher (average error distance of 0.0588 m from the surveyed coordinates), and the RMSE was lower (RMSE = 0.0729 m) than when the position of the base station was determined by the RTK GPS unit (average error distance = 1.7579 m and RMSE = 1.9762 m). Different times of the day did not make a difference in the positional accuracy. The average error distance for the AeroPoints 2 GCPs was low for all the five CGP locations, especially that of the central location (RMSE: Center 0.0136 m, North 0.1151 m, East 0.1072 m, South 0.0718 m, and West 0.1715 m). For the central AeroPoints 2 GCP, the positional data revealed an average error distance of 0.0105 m from the surveyed coordinates, with a standard deviation of 0.0063 m.
4.1. Phase 1
In comparing the positional accuracy of the UAV images using the two RTK settings, the accuracy of the images obtained by manually assigning the coordinates of the base station location produced a higher accuracy. The RTK system was able to determine the position of its base station with an accuracy of 0.0588 m from the actual location when provided with the known surveyed point coordinates. For the 900 UAV images captured using the self-determined base station position, the tight clustering observed within each group of 30 images indicated a consistently high level of positional precision. Although the RTK system provided high-precision clusters each time, it could not place them accurately when allowed to self-determine their position. With the self-determined RTK setting, the mean accuracy was 1.7536 m from the actual base station position. When we let the RTK system self-determine the base station position, the mean error distance and the RMSE were higher (1.9762 m) than those of the manually assigned case (0.0729 m), indicating that the RTK system did not accurately obtain the location of the UAV when determining its own position. In addition, when we compared the positional accuracy of the UAV images obtained at different times of the day, the mean error distance for each group was not significantly different from each other. Also,
showed an F test with a
p-value of 0.1025. Because of this, we assumed there was no significant effect due to the time of day. Therefore, we did not pursue any further analysis controlling for the different times of the day.
Phase 1 tested the performance of the DJI Phantom 4 RTK system on the positional accuracy of individual images taken by the drone, which will have an impact when producing an orthophoto mosaic from a collection of images. Two settings of the base station were tested for comparison. First, coordinates on which the base station was placed were manually assigned with known values, and second, the base station was allowed to use its own internal GPS receiver to determine its position. When provided with the known coordinates, this system reliably placed the drone within 5.88 cm of the actual position. When allowed to determine its own position, it reliably placed the drone within 1.44 m of the actual position. The time of day was controlled during this phase and did not have a significant impact on the accuracy of the externally assigned location data treatment. This was controlled for as a result of temporally separating samples to control for temporal autocorrelation [
12].
There are ways to improve the positional accuracy of the RTK UAV images even when the correctional network is not available. The DJI Phantom 4 RTK cannot be relied upon to provide absolute accuracy of positional data to an orthophoto mosaic when relying upon its own internal GPS for positioning information, but provides comparable accuracy data of single positions when compared to the AeroPoint 2 while using externally provided location data. PPK, an alternative method to RTK, has been shown to provide comparable data post-processed [
13]. Therefore, we could recommend using an RTK UAV combined with a known surveyed point and/or multiple AeroPoints 2 GCPs. Our findings suggested that when a known surveyed point is available for the RTK UAV image acquisition, the accuracy is higher with the base station’s coordinates manually assigned.
When a known surveyed point is available, we recommend using the known surveyed point as the base station location. However, instead of letting the RTK system of the UAV self-determine the base station position, we recommend the users manually assign the base station position using the known surveyed point coordinates.
4.2. Phase 2
When we compared the positional accuracy of the central AeroPoints 2 Ground Control Point (GCP) to the surveyed coordinates, the mean error distance for 30 central AeroPoints 2 GCP readings was 1.05 cm from the survey point position with a standard deviation of 0.63 cm. For the other four AeroPoints 2 GCP readings (
i.e., North, East, South, and West), the mean error distances were between 0.85 cm and 1.83 cm from their intended locations. We displayed each cluster of 30 point features for each AeroPoints 2 GCP (central, north, east, south, and west) and placed one standard deviation ellipse over each 30 point feature cluster for each of the 5 GCPs. The size of the ellipse for the central GCP was the smallest, and the central ellipse was centered on the survey point. For each surrounding GCP, most of the 30 point features were centered around their expected position. The ellipse size for the south AeroPoints 2 GCP was the second smallest next to the central AeroPoints 2 GCP. The data was collected at random times within the three larger intervals over different days. Because of the randomness in the sampling, we did not expect GNSS constellation information to be a factor.
By placing an AeroPoints 2 GCP on a survey point with a known position to check their accuracy allows for assessing their impact on the creation of orthophoto mosaics. The AeroPoints 2 reliably recorded their position within 1.047 cm of the survey point after recording for 20 min with their data processed using Propeller’s internal correction network. This was in keeping with findings from Pix4D, which found them to be highly accurate both in terms of absolute and relative accuracy, finding 1–2 cm positional accuracy when using AeroPoint 2 GCPs [
14,
15]. Because of their low variation and high absolute accuracy, these were reliable tools for producing orthophoto mosaics with high positional accuracy. The low standard deviation in positional error indicates that these points maintain their positions with high precision, making them suitable for accurately determining the linear distance between two placed AeroPoints 2 [
16,
17]. These positions were corrected using the Propeller Correction Network (PCN), a feature built into these GCPs that performs differential corrections with existing known locations to report positional data with a higher absolute accuracy. Propeller advertises their AeroPoints 2 as highly accurate but states that this accuracy is only relative if the GCPs are not corrected using either their internal system or a third-party application [
18].
In phase 2, the post-processed AeroPoints 2 coordinates were comparable to those of the surveyed point. AeroPoints 2 GCPs are artificial points with onboard GPS units that independently record their position. These GCPs have no direct interaction with the onboard GPS of a UAS, but are combined with UAS imagery during the process of producing orthophoto mosaics to ensure that absolute accuracy above the control point is as high as possible. However, any visible landmark can be used as a GCP in the process. Their actual position can be attained by ground-truthing locations using an independent GPS with high accuracy, and the position readings are assigned to each corresponding feature within the georectified image [
19]. The advantage of AeroPoints 2 over this second method lies in their ease of use, built-in correction network, and versatility.
We assumed that the z-axis error is constant and did not assess the
z-axis error. For our studies, we used a fixed height for data collection on the ground. Based on our findings, we recommend the use of AeroPoints 2 as enhanced ground control points (GCPs) for UAV image acquisition.
Regarding future studies, now that we know AeroPoints 2 GCP can be used as known surveyed points for an RTK UAV and also as an improved GCP in an urban setting, we would like to test the interaction of the RTK UAV and AeroPoints 2 GCPs in various environments with the use of additional regular GCPs and without to see which combination would result in the highest accuracy. An important consideration for an orthophoto mosaic is from a user’s perspective.
5. Conclusions
Our study aimed to find ways to create more accurate orthophoto mosaics and to determine which gives better positional accuracy, an RTK UAV or AeroPoints 2 Ground Control Points with a correctional network. In phase 1, we compared the positional accuracy between the coordinates of the RTK base station (when it was placed directly on top of the benchmark) obtained from the RTK images (the position of the base station was determined both manually assigned and self-determined by the RTK unit) and the known survey point coordinates. For phase 2, we compared the positional accuracy between the known surveyed point coordinate and the coordinate readings from AeroPoints 2 GCPs using two ways: (1) when it was placed directly on top of the surveyed point; and (2) when each of the four AeroPoints 2 GCPs were placed from the benchmark (or the surveyed point) by 3.5 m (or 10 feet) away from the center of the central AeroPoints 2 GCP location in the four cardinal directions (i.e., north, east, south, and west).
Overall, this study contains multiple key findings. First, when we have a known surveyed point, the UAV images’ accuracy is more accurate with the coordinates of the base station manually assigned compared to letting the GPS unit of the RTK base station self-determine. Second, for the RTK UAV, when letting the GPS unit of the base station self-determine the coordinates of the base station, the different times of the day did not affect the positional accuracy significantly. Third, for the accuracy of the AeroPoints 2 GCP, the placement of the AeroPoints 2 GCP from the known surveyed point in four different cardinal directions (i.e., north, east, south, and west) did not make a difference in positional accuracy.
There are several implications for future uses of AeroPoints 2 Ground Control Points (GCP) when combined with an RTK UAV. First, the accuracy of the images from RTK UAVs cannot be highly accurate without performing the post-processing using the external correction network. Our overall study suggests that even when we do not have a known surveyed point (i.e., a benchmark), we can place one AeroPoints 2 GCP where the base station of the RTK unit is located and obtain the coordinates of the base station using the AeroPoints 2 GCP. That way, we can increase the positional accuracy of the base station location in the absence of a surveyed point. Second, when an area has been seeded with AeroPoints 2, we can replace it with any monument on the ground (i.e., permanent unimproved GCPs) that does not move and is visible in the air and use them as known surveyed points to improve the positional accuracy of UAV images.
With affordability and ease of use, the use of AeroPoints 2 GCP might be an alternative to having a known, surveyed point when using an RTK UAV system. Rather than using AeroPoints 2 GCP as a regular ground control point, we recommend using Aero-Points 2 GCP to get an exact coordinate of the base station. If we use Aero-Points 2 as an alternative way of obtaining the base station coordinate, we only need one AeroPoints 2 GCP, not 5 of them (i.e., using as a regular GCP), which is more economical.
In conclusion, AeroPoints 2 is a useful tool for both orthophoto mosaic creation and independent use for positioning. It can be used out of the box. The Phantom 4 RTK by itself is useful for increasing the precision of images but cannot provide increased positional accuracy for an orthophoto mosaic without an external correction network. With the increasing demand for UAV images, there is great potential for applications that we can use the AeroPoints 2 Ground Control Points. More studies are needed to explore ways to improve the accuracy of RTK UAVs when their correctional networks are not available. Our study mainly focused on practical applications from a user’s perspective, and we hope to add the findings of this study to the existing literature to improve the positional accuracy of RTK UAVs and GCPs derived orthophoto mosaics.
Acknowledgments
We would like to thank everyone who made this study possible. We are especially grateful to Clayton Collier at Hydrex Environmental, and John Chapman at Hydrex Environmental, for providing orthophoto mosaic imagery for the study. Kenneth Farrish provided an Environmental Science Graduate Research Assistantship to E. Shupe through the McIntire-Stennis Cooperative Forestry Research Program. We would also like to thank Isaac Smith, Jacob Boatman, Canon Gainer, and Alexandria Cook for their help in collecting the field data. Finally, E. Shupe would like to thank Martin and Lori Shupe for their support and encouragement.
Author Contributions
Conceptualization, E.S., D.U., D.K., I.-K.H. and Y.Z.; Methodology, E.S., D.U., D.K., I.-K.H. and Y.Z.; Software, E.S., D.U., D.K., I.-K.H. and Y.Z.; Validation, E.S., D.U. and D.K.; Formal Analysis, E.S.; Investigation, E.S., D.U., D.K., I.-K.H. and Y.Z.; Resources, E.S., D.U. and D.K.; Data Curation, E.S.; Writing—Original Draft Preparation, J.K.; Writing—Review & Editing, E.S., D.U., D.K., I.-K.H., Y.Z. and J.K.; Visualization, E.S.; Supervision, D.U., and D.K.; Project Administration, D.K.; Funding Acquisition, D.U., D.K., I.-K.H. and Y.Z.
Ethics Statement
Not applicable.
Informed Consent Statement
Not applicable.
Data Availability Statement
Data will be made available on request.
Funding
McIntire-Stennis funds (Grant Number: NI24MSCFRXXXG037) , administered by the Arthur Temple College of Forestry and Agriculture at Stephen F. Austin State University (SFA), were used for the completion of this project for E.S. Dr. Kenneth Farrish, Director of the Division of Environmental Science at SFA, provided an Environmental Science graduate assistantship for this project for E.S.
Declaration of Competing Interest
The authors declare that they have no known competing financial interests or personal relationships that could have appeared to influence the work reported in this paper.
References
-
1.
Jay AF, Tony G. Differential GPS reference station algorithm-design and analysis.
IEEE Trans. Control Syst. Technol. 2000,
8, 519–531. doi:10.1109/87.845882.
[Google Scholar]
-
2.
Jean-Mari Z. GPS Basics: Introduction to the System. Application Overview. 2002. Available online: https://crlab.ece.ucr.edu/usbgps/doc/gps_basic.pdf (accessed on 11 May 2023).
-
3.
Julián T, Martin M, Peter S, Alžbeta G, Ján M. UAV RTK/PPK method—An optimal solution for mapping inaccessible forested areas?
Remote Sens. 2019,
11, 721. doi:10.3390/rs11060721.
[Google Scholar]
-
4.
United States Geological Survey. Ground Control Points. Available online: https://www.usgs.gov/landsat-missions/ground-control-points (accessed on 3 February 2025).
-
5.
Stephanie RR, Ian M, Willian L. Comparing the spatial accuracy of digital surface models from four unoccupied aerial systems: Photogrammetry versus LiDAR.
Remote Sens. 2020,
12, 2806. doi:10.3390/rs12172806.
[Google Scholar]
-
6.
Florian Z, Christian E, Lasse K, Heiner K. Precise positioning of uavs–dealing with challenging rtk-gps measurement conditions during automated uav flights. In Proceedings of the International Conference on Unmanned Aerial Vehicles in Geomatics, Bonn, Germany, 4–7 September 2017; pp. 95–102.
-
7.
Anatum GeoMobile Solutions. What Is PDOP and Why It’s Obsolete? Anatum. Available online: https://www.agsgis.com/What-is-PDOP-And-Why-its-Obsolete_b_43.html (accessed on 4 February 2025).
-
8.
Desta E, Francesco N, Norman K. Accuracy assessment of real-time kinematics (RTK) measurements on unmanned aerial vehicles (UAV) for direct geo-referencing.
Geo-Spat. Info. Sci. 2020,
23, 165–181. doi:10.1080/10095020.2019.1710437.
[Google Scholar]
-
9.
Environment Systems Research Institute (ESRI) Inc. ArcGIS Desktop Software, version 10.8.2; ESRI: Redlands, CA, USA, 2020.
-
10.
SAS Institute Inc. SAS/STAT® Software, Version 9.4; SAS Institute Inc.: Cary, NC, USA, 2021.
-
11.
Propeller Aero, Smart Ground Control Points. Available online: https://www.propelleraero.com/blog/aeropoints-2-the-next-generation-of-aeropoints (accessed on 4 February 2025).
-
12.
ArduSimple. Centimeter Precision GPS/GNSS—RTK Explained. Centimeter Precision GNSS Explained—RTK in detail—ArduSimple. Available online: https://www.ardusimple.com/rtk-explained/ (accessed 4 February 2025).
-
13.
Lewis G. Direct Geopositioning Accuracy using AirGon Loki—A Case Study. GeoCue. 2018. Available online: https://support.geocue.com/direct-geopositioning-accuracy-using-airgon-loki-case-study/ (accessed on 4 February 2025).
-
14.
Dimitrios B. Assessment of GCP number and separation distance for small UAS surveys with and without GNSS-PPK positioning.
J. Surv. Eng. 2019,
145, 04019007. doi:10.1061/(ASCE)SU.1943-5428.0000283.
[Google Scholar]
-
15.
Pix4D. Ground Control Points: Why Are They Important? Pix4D. Available online: https://www.pix4d.com/blog/why-ground-control-points-important (accessed on 4 February 2025).
-
16.
Luke W. Investigating the Geometric Accuracy of Propeller AeroPoints and Propeller Cloud Processing. sUAS News. Available online: https://www.suasnews.com/2017/06/investigating-geometric-accuracy-propeller-AeroPoints-propeller-cloud-processing/ (accessed on 4 February 2025).
-
17.
Propeller Aero. How Many AeroPoints Does It Take to Achieve Ultimate PPK Accuracy? Available online: https://www.propelleraero.com/blog/propeller-ppk-how-many-AeroPoints-does-it-take-to-get-accurate-results/ (accessed on 4 February 2025).
-
18.
Propeller Aero. AeroPoints User Manual. Available online: https://data2.manualslib.com/pdf7/186/18597/1859619-propeller/aeropoints.pdf?e7b0804a19cf157c6370342677f9d366 (accessed 4 February 2025).
-
19.
Joseph M. Use of Drones in GIS. Geography Realm. Available online: https://www.gislounge.com/use-drones-gis/ (accessed on 4 February 2025).