
Transcriptome Sequencing Reveals Candidate Genes and Signalling Pathways for Skeletal Muscle Development in Ningxiang Pig

Transcriptome Sequencing Reveals Candidate Genes and Signalling Pathways for Skeletal Muscle Development in Ningxiang Pig
Zonggang Yu
1,2
Lanlin Xiao
2
Xin Li
2
Kaiming Wang
2
Jie Tian
2
Haiming Ma
1,2,*

Received: 31 July 2026 Revised: 24 August 2026 Accepted: 28 September 2026 Published: 19 October 2026

© 2026 The authors. This is an open access article under the Creative Commons Attribution 4.0 International License (https://creativecommons.org/licenses/by/4.0/).
1. Introduction
Intramuscular fat content is an important factor affecting meat quality and can affect the flavour, tenderness, juiciness, and fatty acid content of muscles [1,2,3]. The Ningxiang pig is a fat-type native pig breed in China that has the advantages of high intramuscular fat content [4] and significantly higher arachidonic acid and docosahexaenoic acid contents than foreign pig breeds [5]. However, the slow growth rate of Ningxiang pigs and the unclear molecular mechanism of muscle development have seriously restricted the development and utilisation of Ningxiang pigs; therefore, it is urgent to analyse the molecular mechanism of muscle development in Ningxiang pigs.
Muscle development is regulated by several genes. Although candidate genes such as PAX3/PAX7 [6], MyoD, Myf5, Myog, MRF4 [7,8,9], MSTN, and MyHC [10] have been identified, there may be differences in the genes that play major roles among different species. Transcriptomes can explain the functional elements of the genome, reveal the molecular composition of cells and tissues, and explore the molecular mechanisms of complex traits [11,12]. With rapid developments in science and technology, transcriptomes have been widely used for disease diagnosis [13,14], organ growth and development [15], and genetic improvement [16]. Ma et al. assembled the reference genome of Ningxiang pigs through de novo genome sequencing, which provided a reference for further studies of gene function and molecular breeding of Ningxiang pigs [17]. Li et al. found that 1171 circRNAs (circular RNA) were significantly differentially expressed in the longissimus dorsi (LD) muscle of Ningxiang pigs over four periods, and further analysis revealed that the host genes of these circRNAs were significantly enriched in AMPK and other signalling pathways regulating muscle development [18]. Liufu et al. sequenced the transcriptome of the LD muscle of Ningxiang pigs over three time periods (1, 60, and 210 d), and identified candidate genes affecting muscle growth and development, including RIPOR2, MEGF10, KLHL40, PLEC, TBX3, FBP, and HOMER1 [19]. Pig-specific non-core genes may exist in the development of different pig breeds [20,21]; therefore, it is not sufficient to mine the key genes involved in muscle development in different pig breeds using published public reference genomes. Therefore, the reassembled genome of this species could be used as a reference genome for identifying specific genes. Xu et al. identified the structural variation gene MYL4 in the LD muscle of Ningxiang pigs, which inhibits myoblast proliferation and promotes apoptosis and differentiation [22]. Raza et al. found that KLF6 promotes the proliferation of bovine preadipocytes [23]. GPX2 regulates the development of porcine preadipocytes and myoblasts through the MAPK signalling pathway [24], PDLIM5 negatively regulates the proliferation and differentiation of porcine myoblasts [25], CDC23 promotes the proliferation and differentiation of porcine myoblasts [26], SATB2 mediates histone acetylation as a transcription factor to promote the proliferation of porcine myoblasts [27], and ZBED6 deletion alleviates muscle atrophy induced by sepsis [28]. Ai et al. identified differentially expressed circRNAs (circTTN) in Ningxiang pig muscle tissue and further verified circTTN’s role in the development of skeletal muscle cells. The results showed that circTTN inhibits host gene transcription and myogenesis by binding to the PURB protein [29]. However, the functional verification of the genes and circRNAs identified in Ningxiang pigs is still not sufficiently deep, and further research is needed. Our previous study showed that Ningxiang pigs grew rapidly from weaning to pre-fattening, and the diameter of the muscle fibres did not change significantly after pre-fattening, which suggests that it is very important to analyse the key genes in these two stages to understand the molecular mechanism of skeletal muscle development in Ningxiang pigs [30]. Our previous research mainly analysed the molecular mechanism of the ceRNA network in muscle development in Ningxiang pigs, but it was not sufficient to mine the key genes in the rapid growth stage of muscle development; therefore, this study focused on mining key genes during the critical period of muscle development.
The key period from weaning to early fattening is the rapid muscle development in Ningxiang pigs. The weaning period for Ningxiang pigs is 30 days after birth, and the early fattening period is 150 days after birth. In this study, the LD muscles of 30- and 150-day-old Ningxiang pigs were collected, and candidate genes and signalling pathways related to muscle development were mined by transcription sequencing to provide a reference for comprehensively analysing the mechanism of muscle development in Ningxiang pigs.
2. Materials and Methods
2.1. Experimental Animals and Sample Preparation
Three healthy 30-day-old (named N30D_M1-N30D_M3) and three 150-day-old (named N150D_M1-N150D_M3) Ningxiang boars with similar body weight were selected. Ningxiang pigs of the same age were full siblings, and Ningxiang pigs of different ages were half-siblings. Experimental pigs were obtained from the Dalong Pig Farm of Hunan Chu WeiXiang Agriculture and Animal Husbandry Co., Ltd (Changsha, China). After slaughter, the LD muscle tissue of the fourth to seventh ribs was collected in a sterile and enzyme-free EP tube, and sampling was completed within 1 h. The collected samples were temporarily stored in liquid nitrogen and then transferred to a −80 °C refrigerator within 2 h for long-term preservation for follow-up experiments.
2.2. Histomorphological Analysis of LD
The LD muscles of Ningxiang pigs were fixed with an environmentally friendly muscle fixing solution (Service, Wuhan, China), dehydrated, and waxed in a dehydrator (DIAPATH, Milan, Italy). The tissues were embedded in an embedding machine (WHJJ, Wuhan, China). The embedded wax was repaired and sliced into a slicer (Leica, Vizlal, Germany) to a thickness of 4 μm. In the spreading machine (KEDEE, Jinhua, China), the cut wax slices were flattened and spread on the glass slides, baked in an oven at 60 °C, dried with water, dyed according to the instructions of the haematoxylin-eosin staining kit (Service, Wuhan, China), sealed, and placed in a tissue section digital scanner (3DHISTECH, Budapest, Hungary) to collect images. The long and short diameters of the muscle fibres were measured using CaseViewer 2.4 (3DHISTECH, Budapest, Hungary). Muscle fibre diameter = (long diameter + short diameter)/2. The number of muscle fibres in the images was measured using the Image J software (version 1.51). Muscle fibre density = number of muscle fibres per area of the image (mm2).
2.3. Transcriptome Sequencing (RNA-Seq)
Total RNA from the LD was extracted using TRIzol reagent (Invitrogen, Carlsbad, CA, USA) according to the manufacturer’s instructions. The concentration and purity of RNA were detected using a Nanodrop 2000 (Thermo Scientific, Waltham, MA, USA). The integrity of RNA was detected by agarose gel electrophoresis, and the RNA integrity number (RIN) was determined using an Agilent 2100 (Agilent, Santa Clara, CA, USA). The sequencing library requires a total RNA of 5 μg, a concentration of ≥250 ng/μL, and an OD260/280 of 1.8–2.2. A TruSeqTM Stranded Total RNA Library Prep Kit (Illumina, San Diego, CA, USA) was used to construct a chain-specific sequencing library. An Illumina PE150 library was constructed and sequenced using the Illumina HiSeq 4000 sequencing platform (Shanghai Major Biomedical Technology Co., Ltd., Shanghai, China).
2.4. Read Mapping and Differential Expression Analysis
Upstream processing of the original data was performed on the server, and the sequenced original images were converted into FASTQ format data by base calling. The converted data were controlled using Fastp (version 0.17) software [31], and the quality control data were counted using SeqPrep (version 1.2) (https://github.com/jstjohn/SeqPrep, accessed on 10 August 2023) and Sickle (version 1.33) (https://github.com/najoshi/sickle, accessed on 10 August 2023). Quality control data were mapped to the Ningxiang pig reference genome (accession number: PRJNA531381) [17] using the Hisat2 software (version 2.1.1) [32]. The compared data were assembled using StringTie (v2.2.0) [33], and a new transcript was obtained using the GFFcompare (version 1.12.6) software [34]. The results were converted and sorted using Samtools (version 0.0.9) software [35], clean reads were counted using Htseq software (v2.0.3) [36], the TPM value of each transcript was calculated using RSEM (version 1.3.5) software [37], and genes with TPM > 1 were screened for follow-up function enrichment analysis. The R software (version 3.6.3) was used to analyse downstream transcriptome data, and the DESeq2 package was used to analyse differences in gene expression [38]. The differentially transcripts/genes were screened according to the results of Padjust < 0.05 and |log2(fold change)| ≥ 2 [39].
2.5. Functional Analysis of Differentially Expressed Transcripts
BioDBnet (https://biodbnet-abcc.ncifcrf.gov/, accessed on 10 August 2023) was used to convert gene ID [40]. The AnnotationHub R package was used to obtain annotation files, and the clusterProfiler R package was used for gene ontology (GO) enrichment analysis of the differentially expressed transcripts. The KOBAS website was used to analyse the Kyoto encyclopedia of genes and genomes (KEGG) pathways of the differentially expressed transcripts [41]. The significant enrichment standards of GO and KEGG were corrected p < 0.05 (Padjusted < 0.05). Visualisation of the protein-protein interaction network was performed using the Cytoscape StringApp software (version 3.10.1). Transcription factor prediction was conducted using AnimalTFDB4.0 [42].
2.6. Cell Culture
C2C12 cells were purchased from Anwei Biotechnology Co., Ltd. (Shanghai, China). The cells were cultured in DMEM (Gibco, Carlsbad, CA, USA) containing 10% foetal bovine serum (Gibco, Carlsbad, CA, USA) and 1% penicillin-streptomycin (Gibco, Carlsbad, CA, USA) under standard culture conditions (humid environment containing 5% CO2 and 95% air at 37 °C). To induce differentiation, the culture medium was replaced with DMEM containing 2% horse serum (Gibco, Carlsbad, CA, USA) when the cell confluence reached 80–90%. The induction period lasted 7 days.
2.7. RNA Extraction and Quantitative PCR (qPCR)
The mRNA sequence was obtained from the sequencing platform, and the primers for qPCR were designed using the NCBI Primer blast (https://www.ncbi.nlm.nih.gov/tools/primer-blast/index.cgi?LINK_LOC=BlastHome, accessed on 6 September 2023). Primer sequences were synthesised by Beijing Tsingke Biotechnology Co., Ltd. (Beijing, China). The primer sequences and related parameters are listed in Table 1. Total RNA from the LD muscle and C2C12 cells was extracted using TRIzol reagent (Coolaber, Beijing, China). The concentration and purity of RNA were determined using a NanoDrop 2000 (Thermo Scientific, Waltham, MA, USA). A RevertAid First Strand cDNA Synthesis Kit with a DNase I reverse transcription kit (Thermo Scientific, Waltham, MA, USA) was used to obtain cDNA following the TransStart ®Top Green qPCR SuperMix (Transgen, Beijing, China) kit instructions. The reaction mix contained 0.5 μg cDNA, 0.4 μL forward and reverse primers (10 μM), 10 μL 2× PerfectStart®GreMen qPCR SuperMix, and added nuclease-free water to 20 μL. The cycling conditions were as follows: a pre-denaturation step at 95 °C for 3 min, followed by 40 cycles of denaturation at 95 °C for 15 s and annealing at 60 °C for 1 min. The melting curve data were collected using the default parameters of the instrument. Data were collected using a CFX-96 manager (Bio-Rad). GAPDH was used as the internal reference. The relative expression of transcripts or genes was determined using the 2−ΔΔct method [43].
Table 1. Oligonucleotide sequence and related parameters.
|
Gene |
Forward Primer (5′–3′) |
Reverse Primer (5′–3′) |
Product Length/(bp) |
|---|---|---|---|
|
IGF2 |
GACCGCGGCTTCTACTTCAG |
CGGGGTATCTGGGGAAGTTG |
190 |
|
MSTRG.14343 |
AACCCACTTCTTCCTGTGACC |
CCTGTGTGGAGAGGGAATGTG |
137 |
|
ARFGEF1 |
CCGCCTCCGATCAAGATGAA |
CACCCACACCCTGTCTTCAG |
284 |
|
TEX9 |
TTGAAGGCCAAACTCCGTGT |
GGCACTTTGACTTGTGGCAG |
294 |
|
HSP90AB1 |
ATCGCCCAGTTGATGTCGTT |
TATCGTGAGGGTCCGGTCTT |
198 |
|
MSTRG.36875 |
TAAAGTCCCACTGTCCTGCG |
GACGCAGTCCGGCTCTTATT |
253 |
|
ASF1B |
CCTACCACGGACAGGAGTTC |
GCCCTTGATAGGAGTGCAGC |
251 |
|
GAPDH |
AGGGCATCCTGGGCTACACT |
TCCACCACCCTGTTGCTGTAG |
166 |
|
Pcna |
GCCGAGACCTTAGCCACATT |
GTAGGAGACAGTGGAGTGGC |
229 |
|
Ccna2 |
GTCCTAACGCTCCCATCTCC |
TCGGAAAGAGTGTCAGCCTC |
72 |
|
Ccnd1 |
TCAAGTGTGACCCGGACTG |
GCTCCTTCCTCTTTGCGGG |
235 |
|
Cdk4 |
CGAGCGTAAGGCTGATGGAT |
CCAGGCCGCTTAGAAACTGA |
177 |
|
Bax |
CCAGGATGCGTCCACCAA |
AAAGTAGAAGAGGGCAACCAC |
196 |
|
Casp3 |
GCTTGGAACGGTACGCTAAG |
CCACTGACTTGCTCCCATGT |
112 |
|
Bcl2 |
GAACTGGGGGAGGATTGTGG |
GCATGCTGGGGCCATATAGT |
194 |
|
MyHC |
CGGTCGAAGTTGCATCCCT |
GAGCCTCGATTCGCTCCTTT |
145 |
|
Myod1 |
AGTGAATGAGGCCTTCGAGA |
GCATCTGAGTCGCCACTGTA |
222 |
|
MyoG |
CAATGCACTGGAGTTCGGT |
CTGGGAAGGCAACAGACAT |
134 |
|
Myf5 |
CAGGAATGCCATCCGCTACA |
CCCGGCAGGCTGTAATAGTT |
78 |
|
Homer1 |
GCTAGGGGAGGGGAAGGAAA |
CTGAGGAACAACACCGGAGG |
73 |
|
Homer1 siRNA1 |
CAUUCAAUUCAGCAAUCAUGA |
AUGAUUGCUGAAUUGAAUGUG |
|
|
Homer1 siRNA2 |
CUCAGAAUGCAUUGCCAUUdTdT |
AAUGGCAAUGCAUUCUGAGdTdT |
|
|
siNC |
UUCUCCGAACGUGUCACGUTT |
ACGUGACACGUUCGGAGAATT |
2.8. Small Interfering RNA and Plasmid Transfection
The function of Homer1 was verified via the gain/loss approach. Small interfering RNAs (siRNAs) and overexpression plasmids were transfected into cells using Lipofectamine 2000 (Invitrogen, Waltham, MA, USA) according to the manufacturer’s instructions. The siRNA sequence for Homer1 is shown in Table 1. Oligonucleotides were synthesised by Beijing Tsingke Biotechnology Co., Ltd. (Beijing, China), and overexpression plasmids were purchased from Jintuosi Biotechnology Co., Ltd. (Wuhan, China).
2.9. Cell Counting Kit 8 (CCK-8) and 5-Ethynyl-20-Deoxyuridine (EdU) Staining Assay
Transfected cells were seeded in 96-well plates, and cell proliferation was detected using the CCK-8 [44] reagent (APExBIO, Houston, TX, USA) and EdU [45] cell proliferation kit Alexa Fluor 555 (Meilunbio, Dalian, China) per the manufacturer’s instructions. The CCK-8 reagent was added after incubation for 0 (cell adhesion), 12, 24, and 36 h. The absorbance was measured at 450 nm using a microplate reader (Thermo Scientific, Waltham, MA, USA). After the cells were cultured in 96-well plates for 20 h, EdU solution was added, and the proportion of cells labelled with EdU was detected using an Axio Vert A1 fluorescence microscope (Zeiss, Oberkochen, Germany). EdU-labelled cells were detected using Image J (version 1.51).
2.10. Western Blot Assay
Total protein was extracted by RIPA lysis buffer (Beyotime, Shanghai, China) containing 1% protease inhibitor (Beyotime). The protein concentration was detected using a BCA kit (Beyotime, Shanghai, China), and the proteins were separated by SDS-PAGE (Epizyme Biotechnology, Shanghai, China) and then transferred to a PVDF membrane (Millipore, Boston, MA, USA). Subsequently, the PVDF membrane was incubated with the primary antibody at 4 °C overnight, and then with the secondary antibody at room temperature for 1–2 h. The antibody information is as follows: Anti-CDK4 (1:1000, AiFang, Changsha, China); Anti-PCNA (1:1000, Zenbio, Chengdu, China); Anti-CCNA2 (1:2000, Abcam, Cambridge, MA, USA); Anti-β-actin (1:20,000, TransGen, Beijing, China). The protein signal was detected by Meilunbio® fg super sensitive ECL luminescence reagent (Meilunbio, Dalian, China) according to the manufacturer’s instructions, and then the images were obtained by Image Quant LAS 4000 mini chemiluminescence imaging system (GE, Boston, MA, USA). β-actin was used as an internal reference to calculate the relative expression level of protein, and the grey value of protein was detected by Image J (version 1.51) [46].
2.11. Immunofluorescence Staining
Immunofluorescence staining was performed as described by Y. Ogura [47]. Cells differentiated for 7 days were washed twice with PBS (Meilunbio, Dalian, China), fixed with 4% paraformaldehyde (Biosharp, Hefei, China) for 15 min, washed with 0.5% Triton X-100 (Sigma-Aldrich, St. Louis, MO, USA) for 10 min, and washed with 5% BSA (Biofroxx, Cologne, Germany). They were then incubated in primary antibody (Anti-MyHC, 1:300, DSHB, Iowa, IA, USA) overnight at 4 °C, followed by incubation in fluorescent secondary antibody (Anti-mouse IgG, 1:1000, Abbkine, Wuhan, China) for 1 h at room temperature in the dark. Nuclei were stained with DAPI (Solarbio, Beijing, China). Finally, Antifade Mounting Medium (Beyotime, Shanghai, China) was added, and images were captured using an Axio Vert A1 fluorescence microscope (Zeiss, Oberkochen, Germany). Differentiated and fused myoblasts were counted using Image J (version 1.51).
The expression level of HOMER1 in the skeletal muscle of Ningxiang pig at different development stages was detected by immunofluorescence staining of LD tissue sections. The slice thickness was 5 μm. After dewaxing and washing the tissue slices, the antigens in the tissue slices were repaired by antigen repair buffer (Beyotime, Shanghai, China) and sealed with 3% BSA (Biofroxx, Cologne, Germany). Add primary antibody (anti-HOMER1 Cat No.12433-1-AP, 1: 200, Proteintech, Wuhan, China) incubated overnight at 4 °C, add fluorescent secondary antibody (Anti-mouse IgG, 1:1000, Abbkine, Wuhan, China) and incubate at room temperature for 1 h, then add self-luminous fluorescence quencher (Beyotime, Shanghai, China) after DAPI (Solarbio, Beijing, China) staining, and seal the film with anti-fluorescence quencher (Beyotime, Shanghai, China). Then, put it in a slide digital scanner (AIFang, Changsha, China) for scanning and imaging. Three pigs at different stages were selected as slices, and five fields of view with the same size were randomly selected from each slice, and ImageJ calculated the mean fluorescence intensity.
2.12. Flow Cytometry Assay
Cell cycle [48] and apoptosis [49] were detected using flow cytometry (Becton Dickinson, Franklin, VA, USA). The cell cycle was evaluated using a Cell Cycle and Apoptosis Analysis Kit (Meilunbio, Dalian, China). Apoptosis was detected using an Annexin V-FITC/PI Cell Apoptosis Detection Kit (Meilunbio, Dalian, China). The procedure was performed according to the manufacturer’s instructions. The data were further analysed using the FlowJo software (Version 9) (Becton Dickinson, Franklin, VA, USA).
2.13. Statistical Analysis
Excel was used to sort out the data. Data are presented as the mean ± SD (standard deviation). Statistical analysis was performed with IBM SPSS 22.0 (SPSS Inc., Chicago, IL, USA). The significance of intergroup differences was estimated with Student’s t-test. Origin 2021 software (version 9.8.0.200) was used for graphic visualisation. Differences were considered significant at p < 0.05 and p < 0.01.
3. Results
3.1. Comparison of Muscle Fibre Diameter and Density of LD Muscle
Morphological analysis of the muscle fibre of the LD showed that the muscle fibre diameter of 150-day-old pigs (53.76 ± 2.09 μm) was significantly higher than that of 30-day-old pigs (23.04 ± 0.47 μm) (p < 0.01), and the growth rate reached 230% (Figure 1A,B). The muscle fibre density of 30-day-old pigs (1445.04 ± 80.61 fibers /mm2) was significantly higher (4.25-fold) than that of 150-day-old pigs (340.18 ± 14.87 fibers /mm2) (p < 0.01) (Figure 1C).
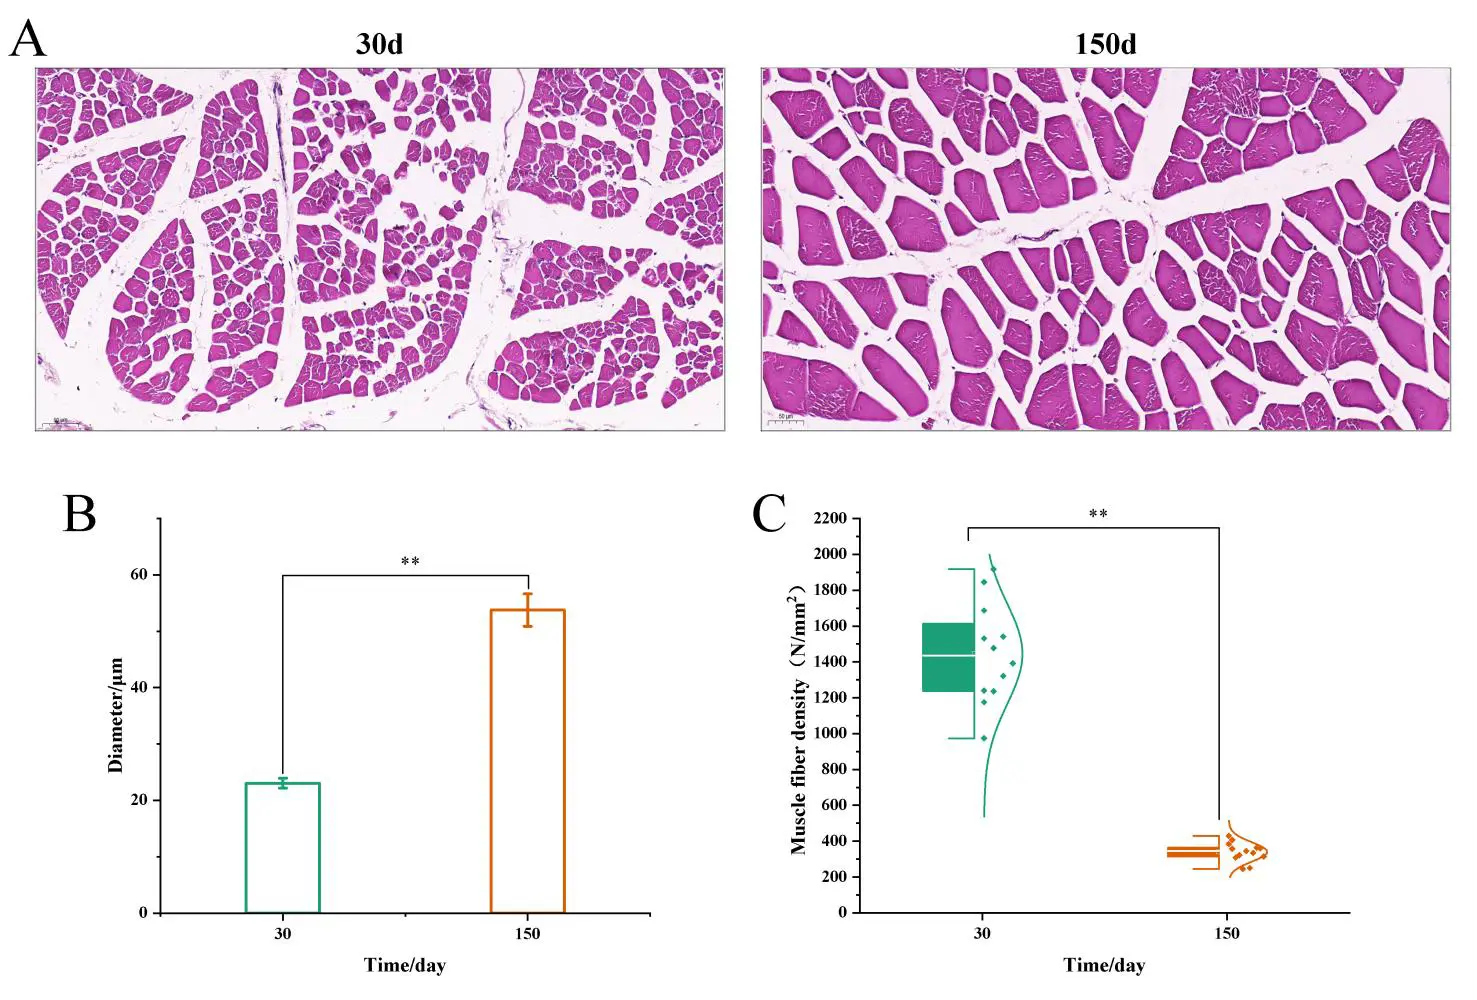
Figure 1. Histomorphological detection of skeletal muscle of LD of 30-day-old and 150-day-old Ningxiang pigs. (A) HE staining was used to detect the LD muscle; scale bar = 50 μm. (B) Two-stage muscle fibre diameter analysis histogram. (C) Two-stage muscle fibre density analysis box chart (Mean number of muscle fibers) and nomal curve plot (Normal distribution of muscle fiber density), ** p < 0.01.
3.2. Quality Control of Transcriptome Sequencing Data
As shown in Table 2, the average number of original sequencing fragments in 30-day-old and 150-day-old muscle tissue sequencing was 131,213,765.3 and 107,858,509.3, respectively, and the average amount of transformed data was 19,813,278,565 bp and 16,286,634,909 bp, respectively. After further quality control on the data of 30 days and 150 days, the average number of sequencing fragments of muscle tissue was 128,342,221.3 and 105,862,852 respectively, and the data volume was 16,991,744,589 bp and 14,340,131,010 bp, respectively. The Q30 values were 95.45% and 95.38%, respectively, and the GC contents were 55.51% and 52.47%, respectively. These results showed that the quality of the sequencing results met the requirements for further analyses.
Table 2. Quality control analysis table of sequencing data.
|
Sample |
Raw Reads |
Raw Bases |
Clean Reads |
Clean Bases |
Error Rate (%) |
Q30 (%) |
GC Content (%) |
Total Mapped |
Unique Mapped |
|---|---|---|---|---|---|---|---|---|---|
|
N30D_M1 |
125,643,820 |
18,972,216,820 |
122,988,528 |
16,416,455,345 |
0.0239 |
95.45 |
54.91 |
115,589,914 (93.98%) |
106,744,173 (86.79%) |
|
N30D_M2 |
131,506,100 |
19,857,421,100 |
129,299,096 |
17,379,678,801 |
0.0238 |
95.54 |
54.64 |
121,700,412 (94.12%) |
112,264,242 (86.83%) |
|
N30D_M3 |
136,491,376 |
20,610,197,776 |
132,739,040 |
17,179,099,621 |
0.024 |
95.35 |
56.97 |
124,599,625 (93.87%) |
115,404,691 (86.94%) |
|
N30D_M |
131,213,765 |
19,813,278,565 |
128,342,221 |
16,991,744,589 |
0.0239 |
95.45 |
55.51 |
120,629,984 (93.99%) |
111,471,035 (86.85%) |
|
N150D_M1 |
105,975,290 |
16,002,268,790 |
104,317,724 |
14,219,362,833 |
0.0239 |
95.32 |
53.04 |
98,324,610 (94.25%) |
90,999,613 (87.23%) |
|
N150D_M2 |
109,666,184 |
16,559,593,784 |
107,345,576 |
14,444,210,597 |
0.0237 |
95.58 |
53.53 |
100,767,671 (93.87%) |
91,601,719 (85.33%) |
|
N150D_M3 |
107,934,054 |
16,298,042,154 |
105,925,256 |
14,356,819,599 |
0.024 |
95.24 |
50.85 |
100,986,824 (95.34%) |
95,924,874 (90.56%) |
|
N150D_M |
107,858,509 |
16,286,634,909 |
105,862,852 |
14,340,131,010 |
0.0239 |
95.38 |
52.47 |
100,026,368 (94.49%) |
92,842,069 (97.71%) |
3.3. mRNA Identification and Expression Screening
A total of 22,411 transcripts—19,653 known and 2758 novel—were identified by transcriptome sequencing of the LD muscle at 30 and 150 days (Table S1). After TPM > 1 screening, 9021 transcripts were obtained, of which 8044 were known, and 977 were novel (Figure 2 and Table S2).
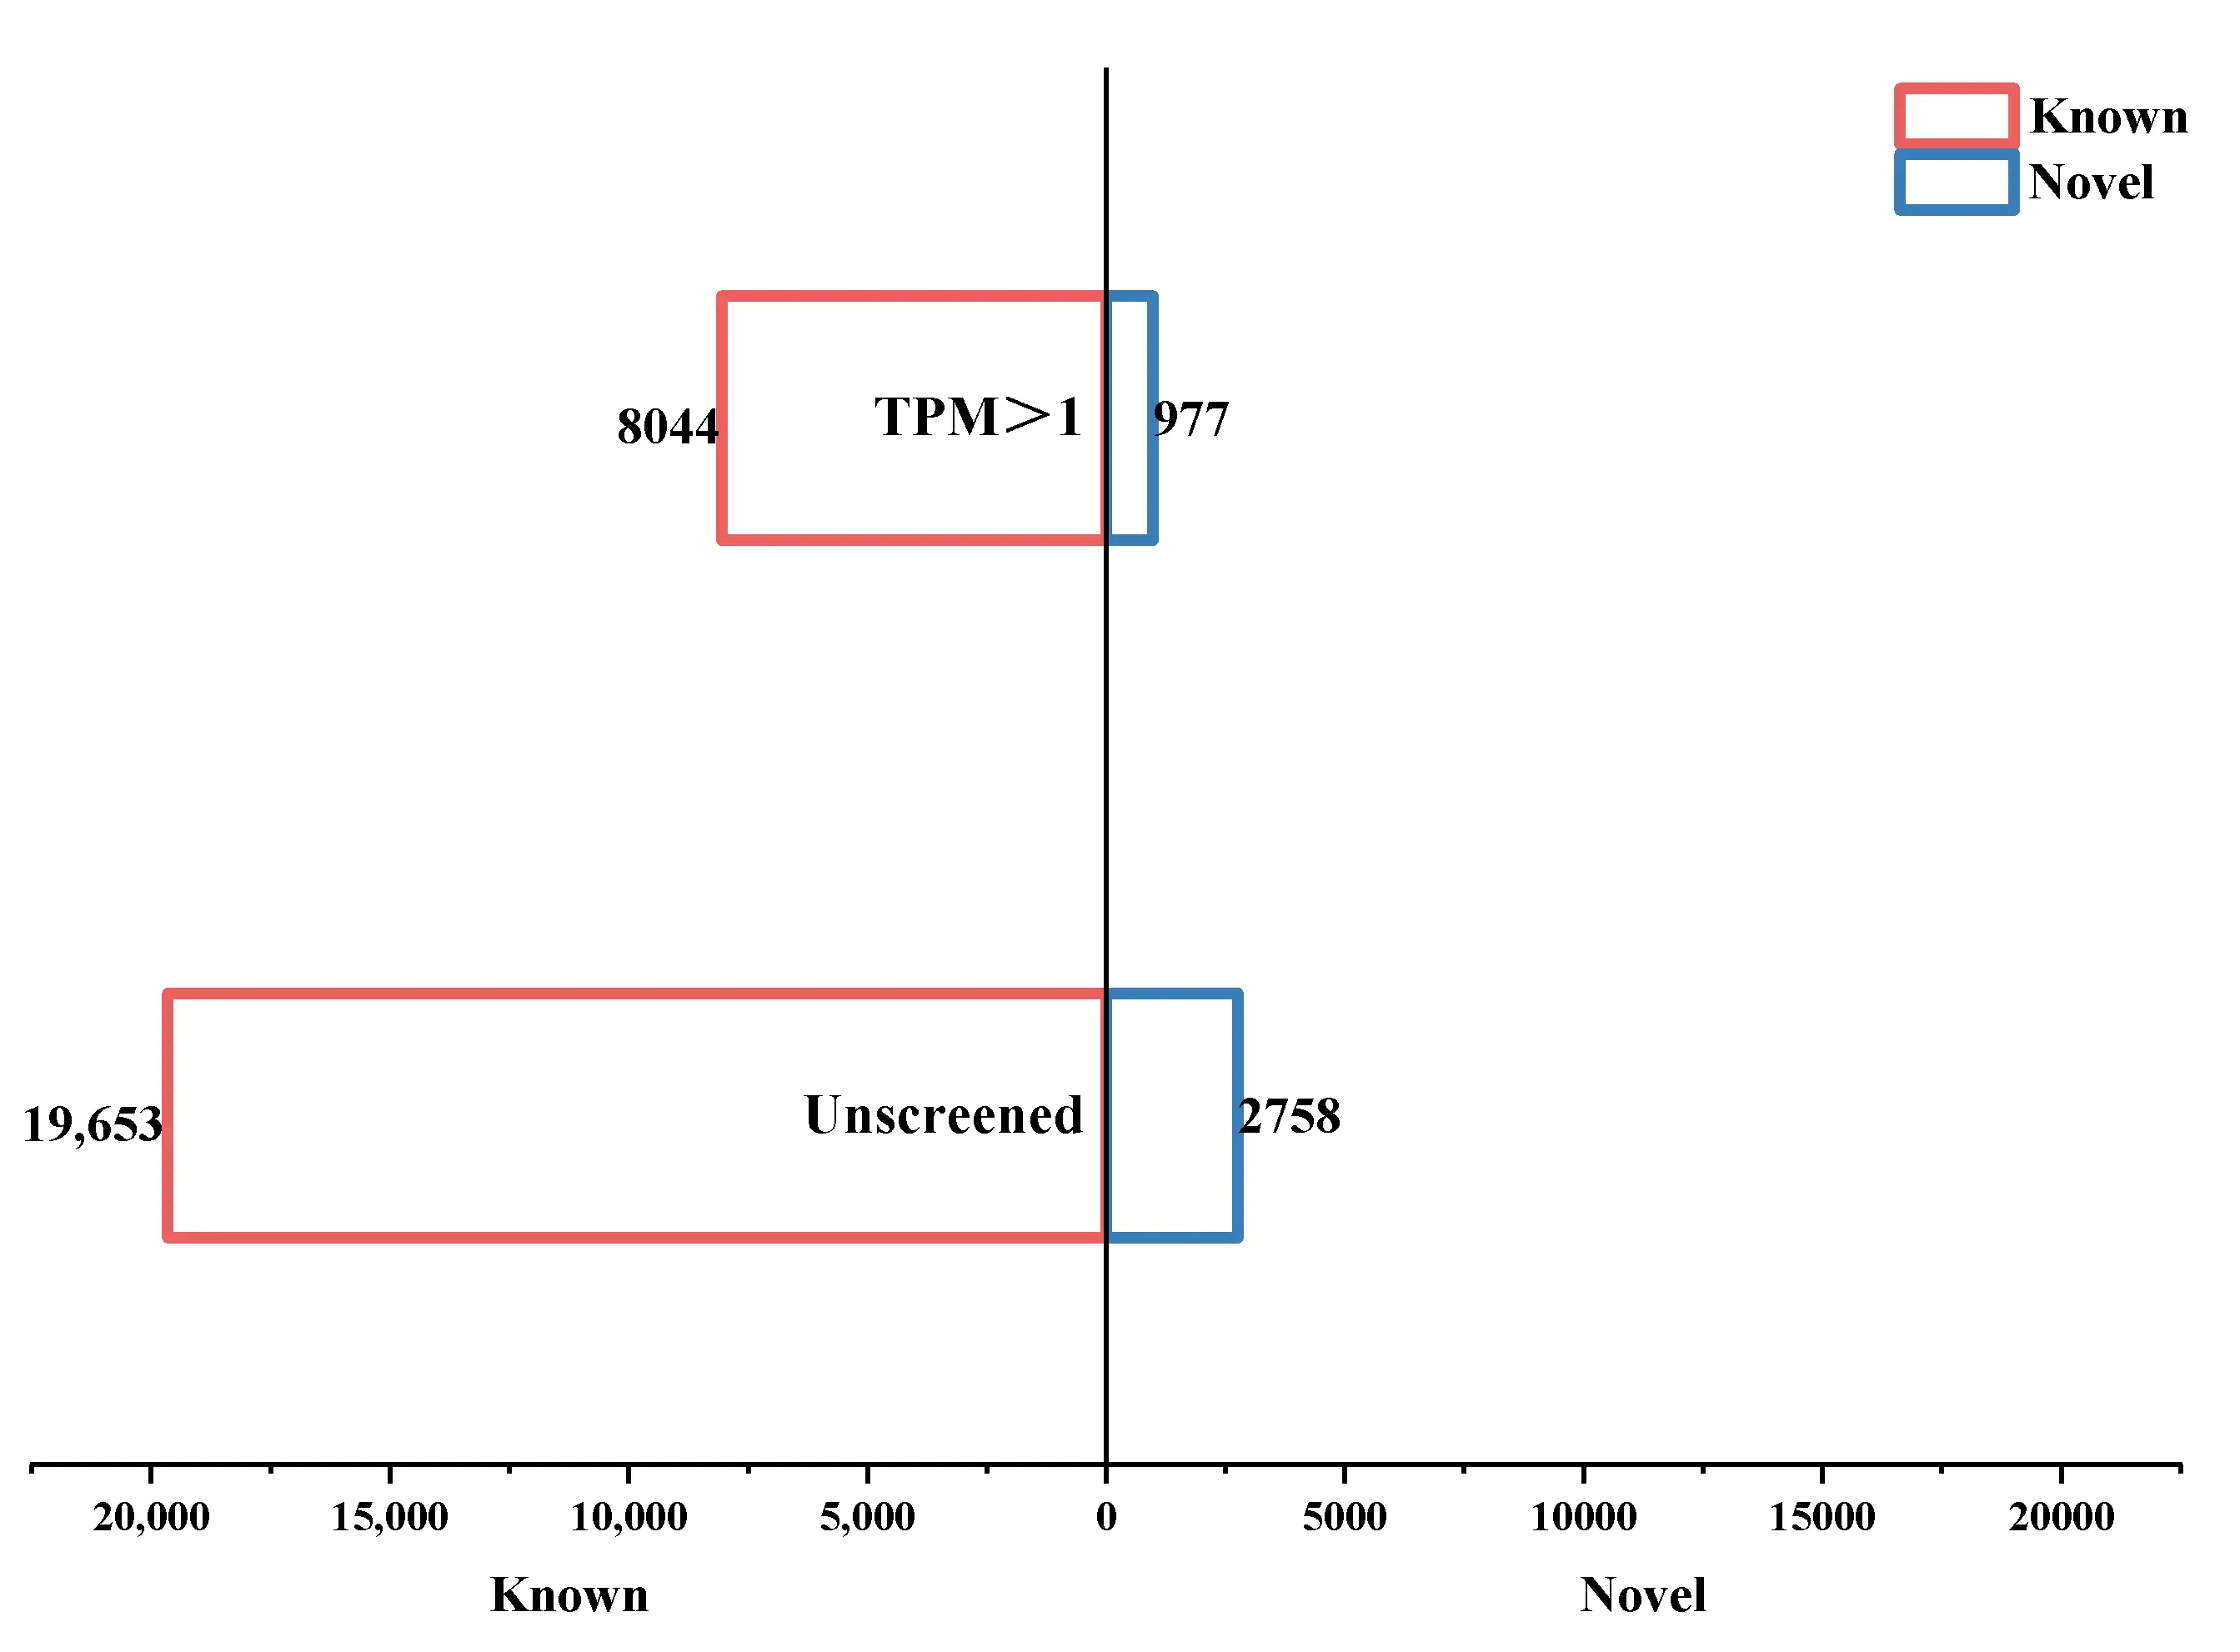
Figure 2. Bar chart depicting transcript statistical. The histogram below the X-axis is the unscreened transcript histogram, while the histogram above the X-axis is the histogram screened by TPM > 1. The red histogram on the left of the Y-axis indicates the known transcripts, and the blue histogram on the right of the Y-axis indicates the novel transcripts.
3.4. Differential Expression Analysis
Taking 30 d as the control group, differential expression analysis of the transcripts with TPM > 1 was performed, and 1322 differentially expressed transcripts—1125 known and 197 novel—were identified (Table S3). Of these, 978 were upregulated, and 344 were downregulated (Figure 3A and Table 2). Of the known genes, 823 were upregulated, and 302 were downregulated. Of the novel genes, 155 were upregulated, and 42 were downregulated (Figure 3B and Table S3).
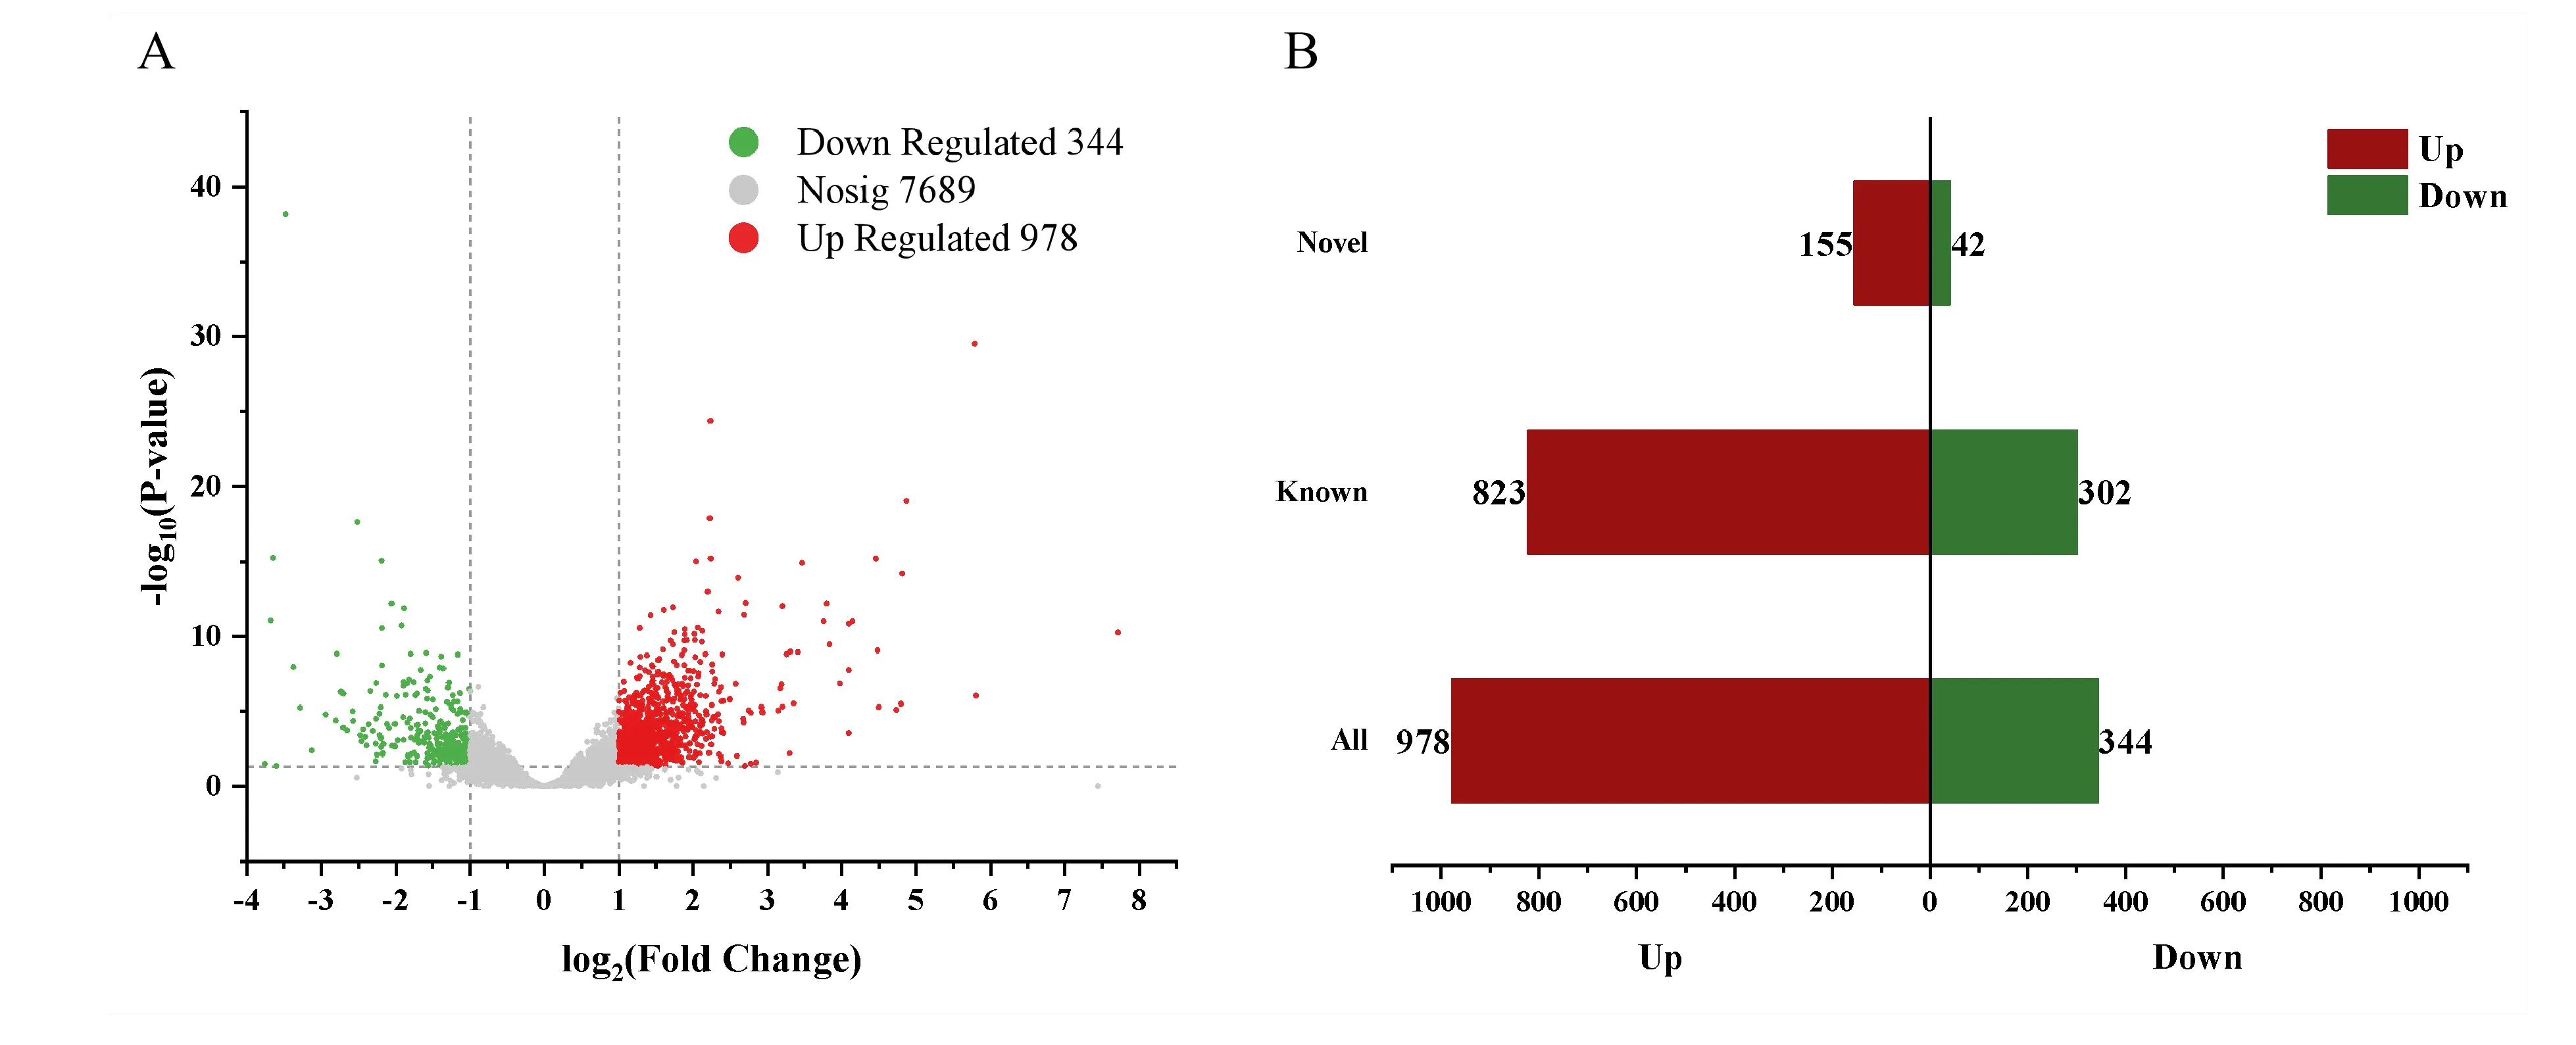
Figure 3. Differential expression analysis of transcripts of LD in two stages. (A) Volcano plot of transcripts. (B) Histogram showing the classification of differentially expressed transcripts.
3.5. GO Function Annotation and Enrichment Analysis of Differentially Expressed Transcripts
GO annotation and enrichment analyses were carried out on 1322 differentially expressed transcripts, and 22 biological processes, 16 cellular components, and 13 molecular functions were annotated (Table S4). The top 20 GO terms included nine biological processes (cellular process, biological regulation, metabolic process, cellular component organisation or biogenesis, response to stimulus, developmental process, localisation, multicellular organismal process, and immune system process), four molecular functions (binding, catalytic activity, transcription regulator activity, and molecular function regulator), and seven cell components (cell part, organelle, organelle part, protein-containing complex, membrane part, membrane, and extracellular region part) (Figure 4A). GO enrichment analysis revealed that 23 transcripts were enriched in 19 biological processes related to muscle development and function (Figure 4B and Table S5). The biological processes mainly involved skeletal muscle fibre adaptation, striated muscle contraction, muscle fibre development, skeletal muscle contraction, negative regulation of muscle cell apoptosis, skeletal muscle tissue regeneration, and skeletal muscle cell differentiation (Figure 4B). Twenty-three transcripts—17 known and six novel—were related to muscle development (Figure 4C), of which 19 were up-regulated and four were down-regulated (Table S6).
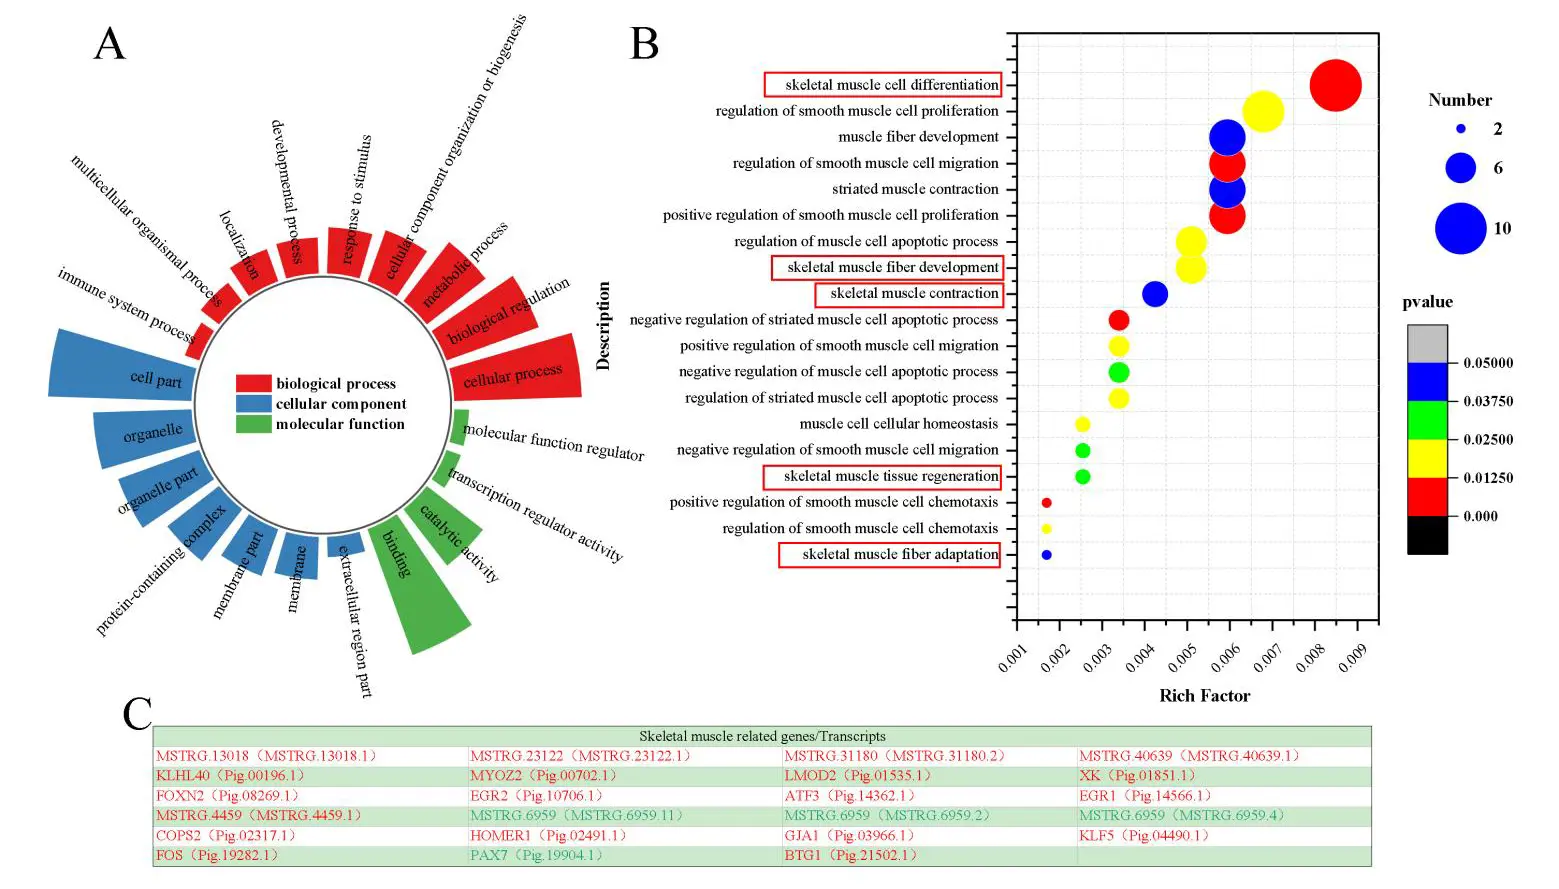
Figure 4. GO annotation and enrichment analysis. (A) The top 20 GO terms of differentially expressed transcripts were analysed by GO annotation. (B) Muscle-related GO (red frames) enrichment analysis bubble diagram. (C) Table presenting skeletal muscle-related genes/transcripts, red font means up-regulated, and green font means down-regulated.
3.6. KEGG Enrichment Analysis of Muscle-Related Differential Expression Transcripts
The KEGG enrichment results of the 23 muscle-related differentially expressed transcripts showed that they were mainly enriched in five processes: environmental information transduction processes, cell processes, genetic information processes, human diseases, and tissue systems (Table S7). The top 20 pathways were enriched in FoxO, MAPK signalling, gap connection, human T-cell leukaemia virus 1 infection, hepatitis B, protein disease, parathyroid hormone synthesis, secretion, and response, and glutamatergic synapses (Figure 5A).
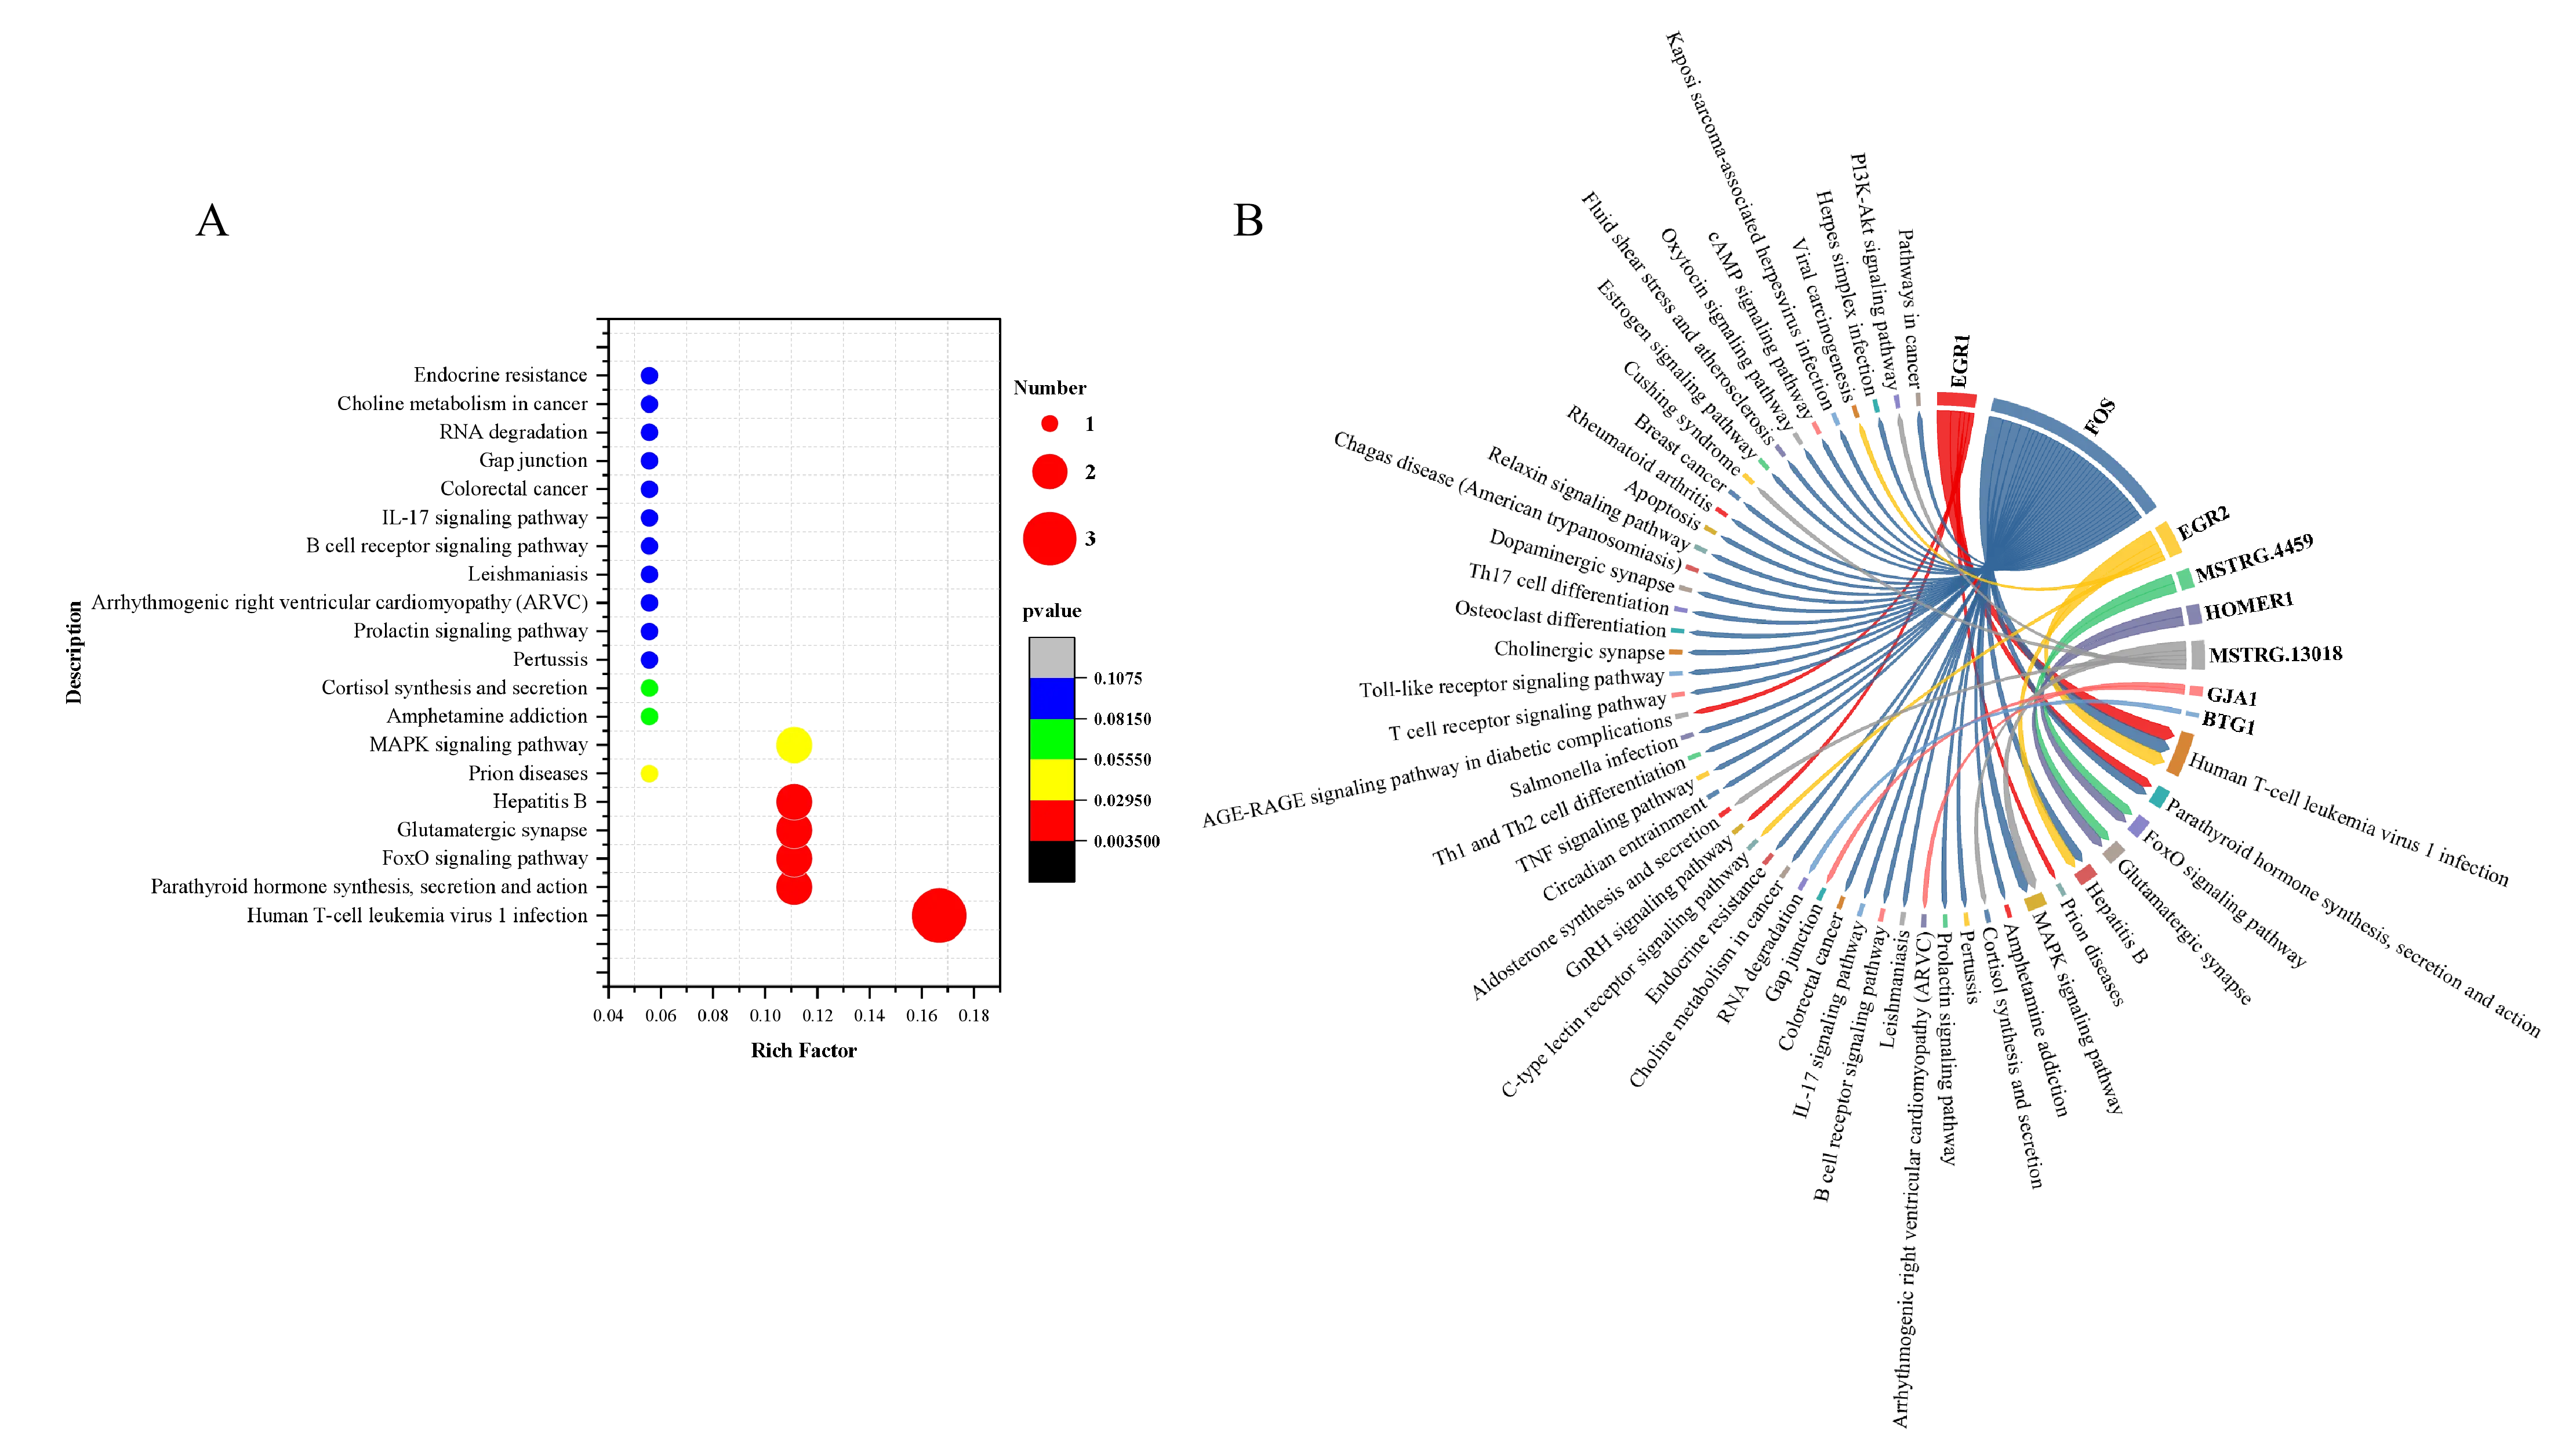
Figure 5. KEGG enrichment analysis of skeletal muscle-related differentially expressed transcripts. (A) Bubble diagram showing the top 20 results of KEGG enrichment. (B) Gene-pathway proportional chord diagram; the chord starting point is the gene, and the chord ending point is the pathway corresponding to the gene.
Further analysis showed that eight genes (EGR1, MSTRG.4459, FOS, MSTRG.13018, GJA1, BTG1, EGR2, HOMER1) were enriched mainly in the FoxO, MAPK, TNF, IL-17, cAMP, and PI3K-Akt signal pathways (Figure 5B). Therefore, they may regulate muscle development via these signalling pathways.
3.7. Analysis of Muscle-Related Proteins by PPI and Transcription Factors
To further explore the interactions of the 15 known muscle-related proteins, PPI analysis was performed in humans, mice, and pigs. The analysis yielded 11, 10, and 10 protein interactions in humans, mice, and pigs, respectively (Figure 6A–C). Among the three species, the most stable protein interactions were the EGR1-EGR2-FOS-ATF3-HOMER1-KLF5 and MYOZ2-KLHL40-LOMD2 interaction networks (Figure 6D).
To explore the regulatory mode among the 15 muscle-related genes, TF analysis was performed, and proteins encoded by eight genes were identified as transcription factors. These genes included KLF5, COPS2, FOXN2, EGR2, ATF3, EGR1, FOS, and PAX7. Further analysis revealed interactions between KLF5, EGR2, ATF3, EGR1, and FOS among the eight transcription factors (Figure 6E).
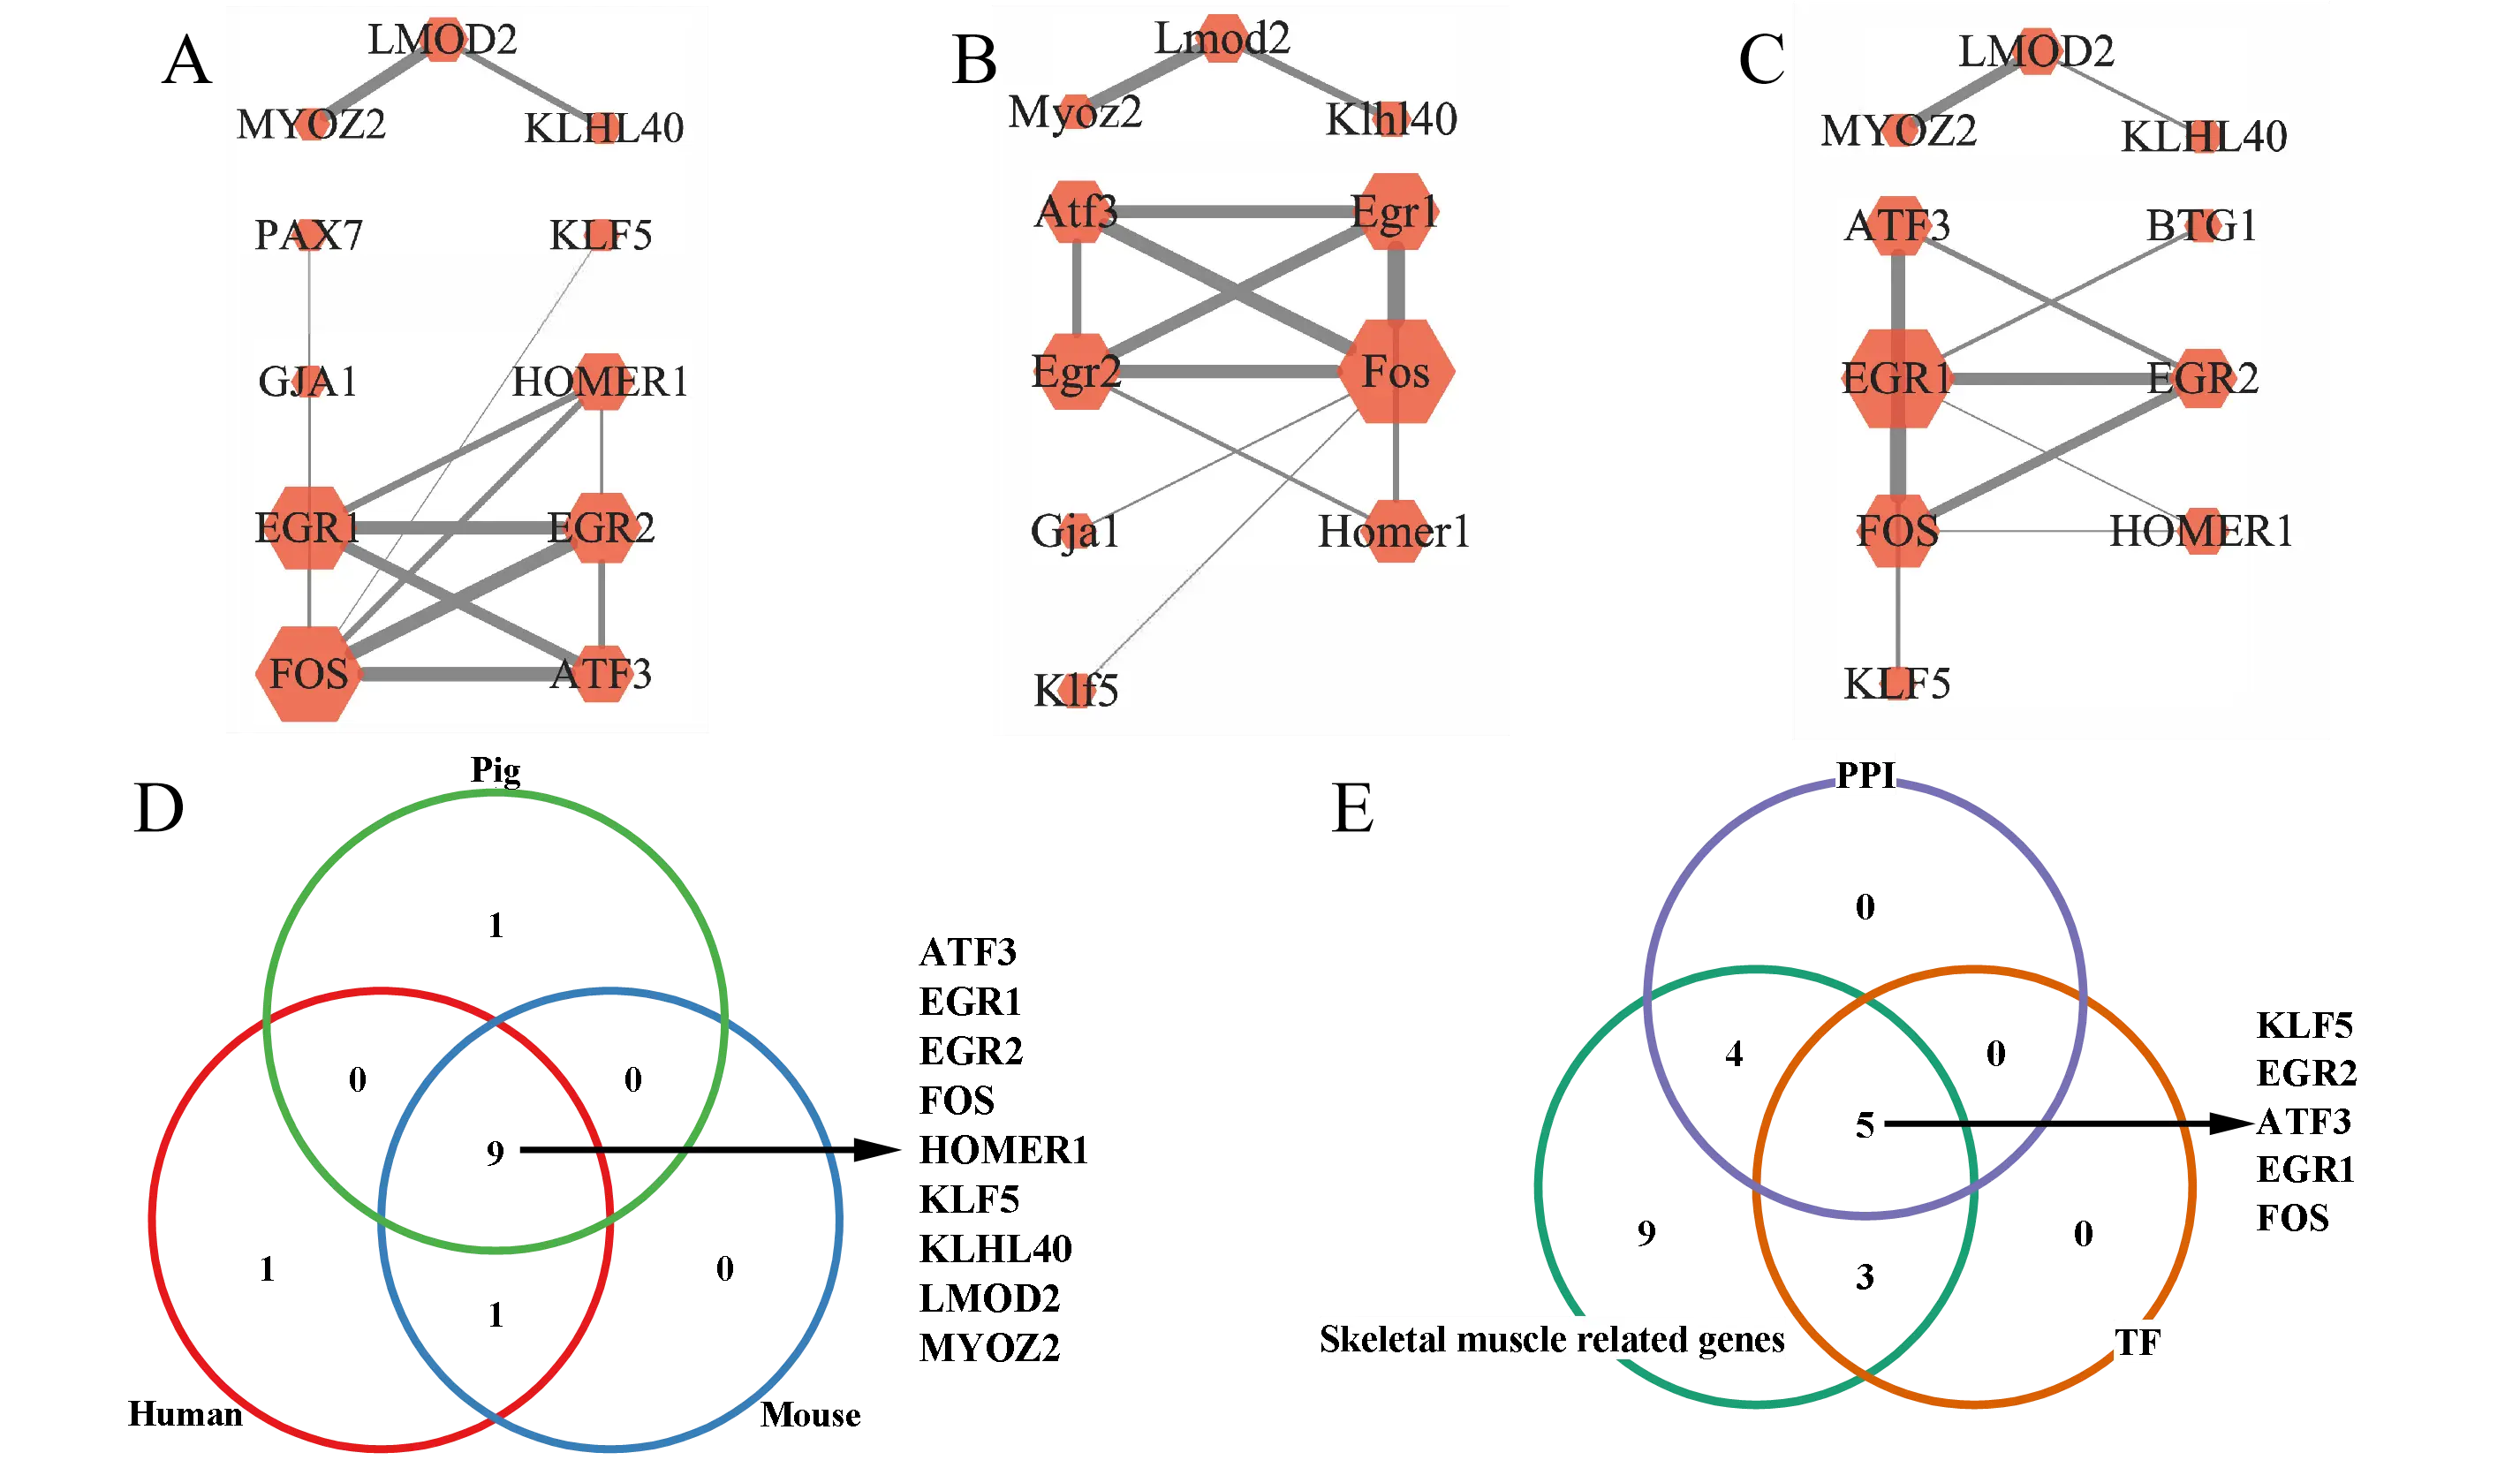
Figure 6. Results from PPI analysis of skeletal muscle-related differentially expressed genes. (A–C) are PPI networks of skeletal muscle-related genes in humans, mice, and pigs. (D) Venn diagram analysis of human, mouse, and pig PPI. (E) Venn diagram analysis of skeletal muscle-related genes, transcription factors, and proteins in PPI.
3.8. Verification of RNA-Seq by qPCR
The qPCR verification of five randomly selected up-regulated and two down-regulated genes was consistent with the sequencing trend (Figure 7). These results indicated that the sequencing data were highly reliable.
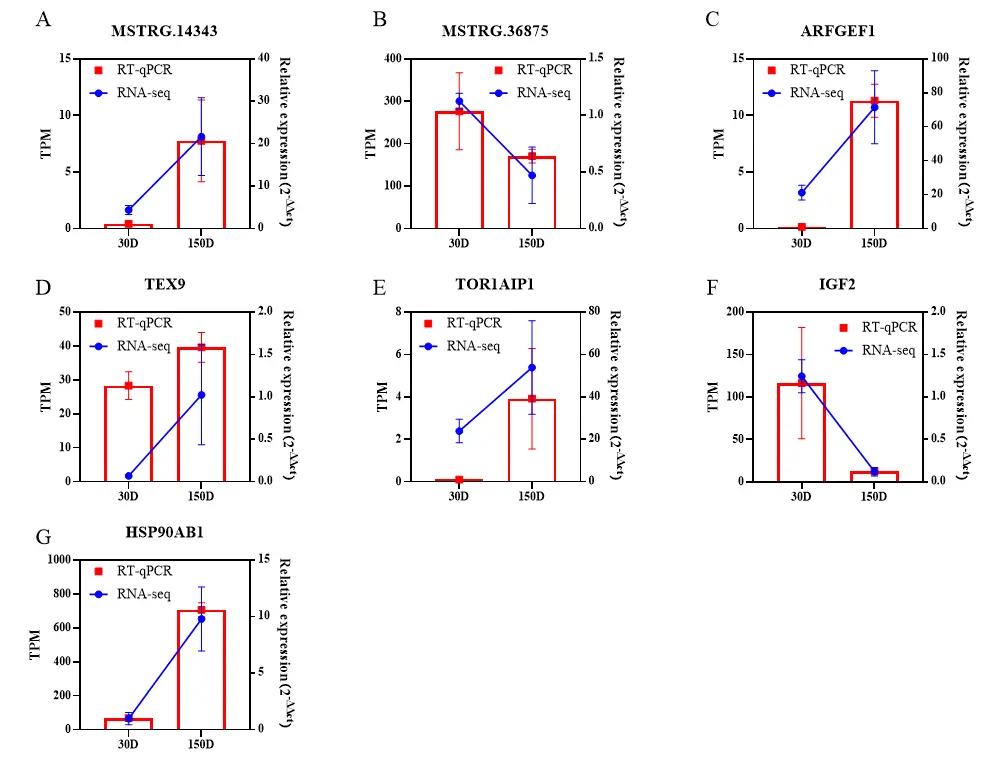
Figure 7. qPCR verification of RNA-seq differential expression genes. The histogram depicts the result of qPCR, and the line chart depicts the result of RNA-seq. The gene name is shown on the title of the X-axis. The expression levels yielded by RNA-seq and qPCR are shown on the left Y-axis and the right Y-axis, respectively. (A) MSTRG.14343; (B) MSTRG.36875; (C) ARFDEF1; (D)TEX9; (E) TOR1AIP1; (F) IGF2; (G) HSP0AB1.
3.9. Expression Pattern of Homer1
We detected the mRNA expression level of Homer1 in the longissimus muscle of Ningxiang pig at four development stages (30, 90, 150, 210 days after birth) by RT-qCPR. The results showed that the expression level of Homer1 increased gradually with the increase of age, and the expression level increased significantly at the age of 150 days (p < 0.01) (Figure 8A). The phenotypic analysis also found that the muscle fiber diameter increased significantly, which suggested that Homer1 might play an important regulatory role at this stage. To further clarify whether the expression of Homer1 is tissue-specific, we detected the mRNA expression level of homer1 in the heart, liver, spleen, lung, kidney, fat, and muscle of 150-day-old Ningxiang pigs. Compared with the heart, it was found that the expression level of Homer1 in liver and kidney was significantly higher than that in the heart (p < 0.01). There was no difference in the expression level in muscle and heart (Figure 8B). The expression of Homer1 in the LD was detected by immunofluorescence analysis, and it was found that the fluorescence of Homer1 labeled in the LD increased significantly at 150d compared with 30d (Figure 8C).
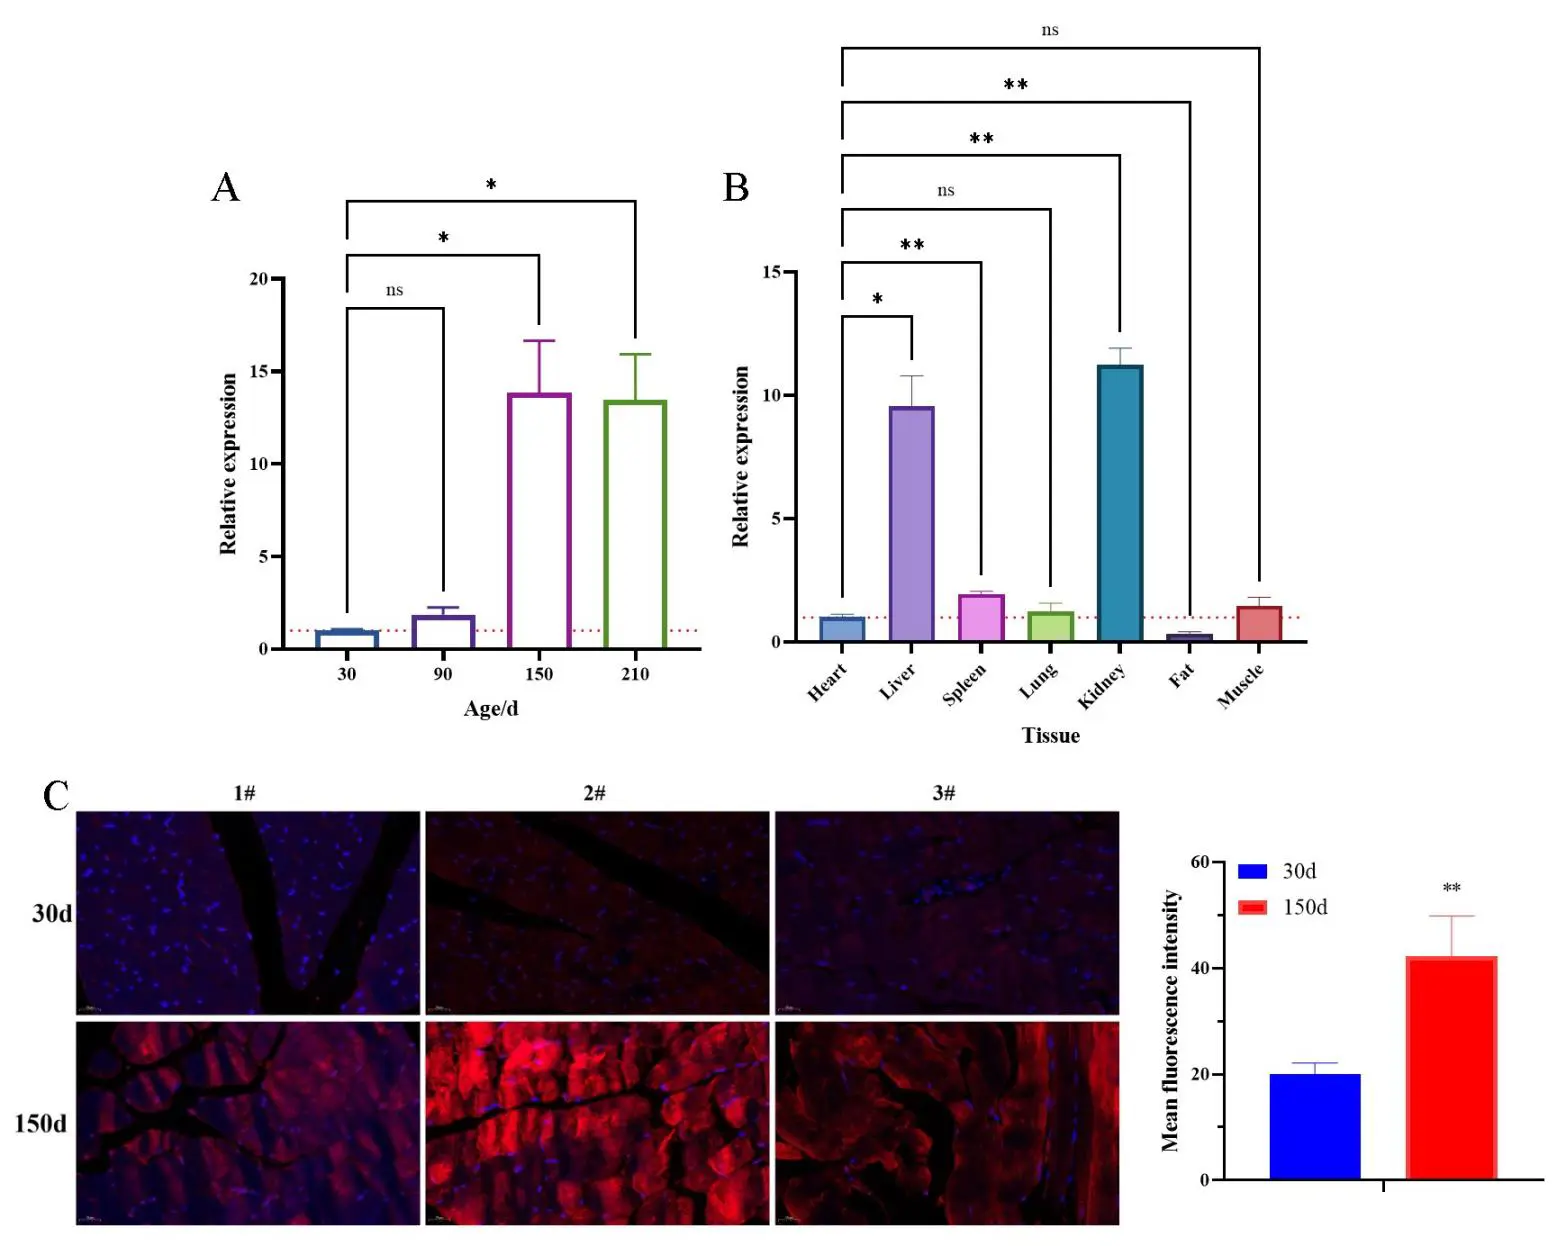
Figure 8. Pattern of time series (A,C) and tissue (B) gene expression of homer1 via RT-qPCR and IF, Homer1 labled 570, scale bar is 25 μm, 1-3# represent different Ningxiang pigs, * p < 0.05, ** p < 0.01, ns > 0.05, n = 3.
3.10. Gene Overexpression and Interference Efficiency Detection
Gene overexpression and interference efficiency test revealed that among the three overexpression transfection schemes, 5 μL Lipofectamine was used to transfect a 2.5 μg overexpression plasmid. The mRNA expression level of HOMER1 was significantly increased (p < 0.001), with an overexpression efficiency of over 58-fold (Figure 9A). Among the four interference schemes, the mRNA expression level of HOMER1 was significantly reduced (p < 0.001) after transfection with 50 nM siRNA1, and the interference efficiency reached 79.64% (Figure 9B). The optimal transfection scheme involved transfecting 2.5 μg of overexpression plasmid and 50 nM siRNA1 using 5 μL lipofectamine. This setup was used for subsequent functional verification experiments.
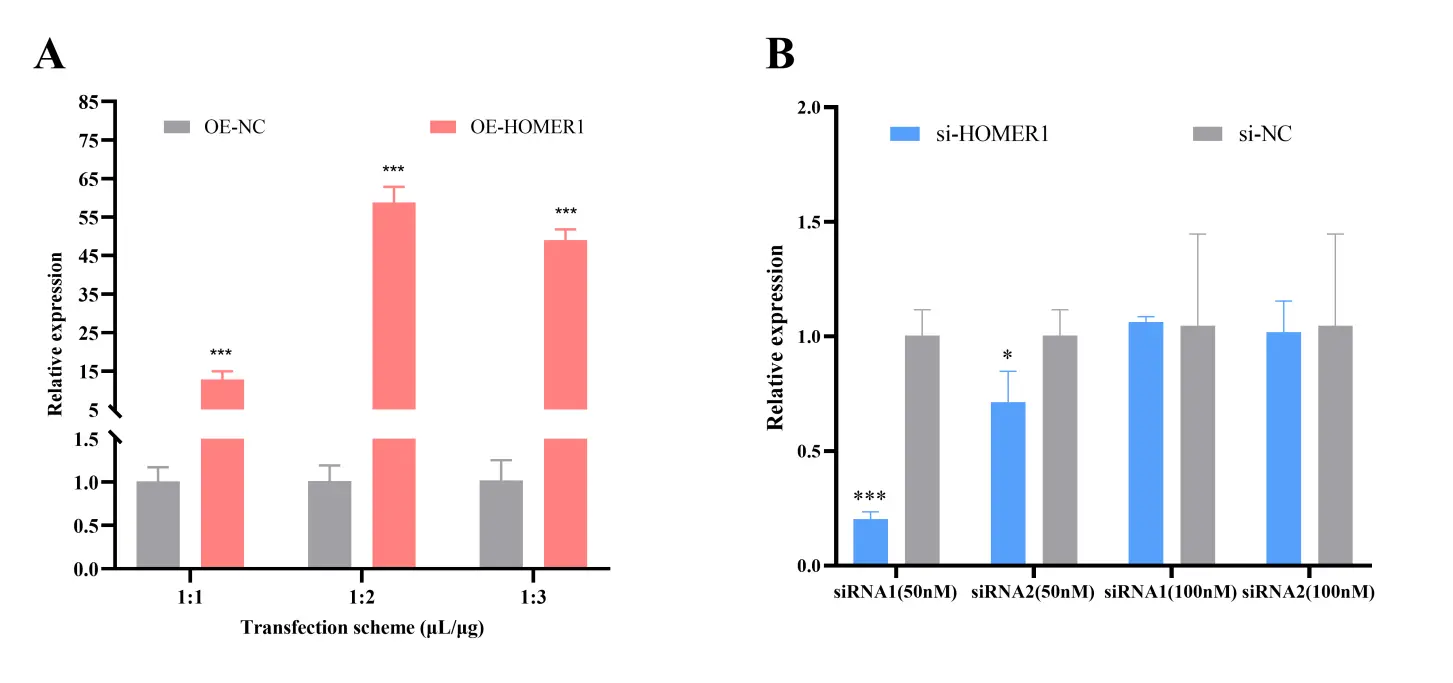
Figure 9. Analysis of overexpression (A) and interference efficiency (B) of Homer1 gene. * p < 0.05, *** p < 0.001, n = 3.
3.11. Homer1 Promotes Myoblast Proliferation
To verify the effects of HOMER1 on myoblast proliferation, HOMER1 siRNA1 (si-HOMER1), siRNA negative control (si-NC), pORP-HOMER1 (OE-HOMER1), and pORP (OE-NC) were transfected into myoblasts. The mRNA expression levels of proliferation marker genes (Ccna2, Ccnd1, Cdk4, Pcna) in the OE-HOMER1 group were significantly higher than those in the OE-NC group (p < 0.05) (Figure 10A), and the opposite result was obtained after knockdown Homer1 (Figure 10B). Western blot analysis showed that the protein expression levels of PCNA, CCNA, and CDK4 were markedly higher in the OE-HOMER1 group than in the OE-NC group (p < 0.01). In contrast, the opposite results were obtained after knocking down Homer1 (Figure 10G). The results of the CCK8 and EdU assays showed that the proliferation index and EdU positivity were markedly higher in the OE-HOMER1 group than in the OE-NC group (p < 0.01, Figure 10C,F), and the opposite was observed after the knockdown (Figure 10D,E). Flow cytometry analysis showed that the proportion of S-phase cells was significantly higher in the OE-HOMER1 group than in the OE-NC group (p < 0.05; Figure 10H). HOMER1 knockdown significantly increased the proportion of cells in the G1 phase (p < 0.01) and decreased the proportion of cells in the S and G2 phases. (p < 0.05, Figure 10I). In summary, HOMER1 promoted myoblast proliferation.
3.12. HOMER1 Does Not Affect Myoblast Apoptosis
To verify the effect of Homer1 on myoblast apoptosis, myoblasts were transfected with an overexpression plasmid and an interference sequence. qPCR results showed no significant differences in the mRNA expression levels of Bax, BCL2, and Casp3 between the OE-HOMER1 and OE-NC groups (p > 0.05, Figure 11A), and knockdown of Homer1 had no significant effect on myoblast apoptosis (p > 0.05, Figure 11B). Flow cytometry analysis showed no significant differences between the OE-HOMER1 and OE-NC groups in the cell proportion of Q1, Q2, Q3, and Q4 (p > 0.05, Figure 11C). There was no significant difference in the cell proportion of each region after knockdown (p > 0.05, Figure 11D). These results indicate that Homer1 does not affect myoblast apoptosis.
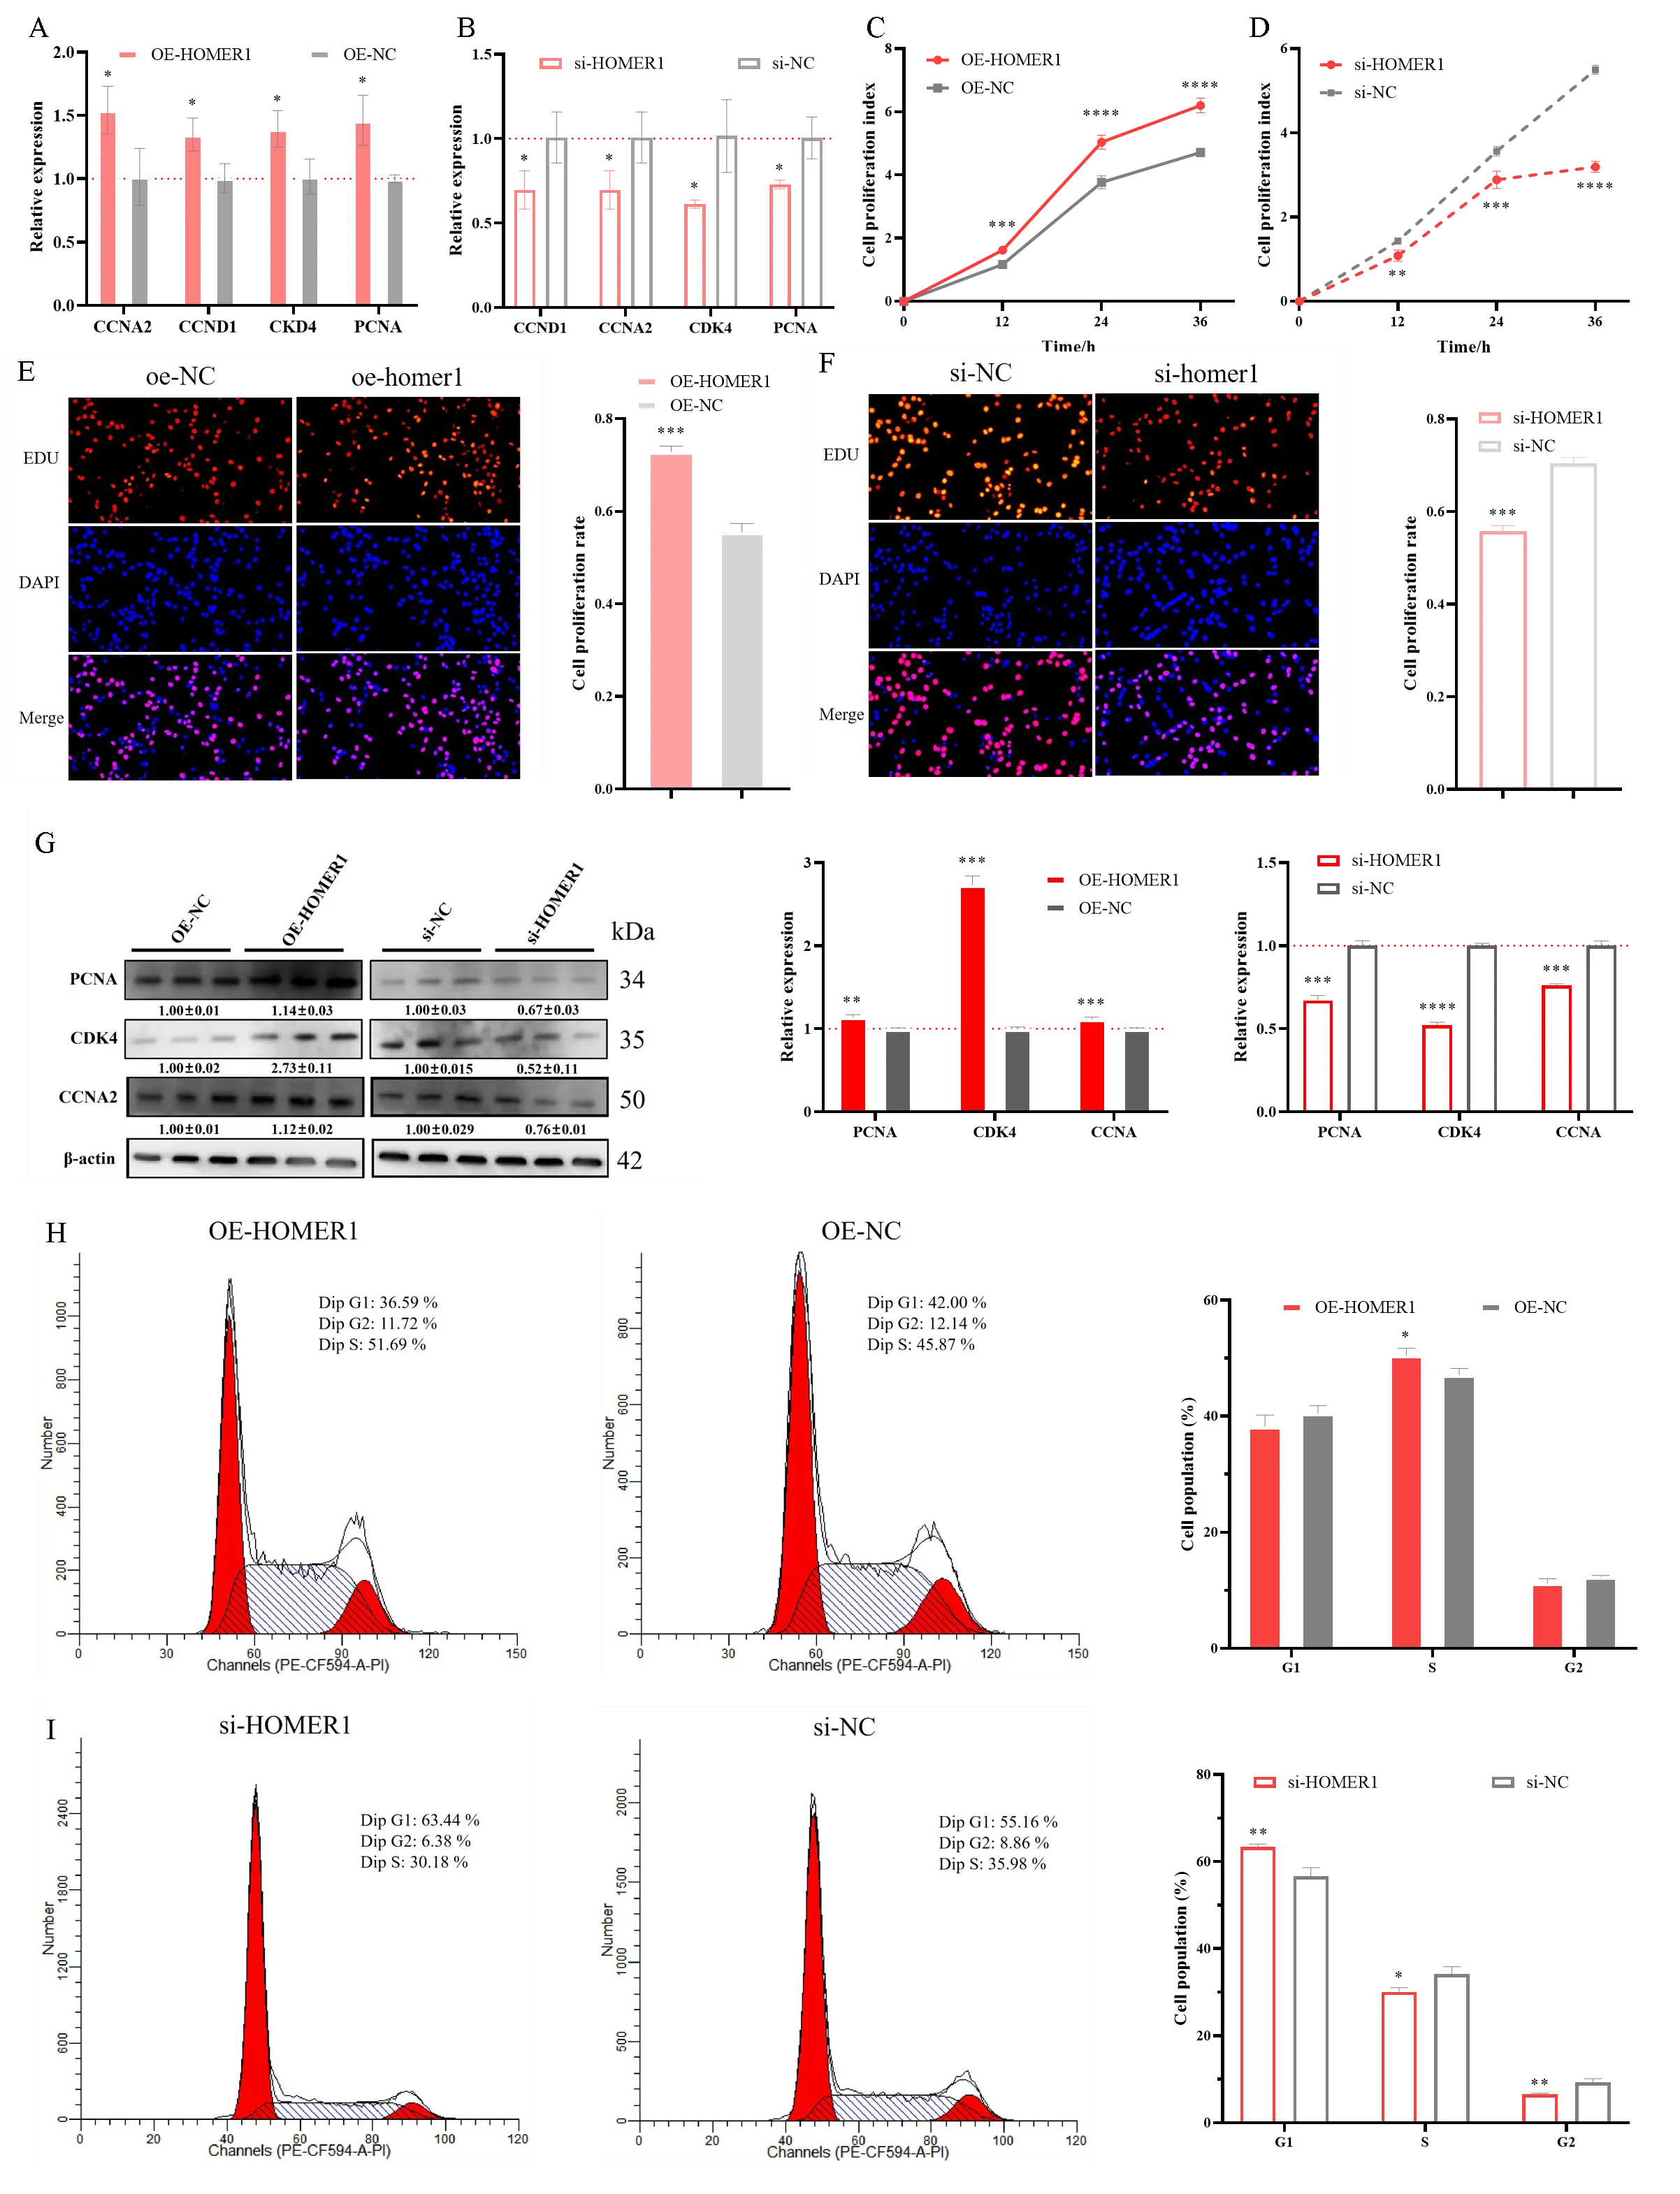
Figure 10. The effect of Homer1 on the proliferation of myoblasts. qPCR was used to detect the mRNA expression level of proliferation marker genes (Ccna2, Ccnd1, Cdk4, Pcna) after overexpression and knockdown of Homer1 (A,B). CCK8 was used to detect the cell proliferation rate (C,D). EdU staining was used to detect the positive cell rate; scale bar = 100 μm (E,F). Western blotting was used to analyse the proliferation marker proteins (Pcna, Cdk4, Ccna2). (G) Western-Bloting was used to detect the protein expression level of proliferation marker genes (PCNA, CDK4, PCNA) after overexpression and knockdown of Homer1. (H,I) The cell cycle of overexpressed or interfered with homer1 was detected by flow cytometry. * p < 0.05, ** p < 0.01, *** p < 0.001, **** p < 0.0001, n = 3.
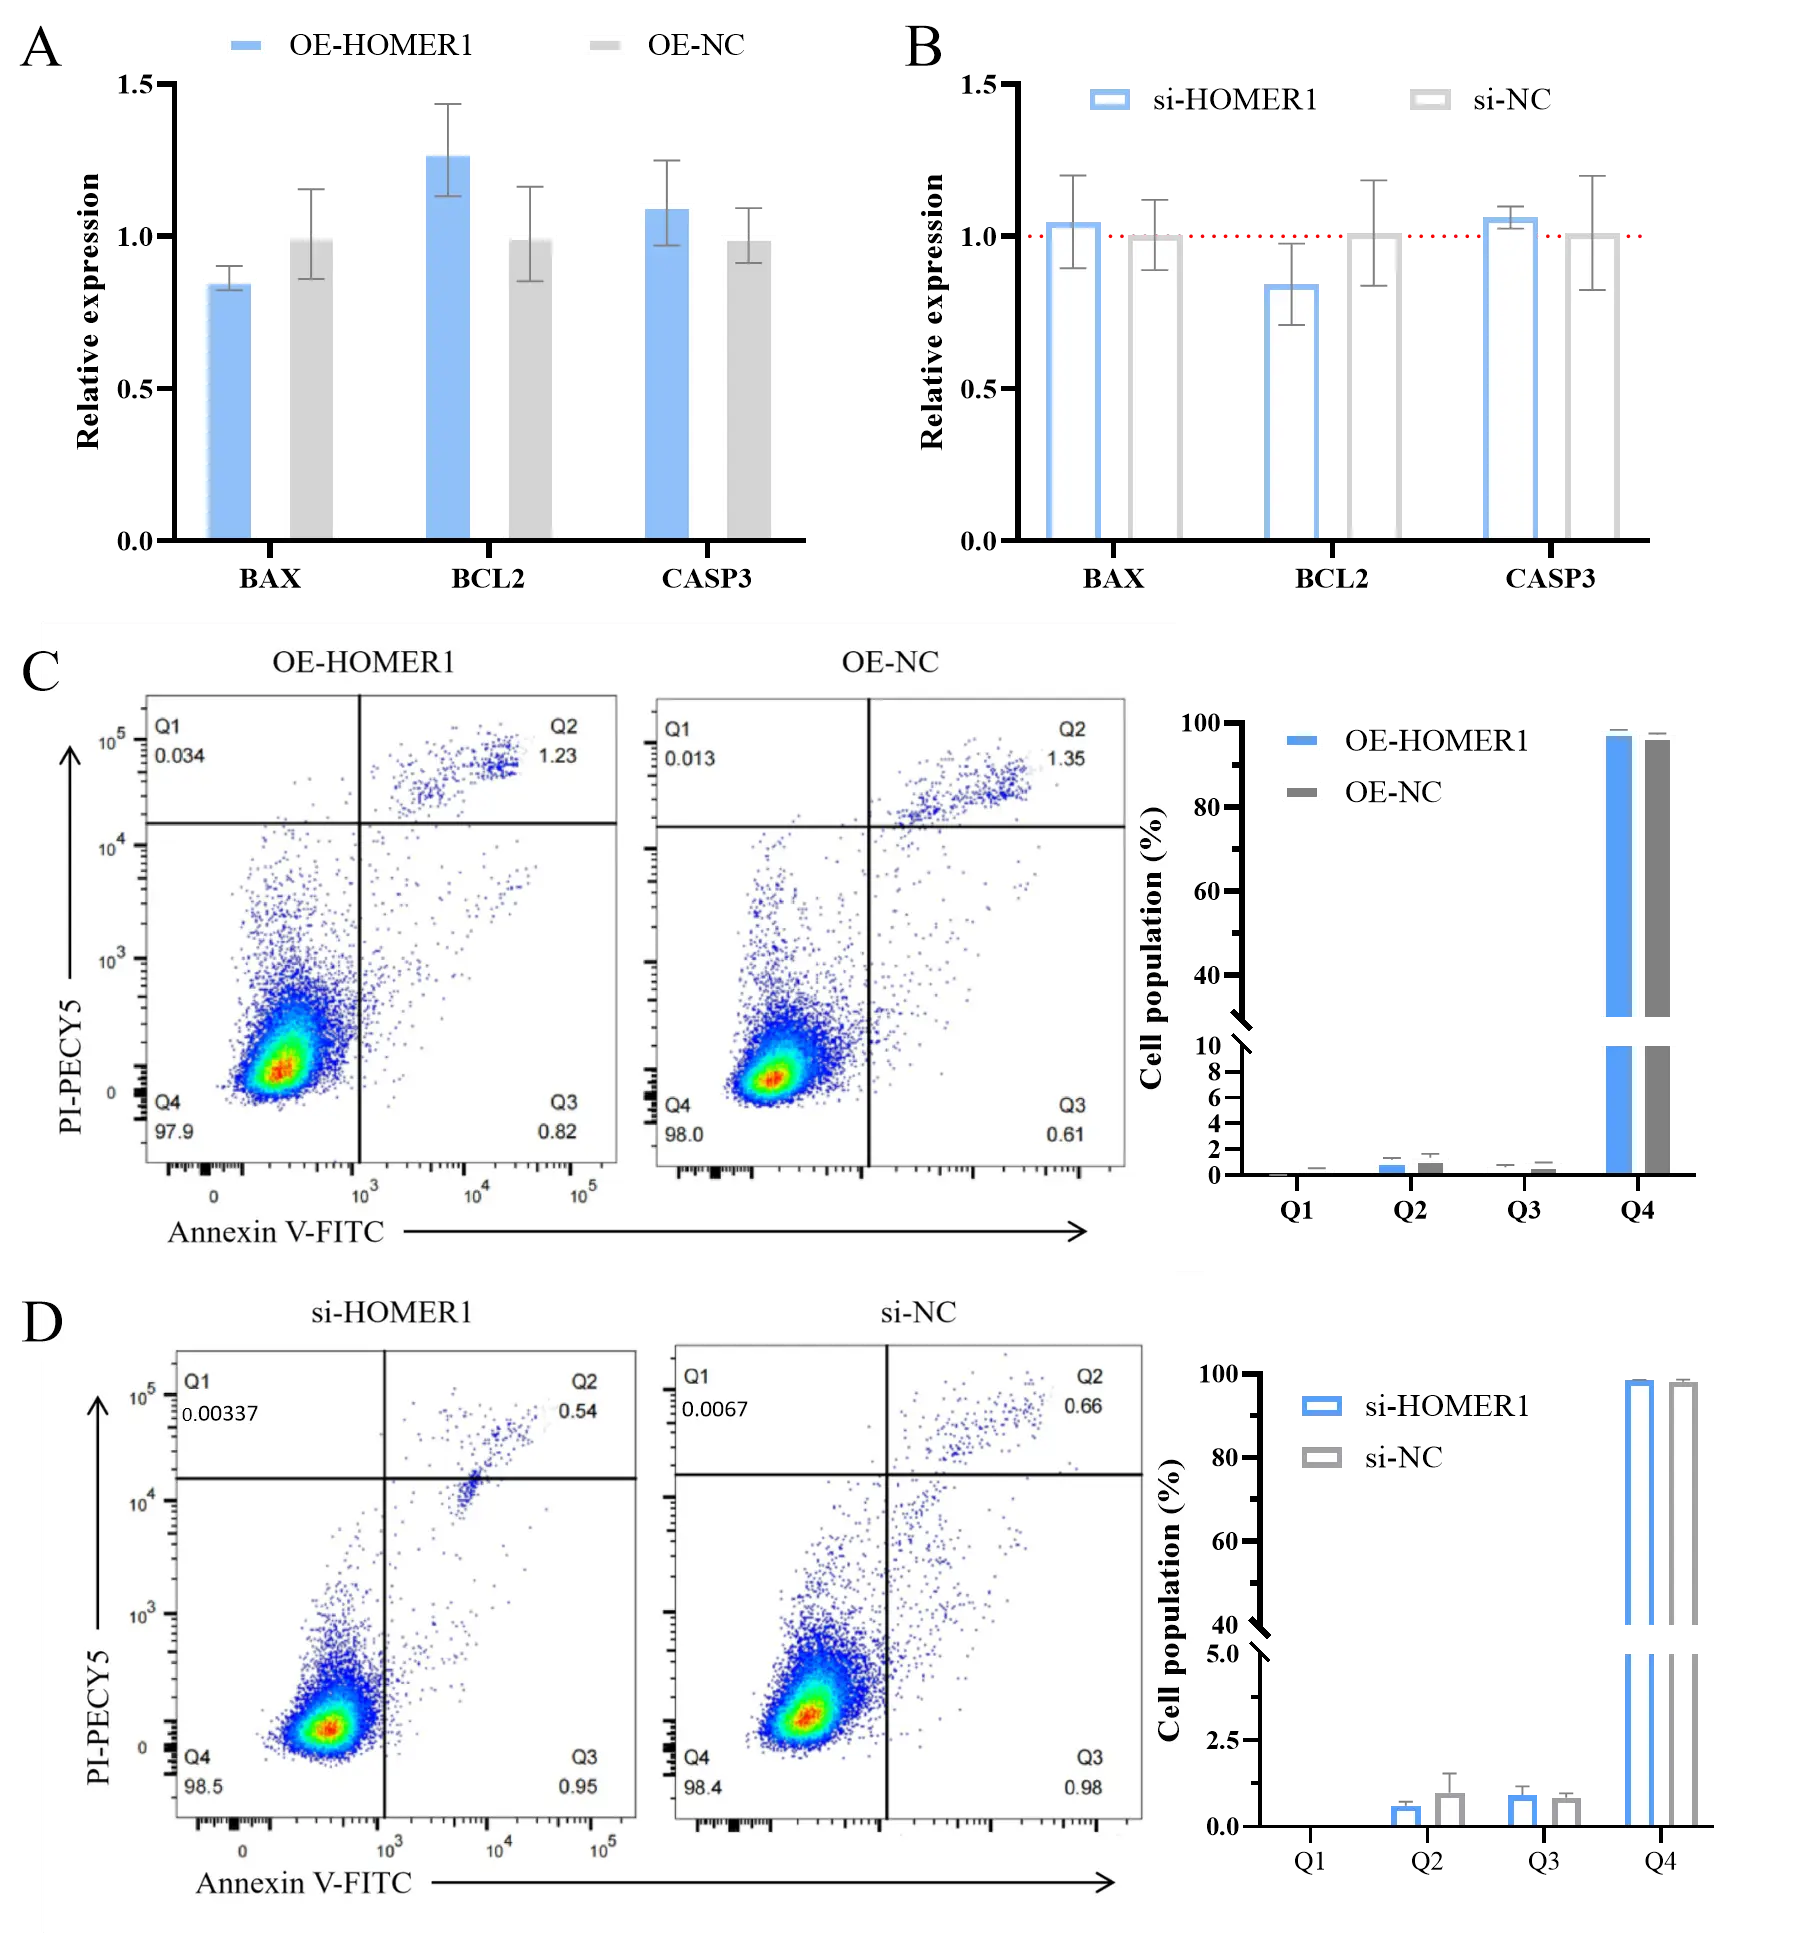
Figure 11. The effect of Homer1 on myoblast apoptosis. After overexpressing and knocking down Homer1, the mRNA expression level of apoptosis marker genes (Bax, Bcl2, Casp3) was detected (A,B) via qPCR, and the proportion of apoptotic cells was detected by flow cytometry (C,D). n = 3.
3.13. HOMER1 Promotes Myoblast Differentiation and Fusion
After transfection with the expression plasmid and a small interfering sequence, parameters related to differentiation marker genes and muscle fibre fusion were detected. Overexpression of Homer1 significantly increased the mRNA expression levels of differentiation marker genes (MyHC, Myod, Myf5, Moyg) (p < 0.05, Figure 12A), and the opposite result was obtained after knocking down the Homer1 gene (p < 0.05, Figure 12B). The analysis of induced differentiation showed that the differentiation index of the OE-HOMER1 group was significantly higher than that of the OE-NC group, while that of the si-HOMER1 group was significantly lower than that of the si-NC group (p < 0.05, Figure 12C–E). As shown in Figure 12C,D,F, the proportion of myotubes with fewer than three nuclei in the OE-HOMER1 group was significantly higher than that in the OE-NC group (p < 0.01), and the proportion of myotubes with 3–5 nuclei was significantly lower than that in the OE-NC group (p < 0.01); however, there was no significant difference in the proportion of myotubes with more than five nuclei (p > 0.05). The proportion of myotubes with fewer than three nuclei in the si-HOMER1 group was significantly higher than that in the si-NC group (p < 0.05), and the proportion of myotubes with to 3–5 nuclei and myotubes with more than five nuclei was significantly lower than that in the si-NC group (p < 0.01). These results indicate that HOMER1 promotes myodifferentiation and muscle fibre fusion.
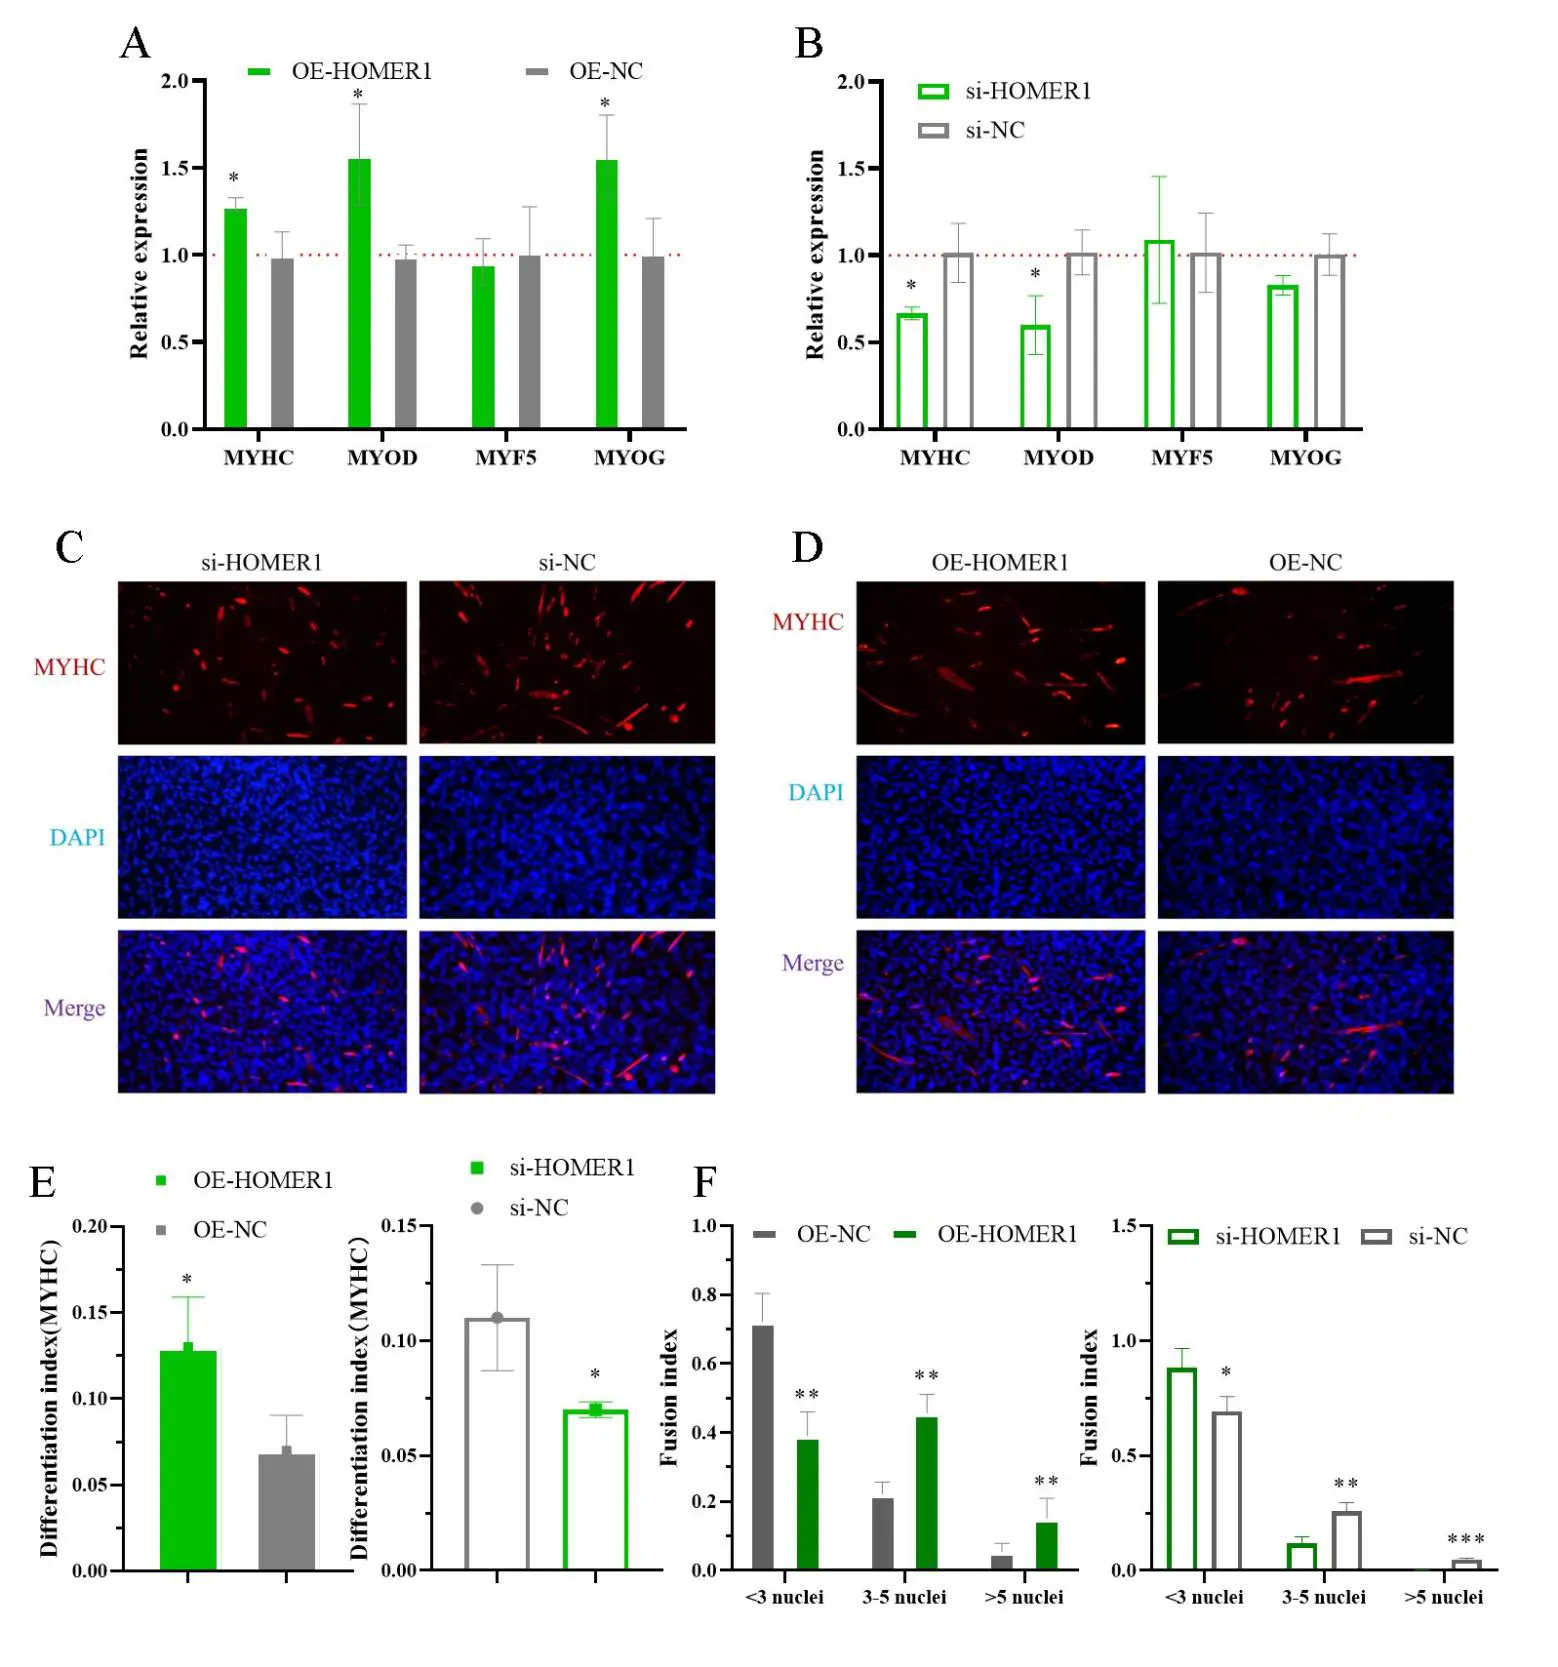
Figure 12. Homer1 promotes myoblast differentiation. After overexpressing and knocking down Homer1, the mRNA expression level of differentiation marker genes (A,B) was detected by qPCR, and the differentiation and fusion index of cells was detected by immunofluorescence staining; scale bar = 200 μm (C–F). * p < 0.05, ** p < 0.01, *** p < 0.001, n = 3.
4. Discussion
In this study, we identified 15 known (LMOD2, MYOZ2, FOS, COPS2, FOXN2, EGR1, ATF3, PAX7, XK, KLHL40, GJA1, KLF5, BTG1, EGR2, and HOMER1) and six novel genes (MSTRG.13018, MSTRG.23122, MSTRG.31180, MSTRG.40639, MSTRG.4459, and MSTRG.6959) related to muscle development and function by transcriptome sequencing, differential expression analysis, GO annotation, and GO enrichment analysis. KEGG enrichment analysis revealed eight genes enriched in the FoxO, MAPK, GnRH, TNF, cAMP, PI3K-Akt, and other signal pathways, indicating that these pathways may be the key to regulating skeletal muscle development. Transcription factor analysis showed that KLF5, COPS2, FOXN2, EGR2, ATF3, EGR1, FOS, and PAX7 are transcription factors, and PPI analysis revealed a significant interaction between EGR1-EGR2-FOS-ATF3-HOMER1-KLF5 and MYOZ2-KLHL40-LOMD2, suggesting their participation in the growth and development of skeletal muscle by encoding transcription factors.
Several genes tightly regulate skeletal muscle development. With the progress in gene detection technology and biological analysis and the deepening of functional research, more genes related to muscle development have been identified. The spatiotemporal-specific expression of genes suggests that they play an important role in biological development. In the present study, we found that LMOD2 was significantly upregulated in Ningxiang pigs at 150 days of age, suggesting that it may be involved in regulating muscle development. Kiss et al. reported that LMOD2 regulates the length of thin filaments and participates in skeletal muscle energy regulation [50]. Larrinaga et al. showed that LMOD2 is necessary for skeletal muscle contraction [51]. MYOZ2 is highly expressed during the fattening period, indicating that it plays an important role in promoting muscle development. Wang et al. found that MEF2A regulates transcriptional activity by binding to the proximal promoter of MYOZ2, which promotes myogenic differentiation [52]. Zhang et al. reported that MYOZ2 inhibits the proliferation of sheep myoblasts and promotes cell fusion [53]. The gene expression of COPS2 during the fattening period was significantly higher than that during the weaning period, indicating that COPS2 plays an important regulatory role in rapid muscle growth. Alves et al. found that COPS2 was significantly decreased in rats with tumours, and overexpression of COPS2 ensured myotube homeostasis and promoted the recovery of muscle contraction function [54]. This study found that EGR1 may play an important role in muscle development in Ningxiang pigs. Previous studies have shown that EGR1 can activate SIRT1 transcription, thus eliminating the oxidative damage of reactive oxygen species to muscles [55,56]. The expression of GJA1 was significantly increased in the muscle tissue of Ningxiang pigs a 150 days of age. Shen et al. found that GJA1 deletion reduced fast muscle weight and grip strength in mice, thereby affecting the formation of the tendon intima in skeletal muscle [57,58]. Martins et al. found that GJA1 participates in the nuclear shuttling of small molecules and regulates the myogenic differentiation of myocardial cells [59]. The expression of mRNA in KLHL40 cells significantly increased during the late fattening period. Garg et al. found that KLHL40 promotes the stability of nebulin and LMOD3 and blocks their ubiquitination of LMOD3, thus inhibiting the deterioration of neuromuscular diseases [60]. Mansur et al. found that KLHL40 regulates skeletal muscle development by mediating ubiquitination [61]. Rodier et al. found that BTG1 is involved in the regulation of myoblast differentiation [62]. In this study, we found that the expression of HOMER1 increased significantly, indicating that HOMER1 plays a vital role in muscle development. Studies have shown that decreased or deleted HOMER1 levels lead to skeletal muscle atrophy or overt myopathy in mice [63], indicating that HOMER1 plays a crucial role in skeletal muscle. XK has rarely been reported in the study of muscle development. Whether the five novel identified genes participate in skeletal muscle development in Ningxiang pigs requires further verification at the cellular and individual levels.
Gene expression is the basis of gene function, and the initiation, extension, and termination of gene expression require the participation of regulatory factors, such as transcription factors. In this study, transcription factor analysis showed that eight of the proteins encoded by 15 known genes were transcription factors. FOS is a transcription factor, and differential expression analysis showed that its expression level was significantly higher at 150 days than at 30 days. FOS participates in muscle cell differentiation [64], and when its expression level decreases, myotube formation is inhibited [65]. EGR1/2 is an important member of the growth factor family and a transcription factor that is highly expressed in the muscle tissue of 150-day-old Ningxiang pigs. Studies have shown that it also regulates tendon formation [66]. The expression of ATF3 was significantly increased in the muscle of Ningxiang pig aged 150 days. ATF3 is involved in the regulation of muscle and fat development as a transcription activator [67,68]. ATF3 also regulates the expression of chemokines in the skeletal muscles [69], regulating their adaptability during training [70]. ATF3 can also activate the transcription of H2B protein, thus maintaining the stability of the genome and slowing down the premature activation of skeletal muscle satellite cells [71]. PAX7 expression decreased significantly during the early stages of fattening in Ningxiang pigs. Studies have shown that PAX7 is necessary to maintain the resting state of skeletal muscle stem cells in infancy [72], and PAX7 plays an important role in the process of muscle growth after birth [73,74], suggesting that there may be some factors that negatively regulate the expression of PAX7 in the muscle development of Ningxiang pigs. KLF5 is a key transcription factor in pigs and is highly expressed in the early fattening period of Ningxiang pigs, indicating that it may affect the transcriptional activity of genes by binding to their promoters, thereby regulating muscle development. Hayashi et al. found that Klf5 knockout specific to muscle satellite cells significantly reduced muscle regenerative activity and muscle atrophy [75,76]. The genes involved in the transcription of transcription factor FOXN2 and their involvement in muscle development in Ningxiang pigs require further experimental verification.
Genes are not only expressed in cells but also participate in signal transduction between cells. To further clarify the action pathways of genes in the process of muscle development, KEGG function enrichment and PPI analyses were conducted on the muscle-related genes identified. MAPK and PI3K-Akt, among others, may be key pathways in muscle development. EGR1-EGR2-FOS-ATF3-HOMER1-KLF5 and MYOZ2-KLHL40-LOMD2 interact with each other. Studies have found that the PI3K/Akt [28,77] and MAPK [24,63] signalling pathways affect myoblast proliferation, and other studies have shown that the TNF signalling pathway affects muscle growth and development [78]. Zhang et al. found that the MAPK signalling pathway regulates fibre-type transformation in sheep skeletal muscles [79]. Yadav et al. found that the FoxO signalling pathway is involved in the formation of slow muscle fibres [80]. Franco-Romero et al. found that a new member of the FOXO signalling pathway regulates muscle atrophy [81]. Zheng et al. found that the IL-17 signalling pathway can promote the repair of sheep myoblast injury [82]. These signalling pathways play an important role in muscle development, but some of them have not been verified in muscle development, which also provides a direction for subsequent research. Molecular interactions during gene expression include transcription factor–transcription initiation factor, transcription factor–cofactor, cofactor–cofactor, translation initiation factor–cofactor, and modification factors, among others. The interaction between serpine 1 and THBS1 has been verified in gastric cancer and luteinization in endothelial cells [83,84]. EGR1 can activate the expression of ATF3 during cancer treatment [85]. Yuan et al. found that the activation of EGF1 was regulated by ATF3 [86]. Wang et al. found that FOS binds to the EGR1 promoter to promote its expression and then promote the production of IL4 [87]. Whether the above interactions in non-muscle development also exist in the muscle development of Ningxiang pigs requires further experimental verification.
Homer1 was first discovered in the brain tissue. As a scaffold protein, Homer1 can regulate the signal transduction of metabotropic glutamate to affect the development of the cortex and is mainly involved in the development of the nervous system [88,89,90]. Homer1 also relieves cerebral haemorrhage by promoting glial cell transformation [91]. Homer1 is expressed in skeletal muscle sarcoplasmic reticulum [92,93]. The EVH1 domain of Homer1 binds to the ryanodine receptor type 1 to regulate intracellular calcium concentration, thereby affecting muscle contraction [91]. Homer1 knockout mice show obvious skeletal muscle disease due to the destruction of intracellular calcium homeostasis [94]. We found that Homer1 overexpression significantly upregulated the expression of skeletal muscle differentiation marker genes and promoted muscle cell differentiation and muscle fibre fusion. Homer1 likely influences the differentiation of muscle cells by regulating the calcineurin/NFAT signalling pathway [95,96]. In this study, we found that the overexpression of Homer1 significantly promoted the proliferation of myoblasts, suggesting that Homer1 may play an important role in muscle plasticity and adaptability. Bortoloso et al. also found that homer expression was positively correlated with muscle mass at the individual level [97], a result similar to that of this study. Schumacher et al. found that mutations in Homer1 significantly affected myogenic differentiation in piglets [98].
5. Conclusions
In summary, we identified 15 known and six novel candidate genes related to muscle development through differential expression and functional annotation analysis of the Ningxiang pig muscle transcriptome after sequencing at the weaning and pre-fattening stages. Subsequent bioinformatics analysis revealed a significant interaction between 15 known genes related to muscle development, and that they also regulated muscle development in Ningxiang pigs through signalling pathways, such as FoxO, MAPK, PI3K-Akt, GnRH, and TNF. Proteins encoded by some genes act as transcription factors that regulate the expression of muscle-related genes, affecting muscle development in Ningxiang pigs. We verified that the candidate gene, Homer1, promotes the proliferation and differentiation of myoblasts. These results provide a reference for studying the molecular mechanisms of muscle development in Ningxiang pigs.
Supplementary Materials
The following supporting information can be found at: https://www.sciepublish.com/article/pii/1267, Table S1: Unscreened Transcript Details Table; Table S2: Details of transcripts screened with TPM > 1; Table S3: Differential expression details of transcripts with TPM > 1; Table S4: Detailed table for GO annotation analysis of differentially expressed transcripts related to muscles; Table S5: Detailed Table for GO Enrichment Analysis of Differentially Expressed Transcripts; Table S6: Detailed table of differentially expressed genes related to muscles; Table S7: Detailed table of KEGG enrichment analysis of muscle-related differentially expressed genes.
Acknowledgments
Thanks to Xueli Xu and Nini Ai for their help during the sampling period.
Author Contributions
Conceptualization, H.M. and Z.Y.; Methodology, Z.Y.; Software, Z.Y.; Validation, Z.Y., L.X. and K.W.; Formal Analysis, X.L.; Data Curation, Z.Y.; Writing—Original Draft Preparation, Z.Y.; Writing—Review & Editing, H.M.; Visualization, Z.Y., J.T.; Project Administration, H.M.; Funding Acquisition, H.M.
Ethics Statement
The animal experiment of this study was carried out in accordance with ARRIVE guidelines (https://arriveguidelines.org, accessed on 10 July 2022). The experimental methods are consistent with the guidelines. All animal experiment procedures are approved by the Ethics Committee of the College of Animal Science and Technology, Hunan Agricultural University (No.2021-13, approved on 17 February 2021).
Informed Consent Statement
Not applicable.
Data Availability Statement
The datasets supporting the conclusions of this study are available in the manuscript and supplementary materials. The RNA-seq data used in the present study have been deposited in the NCBI database Sequence Read Archive (SRA) (https://www.ncbi.nlm.nih.gov/sra, accessed on 10 August 2023) (BioProject: PRJNA721288): SRR14211782-SRR14211784 (30 days after birth) and SRR14211767-SRR14211769 (150 days after birth).
Funding
This work was supported by grants from Yuelushan Laboratory Breeding Program (YLS-2025-ZY01002), Program for Scientific and Technological Talents and Platforms (Academician and Expert Workstations (202405AF350101)).
Declaration of Competing Interest
The authors declare that they have no competing interests.
References
- Poleti MD, Regitano LCA, Souza GHMF, Cesar ASM, Simas RC, Silva-Vignato B, et al. Longissimus dorsi muscle label-free quantitative proteomic reveals biological mechanisms associated with intramuscular fat deposition. J. Proteom. 2018, 179, 30–41. DOI:10.1016/j.jprot.2018.02.028 [Google Scholar]
- Lu P, Li D, Yin J, Zhang L, Wang Z. Flavour differences of cooked longissimus muscle from Chinese indigenous pig breeds and hybrid pig breed (Duroc × Landrace × Large White). Food Chem. 2008, 107, 1529–1537. DOI:10.1016/j.foodchem.2007.10.010 [Google Scholar]
- Hu H, Wang J, Zhu R, Guo J, Wu Y. Effect of myosin heavy chain composition of muscles on meat quality in Laiwu pigs and Duroc. Sci. China Ser. C Life Sci. 2008, 51, 127–132. DOI:10.1007/s11427-008-0016-x [Google Scholar]
- He J, Wu XL, Zeng Q, Li H, Ma H, Jiang J, et al. Genomic mating as sustainable breeding for Chinese indigenous Ningxiang pigs. PLoS ONE 2020, 15, e0236629. DOI:10.1371/journal.pone.0236629 [Google Scholar]
- He Q, Ren P, Kong X, Wu Y, Wu G, Li P, et al. Comparison of serum metabolite compositions between obese and lean growing pigs using an NMR-based metabonomic approach. J. Nutr. Biochem. 2012, 23, 133–139. DOI:10.1016/j.jnutbio.2010.11.007 [Google Scholar]
- Buckingham M, Relaix F. The Role of Pax Genes in the Development of Tissues and Organs: Pax3 and Pax7 Regulate Muscle Progenitor Cell Functions. Annu. Rev. Cell Dev. Biol. 2007, 23, 645–673. DOI:10.1146/annurev.cellbio.23.090506.123438 [Google Scholar]
- Vicente-García C, Hernández-Camacho JD, Carvajal JJ. Regulation of myogenic gene expression. Exp. Cell Res. 2022, 419, 113299. DOI:10.1016/j.yexcr.2022.113299 [Google Scholar]
- Shirakawa T, Toyono T, Inoue A, Matsubara T, Kawamoto T, Kokabu S. Factors Regulating or Regulated by Myogenic Regulatory Factors in Skeletal Muscle Stem Cells. Cells 2022, 11, 1493. DOI:10.3390/cells11091493 [Google Scholar]
- Moncaut N, Rigby PWJ, Carvajal JJ. Dial M(RF) for myogenesis. FEBS J. 2013, 280, 3980–3990. DOI:10.1111/febs.12379 [Google Scholar]
- Artaza JN, Bhasin S, Mallidis C, Taylor W, Ma K, Gonzalez‐Cadavid NF. Endogenous expression and localization of myostatin and its relation to myosin heavy chain distribution in C2C12 skeletal muscle cells. J. Cell. Physiol. 2002, 190, 170–179. DOI:10.1002/jcp.10044 [Google Scholar]
- Ellis SE, Collado-Torres L, Jaffe A, Leek JT. Improving the value of public RNA-seq expression data by phenotype prediction. Nucleic Acids Res. 2018, 46, e54–e54. DOI:10.1093/nar/gky102 [Google Scholar]
- Wang Z, Gerstein M, Snyder M. RNA-Seq: A revolutionary tool for transcriptomics. Nat. Rev. Genet. 2009, 10, 57–63. DOI:10.1038/nrg2484 [Google Scholar]
- Huang F, Zheng Y, Li X, Luo H, Luo L. Ferroptosis-related gene AKR1C1 predicts the prognosis of non-small cell lung cancer. Cancer Cell Int. 2021, 21, 567. DOI:10.1186/s12935-021-02267-2 [Google Scholar]
- Alisoltani A, Fallahi H, Shiran B, Alisoltani A, Ebrahimie E. RNA-Seq SSRs and small RNA-Seq SSRs: New approaches in cancer biomarker discovery. Gene 2015, 560, 34–43. DOI:10.1016/j.gene.2015.01.027 [Google Scholar]
- Asp M, Giacomello S, Larsson L, Wu C, Fürth D, Qian X, et al. A Spatiotemporal Organ-Wide Gene Expression and Cell Atlas of the Developing Human Heart. Cell 2019, 179, 1647–1660.e19. DOI:10.1016/j.cell.2019.11.025 [Google Scholar]
- Xu R, Martelossi J, Smits M, Iannello M, Peruzza L, Babbucci M, et al. Multi-tissue RNA-Seq Analysis and Long-read-based Genome Assembly Reveal Complex Sex-specific Gene Regulation and Molecular Evolution in the Manila Clam. Genome Biol. Evol. 2022, 14, evac171. DOI:10.1093/gbe/evac171 [Google Scholar]
- Ma H, Jiang J, He J, Liu H, Han L, Gong Y, et al. Long‐read assembly of the Chinese indigenous Ningxiang pig genome and identification of genetic variations in fat metabolism among different breeds. Mol. Ecol. Resour. 2022, 22, 1508–1520. DOI:10.1111/1755-0998.13550 [Google Scholar]
- Li B, Yang J, He J, Gong Y, Xiao Y, Zeng Q, et al. Spatiotemporal Regulation and Functional Analysis of Circular RNAs in Skeletal Muscle and Subcutaneous Fat during Pig Growth. Biology 2021, 10, 841. DOI:10.3390/biology10090841 [Google Scholar]
- Liufu S, Lan Q, Liu X, Chen B, Xu X, Ai N, et al. Transcriptome Analysis Reveals the Age-Related Developmental Dynamics Pattern of the Longissimus Dorsi Muscle in Ningxiang Pigs. Genes 2023, 14, 1050. DOI:10.3390/genes14051050 [Google Scholar]
- Jiang YF, Wang S, Wang CL, Xu RH, Wang WW, Jiang Y, et al. Pangenome obtained by long-read sequencing of 11 genomes reveal hidden functional structural variants in pigs. iScience 2023, 26, 106119. DOI:10.1016/j.isci.2023.106119 [Google Scholar]
- Miao J, Wei X, Cao C, Sun J, Xu Y, Zhang Z, et al. Pig pangenome graph reveals functional features of non-reference sequences. J. Animal Sci. Biotechnol. 2024, 15, 32. DOI:10.1186/s40104-023-00984-4 [Google Scholar]
- Xu X, Yu Z, Ai N, Liufu S, Liu X, Chen B, et al. Molecular Mechanism of MYL4 Regulation of Skeletal Muscle Development in Pigs. Genes 2023, 14, 1267. DOI:10.3390/genes14061267 [Google Scholar]
- Abbas Raza SH, Zhong R, Wei X, Zhao G, Zan L, Pant SD, et al. Investigating the Role of KLF6 in the Growth of Bovine Preadipocytes: Using Transcriptomic Analyses to Understand Beef Quality. J. Agric. Food Chem. 2024, 72, 9656–9668. DOI:10.1021/acs.jafc.4c01115 [Google Scholar]
- Zhang C, Wang L, Qin L, Luo Y, Wen Z, Vignon AS, et al. Overexpression of GPX2 gene regulates the development of porcine preadipocytes and skeletal muscle cells through MAPK signaling pathway. PLoS ONE 2024, 19, e0298827. DOI:10.1371/journal.pone.0298827 [Google Scholar]
- Fu Y, Li S, Nie J, Yan D, Zhang B, Hao X, et al. Expression of PDLIM5 Spliceosomes and Regulatory Functions on Myogenesis in Pigs. Cells 2024, 13, 720. DOI:10.3390/cells13080720 [Google Scholar]
- Xie S, Liu Q, Fu C, Chen Y, Li M, Tian C, et al. Molecular Regulation of Porcine Skeletal Muscle Development: Insights from Research on CDC23 Expression and Function. Int. J. Mol. Sci. 2024, 25, 3664. DOI:10.3390/ijms25073664 [Google Scholar]
- Li F, Yan C, Yao Y, Yang Y, Liu Y, Fan D, et al. Transcription Factor SATB2 Regulates Skeletal Muscle Cell Proliferation and Migration via HDAC4 in Pigs. Genes 2024, 15, 65. DOI:10.3390/genes15010065 [Google Scholar]
- Liu H, Pan D, Li P, Wang D, Xia B, Zhang R, et al. Loss of ZBED6 Protects Against Sepsis‐Induced Muscle Atrophy by Upregulating DOCK3‐Mediated RAC1/PI3K/AKT Signaling Pathway in Pigs. Adv. Sci. 2023, 10, 2302298. DOI:10.1002/advs.202302298 [Google Scholar]
- Ai N, Yu Z, Xu X, Liufu S, Wang K, Huang S, et al. Circular Intronic RNA circTTN Inhibits Host Gene Transcription and Myogenesis by Recruiting PURB Proteins to form Heterotypic Complexes. Int. J. Mol. Sci. 2023, 24, 9859. DOI:10.3390/ijms24129859 [Google Scholar]
- Yu Z, Xu X, Ai N, Wang K, Zhang P, Li X, et al. Integrated analysis of circRNA, lncRNA, miRNA and mRNA to reveal the ceRNA regulatory network of postnatal skeletal muscle development in Ningxiang pig. Front. Cell Dev. Biol. 2023, 11, 1185823. DOI:10.3389/fcell.2023.1185823 [Google Scholar]
- Chen S, Zhou Y, Chen Y, Gu J. Fastp: An ultra-fast all-in-one FASTQ preprocessor. Bioinformatics 2018, 34, i884–i890. DOI:10.1093/bioinformatics/bty560 [Google Scholar]
- Kim D, Langmead B, Salzberg SL. HISAT: A fast spliced aligner with low memory requirements. Nat. Methods 2015, 12, 357–360. DOI:10.1038/nmeth.3317 [Google Scholar]
- Pertea M, Pertea GM, Antonescu CM, Chang TC, Mendell JT, Salzberg SL. StringTie enables improved reconstruction of a transcriptome from RNA-seq reads. Nat. Biotechnol. 2015, 33, 290–295. DOI:10.1038/nbt.3122 [Google Scholar]
- Pertea G, Pertea M. GFF Utilities: GffRead and GffCompare. F1000Res 2020, 9, 304. DOI:10.12688/f1000research.23297.1 [Google Scholar]
- Li H, Handsaker B, Wysoker A, Fennell T, Ruan J, Homer N, et al. The Sequence Alignment/Map format and SAMtools. Bioinformatics 2009, 25, 2078–2079. DOI:10.1093/bioinformatics/btp352 [Google Scholar]
- Anders S, Pyl PT, Huber W. HTSeq—A Python framework to work with high-throughput sequencing data. Bioinformatics 2015, 31, 166–169. DOI:10.1093/bioinformatics/btu638 [Google Scholar]
- Li B, Dewey CN. RSEM: Accurate transcript quantification from RNA-Seq data with or without a reference genome. BMC Bioinform. 2011, 12, 323. DOI:10.1186/1471-2105-12-323 [Google Scholar]
- Love MI, Huber W, Anders S. Moderated estimation of fold change and dispersion for RNA-seq data with DESeq2. Genome Biol. 2014, 15, 550. DOI:10.1186/s13059-014-0550-8 [Google Scholar]
- Aickin M, Gensler H. Adjusting for multiple testing when reporting research results: the Bonferroni vs Holm methods. Am. J. Public Health 1996, 86, 726–728. DOI:10.2105/AJPH.86.5.726 [Google Scholar]
- Mudunuri U, Che A, Yi M, Stephens RM. BioDBnet: the biological database network. Bioinformatics 2009, 25, 555–556. DOI:10.1093/bioinformatics/btn654 [Google Scholar]
- Xie C, Mao X, Huang J, Ding Y, Wu J, Dong S, et al. KOBAS 2.0: A web server for annotation and identification of enriched pathways and diseases. Nucleic Acids Res. 2011, 39, W316–W322. DOI:10.1093/nar/gkr483 [Google Scholar]
- Shen WK, Chen SY, Gan ZQ, Zhang YZ, Yue T, Chen MM, et al. AnimalTFDB 4.0: A comprehensive animal transcription factor database updated with variation and expression annotations. Nucleic Acids Res. 2023, 51, D39–D45. DOI:10.1093/nar/gkac907 [Google Scholar]
- Rao X, Huang X, Zhou Z, Lin X. An improvement of the 2ˆ(-delta delta CT) method for quantitative real-time polymerase chain reaction data analysis. Biostat. Bioinforma. Biomath. 2013, 3, 71–85. Available online: https://pubmed.ncbi.nlm.nih.gov/25558171/ (accessed on 27 September 2026).
- Zhai J, Li H, Wong AHH, Dong C, Yi S, Jia Y, et al. A digital microfluidic system with 3D microstructures for single-cell culture. Microsyst. Nanoeng. 2020, 6, 6. DOI:10.1038/s41378-019-0109-7 [Google Scholar]
- Biram A, Strömberg A, Winter E, Stoler-Barak L, Salomon R, Addadi Y, et al. BCR affinity differentially regulates colonization of the subepithelial dome and infiltration into germinal centers within Peyer’s patches. Nat. Immunol. 2019, 20, 482–492. DOI:10.1038/s41590-019-0325-1 [Google Scholar]
- Sánchez-Sánchez J, Vicente-García C, Cañada-García D, Martín-Zanca D, Arévalo JC. ARMS/Kidins220 regulates nociception by controlling brain-derived neurotrophic factor secretion. Pain 2023, 164, 563–576. DOI:10.1097/j.pain.0000000000002741 [Google Scholar]
- Ogura Y, Hindi SM, Sato S, Xiong G, Akira S, Kumar A. TAK1 modulates satellite stem cell homeostasis and skeletal muscle repair. Nat. Commun. 2015, 6, 10123. DOI:10.1038/ncomms10123 [Google Scholar]
- Liu L, Lu Y, Martinez J, Bi Y, Lian G, Wang T, et al. Proinflammatory signal suppresses proliferation and shifts macrophage metabolism from Myc-dependent to HIF1 α-dependent. Proc. Natl. Acad. Sci. USA 2016, 113, 1564–1569. DOI:10.1073/pnas.1518000113 [Google Scholar]
- Lakshmanan I, Ponnusamy MP, Das S, Chakraborty S, Haridas D, Mukhopadhyay P, et al. MUC16 induced rapid G2/M transition via interactions with JAK2 for increased proliferation and anti-apoptosis in breast cancer cells. Oncogene 2012, 31, 805–817. DOI:10.1038/onc.2011.297 [Google Scholar]
- Kiss B, Gohlke J, Tonino P, Hourani Z, Kolb J, Strom J, et al. Nebulin and Lmod2 are critical for specifying thin-filament length in skeletal muscle. Sci. Adv. 2020, 6, eabc1992. DOI:10.1126/sciadv.abc1992 [Google Scholar]
- Larrinaga TM, Farman GP, Mayfield RM, Yuen M, Ahrens-Nicklas RC, Cooper ST, et al. Lmod2 is necessary for effective skeletal muscle contraction. Sci. Adv. 2024, 10, eadk1890. DOI:10.1126/sciadv.adk1890 [Google Scholar]
- Wang YN, Yang WC, Li PW, Wang HB, Zhang YY, Zan LS. Myocyte enhancer factor 2A promotes proliferation and its inhibition attenuates myogenic differentiation via myozenin 2 in bovine skeletal muscle myoblast. PLoS ONE 2018, 13, e0196255. DOI:10.1371/journal.pone.0196255 [Google Scholar]
- Zhang D, Yue Y, Yuan C, An X, Guo T, Chen B, et al. DIA-Based Proteomic Analysis Reveals MYOZ2 as a Key Protein Affecting Muscle Growth and Development in Hybrid Sheep. Int. J. Mol. Sci. 2024, 25, 2975. DOI:10.3390/ijms25052975 [Google Scholar]
- Alves CRR, Neves WD, de Almeida NR, Eichelberger EJ, Jannig PR, Voltarelli VA, et al. Exercise training reverses cancer-induced oxidative stress and decrease in muscle COPS2/TRIP15/ALIEN. Mol. Metab. 2020, 39, 101012. DOI:10.1016/j.molmet.2020.101012 [Google Scholar]
- Pardo PS, Boriek AM. An autoregulatory loop reverts the mechanosensitive Sirt1 induction by EGR1 in skeletal muscle cells. Aging 2012, 4, 456–461. DOI:10.18632/aging.100470 [Google Scholar]
- Pardo PS, Mohamed JS, Lopez MA, Boriek AM. Induction of Sirt1 by Mechanical Stretch of Skeletal Muscle through the Early Response Factor EGR1 Triggers an Antioxidative Response. J. Biol. Chem. 2011, 286, 2559–2566. DOI:10.1074/jbc.M110.149153 [Google Scholar]
- Shen H, Schwartz AG, Civitelli R, Thomopoulos S. Connexin 43 Is Necessary for Murine Tendon Enthesis Formation and Response to Loading. J. Bone Miner. Res. 2020, 35, 1494–1503. DOI:10.1002/jbmr.4018 [Google Scholar]
- Shen H, Grimston S, Civitelli R, Thomopoulos S. Deletion of Connexin43 in Osteoblasts/Osteocytes Leads to Impaired Muscle Formation in Mice. J. Bone Miner. Res. 2015, 30, 596–605. DOI:10.1002/jbmr.2389 [Google Scholar]
- Martins-Marques T, Witschas K, Ribeiro I, Zuzarte M, Catarino S, Ribeiro-Rodrigues T, et al. Cx43 can form functional channels at the nuclear envelope and modulate gene expression in cardiac cells. Open Biol. 2023, 13, 230258. DOI:10.1098/rsob.230258 [Google Scholar]
- Garg A, O’Rourke J, Long C, Doering J, Ravenscroft G, Bezprozvannaya S, et al. KLHL40 deficiency destabilizes thin filament proteins and promotes nemaline myopathy. J. Clin. Investig. 2014, 124, 3529–3539. DOI:10.1172/JCI74994 [Google Scholar]
- Mansur A, Joseph R, Kim ES, Jean-Beltran PM, Udeshi ND, Pearce C, et al. Dynamic regulation of inter-organelle communication by ubiquitylation controls skeletal muscle development and disease onset. eLife 2023, 12, e81966. DOI:10.7554/eLife.81966 [Google Scholar]
- Rodier A, Marchal-Victorion S, Rochard P, Casas F, Cassar-Malek I, Rouault JP, et al. BTG1: A Triiodothyronine Target Involved in the Myogenic Influence of the Hormone. Exp. Cell Res. 1999, 249, 337–348. DOI:10.1006/excr.1999.4486 [Google Scholar]
- Salanova M, Volpe P, Blottner D. Homer protein family regulation in skeletal muscle and neuromuscular adaptation. IUBMB Life 2013, 65, 769–776. DOI:10.1002/iub.1198 [Google Scholar]
- Almada AE, Horwitz N, Price FD, Gonzalez AE, Ko M, Bolukbasi OV, et al. FOS licenses early events in stem cell activation driving skeletal muscle regeneration. Cell Rep. 2021, 34, 108656. DOI:10.1016/j.celrep.2020.108656 [Google Scholar]
- Zhao Q, Yang ST, Wang JJ, Zhou J, Xing SS, Shen CC, et al. TNF alpha inhibits myogenic differentiation of C2C12 cells through NF-κB activation and impairment of IGF-1 signaling pathway. Biochem. Biophys. Res. Commun. 2015, 458, 790–795. DOI:10.1016/j.bbrc.2015.02.026 [Google Scholar]
- Mohtar O, Ozdemir C, Roy D, Shantaram D, Emili A, Kandror KV. Egr1 mediates the effect of insulin on leptin transcription in adipocytes. J. Biol. Chem. 2019, 294, 5784–5789. DOI:10.1074/jbc.AC119.007855 [Google Scholar]
- Muñoz M, García-Casco JM, Caraballo C, Fernández-Barroso MÁ, Sánchez-Esquiliche F, Gómez F, et al. Identification of Candidate Genes and Regulatory Factors Underlying Intramuscular Fat Content Through Longissimus Dorsi Transcriptome Analyses in Heavy Iberian Pigs. Front. Genet. 2018, 9, 608. DOI:10.3389/fgene.2018.00608 [Google Scholar]
- Kim S, Song NJ, Bahn G, Chang SH, Yun UJ, Ku JM, et al. Atf3 induction is a therapeutic target for obesity and metabolic diseases. Biochem. Biophys. Res. Commun. 2018, 504, 903–908. DOI:10.1016/j.bbrc.2018.09.048 [Google Scholar]
- Fernández-Verdejo R, Vanwynsberghe AM, Hai T, Deldicque L, Francaux M. Activating transcription factor 3 regulates chemokine expression in contracting C2C12 myotubes and in mouse skeletal muscle after eccentric exercise. Biochem. Biophys. Res. Commun. 2017, 492, 249–254. DOI:10.1016/j.bbrc.2017.08.059 [Google Scholar]
- Fernández‐Verdejo R, Vanwynsberghe AM, Essaghir A, Demoulin J, Hai T, Deldicque L, et al. Activating transcription factor 3 attenuates chemokine and cytokine expression in mouse skeletal muscle after exercise and facilitates molecular adaptation to endurance training. FASEB J. 2016, 31, 840–851. DOI:10.1096/fj.201600987R [Google Scholar]
- Zhang S, Yang F, Huang Y, He L, Li Y, Wan YCE, et al. ATF3 induction prevents precocious activation of skeletal muscle stem cell by regulating H2B expression. Nat. Commun. 2023, 14, 4978. DOI:10.1038/s41467-023-40465-w [Google Scholar]
- Lepper C, Conway SJ, Fan CM. Adult satellite cells and embryonic muscle progenitors have distinct genetic requirements. Nature 2009, 460, 627–631. DOI:10.1038/nature08209 [Google Scholar]
- Mitchell KJ, Pannérec A, Cadot B, Parlakian A, Besson V, Gomes ER, et al. Identification and characterization of a non-satellite cell muscle resident progenitor during postnatal development. Nat. Cell Biol. 2010, 12, 257–266. DOI:10.1038/ncb2025 [Google Scholar]
- Kuang S, Chargé SB, Seale P, Huh M, Rudnicki MA. Distinct roles for Pax7 and Pax3 in adult regenerative myogenesis. J. Cell Biol. 2006, 172, 103–113. DOI:10.1083/jcb.200508001 [Google Scholar]
- Liu L, Koike H, Ono T, Hayashi S, Kudo F, Kaneda A, et al. Identification of a KLF5-dependent program and drug development for skeletal muscle atrophy. Proc. Natl. Acad. Sci. USA 2021, 118, e2102895118. DOI:10.1073/pnas.2102895118 [Google Scholar]
- Hayashi S, Manabe I, Suzuki Y, Relaix F, Oishi Y. Klf5 regulates muscle differentiation by directly targeting muscle-specific genes in cooperation with MyoD in mice. eLife 2016, 5, e17462. DOI:10.7554/eLife.17462 [Google Scholar]
- Yoshida T, Huq TS, Delafontaine P. Angiotensin Type 2 Receptor Signaling in Satellite Cells Potentiates Skeletal Muscle Regeneration. J. Biol. Chem. 2014, 289, 26239–26248. DOI:10.1074/jbc.M114.585521 [Google Scholar]
- Wang Y, Wang J, Hu H, Wang H, Wang C, Lin H, et al. Dynamic transcriptome profiles of postnatal porcine skeletal muscle growth and development. BMC Genom. Data 2021, 22, 32. DOI:10.1186/s12863-021-00984-1 [Google Scholar]
- Nie L, He K, Qiu C, Li Q, Xiong B, Gao C, et al. Tetramethylpyrazine Nitrone alleviates D-galactose-induced murine skeletal muscle aging and motor deficits by activating the AMPK signaling pathway. Biomed. Pharmacother. 2024, 173, 116415. DOI:10.1016/j.biopha.2024.116415 [Google Scholar]
- Yadav A, Singh A, Phogat J, Dahuja A, Dabur R. Magnoflorine prevent the skeletal muscle atrophy via Akt/mTOR/FoxO signal pathway and increase slow-MyHC production in streptozotocin-induced diabetic rats. J. Ethnopharmacol. 2021, 267, 113510. DOI:10.1016/j.jep.2020.113510 [Google Scholar]
- Franco-Romero A, Leduc-Gaudet JP, Hussain SN, Gouspillou G, Sandri M. PHAF1/MYTHO is a novel autophagy regulator that controls muscle integrity. Autophagy 2024, 20, 965–967. DOI:10.1080/15548627.2023.2224206 [Google Scholar]
- Zheng J, Li B, Yan Y, Huang X, Zhang E. β-Hydroxy-β-Methylbutyric Acid Promotes Repair of Sheep Myoblast Injury by Inhibiting IL-17/NF-κB Signaling. Int. J. Mol. Sci. 2023, 24, 444. DOI:10.3390/ijms24010444 [Google Scholar]
- Ma J, Meng Y, Zhou X, Guo L, Fu W. The Prognostic Significance and Gene Expression Characteristics of Gastric Signet-Ring Cell Carcinoma: A Study Based on the SEER and TCGA Databases. Front. Surg. 2022, 9, 819018. DOI:10.3389/fsurg.2022.819018 [Google Scholar]
- Farberov S, Meidan R. Thrombospondin-1 Affects Bovine Luteal Function via Transforming Growth Factor-Beta1-Dependent and Independent Actions1. Biol. Reprod. 2016, 94, 1–9. DOI:10.1095/biolreprod.115.135822 [Google Scholar]
- Wong JJW, Lorenz S, Selbo PK. All-trans retinoic acid enhances the anti-tumour effects of fimaporfin-based photodynamic therapy. Biomed. Pharmacother. 2022, 155, 113678. DOI:10.1016/j.biopha.2022.113678 [Google Scholar]
- Yuan L, Mu P, Huang B, Li H, Mu H, Deng Y. EGR1 is essential for deoxynivalenol-induced G2/M cell cycle arrest in HepG2 cells via the ATF3ΔZip2a/2b-EGR1-p21 pathway. Toxicol. Lett. 2018, 299, 95–103. DOI:10.1016/j.toxlet.2018.09.012 [Google Scholar]
- Wang HN, Ji K, Zhang LN, Xie CC, Li WY, Zhao ZF, et al. Inhibition of c-Fos expression attenuates IgE-mediated mast cell activation and allergic inflammation by counteracting an inhibitory AP1/Egr1/IL-4 axis. J. Transl. Med. 2021, 19, 261. DOI:10.1186/s12967-021-02932-0 [Google Scholar]
- Brakeman PR, Lanahan AA, O’Brien R, Roche K, Barnes CA, Huganir RL, et al. Homer: A protein that selectively binds metabotropic glutamate receptors. Nature 1997, 386, 284–288. DOI:10.1038/386284a0 [Google Scholar]
- Fagni L, Worley PF, Ango F. Homer as Both a Scaffold and Transduction Molecule. Sci. STKE 2002, 2002, re8. DOI:10.1126/stke.2002.137.re8 [Google Scholar]
- Ango F, Prézeau L, Muller T, Tu JC, Xiao B, Worley PF, et al. Agonist-independent activation of metabotropic glutamate receptors by the intracellular protein Homer. Nature 2001, 411, 962–965. DOI:10.1038/35082096 [Google Scholar]
- Wang T, Zhang L, Shi C, Wei R, Yin C. Interaction of the Homer1 EVH1 domain and skeletal muscle ryanodine receptor. Biochem. Biophys. Res. Commun. 2019, 514, 720–725. DOI:10.1016/j.bbrc.2019.04.199 [Google Scholar]
- Salanova M, Priori G, Barone V, Intravaia E, Flucher B, Ciruela F, et al. Homer proteins and InsP3 receptors co-localise in the longitudinal sarcoplasmic reticulum of skeletal muscle fibres. Cell Calcium 2002, 32, 193–200. DOI:10.1016/S0143416002001549 [Google Scholar]
- Feng W, Tu J, Yang T, Vernon PS, Allen PD, Worley PF, et al. Homer Regulates Gain of Ryanodine Receptor Type 1 Channel Complex. J. Biol. Chem. 2002, 277, 44722–44730. DOI:10.1074/jbc.M207675200 [Google Scholar]
- Stiber JA, Zhang ZS, Burch J, Eu JP, Zhang S, Truskey GA, et al. Mice Lacking Homer 1 Exhibit a Skeletal Myopathy Characterized by Abnormal Transient Receptor Potential Channel Activity. Mol. Cell. Biol. 2008, 28, 2637–2647. DOI:10.1128/MCB.01601-07 [Google Scholar]
- Stiber JA, Tabatabaei N, Hawkins AF, Hawke T, Worley PF, Williams RS, et al. Homer modulates NFAT-dependent signaling during muscle differentiation. Dev. Biol. 2005, 287, 213–224. DOI:10.1016/j.ydbio.2005.06.030 [Google Scholar]
- Chin ER, Olson EN, Richardson JA, Yang Q, Humphries C, Shelton JM, et al. A calcineurin-dependent transcriptional pathway controls skeletal muscle fiber type. Genes Dev. 1998, 12, 2499–2509. DOI:10.1101/gad.12.16.2499 [Google Scholar]
- Bortoloso E, Pilati N, Megighian A, Tibaldo E, Sandonà D, Volpe P. Transition of Homer isoforms during skeletal muscle regeneration. Am. J. Physiol. Cell Physiol. 2006, 290, C711–C718. DOI:10.1152/ajpcell.00217.2005 [Google Scholar]
- Schumacher T, Reyer H, Maak S, Röntgen M. Homer 1 genotype AA variant relates to congenital splay leg syndrome in piglets by repressing Pax7 in myogenic progenitors. Front. Vet. Sci. 2023, 10, 1028879. DOI:10.3389/fvets.2023.1028879 [Google Scholar]