
Automated Watershed Dashboard for Classifying Infiltration- and Saturation-Excess Runoff

Automated Watershed Dashboard for Classifying Infiltration- and Saturation-Excess Runoff
Received: 20 July 2026 Revised: 20 August 2026 Accepted: 14 September 2026 Published: 17 September 2026

© 2026 The authors. This is an open access article under the Creative Commons Attribution 4.0 International License (https://creativecommons.org/licenses/by/4.0/).
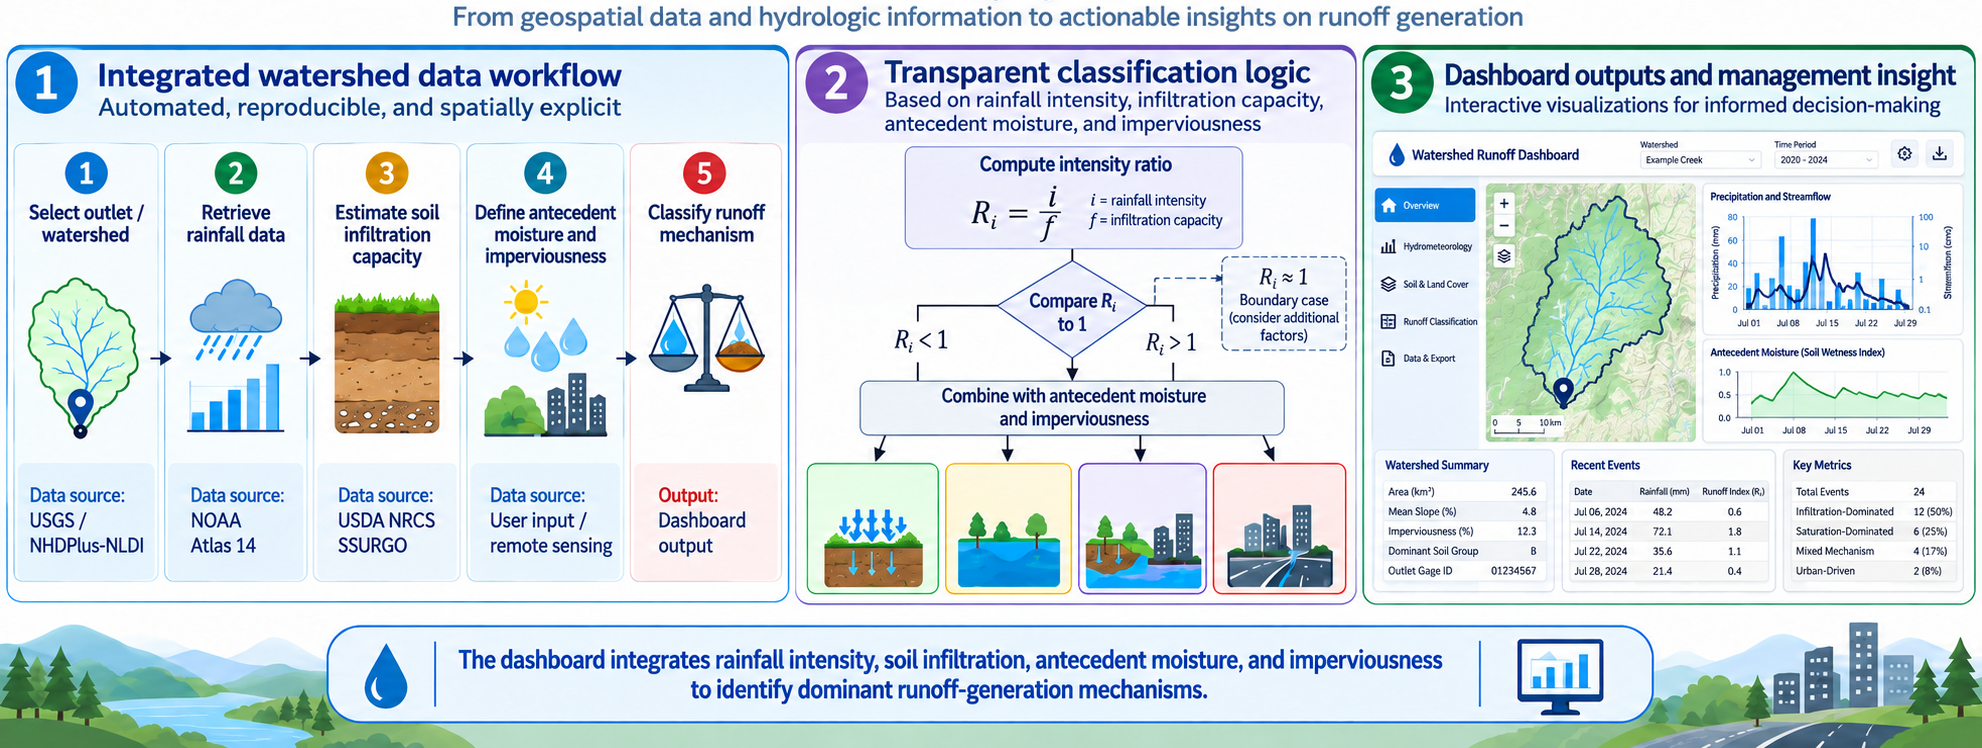
Graphical Abstract
1. Introduction
Watersheds are complex systems in which water moves through many interconnected pathways. After rainfall reaches the ground, it may be intercepted by vegetation, infiltrate into the soil, collect in small depressions, move as surface runoff, recharge groundwater, flow through channels, evaporate, or be carried through engineered drainage systems [1,2]. Because of this, effective watershed management requires more than estimating how much runoff is produced. It is also important to understand why runoff occurs under different storms, soil, land-cover, and moisture conditions [3,4]. Two watersheds may receive the same amount of rainfall, but they can produce runoff in very different ways and may therefore require different management strategies [5,6].
Urbanization and land-use change can strongly affect how a watershed responds to rainfall. When natural and permeable surfaces are replaced by rooftops, roads, parking lots, compacted soil, and storm sewer systems, less water can infiltrate into the ground [7,8,9]. These changes can shorten flow paths, increase runoff volume and peak flow, and move water, sediment, nutrients, hydrocarbons, metals, and other pollutants more quickly into nearby streams and receiving waters. In urban and developing watersheds, stormwater response is often controlled by both natural soil-water processes and engineered drainage systems. As a result, the dominant runoff process can change from one subcatchment to another and from one storm event to the next [10,11].
Rainfall-runoff processes are influenced by several connected factors, including rainfall conditions, soil storage, soil hydraulic properties, topography, vegetation, land use, and drainage connectivity [12,13]. Early hydrologic studies focused on infiltration as a key process that determines whether rainfall enters the soil or remains on the land surface. Horton introduced the concept of infiltration-excess overland flow, in which runoff begins when rainfall intensity exceeds the soil’s infiltration rate [14]. Later infiltration studies also showed that infiltration capacity is not constant. It can change depending on soil texture, hydraulic conductivity, initial soil moisture, surface condition, and the duration of the storm [15].
However, runoff is not always caused by rainfall intensity exceeding infiltration capacity. In humid watersheds, field studies showed that even a small, saturated portion of a watershed can produce a large amount of storm runoff [16]. This can happen when the water table rises to the land surface or when rainfall falls directly on areas that are already saturated. Dunne and Black [17] showed that partial contributing areas and saturation-excess runoff can dominate stormflow in some landscapes. This idea was later developed through the variable source area concept and models such as TOPMODEL, which connect runoff response to topography, soil storage, and expanding saturated areas [3,18].
Understanding the difference between these runoff processes is important because each one requires a different management approach [19,20]. Infiltration-excess runoff can often be reduced by improving soil infiltration, reducing compaction, disconnecting impervious areas, and using infiltration-based green infrastructure [21]. Saturation-excess runoff usually requires more storage, better floodplain connectivity, protection of wet or riparian areas, and careful placement of infiltration practices where soil storage is not already limited. In urban watersheds, runoff from impervious surfaces may need detention, retention, bioretention, permeable pavement, and improved drainage or conveyance systems [8,22].
Recent studies have increasingly used web-based and GIS-enabled tools to combine hydrologic data, modeling, and visualization for watershed decision support. Earlier systems showed the value of integrating GIS and hydrologic models through web interfaces [23,24], while more recent platforms have added automated data retrieval, watershed delineation, modeling, and visualization [25,26,27,28]. WEPPcloud, for example, automatically retrieves topographic, soil, weather, and land-cover data and prepares model inputs through an online platform.
Most of these systems focus on runoff quantity, water quality, or management scenarios rather than identifying the likely runoff-generation mechanism. Separate process-based studies have examined infiltration-excess and saturation-excess runoff [29,30]. The proposed dashboard connects these two areas by combining automated watershed-data integration with an explicit runoff-process classification framework.
Existing hydrologic tools commonly quantify runoff, while screening approaches may compare rainfall intensity with soil hydraulic properties, but a simple framework is still needed that jointly evaluates rainfall intensity relative to infiltration capacity, antecedent soil storage/saturation, and urban imperviousness to distinguish likely infiltration-excess, saturation-excess, mixed, and direct urban runoff mechanisms.
Beyond the challenge of data integration, a key scientific gap is the lack of a simple, transparent screening framework that jointly accounts for the major physical controls governing different runoff-generation mechanisms. Comparisons between rainfall intensity and soil infiltration capacity can indicate the potential for infiltration-excess runoff, but this comparison alone cannot identify saturation-excess runoff because saturation-excess also depends on antecedent soil-water storage and saturation conditions. In developed watersheds, impervious surfaces introduce an additional runoff pathway by allowing rainfall to bypass natural soil infiltration. Therefore, identifying the likely dominant runoff mechanism requires these controls to be evaluated together rather than independently.
One of the main challenges in identifying runoff generation mechanisms is that the needed information often comes from many different sources. This may include watershed boundaries, rainfall intensity-duration-frequency data, soil properties, land cover, antecedent rainfall, soil moisture, streamflow records, and local knowledge [29]. Although many of these datasets are available from public agencies, they are usually stored on separate platforms and often require manual download, cleaning, and processing by engineers or researchers. This can make rapid screening difficult and can limit how consistently planners and decision-makers evaluate runoff mechanisms across different storms, subcatchments, and management scenarios.
The scientific contribution of this study is a process-based classification framework that integrates rainfall intensity, soil infiltration capacity, antecedent moisture/storage conditions, and imperviousness to distinguish likely infiltration-excess, saturation-excess, mixed, and direct urban runoff responses. Unlike approaches based primarily on rainfall–infiltration comparisons, the proposed framework requires evidence of limited storage or near-saturated conditions before assigning saturation-excess runoff and explicitly considers urban imperviousness as a separate runoff control. The automated dashboard provides the computational environment for applying this framework consistently across multiple storm durations, return periods, and watershed conditions.
This study proposes an automated watershed dashboard that brings together publicly available hydrologic, rainfall, and soil data in a clear runoff classification framework. The dashboard is designed to support research and planning by helping users identify the likely dominant runoff mechanism based on rainfall intensity, soil infiltration capacity, antecedent moisture conditions, and key watershed characteristics.
The main objective of this study is to develop and describe an automated watershed dashboard to help identify likely runoff-generation mechanisms using rainfall intensity, soil infiltration capacity, antecedent moisture, and key watershed characteristics. More specifically, the study aims to create a dashboard that allows users to select a watershed outlet, search for a USGS streamgage, delineate the watershed, and extract important hydrologic data.
The dashboard is designed to retrieve rainfall-frequency data for different storm return periods and durations, calculate rainfall intensity from rainfall depth and storm duration, and estimate soil infiltration capacity using soil information such as hydrologic soil group, saturated hydraulic conductivity, soil texture, drainage class, and restrictive layer data. It also evaluates antecedent moisture or saturation conditions using user input, previous rainfall, soil moisture datasets, or modeled soil storage.
Using this information, the tool identifies the likely runoff response as infiltration-excess runoff, saturation-excess runoff, or mixed runoff. The results are then displayed in a professional map-based dashboard that supports watershed management, planning, and decision-making.
2. Methodology
2.1. Overall Workflow
The proposed dashboard follows a step-by-step workflow (Figure 1) that begins with watershed outlet selection and continues through watershed delineation, rainfall and soil data retrieval, antecedent moisture and imperviousness assessment, and final runoff mechanism classification. The data sources used in each step of the workflow are summarized in Table 1.
Table 1. Proposed data sources and role in the dashboard workflow.
|
Dataset or Service |
Purpose |
Example Output |
Dashboard Use |
|---|---|---|---|
|
USGS Water Data/Monitoring Locations |
Gauge metadata and coordinates |
Gauge name, latitude, longitude, HUC |
Locate outlet from gauge number |
|
USGS NLDI/Hydrographic Network |
Network indexing and basin delineation |
Upstream watershed polygon |
Display boundary and define area of analysis |
|
NOAA Atlas 14/PFDS |
Precipitation-frequency estimates |
Rainfall depth by return period and duration |
Calculate rainfall intensity matrix |
|
USDA NRCS SSURGO/Soil Data Access |
Soil physical and hydrologic properties |
Hydrologic soil group, Ksat, drainage class, texture |
Estimate infiltration capacity |
|
SMAP, NLDAS, or local sensors |
Antecedent moisture or soil saturation context |
Soil moisture or storage condition |
Classify saturation-excess potential |
|
NLCD or local land-cover data |
Imperviousness and urbanization |
Impervious percentage, land-cover class |
Identify direct urban runoff potential |

Figure 1. Workflow of the automated watershed dashboard from outlet selection to runoff classification and result visualization.
First, the user identifies the watershed outlet either by entering a USGS streamgage number or by clicking a point on the interactive map. When a streamgage number is entered, the dashboard retrieves the gauge name, geographic coordinates, hydrologic unit, and other available site information from the USGS Water Data monitoring-location service. When the user selects a point on the map, the dashboard uses the latitude and longitude of that point directly.
Second, the dashboard delineates the upstream watershed draining to the selected outlet. For a USGS streamgage, the gauge is already connected to the national stream network. For a user-selected point, the tool first links the point to the nearest or containing NHDPlus catchment or stream flowline. The upstream drainage area is then obtained through the USGS Network Linked Data Index, or NLDI. The resulting watershed boundary is returned in GeoJSON format and displayed on the Leaflet map.
Third, the dashboard retrieves precipitation-frequency data for the watershed. Rainfall depths are obtained from NOAA Atlas 14 through the Precipitation Frequency Data Server. The outlet location or watershed centroid is used as the representative point for the rainfall lookup. Rainfall depths are collected for selected return periods, such as 2-, 5-, 10-, 25-, 50-, and 100-year storms, and for durations such as 1, 2, 6, 12, and 24 h. Rainfall intensity is then calculated as:
|
```latexi = \frac{P}{D}``` |
(1) |
where i is rainfall intensity, P is rainfall depth, and D is storm duration. In the current implementation, P is expressed in inches, D is expressed in hours, and i is therefore expressed in inches per hour. The same equation can be used in SI units if depth and duration are converted consistently.
The use of (i = P/D) represents average rainfall intensity over the selected duration and may not capture short-duration peaks within a storm. To address this limitation, the dashboard evaluates multiple storm durations separately. Where data are available, shorter intervals such as 10, 15, or 30 min are recommended for storms with strong intensity peaks, as these may better capture conditions that trigger infiltration-excess runoff. Therefore, the (i/f) ratio and runoff classification should be evaluated across several storm durations rather than relying only on longer-duration averages.
Fourth, the tool estimates soil infiltration capacity using soil information from the USDA Natural Resources Conservation Service SSURGO database and the Soil Data Access service. Relevant soil properties may include hydrologic soil group, saturated hydraulic conductivity, soil texture, drainage class, and restrictive-layer depth. Each soil polygon is assigned an estimated infiltration capacity based on available soil properties, especially saturated hydraulic conductivity. The preferred watershed-average infiltration capacity is calculated using true area weighting:
|
```latex{f}_{avg} =\frac{\sum _{j=1}^{n}{{A}_{j}f}_{j}}{{A}_{j}}``` |
(2) |
where favg is the average infiltration capacity for the watershed or subcatchment, Aj is the area of soil unit j, and fj is the estimated infiltration capacity of soil unit j. If polygon-area intersection is unavailable, the dashboard can use representative sampling as an MVP method, while clearly reporting that a formal study should use true GIS area weighting.
The dashboard is designed to identify the likely dominant runoff-generation mechanism rather than simulate detailed spatial runoff response; therefore, use of an area-weighted average infiltration-capacity proxy is appropriate for preliminary screening.
In this version of the dashboard, a representative sampling approach may be used when a full soil-polygon intersection is not available. Sample points are placed within the watershed, soil properties are retrieved at those locations, and the values are combined to estimate watershed conditions. This is called the MVP method, which stands for Minimum Viable Product, meaning the first functional version of the tool that includes the main features needed to demonstrate the concept. The sampling method is suitable for initial screening, but a formal watershed study should use full GIS polygon intersection and true area weighting.
Fifth, the dashboard evaluates antecedent moisture conditions. In the MVP, the user selects whether the watershed is dry, normal, wet, or saturated. Future versions could estimate this condition automatically using previous rainfall from local gauges, an antecedent precipitation index, field soil-moisture sensors, NASA SMAP data, or NLDAS modeled soil-moisture information.
The dashboard may also estimate watershed imperviousness using the National Land Cover Database or local land-use data. If these datasets are unavailable, the user can enter an estimated impervious percentage manually.
Finally, the tool compares rainfall intensity with soil infiltration capacity while also considering antecedent moisture and imperviousness. Based on these conditions, each storm duration and return period is classified as likely infiltration-excess runoff, saturation-excess runoff, mixed runoff, direct urban runoff, or low runoff potential.
The main components of the workflow are described in greater detail in the following subsections. Section 2.2 describes how the watershed outlet is selected, Section 2.3 explains how the upstream watershed boundary is delineated from the selected outlet, Section 2.4 explains how rainfall depth is converted to rainfall intensity, Section 2.5 describes how soil infiltration capacity is estimated and summarized across the watershed, and Section 2.6 explains how antecedent moisture and soil saturation conditions are represented. These variables are then combined in Section 2.7 to classify the likely dominant runoff generation mechanism.
2.2. Watershed Outlet Selection
The first step is to define the watershed outlet. The user can either enter a USGS streamgage number or select a point directly on the interactive map. When a streamgage number is entered, the dashboard retrieves the station name, latitude, longitude, hydrologic unit, and other available site information from the USGS Water Data monitoring-location service. The streamgage coordinates are then used as the watershed outlet.
When a point is selected on the map, the dashboard records its latitude and longitude and uses those coordinates directly. This option allows users to analyze ungaged watersheds or locations where no USGS streamgage is available. For more reliable delineation, the selected point should be located close to a mapped stream or drainage feature.
2.3. Upstream Watershed Delineation
After the outlet is selected, the dashboard identifies the land area that drains to that location. For a USGS streamgage, the station is treated as a feature already connected to the national stream network. The dashboard uses the USGS Network Linked Data Index and NHDPlus hydrography data to retrieve the upstream contributing watershed.
For a user-selected map point, the tool first connects the outlet to the nearest or containing NHDPlus catchment or stream flowline. It then follows the drainage network upstream to determine the full contributing area. The resulting watershed boundary is returned in GeoJSON format and displayed as a layer on the Leaflet map.
If automatic delineation is unavailable or the selected point cannot be linked to the stream network, the user may upload an existing watershed boundary in GeoJSON format. This fallback option allows the remaining rainfall, soil, and runoff classification steps to continue.
2.4. Rainfall Intensity Calculation
Rainfall intensity is calculated separately for each return period and storm duration. For example, if a 10-year, 1-h storm has a rainfall depth of 2.0 inches, the average storm intensity is 2.0 inches per hour. If a 10-year, 24-h storm has a rainfall depth of 5.0 inches, the average intensity is 0.208 inches per hour. Although shorter-duration peaks within a storm may exceed the average intensity, the average intensity by selected duration provides a consistent screening metric for comparing rainfall forcing with infiltration capacity.
The rainfall table is structured as a matrix of return periods and durations. Rows can represent storm durations, and columns can represent return periods, or each storm case can be represented as a row containing duration, return period, rainfall depth, computed intensity, estimated infiltration capacity, antecedent moisture class, and runoff mechanism. This structure allows the same watershed to be evaluated under multiple design storms and helps identify which storm types are most likely to trigger infiltration-excess, saturation-excess, or mixed mechanisms.
2.5. Soil Infiltration Capacity Estimation
The preferred soil workflow uses the watershed boundary to intersect SSURGO soil map units and summarize soil attributes. Each soil unit is assigned an infiltration capacity based on saturated hydraulic conductivity, hydrologic soil group, or calibrated local infiltration data. Where saturated hydraulic conductivity is available, it can be converted to consistent units and used directly as a proxy for vertical transmission capacity. Where Ksat is missing or uncertain, the hydrologic soil group can be used as a screening indicator: Group A soils generally have high infiltration potential, Group B moderate potential, Group C low potential, and Group D very low potential or high runoff potential. These conversions should be treated as approximate and replaced with local infiltration measurements where available.
The watershed-average or subcatchment-average infiltration capacity is computed using area weighting. For subcatchment-scale analysis, the same calculation is repeated for each subcatchment to preserve spatial differences in soil hydraulic properties. The watershed-average infiltration capacity is used as a first-order screening indicator of the overall infiltration behavior of the drainage area and does not assume that infiltration capacity is spatially uniform. For relatively small or hydrologically homogeneous watersheds, an area-weighted average provides a practical basis for comparison with rainfall intensity. However, for larger or more heterogeneous watersheds, a single average value may not capture important spatial variations in soil properties, land cover, topography, and antecedent conditions. In these cases, the watershed can be divided into smaller, relatively homogeneous subcatchments, and the infiltration capacity and runoff-generation classification can be evaluated separately for each subcatchment. This approach better represents spatial differences in dominant runoff-generation processes while maintaining the screening-level simplicity of the dashboard.
For this controlled demonstration, the antecedent moisture condition was set to normal, and the watershed imperviousness was assumed to be 60%, representing a highly urbanized watershed condition. The 60% imperviousness is used as an assumed demonstration input rather than as a general threshold for classifying urban runoff.
2.6. Antecedent Moisture and Saturation Assessment
Antecedent moisture is represented in the MVP using a user-selected condition: dry, normal, wet, or saturated. A dry condition indicates substantial available soil storage, a normal condition indicates typical storage, a wet condition indicates limited available storage, and a saturated condition indicates that saturation-excess runoff is possible even for moderate rainfall intensity. This simplified representation allows the dashboard to make the key conceptual distinction between infiltration capacity and available storage.
More advanced versions of the dashboard can estimate antecedent moisture quantitatively using an antecedent precipitation index, cumulative rainfall over previous days, remote sensing soil moisture, NLDAS modeled soil moisture, shallow groundwater data, or field sensors. Such integration would allow the tool to transition from a scenario-based screening model to a near-real-time runoff mechanism classifier.
2.7. Runoff Mechanism Classification
The classification framework is based on the physical controls governing runoff initiation rather than on empirical software-specific rules. Infiltration-excess runoff occurs when rainfall supply exceeds the soil’s infiltration capacity while sufficient storage remains available, consistent with the Hortonian runoff concept. Saturation-excess runoff occurs when available soil-water storage becomes limited and saturated contributing areas develop, even when rainfall intensity does not exceed the infiltration capacity of unsaturated soil. When both infiltration limitation and saturation occur, the watershed response may contain contributions from both mechanisms and is therefore classified as mixed runoff. Impervious surfaces are treated separately because rainfall falling on hydraulically connected impervious areas can bypass natural soil infiltration and contribute directly to surface drainage.
The classification framework is intentionally transparent. It does not attempt to infer a unique physical mechanism from one variable; instead, it evaluates rainfall intensity, infiltration capacity, soil saturation, and imperviousness together. The fundamental comparison for infiltration-excess runoff is i > f, where i is rainfall intensity, and f is infiltration capacity. However, the presence or absence of saturation changes the interpretation of this comparison. Similarly, high imperviousness can dominate the response regardless of soil properties because rainfall falling on connected impervious surfaces bypasses soil infiltration.
The decision rules are described in Table 2. If rainfall intensity is greater than soil infiltration capacity and the soil is not saturated, the condition is classified as likely infiltration-excess runoff. If rainfall intensity is less than soil infiltration capacity but the soil is already saturated or near saturated, the condition is classified as likely saturation-excess runoff. If rainfall intensity is greater than soil infiltration capacity and the soil is also saturated, the condition is classified as a mixed runoff mechanism. If rainfall intensity is less than soil infiltration capacity and the soil has available storage, the condition is classified as low runoff potential. If the watershed or subcatchment has high imperviousness, roads, parking lots, rooftops, compacted urban surfaces, or hydraulically connected drainage infrastructure, the response is classified as direct urban runoff or mixed urban runoff.
A critical point is that i < f alone does not prove saturation-excess runoff. It only means that infiltration-excess runoff is unlikely based on the estimated intensity and infiltration capacity. Saturation-excess runoff requires evidence that the soil is saturated, near saturated, has limited available storage, or is influenced by shallow groundwater or restrictive layers. This distinction prevents misclassification and keeps the dashboard physically interpretable.
In the current dashboard, rainfall intensity and infiltration capacity are treated quantitatively and expressed in consistent units, with (i/f = 1) used as the main numerical decision boundary. Antecedent moisture and urban conditions are treated as user-defined screening inputs because their hydrologic effects vary among watersheds and cannot be represented by a single universal threshold. Antecedent moisture is described as dry, normal, wet, or saturated based on recent rainfall, field observations, soil-moisture data, groundwater conditions, or professional judgment. When quantitative soil-moisture data are available, the ratio θ/θs can be used to indicate relative wetness and the remaining soil-water storage.
Urban conditions can similarly be characterized using land-cover information, watershed development, and the impervious-area ratio (Aimp/Aw), where (Aimp) is the impervious area and (Aw) is the total watershed or subcatchment area. The interpretation of imperviousness should also consider the location and hydraulic connectivity of impervious surfaces to the drainage network. Where site-specific soil-moisture, land-cover, or impervious-area data are available, these values should be used instead of generalized categorical assumptions.
As configurable screening defaults, dry conditions may be represented by θ/θs < 0.50, normal conditions by 0.50 ≤ θ/θs < 0.80, wet conditions by 0.80 ≤ θ/θs < 0.90, near-saturated conditions by 0.90 ≤ θ/θs < 1.00, and saturated conditions by θ/θs ≈ 1.00. These ranges are intended only as screening guidance and should not be interpreted as universal hydrologic thresholds. Similarly, urban conditions may be described using the ratio of hydraulically connected impervious area to the total watershed or subcatchment area, Aimp/Aw. For screening purposes, configurable default ranges may be defined as low (Aimp/Aw < 0.10), moderate (0.10 < Aimp/Aw < 0.30), high (0.30 < Aimp/Aw < 0.50), and very high (Aimp/Aw ≥ 0.50) connected imperviousness.
These ranges are intended as practical screening guidance rather than universal hydrologic thresholds. Where site-specific imperviousness data or locally calibrated criteria are available, they should be used in place of these default ranges.
The runoff-classification algorithm and proposed screening ranges are summarized in Figure 2.
Table 2. Runoff mechanism classification rules.
|
Rainfall-Intensity Condition |
Moisture/Storage Condition |
Urban Condition |
Classification |
|---|---|---|---|
|
i > f |
Dry, or Normal |
Low to moderate imperviousness |
Infiltration-excess runoff |
|
i < f |
Wet, or Saturated |
Low to moderate imperviousness |
Saturation-excess runoff |
|
i > f |
Wet, or Saturated |
Any |
Mixed runoff mechanism |
|
i < f |
Dry, or Normal |
Low imperviousness |
Low runoff potential |
|
Any i/f relationship |
Any |
High connected impervious area |
Direct surface/Urban runoff |
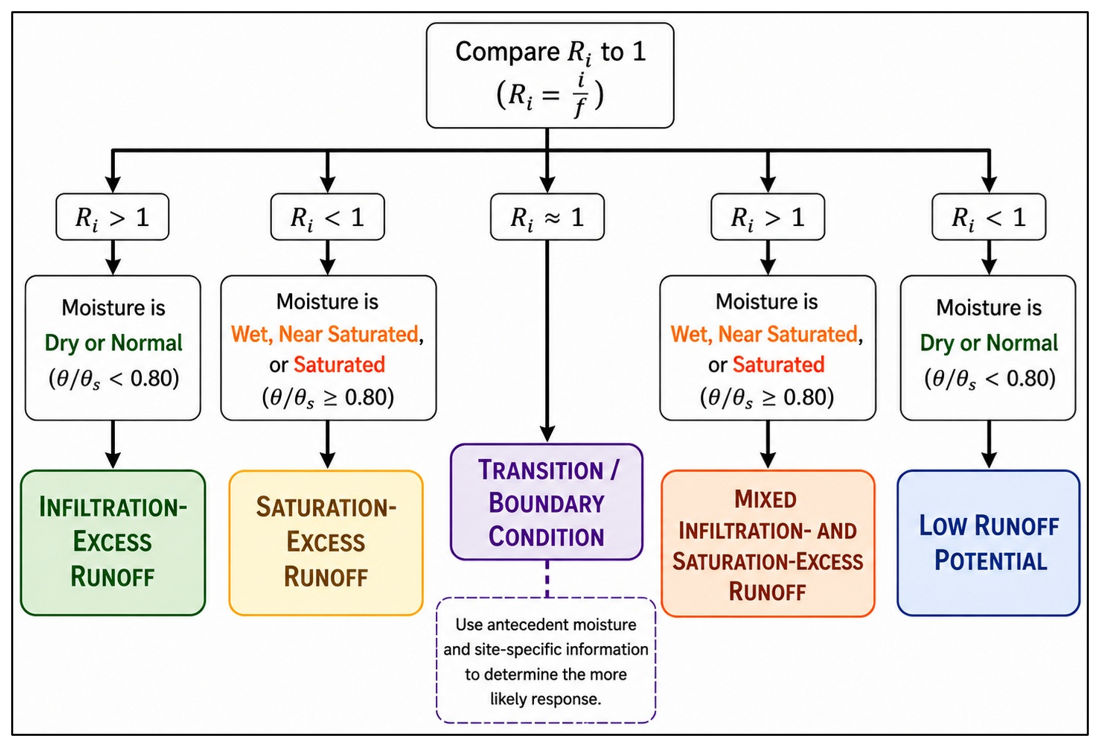
Figure 2. Runoff-classification algorithm for identifying the likely dominant runoff-generation mechanism.
3. Application of the Tool
The dashboard can be used by engineers, watershed planners, stormwater managers, environmental agencies, researchers, and emergency managers as a screening tool for watershed management. A typical user begins by selecting a watershed outlet or gauge, after which the dashboard automatically displays the watershed boundary. The user then reviews rainfall intensities for different design storms and compares them with the estimated soil infiltration capacity. By adjusting antecedent moisture and imperviousness assumptions, the user can evaluate how the dominant runoff mechanism changes between dry, normal, wet, and saturated conditions.
The dashboard is designed as a web application with a map-centered engineering layout. The front end uses an interactive GIS map to display the watershed outlet, watershed boundary, optional subcatchments, soil layers, and color-coded runoff classifications. The user interface includes a USGS gauge search box, a button for selecting an outlet point on the map, control panels for moisture and imperviousness inputs, upload tools for fallback datasets, summary cards, rainfall and classification tables, and charts comparing rainfall intensity with infiltration capacity.
The dashboard uses an automated backend workflow to retrieve and process data from selected public hydrologic data sources. The workflow includes data retrieval, unit conversion, watershed delineation, soil-property processing, and calculation of the variables used in the runoff-classification framework. Where automated data retrieval is unavailable, user-supplied watershed, rainfall, or soil datasets can be used to complete the analysis. The main dashboard components, their functions, and example implementation methods are summarized in Table 3.
For stormwater infrastructure planning, the tool can help identify whether runoff problems are likely driven by insufficient infiltration, saturated contributing areas, connected impervious surfaces, or a mixture of mechanisms. This information can guide the selection of management practices. Infiltration-excess areas may benefit from soil decompaction, infiltration basins, bioretention, permeable pavement, or impervious disconnection. Saturation-excess areas may require detention, floodplain reconnection, protection of saturated riparian zones, or practices that avoid placing infiltration facilities where storage is already limited. Urban runoff areas may require distributed detention, green streets, conveyance retrofits, inlet management, or water-quality treatment.
For communication and decision support, the dashboard provides visual outputs that are understandable to both technical and non-technical audiences. Maps show where the analysis applies; charts show whether rainfall intensity exceeds infiltration capacity; tables show the storm cases that trigger different classifications; and CSV downloads allow engineers and researchers to document assumptions, reproduce results, or import outputs into other models.
Table 3. Proposed dashboard components.
|
Component |
Function |
Example Implementation |
|---|---|---|
|
Interactive map |
Outlet selection and watershed visualization |
Leaflet, OpenStreetMap tiles, GeoJSON layers |
|
Gauge search |
Retrieve the location from the USGS gauge number |
USGS monitoring-location metadata request |
|
Watershed delineation |
Define the contributing drainage area |
NLDI basin endpoint or uploaded GeoJSON |
|
Rainfall module |
Retrieve depths and calculate intensities |
NOAA PFDS/Atlas 14 or uploaded rainfall CSV |
|
Soil module |
Estimate infiltration capacity |
SSURGO/SDA query or uploaded soil CSV |
|
Classification engine |
Assign the runoff mechanism by storm case |
Rules comparing i, f, moisture, and imperviousness |
|
Visualization module |
Communicate results |
Tables, cards, charts, and color-coded map layers |
|
Export module |
Support reporting and reproducibility |
Downloadable CSV and future PDF report |
Three example scenarios are presented to demonstrate the applicability of the tool and show how it identifies runoff mechanisms under different storm and watershed conditions.
3.1. Example 1: High-Intensity Short-Duration Storm
The first demonstration scenario evaluates the watershed response to a 10-year, 1-h storm. The antecedent moisture condition is set to normal, indicating that the soil is not saturated and still has available storage. The impervious-area percentage is kept low so that the classification is mainly controlled by the relationship between rainfall intensity and soil infiltration capacity rather than by direct urban runoff.
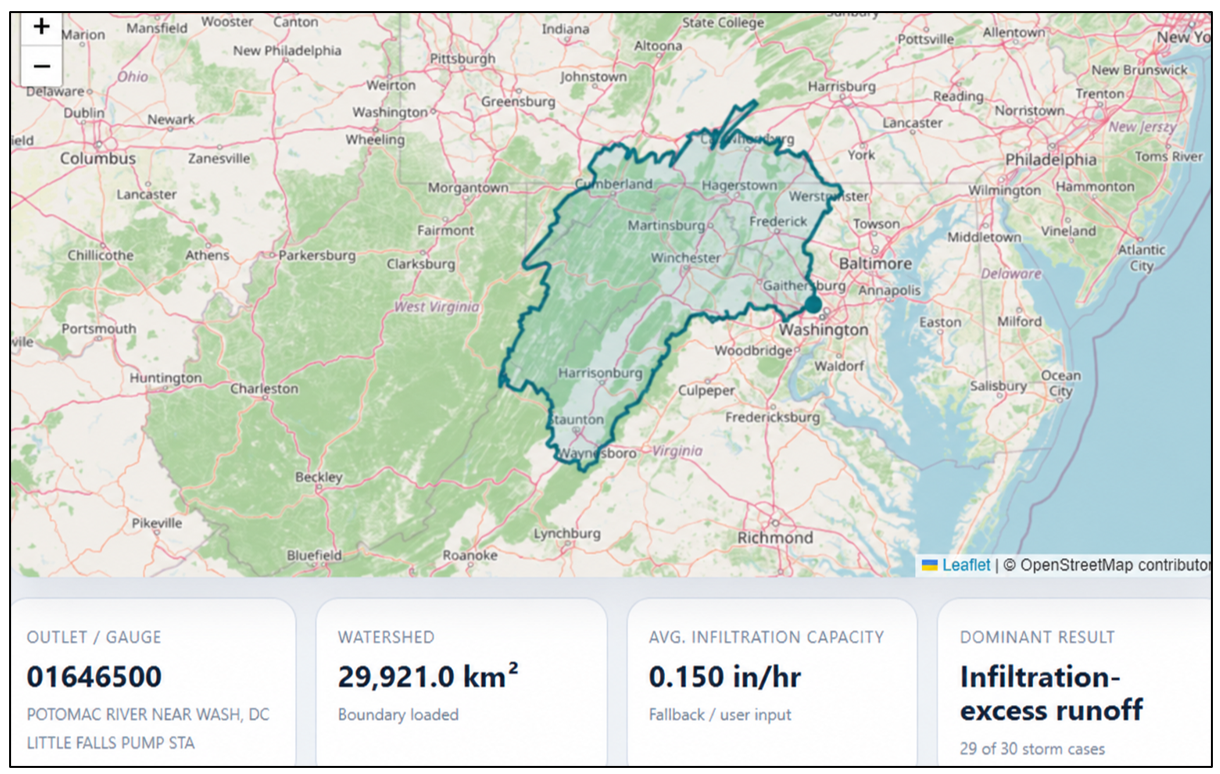
For this scenario, the dashboard retrieves the 10-year, 1-h rainfall depth and calculates the average rainfall intensity using (i = P/D). The calculated rainfall intensity is then compared with the estimated watershed-average infiltration capacity obtained from the soil data. For this scenario (i > f), under normal antecedent-moisture conditions and low imperviousness; therefore, the dashboard classified the event as infiltration-excess runoff (Figure 3). In the comparison chart, the rainfall-intensity value appears above the infiltration-capacity line. The classification table identifies the 10-year, 1-h event as infiltration-excess runoff and provides the rainfall depth, calculated intensity, infiltration capacity, antecedent moisture condition, and classification basis.
This scenario represents conditions that may occur during intense convective storms in small urban or suburban catchments, in agricultural fields with surface crusting, on construction sites, in disturbed soils, and in compacted open areas. The result suggests that management strategies should focus on increasing surface infiltration, reducing soil compaction, disconnecting rapid runoff pathways, and using infiltration-based green infrastructure where site conditions are suitable.
 |
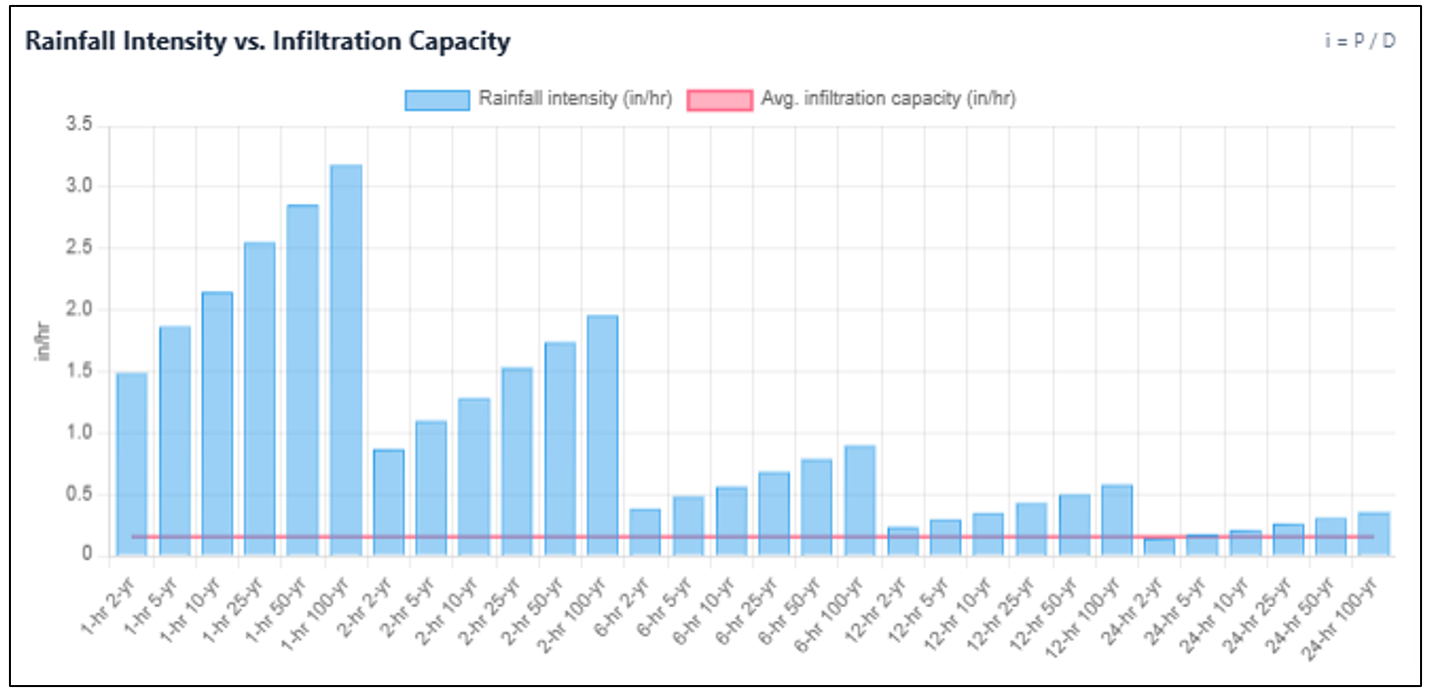 |
Figure 3. Dashboard results for the watershed draining to USGS streamgage 01646500, Potomac River near Washington, DC, under normal antecedent-moisture conditions and low imperviousness.
3.2. Example 2: Moderate Rainfall After Wet Antecedent Conditions
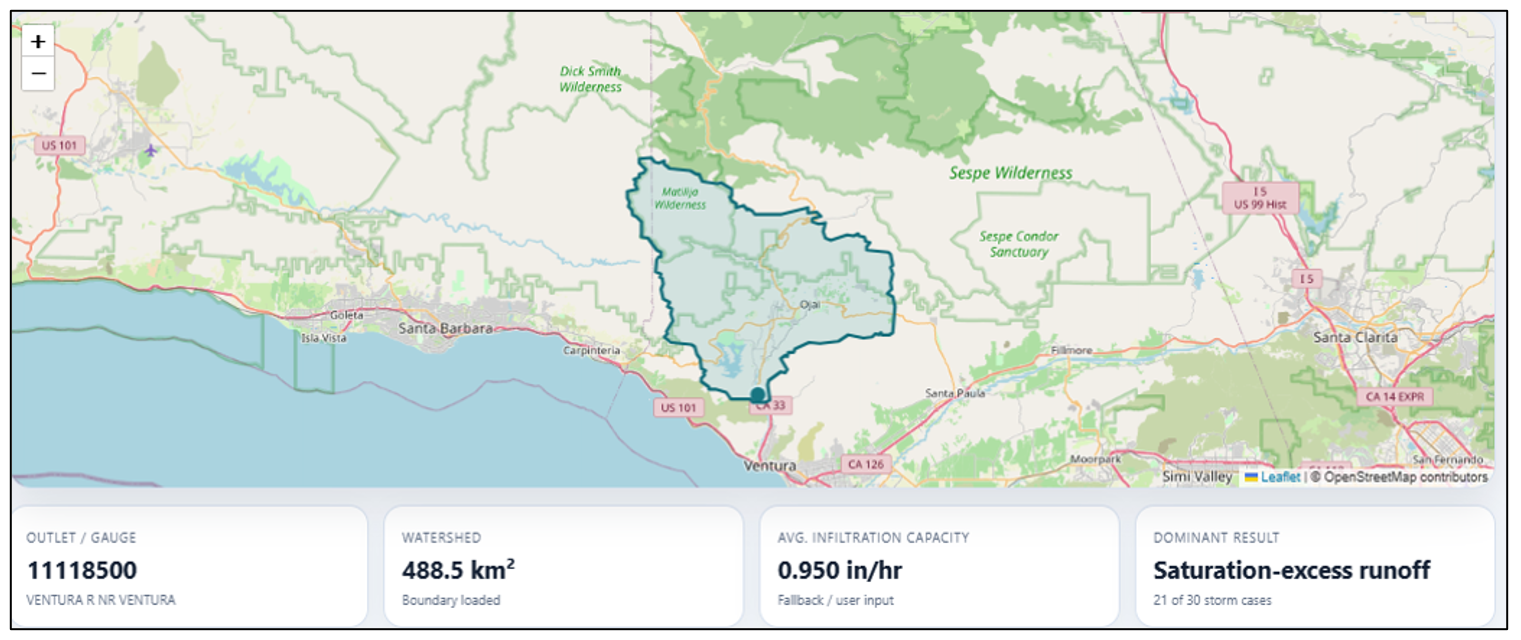
For the second demonstration scenario, USGS streamgage 11118500 was selected as the watershed outlet. The dashboard used the streamgage location to identify and display the upstream contributing watershed. A 2-year or 5-year storm was then evaluated under wet antecedent moisture conditions, representing a storm occurring after several days of rainfall.
In this example, the calculated rainfall intensity was lower than the estimated watershed-average infiltration capacity. Therefore, rainfall was not being supplied faster than the soil could normally absorb it, and infiltration-excess runoff was considered unlikely. However, the wet antecedent condition indicated that available soil-water storage was limited and that near-stream, low-lying, or poorly drained areas could already be saturated.
Based on the combination of i < f and wet or near-saturated soil conditions, the dashboard classified the storm response as saturation-excess runoff. The result demonstrates that rainfall intensity alone is insufficient for identifying the dominant runoff mechanism. Even a moderate storm may generate substantial runoff when the soil profile has limited remaining storage.
The dashboard displays the watershed boundary, rainfall intensity, infiltration capacity, antecedent moisture condition, and resulting classification (Figure 4). For this scenario, the rainfall-intensity value appears below the infiltration-capacity line, while the classification table identifies the event as saturation-excess dominated.
The result suggests that watershed management should focus on available storage, drainage pathways, floodplain and riparian areas, shallow groundwater conditions, and the protection or restoration of variable source areas. Because the wet antecedent condition is selected as part of the demonstration, this example should be described as a controlled scenario unless observed rainfall or soil-moisture data are used to confirm the initial watershed conditions.
 |
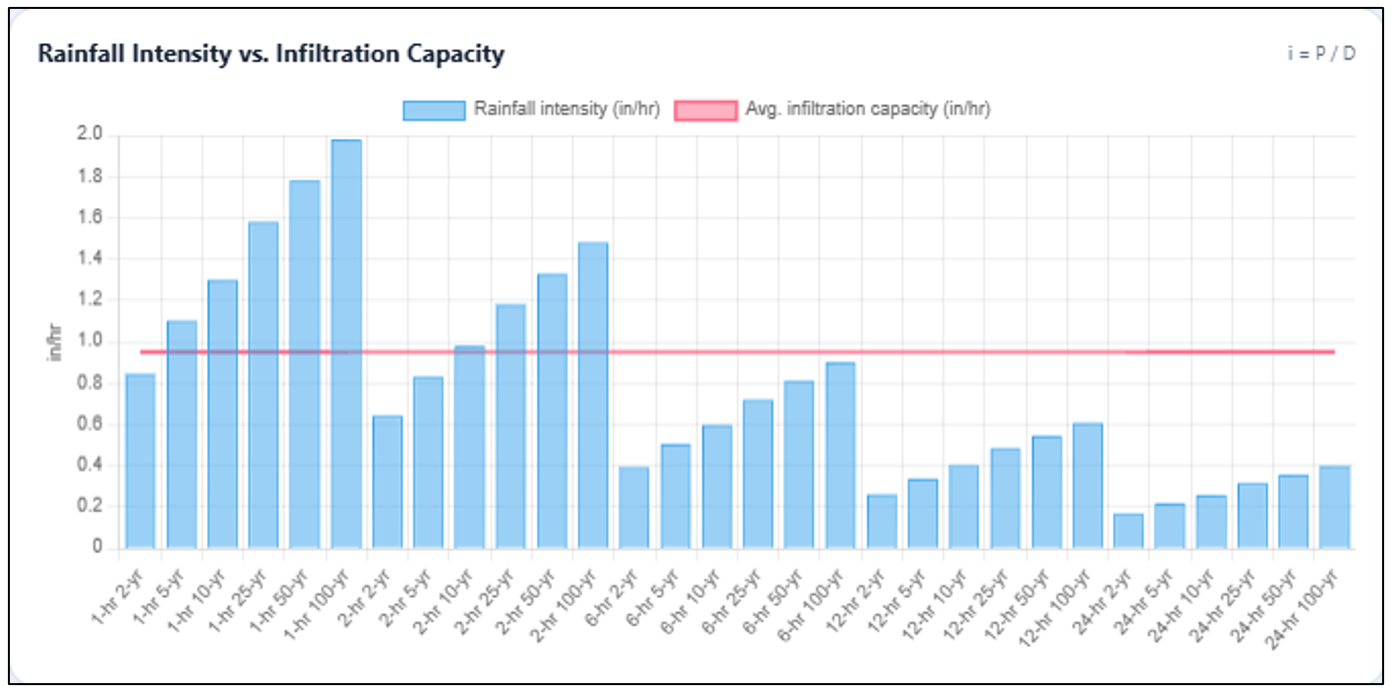 |
Figure 4. Dashboard results for the watershed draining to USGS streamgage 11118500 under wet antecedent-moisture conditions.
3.3. Example 3: Urbanized Watershed With High Imperviousness
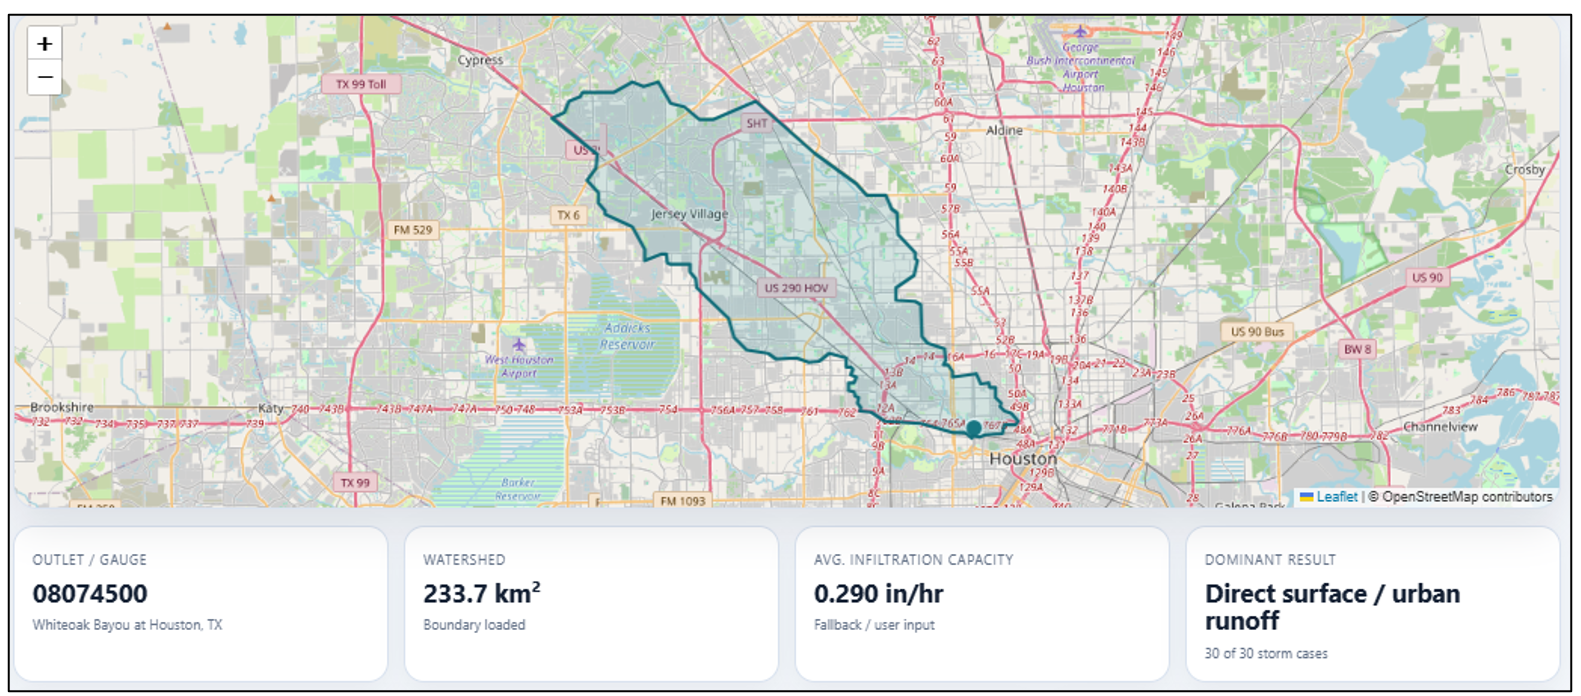
For the third demonstration scenario, USGS streamgage 08074500 at Whiteoak Bayou in Houston, Texas, was selected as the watershed outlet. Whiteoak Bayou drains a developed portion of the Houston metropolitan area and provides an appropriate example for evaluating runoff in an urbanized watershed. Previous USGS studies have associated increased streamflow in Whiteoak Bayou with urbanization and increasing impervious cover.
For this controlled demonstration, the antecedent moisture condition was set to normal, and the watershed imperviousness was assumed to be 60%. This value exceeded the urban-runoff threshold used by the dashboard. A 2-year, 1-h design storm was then selected to represent a relatively frequent short-duration rainfall event.
Although some soils within the watershed may have moderate infiltration capacity, much of the rainfall falling on roads, rooftops, parking lots, sidewalks, and other impervious surfaces does not contact natural soil. Instead, the water is rapidly converted into surface runoff and transported through gutters, storm drains, ditches, and constructed channels. Consequently, soil infiltration capacity is not the primary control on runoff generation across the impervious portions of the watershed.
Because the assumed imperviousness exceeded the dashboard threshold, the event was classified as direct urban runoff. The dashboard displayed the watershed boundary, rainfall intensity, soil infiltration capacity, antecedent moisture condition, impervious-area percentage, and final runoff classification (Figure 5). Depending on rainfall intensity and soil moisture conditions, similarly developed watersheds may also be classified as mixed urban runoff.
The result indicates that management should focus on disconnecting impervious surfaces, installing green streets and bioretention systems, increasing detention and retention storage, providing water-quality treatment, and evaluating storm-sewer and channel capacity. The assumed 60% imperviousness should be identified as a demonstration input unless an actual land-cover analysis is completed for the watershed.
 |
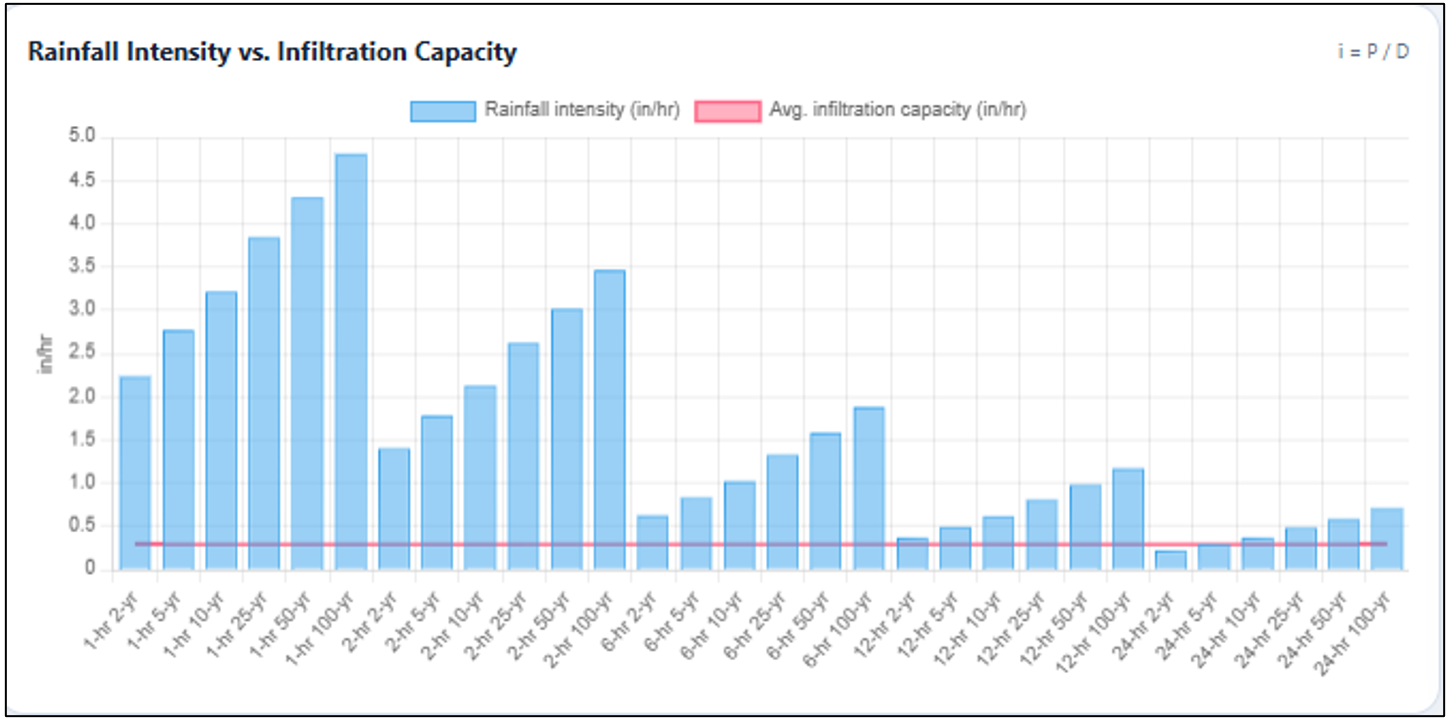 |
Figure 5. Dashboard results for USGS streamgage 08074500, Whiteoak Bayou at Houston, Texas, using normal antecedent-moisture conditions and an assumed 60% impervious area for the controlled demonstration.
3.4. Example 4: Mixed Runoff Mechanisms in a Multi-Land-Cover Watershed
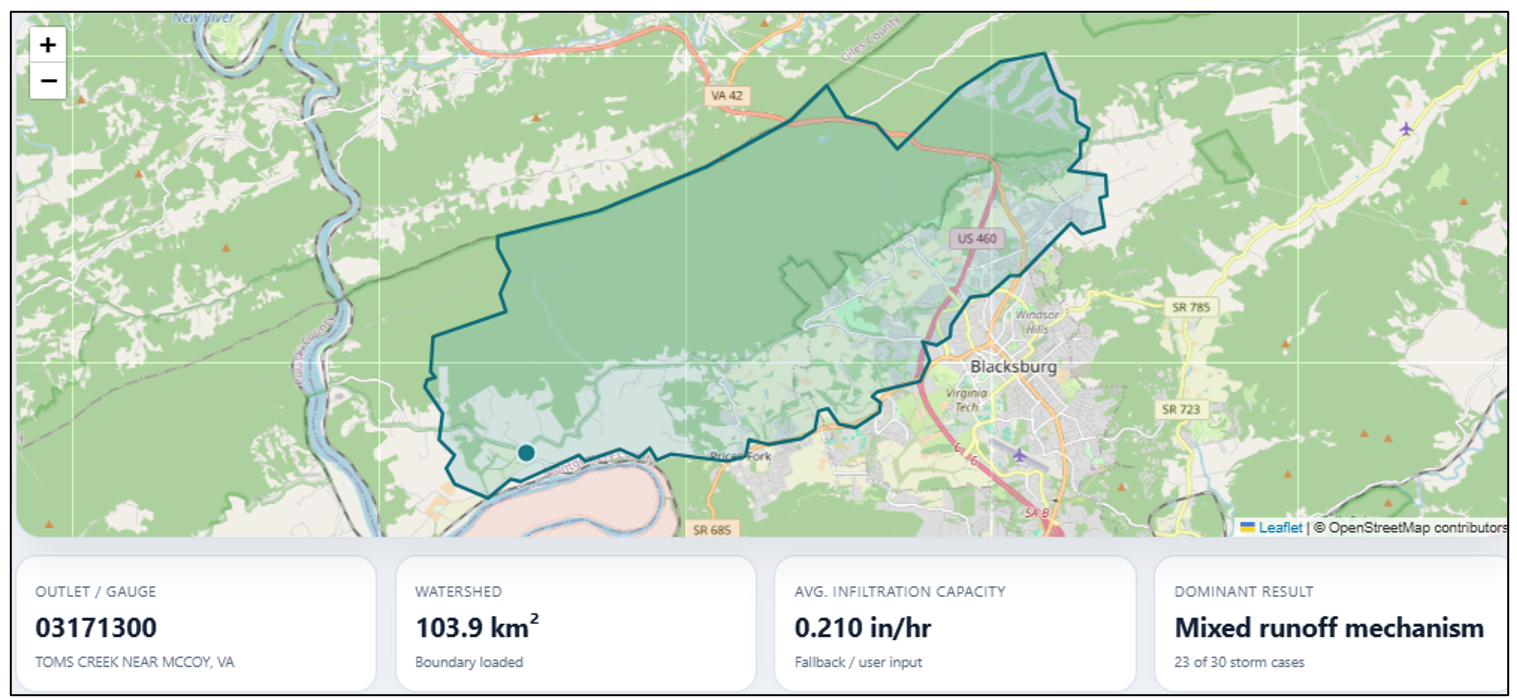
For the mixed urban runoff demonstration, USGS streamgage 03171300, Toms Creek near McCoy, Virginia, was selected as the watershed outlet. In this controlled scenario, the watershed imperviousness is set above the dashboard’s urban-runoff threshold, while rainfall intensity exceeds the estimated infiltration capacity or the antecedent soil condition is wet. As a result, runoff is generated both from connected impervious surfaces, such as roads, rooftops, and parking areas, and from pervious areas where infiltration or soil storage is limited. The dashboard, therefore, classifies the response as mixed urban runoff, indicating that both urban drainage infrastructure and natural watershed conditions contribute to the storm response (Figure 6). This result suggests using a combination of impervious-area disconnection, bioretention, detention storage, improved stormwater conveyance, and soil-infiltration practices. Because the selected streamgage is not being confirmed here as a highly urbanized watershed, any high imperviousness value should be identified as an assumed demonstration input unless it is supported by land-cover data.
 |
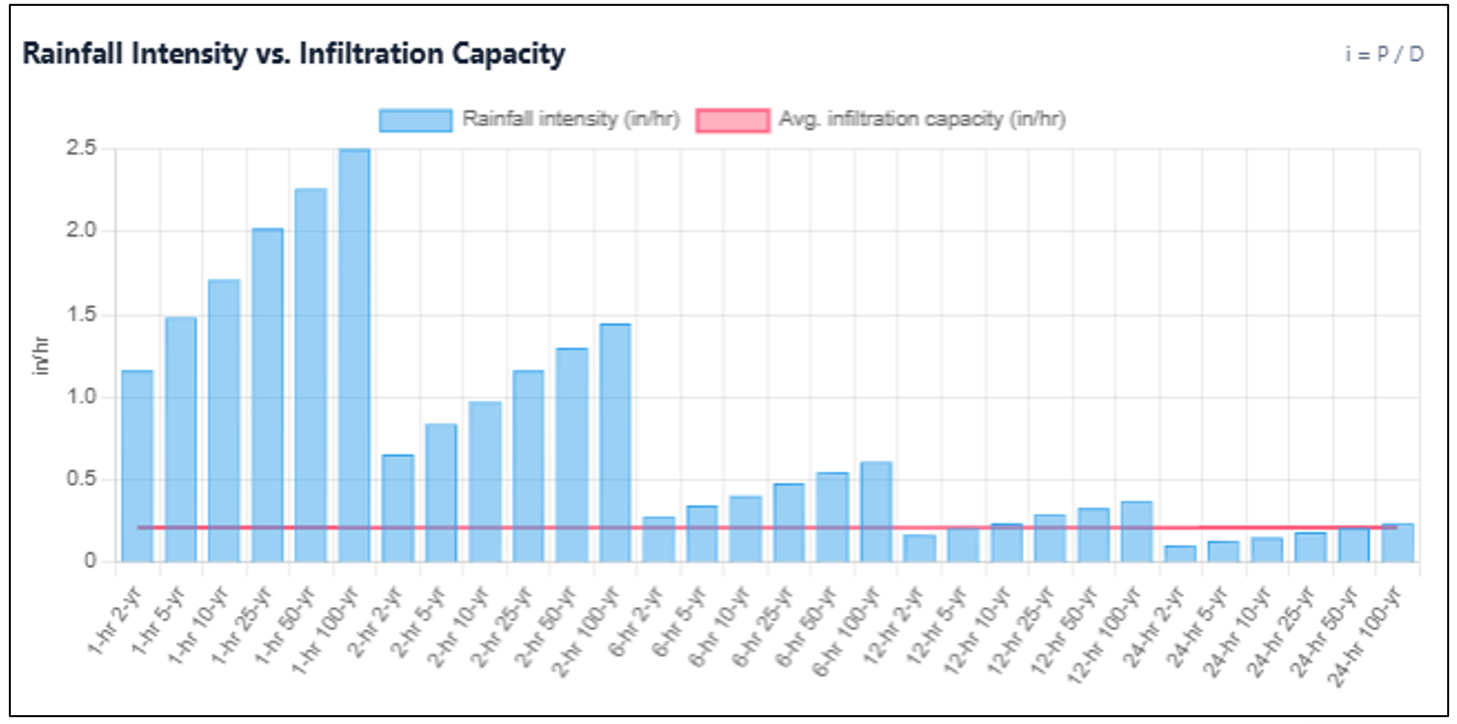 |
Figure 6. Dashboard results for USGS streamgage 03171300, Toms Creek near McCoy, Virginia, representing a multi-land-cover watershed under a controlled mixed-runoff scenario.
4. Results and Discussion
Runoff mechanism classification is important because it links hydrologic observations to process understanding and management action. Traditional design workflows often focus on peak discharge, runoff depth, or design-storm sizing. These outputs are necessary, but they may not indicate whether runoff is generated by rainfall exceeding infiltration capacity, by a saturated soil profile, by impervious surfaces bypassing infiltration, or by multiple mechanisms interacting. A classification dashboard can help interpret the physical cause of runoff and, therefore, guide more appropriate interventions.
The proposed dashboard improves watershed management by making public hydrologic data more accessible and actionable. Instead of requiring users to separately obtain gauge coordinates, delineate a watershed, retrieve rainfall-frequency values, download soil data, compute infiltration estimates, and assemble spreadsheets, the dashboard organizes these steps in one workflow. This improves reproducibility and reduces the barrier for preliminary screening. It also helps users understand the assumptions behind classification because the dashboard displays rainfall intensity, infiltration capacity, moisture condition, and classification logic directly.
The application examples demonstrate how the classification framework responds to different combinations of rainfall intensity, antecedent moisture, soil infiltration potential, and imperviousness. Because the physical basis and decision rules are defined in Section 2.7 and Table 2, the discussion here focuses on the interpretation of the resulting classifications and the limitations of their use for screening.
Urban watersheds often require a mixed interpretation. Impervious surfaces generate direct runoff regardless of soil infiltration capacity, while compacted pervious areas may generate infiltration-excess runoff, and low-lying riparian areas may generate saturation-excess runoff during wet periods. Therefore, a watershed-average classification can be useful for screening, but subcatchment-scale classification is preferred for management. Integrating land cover, connected impervious area, storm sewer networks, and subcatchment topology would improve the dashboard for urban engineering applications.
The runoff classifications produced by the dashboard were also compared with the general runoff patterns reported by [29]. In their study, the dominant runoff mode across the conterminous United States was evaluated by comparing surficial saturated hydraulic conductivity with rainfall-frequency estimates. The dashboard classifications were generally consistent with the runoff-generation patterns identified in that study, providing additional support for the physical basis of the proposed framework. However, the present approach considers additional factors, including antecedent moisture conditions and imperviousness. This allows the framework to distinguish not only between infiltration-excess and saturation-excess runoff, but also mixed runoff conditions and direct urban runoff.
The mixed-runoff classification obtained for the Toms Creek watershed was also consistent with [6], who reported that multiple runoff-generation processes occur within the watershed. This agreement provides additional support for the physical basis of the dashboard classification, although it should not be considered event-scale quantitative validation.
Runoff-generation mechanisms may vary systematically with watershed development and storm characteristics, although these patterns should not be interpreted as universal. In highly urbanized watersheds, runoff is often strongly influenced by connected impervious surfaces that bypass natural soil infiltration, while compacted or disturbed pervious areas may also favor infiltration-excess runoff. In rural and semi-rural watersheds, rainfall intensity and antecedent soil conditions generally play a greater role in determining the dominant runoff mechanism. Short-duration, high-intensity storms are more likely to generate infiltration-excess runoff when rainfall intensity exceeds the soil infiltration capacity (i > f). In contrast, lower-intensity, longer-duration storms may progressively reduce available soil-water storage and increase the likelihood of saturation-excess runoff, particularly when antecedent conditions are already wet or near saturated. Therefore, the dominant runoff mechanism cannot be determined solely by land-cover type but should be evaluated based on the combined effects of rainfall intensity and duration, infiltration potential, antecedent moisture, and imperviousness.
The classifications presented in this study should not be considered permanent characteristics of a watershed. Runoff-generation mechanisms can change with storm intensity, antecedent moisture, soil conditions, and the degree of urbanization at the time of an event. As a result, the same watershed may experience different dominant runoff mechanisms during different storms or seasons. The dashboard is therefore intended to identify the likely runoff mechanism for a specific set of hydrologic conditions rather than assign a single runoff class to a watershed. It also organizes hydrologic information that can support more detailed rainfall-runoff modeling, but it does not directly simulate runoff volume, peak discharge, or hydrograph response.
Uncertainty should be communicated clearly. Rainfall-frequency estimates have sampling uncertainty and may not represent localized convective variability. Soil infiltration capacity derived from SSURGO or hydrologic soil group is approximate and may not capture local compaction, soil amendments, fill material, macropores, or surface sealing. Antecedent moisture from user input or gridded products may not capture small-scale variability. Watershed delineation depends on hydrographic datasets and outlet positioning. For these reasons, the dashboard should be described as a screening and decision-support tool that requires calibration, field verification, and professional judgment for design-level decisions.
4.1. Practical Applications for Watershed Management
City engineers can use the dashboard to screen drainage areas before detailed hydrologic or hydraulic modeling. By identifying storm cases that exceed soil infiltration capacity or activate saturation-excess conditions, engineers can better select modeling assumptions, identify critical subcatchments, and communicate why certain drainage improvements may be needed. Stormwater managers can use the tool to evaluate whether green infrastructure should emphasize infiltration, storage, detention, filtration, or impervious disconnection.
Watershed planners and environmental agencies can use the dashboard to prioritize restoration and conservation. Areas classified as saturation-excess dominated may correspond to riparian wetlands, floodplains, shallow groundwater zones, or variable source areas that should be protected or restored. Areas classified as infiltration-excess dominated may indicate compacted soils, degraded uplands, or locations where infiltration practices could reduce runoff if site conditions allow. Urban runoff classifications can support prioritization of green streets, parking-lot retrofits, tree canopy expansion, and stormwater treatment.
Researchers can use the dashboard as a reproducible framework for comparing watersheds, design storms, and antecedent moisture scenarios. Emergency managers can use it as a communication tool to understand whether upcoming storms are likely to produce rapid runoff due to intensity, saturated conditions due to previous rainfall, or urban drainage response due to imperviousness. The tool can also support education by showing students how rainfall intensity, infiltration capacity, and soil saturation interact to produce different runoff mechanisms.
4.2. Limitations
The proposed dashboard has several limitations. First, soil infiltration capacity is uncertain and spatially variable. A watershed-average infiltration value can hide important differences among soil units, hillslope positions, compacted areas, and engineered landscapes. Second, public soil datasets may not represent current urban soil conditions, especially where grading, fill, construction, compaction, or landscaping has altered the original soil profile. Third, antecedent moisture is difficult to estimate at a fine spatial scale. User input is simple but subjective, while remote sensing and land-surface models may be too coarse for small watersheds.
SSURGO-derived hydraulic properties introduce some uncertainty because they do not directly represent event-scale infiltration capacity. In this study, the area-weighted infiltration capacity is used only as a screening-level estimate of overall watershed behavior. For larger or more heterogeneous watersheds, subdivision into smaller subcatchments may be needed. Uncertainty is also higher in urban or disturbed areas where compaction, grading, or fill can alter soil properties. Where available, field-measured or locally calibrated infiltration data should be used for site-specific applications.
Fourth, precipitation-frequency values represent statistical estimates at a point or region and may not capture the spatial variability of actual storm cells. Fifth, watershed delineation depends on the quality of the hydrographic network, elevation data, and outlet selection. A point selected away from the mapped stream network may produce an incorrect or failed delineation. Sixth, runoff mechanisms are not always separable in complex watersheds. A single storm may produce infiltration-excess runoff on compacted uplands, saturation-excess runoff in riparian zones, and direct urban runoff from connected impervious surfaces. Seventh, the dashboard does not replace calibration with observed streamflow hydrographs, field infiltration measurements, soil moisture observations, or detailed hydrologic/hydraulic models.
4.3. Future Work
Future work should extend the dashboard from watershed-average screening to subcatchment-scale and grid-scale analysis. This requires intersecting watershed and subcatchment boundaries with SSURGO map-unit polygons, land cover, imperviousness, slope, flow accumulation, and drainage infrastructure. A future version should compute infiltration capacity and runoff classification for each subcatchment and display the spatial pattern on the map.
Future development should also integrate real-time rainfall and soil moisture. Real-time precipitation from radar or gauge networks could be combined with antecedent precipitation indices and soil moisture from local sensors, SMAP, or NLDAS. This would allow event-based classification rather than only design-storm screening. Calibration using observed USGS streamflow hydrographs would allow the dashboard to compare predicted runoff mechanisms with observed hydrograph timing, runoff ratio, peak response, and recession behavior.
Further validation of the proposed framework should include comparisons with independent process-level observations and documented runoff-generation studies. Such validation may incorporate measured rainfall intensity, field infiltration measurements, soil-moisture observations, groundwater levels, observed saturated contributing areas, and published classifications of runoff mechanisms.
Additional improvements include coupling with HEC-HMS, SWMM, SWAT, or other hydrologic/hydraulic models; adding climate change rainfall scenarios; estimating uncertainty bands for rainfall intensity and infiltration capacity; implementing machine learning classification using historical events; adding green infrastructure optimization; exporting engineering reports; and storing projects for repeat analysis. These improvements would move the dashboard from an MVP decision-support tool toward a more comprehensive watershed modeling platform.
5. Conclusions
This manuscript presents a conceptual and technical framework for an automated watershed dashboard that identifies likely runoff-generation mechanisms based on rainfall intensity, soil infiltration capacity, antecedent moisture conditions, and watershed characteristics. The framework combines watershed delineation, rainfall-frequency data, soil infiltration estimates, moisture conditions, and runoff classification within a single screening workflow. The examples show how the framework can distinguish among infiltration-excess, saturation-excess, mixed, direct urban runoff, and low-runoff-potential conditions under different watershed and storm scenarios.
The classification is based on the main physical controls of runoff generation. When rainfall intensity exceeds the soil infiltration capacity and soil storage is still available, infiltration-excess runoff is likely to occur. In contrast, rainfall intensity below the infiltration capacity does not automatically indicate saturation-excess runoff; saturated or near-saturated soil conditions and limited storage must also be present. Impervious surfaces are also considered because rainfall on hydraulically connected impervious areas can bypass natural soil infiltration. These criteria provide a simple and transparent basis for identifying the likely dominant runoff mechanism.
The current study focuses on demonstrating the classification and screening capabilities of the framework rather than evaluating improvements in flood prediction, infrastructure design, or watershed management. The dashboard may be useful as a preliminary screening tool for watershed planning, stormwater assessment, green infrastructure evaluation, and restoration planning. However, these applications require further validation using observed watershed data and site-specific information. Further development should include validation against documented runoff-generation events, greater use of spatially distributed subcatchment data, quantitative antecedent-moisture information, and comparison or integration with established hydrologic models.
Author Contributions
Conceptualization, H.A.; Methodology, H.A.; Software, H.A. and H.M.E.; Validation, H.A. and H.M.E.; Formal Analysis, H.A.; Investigation, H.A. and H.M.E.; Data Curation, H.A. and H.M.E.; Writing—Original Draft Preparation, H.A.; Writing—Review & Editing, H.A. and H.M.E.; Visualization, H.A. and H.M.E.; Supervision, H.A.
Ethics Statement
Not applicable.
Informed Consent Statement
Not applicable.
Data Availability Statement
The watershed dashboard developed in this study are publicly available at the following GitHub repository: https://github.com/Ahmadi-Hosein (accessed on 13 September 2026), to support reproducibility and transparency.
Funding
This research received no external funding.
Declaration of Competing Interest
The authors declare that they have no known competing financial interests or personal relationships that could have appeared to influence the work reported in this paper.
References
- Winter TC, Harvey JW, Franke OL, Alley WM. Ground Water and Surface Water: A Single Resource; Diane Publishing: Collingdale, PA, USA, 1998. [Google Scholar]
- White ED, Easton ZM, Fuka DR, Collick AS, Adgo E, McCartney M, et al. Development and application of a physically based landscape water balance in the SWAT model. Hydrol. Process. 2011, 25, 915–925. DOI:10.1002/hyp.7876 [Google Scholar]
- Ahmadi H. An Overview of Non-Point Source Pollution Modeling: Current Status and Future Prospect. J. Civ. Eng. Res. Technol. 2023, 5, 1. DOI:10.47363/JCERT/2023(5)140 [Google Scholar]
- Hong Y, Abeshu GW, Li HY, Wang D, Zhao M, Wild T, et al. A unified scheme for modeling saturation and infiltration excess runoff. Hydrol. Earth Syst. Sci. 2026, 30, 4293–4303. DOI:10.5194/hess-30-4293-2026 [Google Scholar]
- Easton ZM, Fuka DR, Walter MT, Cowan DM, Schneiderman EM, Steenhuis TS. Re-conceptualizing the soil and water assessment tool (SWAT) model to predict runoff from variable source areas. J. Hydrol. 2008, 348, 279–291. DOI:10.1016/j.jhydrol.2007.10.008 [Google Scholar]
- Ahmadi H, Scott D, Sample DJ. Coupling SWAT+ and SWMM Models to Quantify Streamflow in Mixed Rural–Urban Watersheds. Hydrol. Process. 2025, 39, e70218. DOI:10.1002/hyp.70218 [Google Scholar]
- Li C, Liu M, Hu Y, Shi T, Qu X, Walter MT. Effects of urbanization on direct runoff characteristics in urban functional zones. Sci. Total Environ. 2018, 643, 301–311. DOI:10.1016/j.scitotenv.2018.06.211 [Google Scholar]
- Liu Y, Luo Y, Li Z, Liu Z, Wang C, Fu X, et al. Spatiotemporal dynamic runoff generation process and distribution characteristics of the saturation-excess and infiltration-excess modes in the semi-humid and semi-arid regions. J. Hydrol. Reg. Stud. 2025, 61, 102589. DOI:10.1016/j.ejrh.2025.102589 [Google Scholar]
- Ahmadi H, Scott D, Sample DJ, Saksena S. Evaluating the combined effects of climate and land use change on hydrological response in a mixed land use watershed. J. Environ. Manag. 2026, 397, 128277. DOI:10.1016/j.jenvman.2025.128277 [Google Scholar]
- Chen J, Theller L, Gitau MW, Engel BA, Harbor JM. Urbanization impacts on surface runoff of the contiguous United States. J. Environ. Manag. 2017, 187, 470–481. DOI:10.1016/j.jenvman.2016.11.017 [Google Scholar]
- Ahmadi H, Scott D, Sample DJ, Shahed Behrouz M. Automated Calibration of SWMM for Improved Stormwater Model Development and Application. Hydrology 2025, 12, 129. DOI:10.3390/hydrology12060129 [Google Scholar]
- Ahmadi H. Modeling of groundwater-surface water interactions: A review of integration strategies. ISH J. Hydraul. Eng. 2024, 30, 132–146. DOI:10.1080/09715010.2023.2263434 [Google Scholar]
- Zhang J, Yang LP, Chen Z-J, Peng S-T, Xing B. Spatiotemporal Variability of Runoff Coefficients and Rainfall–Runoff Responses in a Mountainous Basin Using Integrated Hydrological Analogy and SCS–CN Models. Water Resour. Manag. 2026, 40, 163. DOI:10.1007/s11269-026-04555-w [Google Scholar]
- Horton RE. The role of infiltration in the hydrologic cycle. Trans. Am. Geophys. Union 1933, 14, 446–460. DOI:10.1029/TR014i001p00446 [Google Scholar]
- Philip JR. The theory of infiltration: 1. The infiltration equation and its solution. Soil Sci. 1957, 83, 345–358. DOI:10.1097/00010694-195705000-00002 [Google Scholar]
- Steenhuis TS, Schneiderman EM, Mukundan R, Hoang L, Moges M, Owens EM. Revisiting SWAT as a Saturation-Excess Runoff Model. Water 2019, 11, 1427. DOI:10.3390/w11071427 [Google Scholar]
- Dunne T, Black RD. Partial Area Contributions to Storm Runoff in a Small New England Watershed. Water Resour. Res. 1970, 6, 1296–1311. DOI:10.1029/WR006i005p01296 [Google Scholar]
- Beven KJ, Kirkby MJ. A physically based, variable contributing area model of basin hydrology. Hydrol. Sci. Bull. 1979, 24, 43–69. DOI:10.1080/02626667909491834 [Google Scholar]
- Xu Y, Yu Q, Liu C, Li W, Quan L, Niu C, et al. Construction of a semi-distributed hydrological model considering the combination of saturation-excess and infiltration-excess runoff space under complex substratum. J. Hydrol. Reg. Stud. 2024, 51, 101642. DOI:10.1016/j.ejrh.2023.101642 [Google Scholar]
- Ahmadi H, Scott D, Sample DJ, Hession WC. Optimizing stormwater control measures for improving climate resiliency in mixed urban–rural watersheds. Blue-Green Syst. 2026, 8, 81–109. DOI:10.2166/bgs.2026.046 [Google Scholar]
- Yang WY, Li D, Sun T, Ni GH. Saturation-excess and infiltration-excess runoff on green roofs. Ecol. Eng. 2015, 74, 327–336. DOI:10.1016/j.ecoleng.2014.10.023 [Google Scholar]
- Ahmadi H. An implicit numerical model for solving free-surface seepage problems. ISH J. Hydraul. Eng. 2022, 28, 391–399. DOI:10.1080/09715010.2021.1925982 [Google Scholar]
- Dymond RL, Regmi B, Lohani VK, Dietz R. Interdisciplinary Web-Enabled Spatial Decision Support System for Watershed Management. J. Water Resour. Plann. Manage. 2004, 130, 290–300. DOI:10.1061/(ASCE)0733-9496(2004)130:4(290) [Google Scholar]
- Choi JY, Engel BA, Farnsworth RL. Web-based GIS and spatial decision support system for watershed management. J. Hydroinform. 2005, 7, 165–174. DOI:10.2166/hydro.2005.0014 [Google Scholar]
- Zhang D, Chen X, Yao H. Development of a Prototype Web-Based Decision Support System for Watershed Management. Water 2015, 7, 780–793. DOI:10.3390/w7020780 [Google Scholar]
- Shao H, Yang W, Lindsay J, Liu Y, Yu Z, Oginskyy A. An Open SourceGIS‐Based Decision Support System for Watershed Evaluation of Best Management Practices. J. Am. Water Resour. Assoc. 2017, 53, 521–531. DOI:10.1111/1752-1688.12521 [Google Scholar]
- Qiu Y, Duan H, Xie H, Ding X, Jiao Y. Design and development of a web‐based interactive twin platform for watershed management. Trans. GIS 2022, 26, 1299–1317. DOI:10.1111/tgis.12904 [Google Scholar]
- Venable K, Johnston JM, LeDuc SD. Streamlining land surface model Initialization: Automated data retrieval for VELMA using HMS REST API and GDAL. Environ. Model. Softw. 2025, 191, 106492. DOI:10.1016/j.envsoft.2025.106492 [Google Scholar]
- Buchanan B, Auerbach DA, Knighton J, Evensen D, Fuka DR, Easton Z, et al. Estimating dominant runoff modes across the conterminous United States. Hydrol. Process. 2018, 32, 3881–3890. DOI:10.1002/hyp.13296 [Google Scholar]
- Stewart RD, Bhaskar AS, Parolari AJ, Herrmann DL, Jian J, Schifman LA, et al. An analytical approach to ascertain saturation‐excess versus infiltration‐excess overland flow in urban and reference landscapes. Hydrol. Process. 2019, 33, 3349–3363. DOI:10.1002/hyp.13562 [Google Scholar]