
Responses of Riparian Vegetation in Cascade Reservoirs to Contrasting Flow Regulation Types

Responses of Riparian Vegetation in Cascade Reservoirs to Contrasting Flow Regulation Types
Junyao Sun 1,† Zarah Pattison 2,† Yu Cao 1 Xiujuan Qiao 3 Wei Wang 1 Fan Liu 1 Taoze Liu 4 Nigel J. Willby 2,* Wei Li 1,5,*
Received: 28 April 2026 Revised: 29 May 2026 Accepted: 09 July 2026 Published: 21 August 2026

© 2026 The authors. This is an open access article under the Creative Commons Attribution 4.0 International License (https://creativecommons.org/licenses/by/4.0/).
1. Introduction
The construction of dams affects river ecosystems by altering flow regimes and connectivity [1,2]. Damming fragments the river channel [3] and associated floodplain habitats [4], leading to a series of environmental problems, including biodiversity loss [5], barriers to fish migration [6], altered sediment transport [7] and water eutrophication [8]. These impacts remain highly relevant because freshwater biodiversity is declining rapidly worldwide, and recent recovery frameworks emphasize environmental flows, water-quality improvement, habitat restoration, invasive species control, and the safeguarding or restoration of river connectivity as key actions to reverse freshwater biodiversity loss [9,10]. At the same time, increasing demand for irrigation, hydropower, fisheries, recreation, and drinking water continues to drive reservoir construction and operation [11]. Recent studies have therefore shifted from simply documenting dam impacts to assessing how environmental flows, ecological operation, hydropower planning under environmental constraints, and dam removal can mitigate ecological degradation in regulated rivers [12,13,14,15]. Given these developments, it is important to understand how damming and reservoir regulation affect biodiversity and riparian vegetation across different biogeographical and operational contexts.
The Water level fluctuation (WLF) zone of a reservoir refers to the region between the lowest and highest water level [16]. Although WLFs occur naturally in lakes across seasonal and interannual timescales [17], they are often intensified after dam construction. Artificial flow regulation disturbs the natural flow regime in reservoirs and downstream river, usually increasing the range, frequency, duration, and seasonality of water-level fluctuations. Existing riparian species, particularly plants adapted to natural flow regimes, may be poorly suited to these altered hydrological conditions [18]. Together with increased sedimentation and altered nutrient and organic matter fluxes caused by damming [19], these changes can affect plant growth, phenology, seed dispersal, regeneration, and floristic composition [20,21,22]. As a result, WLF zones in reservoirs often support lower plant diversity and biomass than natural riparian zones, and are commonly dominated by species in early or intermediate successional stages [23,24,25]. These disturbed conditions can also facilitate the spread and establishment of non-native species [26,27].
Both hydrological gradients and local environmental filtering shape the composition and spatial distribution of riparian plant communities in WLF zones. Under natural flow regimes, riparian vegetation is influenced by local abiotic and biotic factors, as well as catchment-scale dispersal processes and river connectivity [28,29]. In reservoirs, these processes are modified because WLF frequency, magnitude, duration, and timing are strongly controlled by dam operation [24,30]. Water-level ranges may increase from only a few metres to more than 20 m in extreme cases [31], creating strong gradients of inundation, exposure, soil moisture, substrate stability, and nutrient availability. For example, the Three Gorges Dam has created an extensive WLF zone along the Yangtze River, producing clear spatial gradients in riparian plant communities both longitudinally along the reservoir–river continuum and laterally from the water’s edge to higher elevations [30]. Differences in inundation duration among reservoirs can also lead to distinct vegetation patterns and community composition within WLF zones [32,33]. Long-term recolonization of WLF zones, therefore, depends on both the self-organization ability of plant communities and the suitability of exposed shoreline habitats for plant survival and regeneration [34]. In addition to hydrological regime, dam properties such as storage capacity and reservoir age can influence reservoir operation, local environmental conditions, and riparian vegetation composition [35]. Local factors such as slope may further affect plant diversity and biomass by regulating soil erosion, substrate stability, and the retention of fine sediments during repeated drawdown and flooding [31,36]. These geomorphic processes may also accelerate reservoir sedimentation and reduce storage capacity, contributing to premature infrastructure aging [37].
Retaining reservoir riparian vegetation, whether for its intrinsic biodiversity value and support for higher trophic levels [38], or to mitigate soil erosion and reservoir infilling through sediment interception and soil structuring [39], is a recurrent challenge for land managers [40]. Sensitivity analysis and related approaches for identifying key environmental drivers are increasingly important in water-resource monitoring and management, because they help determine which hydrological, hydraulic, and vegetation-related variables most strongly affect ecosystem responses. Recent studies have emphasized the role of vegetation traits and structure in regulating flow resistance, bed shear stress, and flood hazard in vegetated channels, as well as the sensitivity of aquatic communities to hydrological and climatic disturbances [41,42,43]. This challenge is particularly important in reservoir WLF zones, where contrasting flow regulation regimes can alter inundation-exposure conditions, vegetation establishment, non-native species invasion, and shoreline stability. Understanding how riparian plant communities respond to different types of regulation within the same biogeographic context is therefore important for reservoir operation, shoreline restoration, biodiversity conservation, and invasion risk management [44]. Many studies have focused on riparian vegetation before and after dam construction, e.g., Three Gorges Dam [24,30], while others have explored one specific regulation type (i.e., daily, weekly, seasonally, or yearly) rather than how plant communities respond to different types of flow regulation within the same biogeographic context [45]. The influence of diverse factors, such as climate and local environmental variables, on the distribution patterns of riparian plants has been investigated [46,47], but, other than boreal-regulated rivers assessed by Jansson et al. (2000) [18] , it remains unclear how WLF caused by large dams shapes reservoir vegetation composition through environmental filtering under contrasting regulation regimes.
In our study, we explored different types of water level regulation in nine large cascade reservoirs located along the Wujiang River in China. We investigated how reservoir riparian vegetation varied with WLF magnitude (2–65 m), WLF frequency (daily, weekly, seasonal, and yearly), and local environmental factors, including topography, soil characteristics, and water quality. We focused on the following research questions:
- (1)
-
How does the composition of riparian vegetation (species richness, alpha diversity, beta diversity, and proportion of non-native species per sampling site) vary in cascade reservoirs under different flow regulation type and zonation, and which species are indicative of different regulation types by zonation?
- (2)
-
How much variation in species composition in each quadrat do factors such as dam parameters, hydrological alteration, local environmental variables, and their interactions explain? Which is the best predictor?
Based on the evidence outlined above that dam operation modifies WLF frequency, magnitude, duration, and timing, thereby imposing strong hydrological filtering on riparian vegetation, this study tested two research hypotheses: (1) reservoir flow regulation would be more important than local environmental variables, such as slope and soil characteristics, in structuring riparian vegetation in the WLF zonation; and (2) species richness, alpha diversity, beta diversity, and the proportion of non-native species would differ among regulation types and WLF zonation. Understanding the fundamental influence of flow regulation on riparian vegetation is important for optimizing river management and conservation priorities in freshwater environments, especially with the growth of renewable energy production and increasing evidence of the frequency and severity of climate change-driven droughts. This understanding also provides insights to the mechanisms by which riparian plant species can survive WLF.
2. Methods
2.1. Study Sites
The Wujiang River is the largest southern tributary of the Yangtze River. The majority of its 80,300 km2 catchment is in Guizhou Province. Between 1962 and 2011, 14 hydropower stations were commissioned along the 1150 km length of the river. These hydropower stations were designed to increase the electricity supply and mitigate droughts and floods, but also introduced ecological problems. There are nine reservoirs located in the main river of the Wujiang catchment (see Figure 1 & Table S1). The history and purpose of these cascade reservoirs are explained in more depth in Figure S1. The Wujiang catchment has a subtropical monsoon climate affected by Siberian cold air in winter (~0 °C) and an Indo-Western Pacific and East Asian climate in summer (~22 °C). Limestone strata are widely distributed in the catchment, which provides some buffering of surface runoff. Precipitation is unevenly distributed, with an average annual precipitation of 1102 mm in the mountainous region. The heaviest rains (40–80 mm per event) generally occur in June and July and can last for more than 3 days, causing water levels to rise and fall rapidly.
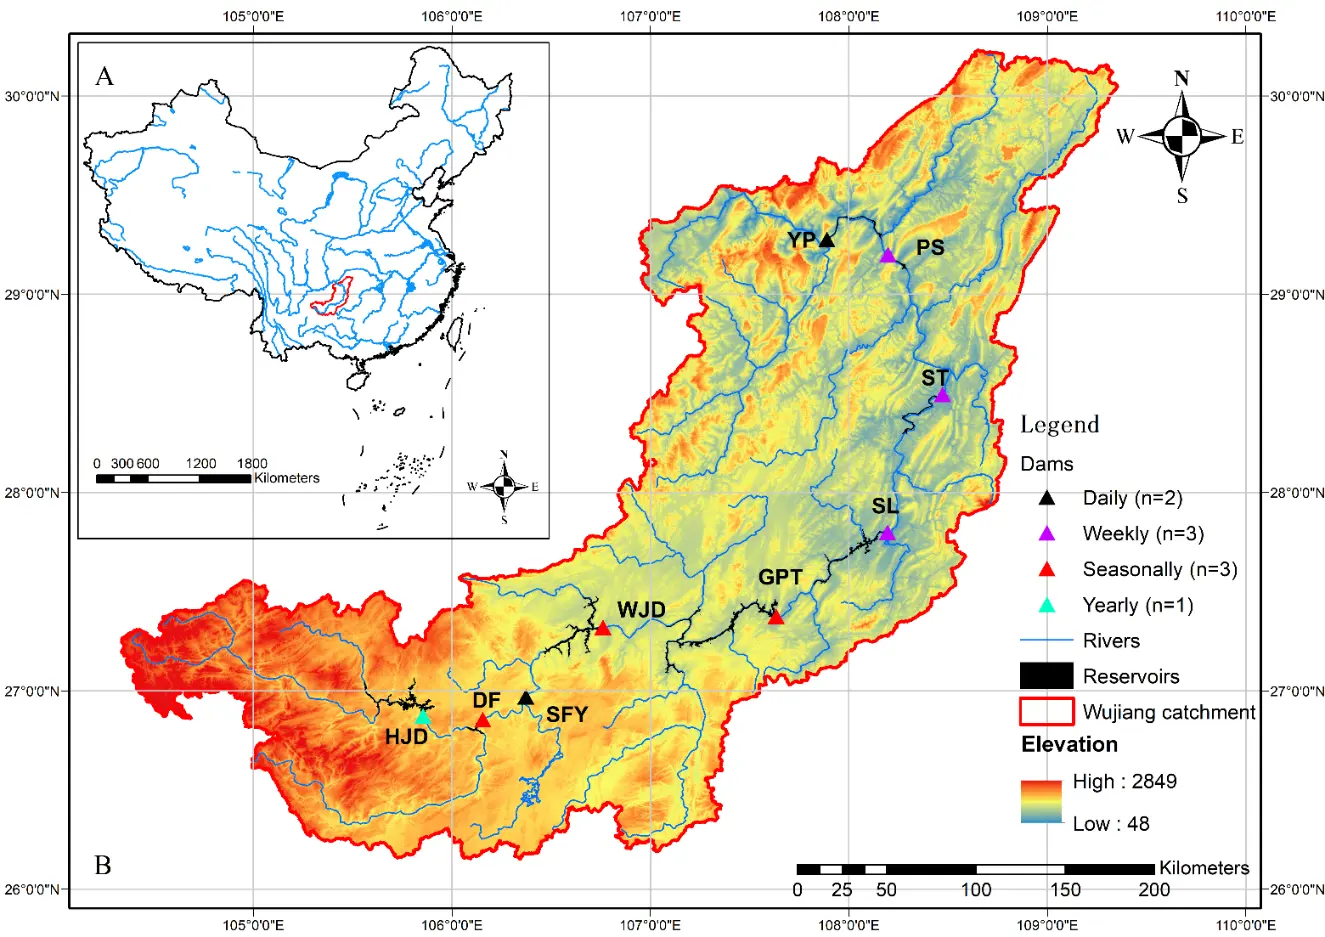
Figure 1. (A) Location of the Wujiang catchment within China. (B) Location of the nine cascade reservoirs in the Wujiang catchment. Abbreviations correspond to the reservoir names: HJD—Hongjiadu; DF—Dongfeng; SFY—Suofengying; WJD—Wujiangdu; GPT—Goupitan; SL—Silin; ST—Shatuo; PS—Pengshui; YP—Yinpan.
2.2. Field Surveys
Surveys were undertaken in nine reservoirs under four different flow regulations: one yearly regulated reservoir (Hongjiadu (HJD)), three seasonally regulated reservoirs (Dongfeng (DF), Wujiangdu (WJD), and Goupitan (GPT)), three weekly regulated reservoirs (Silin (SL), Pengshui (PS), and Shatuo (ST)), and two daily regulated reservoirs (Suofengying (SFY) and Yinpan (YP)) along the Wujiang River. All reservoirs were investigated during April 2017, except for GPT and ST, which were sampled the following year due to time constraints. Fieldwork was performed in April because the recorded water level of each reservoir was at its lowest and the exposed WLF area was the largest. For the remaining two reservoirs, measurements of vegetation and soil were conducted only when the ground across the entire WLF zone had been exposed for at least several days. A total of 72 sampling sites (Table S2) were roughly equally placed within the nine study reservoirs running perpendicular to the shoreline. The sampling sites encompassed the riparian bank: from the water’s edge to the top of the WLF zone. In our study, the WLF zonation (see Figure 2) was therefore divided into inundation, transitional, and unflooded zones based on the duration of inundation and the frequency of WLF [48]. The inundation zone had extensive bare sediment and a clear line of flood debris between the inundation and transitional zones. There was a sparse cover of herbs and a strong influence from WLF in the inundation zone (Figure S2). Both shrubs and herbs characterized the transitional zone, whilst the unflooded zone was dominated by trees and only inundated in the very wettest years. Each plant species was classified as an herb, shrub, vine, or tree based on its growth form, and as an annual, biennial, or perennial based on its life cycle (see Table S3).
For each sampling site, three 1 × 1 m quadrats for herbs and shrubs were randomly placed in the inundation zone, with a further three quadrats in the transitional zone, and three larger 5 × 5 m quadrats for trees in the unflooded zone (Figure 2). The 5 × 5 m quadrat size was selected because the unflooded zone was mainly used as a reference zone outside regular WLF influence, and because steep reservoir banks and limited accessibility made larger tree plots difficult to establish consistently across all reservoirs. In each sampling site, stratified random sampling was applied to sample as many types of vegetation as possible. In practice, some quadrats in some locations could not be established, e.g., (1) large rocks and bare vegetation in the inundation zone of the reservoir SFY; (2) missing transitional zones (n = 10); and (3) difficulty in accessing the unflooded zone in the SFY reservoir. In total, data were recorded in 573 quadrats across 72 sampling sites in three zones in the nine reservoirs (Table S2).
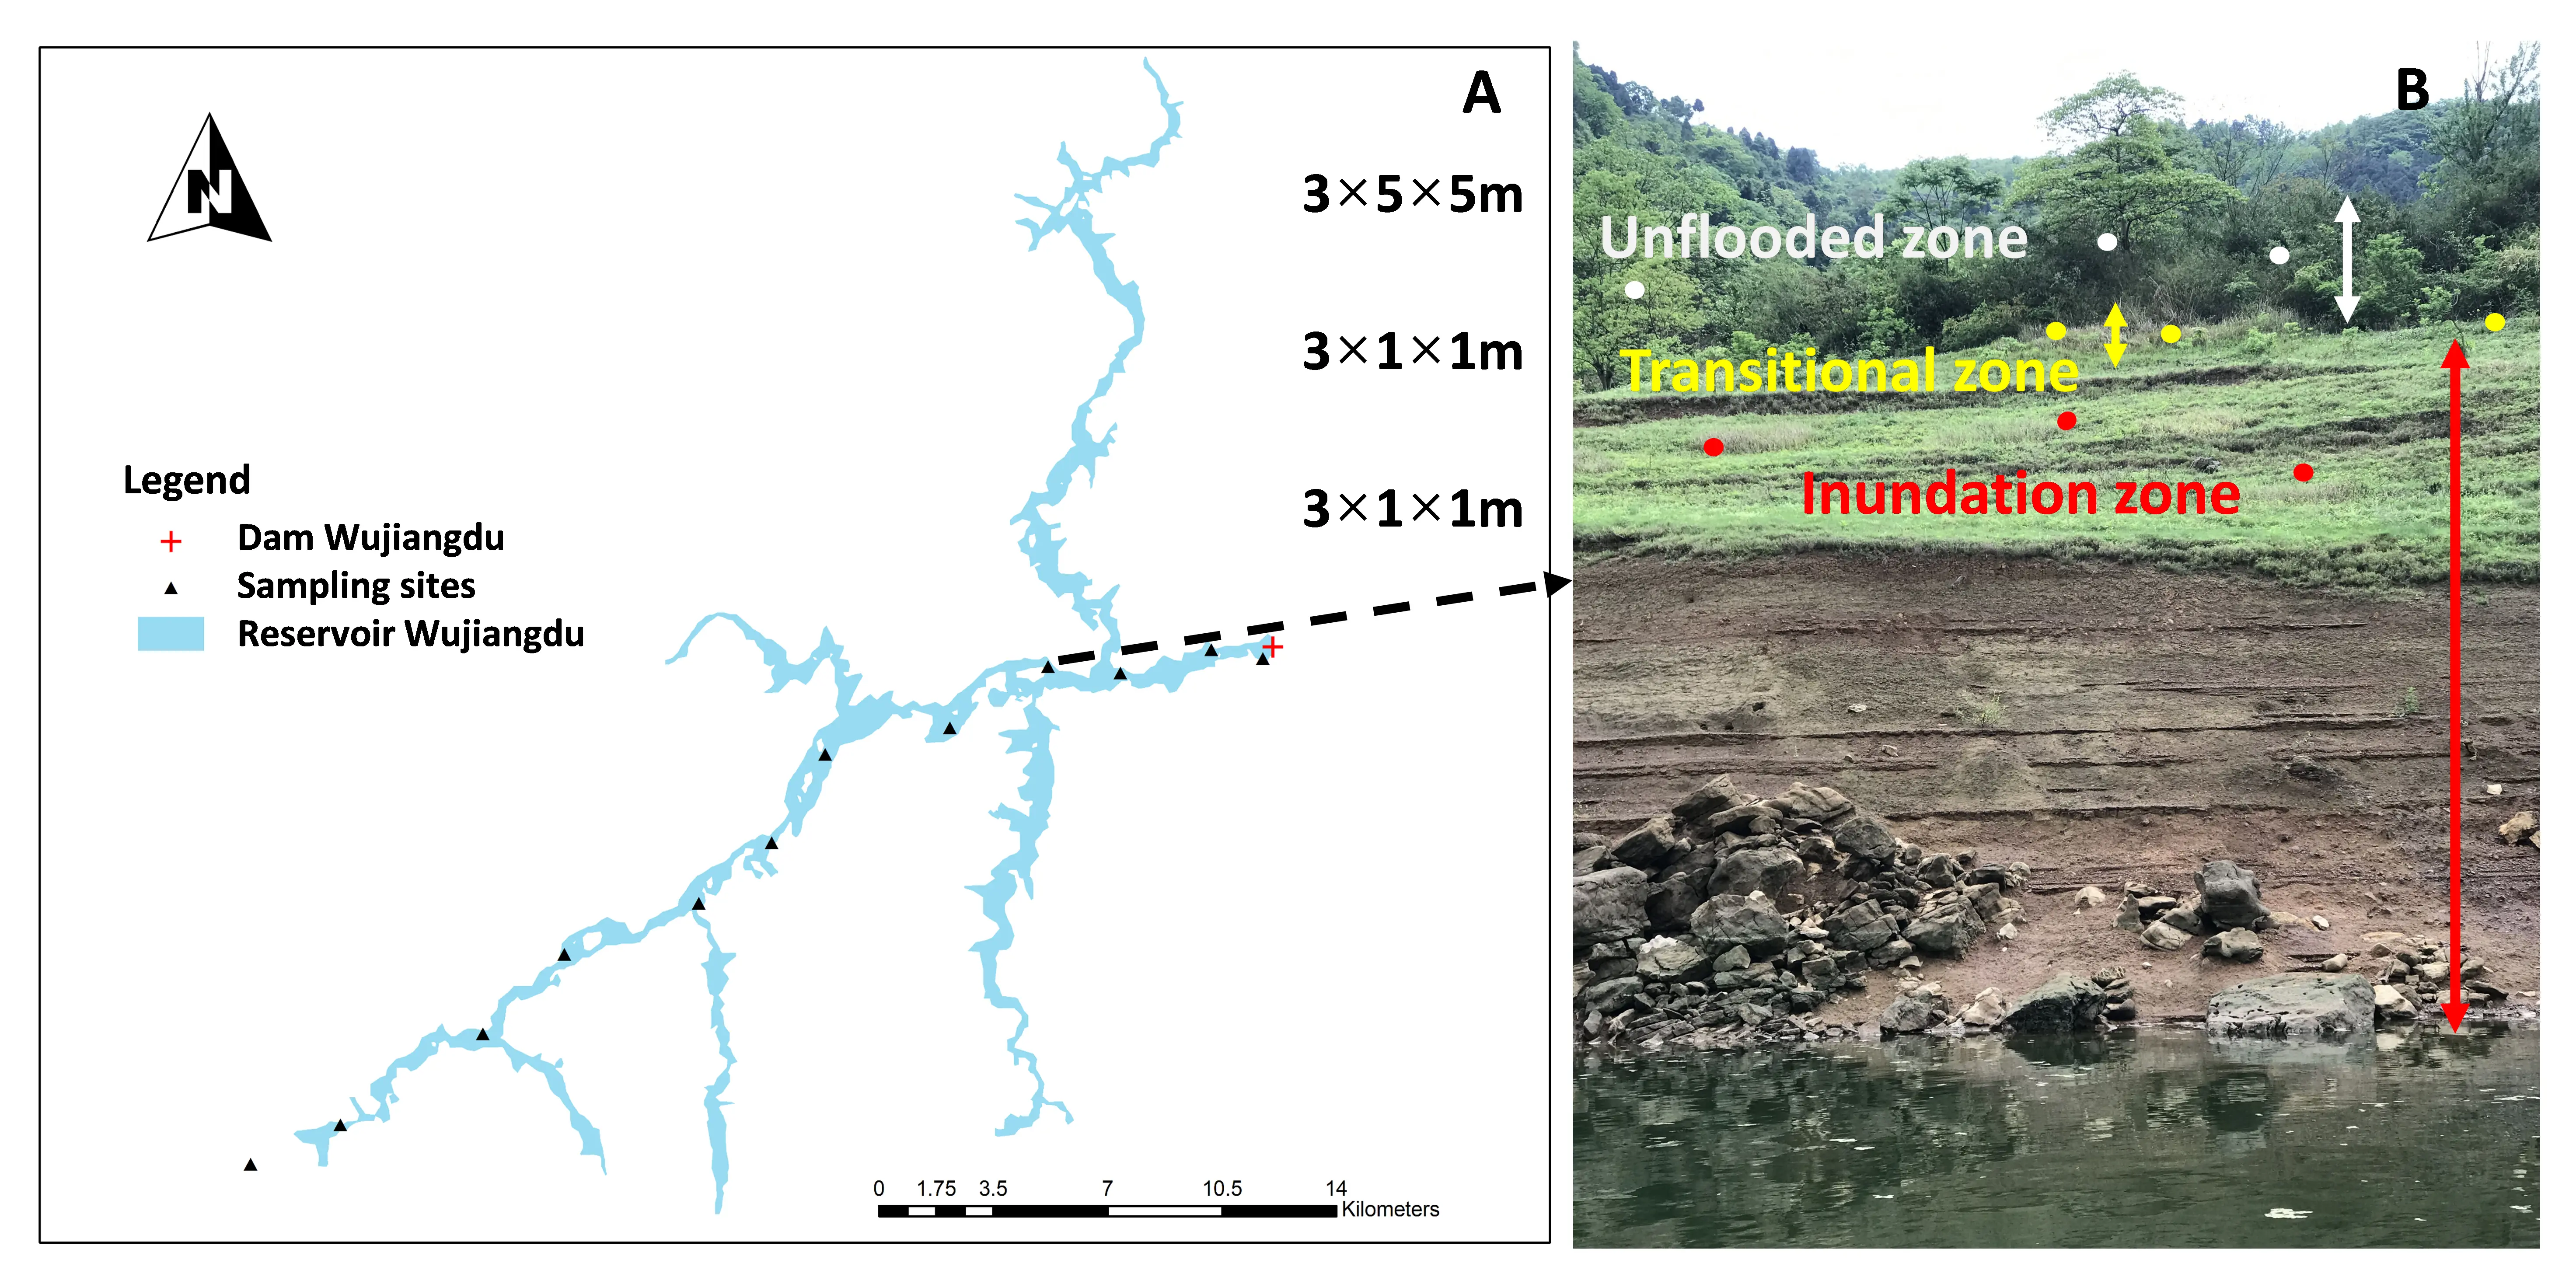
Figure 2. Sampling design in the WLF zone of Wujiangdu Reservoir (one of nine cascade reservoirs in this study). (A) Distribution of sampling transects along the reservoir shoreline. (B) Field photograph showing the three sampling zones along the elevation gradient: inundation zone, transitional zone, and unflooded zone. Three 1 × 1 m quadrats were established in both the inundation and transitional zones, and three 5 × 5 m quadrats were established in the unflooded zone. It is worth noting that the transitional zone is generally narrow.
Our sampling protocol focused on characterising the major differences in vegetation between reservoirs, rather than obtaining a full inventory of the vegetation in each reservoir. In each quadrat, the presence and abundance of all vascular plant species were recorded. Abundance values (i.e., individual number for each species) were transformed to five levels according to Van Der Meijden (2005) [49] . The aboveground plant biomass of each quadrat was harvested, dried, and weighed. Bagged samples were transported to the laboratory for oven drying and weighing. For trees, we listed the different species and recorded the number and height of individuals of each species in the selected quadrat.
2.3. Dam Classification Method
A framework for data classification was employed to describe the influence of dam and reservoir properties on the composition and distribution of riparian vegetation communities (Table 1 and Figure S1). Hydrological alterations and local environmental variables were documented to evaluate the effects of dam operation on natural hydrological regimes and local environmental variables. The magnitude of water flow changes before and after flow regulation was examined to determine hydrological alterations within the cascade reservoirs, and observed flow data were collected from hydrological stations.
Reservoirs experience varying levels of hydrodynamic disturbance, which can be regulated through flow redistribution to meet water resource management goals. The process of flow regulation, governed by a water release schedule, affects both reservoir storage and WLF [50]. Table S4 lists relevant keywords and concepts related to reservoir regulation. The spatial and temporal changes in the hydrodynamic processes in each reservoir were driven by WLF frequency and magnitude (Table S4). Based on water retention time (i.e., the time taken to completely replace the water), reservoirs were classified as daily (0–7 days, n = 2), weekly (7–30 days, n = 3), seasonal (30–90 days, n = 3), and yearly (approximately 365 days, n = 1) regulated types. These categories represent persistent differences in regulation frequency and inundation–exposure regimes among reservoirs. For example, under daily flow regulation, the control cycle lasts one day, and the upstream water line recedes to its initial position by the end of the cycle, with a reservoir residence time of one day. WLF frequency decreased from daily to yearly regulation, representing a gradient from frequent short-cycle fluctuation to infrequent long-cycle fluctuation. The WLF zones ranged from 2 m wide with weekly regulation and up to 64.8 m wide with yearly regulation. Daily and weekly regulated reservoirs were generally more disturbed due to their dynamic flow regime, while the longer retention time reservoirs had lower levels of disturbance but a longer duration of shoreline exposure. The seasonally and yearly regulated reservoirs shared a similar long-term flooding pattern, except for differences in WLF magnitude. Accordingly, vegetation differences among regulation types were interpreted as responses to cumulative hydrological disturbance regimes rather than to water-level conditions in the survey year alone.
Table 1. Environmental parameters of nine cascade reservoirs in the Wujiang drainage basin, which include yearly, seasonally, weekly, and daily regulated reservoirs. Numbers in bold represent the highest value for each predictor.
|
Variables |
Description |
Unit |
Source |
Yearly (n = 15) |
Seasonally (n = 17) |
Weekly (n = 21) |
Daily (n = 15) |
||||
|---|---|---|---|---|---|---|---|---|---|---|---|
|
Mean ± SD |
Range |
Mean ± SD |
Range |
Mean ± SD |
Range |
Mean ± SD |
Range |
||||
|
Dam property |
|||||||||||
|
Retention time |
The regulated operation of reservoir |
Day |
Recording |
368 |
55.7 |
11.7 |
2.9 |
||||
|
Reservoir age |
The age of dam construction year |
year |
Recording |
17 |
33.7 |
13.7 |
13.7 |
||||
|
Storage capacity |
The gross volume of water stored in reservoir |
109 m3 |
Recording |
4.9 |
2.8 |
0.7 |
0.25 |
||||
|
Hydrological alteration |
|||||||||||
|
WLF frequency |
Recurrence interval |
times |
Recording |
1–2 |
4–6 |
17–20 |
>300 |
||||
|
WLF duration of flooding |
The days during the flooding periods |
Day |
Recording |
<30 |
<7 |
1–3 |
1 |
||||
|
WLF magnitude |
Max water level-Min water level |
m |
Estimated visually |
58 |
49 |
7.6 |
3.3 |
||||
|
Reservoir size |
The area of each reservoir |
km2 |
ArcGIS |
30.17 |
24.86 |
16.14 |
4.35 |
||||
|
Relative inundation probability |
The occurrence of the water level in each reservoir |
% |
ArcGIS |
0.086 |
0.123 |
0.234 |
0.219 |
||||
|
Local environment |
|||||||||||
|
TN |
Soil total nitrogen at each quadrat |
mg·g−1 |
Calculating |
2.99 ± 1.06 |
1.72–0.51 |
3.65 ± 1.49 |
1.41–7.25 |
4.2 ± 3.71 |
1.75–2.94 |
3.18 ± 0.74 |
1.99–3.94 |
|
TP |
Soil total phosphorus at each quadrat |
mg·g−1 |
Calculating |
0.50 ± 0.13 |
0.27–0.75 |
0.83 ± 0.59 |
0.24–2.34 |
0.49 ± 0.13 |
0.29–0.71 |
1.11 ± 0.22 |
0.99–1.65 |
|
Temperature |
Water temperature at each sampling site |
°C |
YSI |
18.6 ± 0.29 |
18.2–22.9 |
18.9 ± 1.60 |
16.4–22.9 |
18.9 ± 2.2 |
16.1–22 |
15.8 ± 0.26 |
15.7–16.5 |
|
DO |
Water dissolved Oxygen at each sampling site |
mg·L−1 |
DO |
10.1 ± 0.39 |
9.4–10.8 |
12.9 ± 2.6 |
8.6–17.2 |
12.8 ± 2.9 |
9.0–18.1 |
9.6 ± 0.11 |
9.4–9.7 |
|
pH |
Water pH at each sampling site |
- |
YSI |
8.5 ± 0.11 |
8.4–8.7 |
8.6 ± 0.3 |
7.8–9.03 |
7.7 ± 2.3 |
3.3–9.6 |
8.4 ± 0.03 |
8.3–8.4 |
|
Slope |
The slope of WLF zone at each vegetation zone |
° |
Estimated visually |
22.3 ± 6.1 |
10.7–31.6 |
23.9 ± 4.9 |
15. 5–34.5 |
21.4 ± 6.4 |
9.5–36.5 |
27.9 ± 9.5 |
14.4–43.2 |
|
Width_WLF |
The width of WLF zone |
m |
Estimated visually |
74.7 ± 22 |
16.2–112.7 |
43.8 ± 21.9 |
10.8–112 |
21.2 ± 9.9 |
8.8–50.2 |
25.8 ± 8.8 |
9.3–37.2 |
|
Width_Inundation |
The width of inundation zone |
m |
Estimated visually |
33.9 ± 14 |
8.1–64.8 |
23.7 ± 13.5 |
7.8–56.3 |
10.5 ± 5.2 |
2–25.1 |
12.9 ± 4.4 |
4.7–18.6 |
|
Soil texture |
The proportion of Mineral particles, e.g., sand and clay at each sampling site |
- |
Observing |
Gravel + Silt |
Gravel + Silt/Silt + Sand |
Gravel + Silt/Silt |
Gravel + Silt/Clay |
||||
|
River width |
The width of the reservoir at each sampling site |
m |
Observing |
380 ± 198 |
108–729 |
398 ± 154 |
200–726 |
448 ± 217 |
50–903 |
194 ± 64 |
122–319 |
|
Distance to Dam |
The distance to (downstream) dam at each sampling site |
km |
ArcGIS |
10.8 ± 6.7 |
2.2–22.6 |
11.4 ± 10.1 |
0.4–33.9 |
8.1 ± 5.4 |
0.7–18.2 |
17.5 ± 6.7 |
9.8–27.6 |
|
Altitude |
The altitude of site at each vegetation zone |
m |
GPS |
1090 ± 11 |
1071–1122 |
1167 ± 1558 |
617–7388 |
372 ± 67 |
22–444 |
223 ± 11 |
204–236 |
2.3.1. Dam Property
The local environmental conditions induced by the different regulation types are summarised in Table 1. To determine the properties of the dams, we considered factors such as dam age, reservoir storage capacity, annual average runoff, retention time, and flow regulation type.
Reservoir storage capacity was a critical property in our study because it can influence the degree of impact on hydrological regimes in free-flowing rivers. Depending on the height of the dam and the regulation rules, the impact can be significant. Flow regulation types were classified as yearly, seasonally, weekly, and daily regulated types for the nine reservoirs studied. This classification provides a useful and practical way to evaluate hydrological changes when flow data are limited or unavailable in our study. The annual average runoff is strongly associated with indicators of hydrological alteration, such as peak flow reductions and seasonal flow variation, and is therefore an important factor in assessing dam regulation performance.
2.3.2. Hydrological Alteration Indicators
Hydrological alteration indicators, including reservoir size, relative inundation probability, WLF magnitude, WLF frequency, and duration of flooding, were applied in this study.
Vectorized reservoir boundaries were generated with ArcGIS (v10.2; ESRI, Redlands, CA, USA) using the normal water level recorded in the reservoir regulation scheme and the digital terrain model (30-m grid resolution) downloaded from the Geospatial Data Cloud for China (ASTER GDEM 30M). The potential maximum range of each reservoir WLF zone was estimated in ArcGIS using the maximum flood level recorded as the top theoretical value according to the reservoir flow regulation scheme (Table S1) and the low-water level generated from Landsat images taken within one week of the field survey date. The reservoir WLF zone range differed from that estimated depending on whether it was a dry or wet year. For example, the WLF zone of the Three Gorges Dam was defined as the riparian area between the base (145 m) and the capacity water level (175 m) of the reservoir in the previous study [16]. Relative inundation probability was calculated for each zone by comparing the zone’s width with the average width of the relative zonation (see Table S5). The magnitude and frequency of WLF depend on the management mode and each reservoir’s storage capacity over a period. The magnitude of WLF was measured as the difference between the high and low water tables due to reservoir management. The frequency of WLF was determined based on the recurrence interval. Duration of flooding refers to the number of days per year that an area of land is wet or the length of time that there is standing water at a location. The hydroperiod of the land was determined via the water release cycle.
2.3.3. Local Environmental Indicators
The position of each sampling site was determined using a Garmin GPS 639sc (Garmin International, Inc., Olathe, KS, USA; locational error < 0.5 m). The characteristics of each sampling site were measured to assess the effect of topography and environmental factors on the riparian vegetation community. Elevation data were taken at the inundation, transitional, and unflooded zones separately from the Shuttle Radar Topography Mission (SRTM) at 30 m (size of pixel). The inundation, transitional, and unflooded zones were measured for perpendicular to the shoreline. Slopes of the three zones were measured from the water surface using a laser rangefinder (Leica DISTO D510, Leica Geosystems AG, Heerbrugg, Switzerland). Remote measures of elevation relative to the water’s edge were also taken using the laser rangefinder (accuracy of ±0.1 m horizontally and vertically). Schematic representations of the WLF zone for each reservoir were reconstructed (Figure S2) through topographical calculations and GIS analysis (ArcGIS v 10.2; ESRI, USA).
To assess the impact of local environmental factors on riparian vegetation composition, water chemistry, substrate type, and soil characteristics were measured at each sampling site. Water samples (n = 3) were taken from the edge of the inundation zone at each sampling site. Water quality parameters (n = 3), including water temperature, dissolved oxygen (DO), pH, and total dissolved solids (TDS), were evaluated using a ProDSS Multiparameter Water Quality Meter (YSI Inc., Yellow Springs, OH, USA) to characterize the aquatic environment adjacent to the inundation zone. The substrate of each survey quadrat was classified into six typologies in terms of grain size based on visual inspection in the field: boulder (>30 cm), cobble (76.2–300 mm), gravel (4.75–76.2 mm), sand (0.075–4.75 mm), silt (0.002–0.075 mm), and clay (<0.002 mm). Topsoil samples (0–10 cm) were collected from each quadrat (191 sample sites in total, see Table S2) after vegetation harvest. This sampling depth was used to characterize surface soil conditions in the WLF zone, which are directly affected by repeated inundation, drawdown, sediment deposition, and erosion. Soil samples were packed in plastic bags and taken to the lab to be air-dried to a constant weight at 105 °C. Thereafter, total nitrogen (TN) and total phosphorus (TP) were measured using the modified Kjeldahl method and the colorimetric method [51].
Distances to the dam and outlet of the Wujiang catchment (at its confluence with the Yangtze River) were calculated for each sampling site at the catchment scale using two-dimensional vector maps of the lake and river networks of China (supplied by Ordnance Survey). This enabled us to estimate the possible effect of each reservoir location in the hydrological network on riparian vegetation communities in the WLF zone.
2.4. Statistical Analyses
Figure 3 summarizes the classification of explanatory variables and the statistical workflow used to assess riparian vegetation responses to contrasting flow regulation regimes. All research questions and methods, as well as predictor and explanatory variables, are provided in Table S6.
2.4.1. Calculation of Different Species Indices
For each reservoir, plant species richness and diversity were calculated separately for all sampling sites in the inundation, transitional, and unflooded zones. The plant communities of the three zones were compared using the Shannon diversity index (D). The proportion of non-native species was calculated as the number of non-native species divided by total species richness at the sampling site. Total beta diversity of the plant community was determined using the pairwise-site index for each type based on species presence or absence. Total beta diversity was then partitioned into species turnover (correlated with species sorting affected by environmental variables) and nestedness (indicating local species loss and extinction processes) [52]. Beta diversity was calculated using the ‘betapart.core’ and ‘beta.multi’ functions in the R package ‘betapart’.
Indicator values (IndVal) [53] for each species were calculated to contrast the composition of riparian plant species in terms of regulation type and zonation. An IndVal value of 1 indicates that a species occurs in only one group and in all samples from that group. For our purposes, IndVal > 0.4 was regarded as a good indicator [54]. IndVal analyses were carried out with the ‘labdsv’ package in R v3.3.1.
2.4.2. Variation in Species Indices Between Regulation Type and Zonation
Environmental explanatory variables were log10-transformed where necessary and standardized to zero mean and unit standard deviation before correlation analysis, RDA, and variation partitioning. These procedures were applied only to environmental predictors, not to the vegetation response variables used in ANOVA. As most explanatory variables were correlated, pairwise correlation coefficients between predictors were calculated (see Figure S3). To solve the multicollinearity issue, we calculated the variance inflation factor (VIF) value for each indicator, and explanatory variables with VIF values less than 3 were retained and considered as independent variables (shown in Table S7) for the following analyses. The VIF value of each variable was calculated and identified using the ‘corvif’ function in the ‘AED’ package.
The Shapiro-Wilk test was used to evaluate data distribution normality, and the Levene test was applied to test homogeneity of variance. Analysis significance was set to α = 0.05. One-way analysis of variance (ANOVA) was performed to study significant differences in mean species richness, Shannon index, proportion of non-native species, beta diversity, nestedness, and species turnover of riparian vegetation among the four regulation types (i.e., daily, weekly, seasonally, and yearly). Tukey’s post hoc test was calculated between pairwise type groups [55].
Generalised linear mixed effect models (GLMMs) and negative binomial GLMMs (GLMM-NB) were used to identify the most significant indicators predicting the six species indices, depending on the distribution of each response variable. GLMM-NB was used for count-based indices, such as species richness, to account for potential overdispersion in count data. The models were built with regulation type and zonation as fixed factors, reservoirs as random factors, and local environmental variables as covariates. Local environmental variable selection followed a backward selection procedure, in which variables were sequentially removed from the full model. The most parsimonious model was selected according to the lowest Akaike Information Criterion (AIC) value. Further procedure details are provided in Table S8, Table S9, Table S10, Table S11, Table S12 and Table S13.
Principal component analysis (PCA) was performed as a dimension-reduction and orthogonalization procedure for the selected environmental variables in the best model for each species index. Components one and two, i.e., “Environmental PCA1” and “Environmental PCA2”, were extracted when they represented the dominant environmental gradients and were ecologically interpretable. To improve interpretation, the derived PCA components were described according to the variables with the highest loadings, and the loading values are provided in Table S14. Bivariate correlations between the derived PCA components were calculated for each species index.
To standardize for the effect of the environmental variables, two-factor analysis of covariance (ANCOVA) was used to investigate the changes in six riparian vegetation indices (dependent variables) among flow regulation types a nd zonation (independent variables), with environmental components included as covariates [56]. The two categorical indicators were regulation type and zonation. The environmental component covariate was derived from the forward-selected significant environmental variables of the optimal GLMMs or GLMM-NB using PCA. Before conducting ANCOVA, the homogeneity of regression slopes was assessed by testing interaction terms between environmental covariates and the grouping factors, i.e., regulation type and zonation. Covariate × grouping factor interactions were included in the ANCOVA models when necessary to account for potential heterogeneity in regression slopes. ANCOVA was then used to determine whether riparian vegetation indices differed among regulation types and vegetation zones after accounting for local environmental variation. All analyses were completed in R v3.4.4, and both ANCOVA and ANOVA were performed using the ‘agricolae’ package [57].
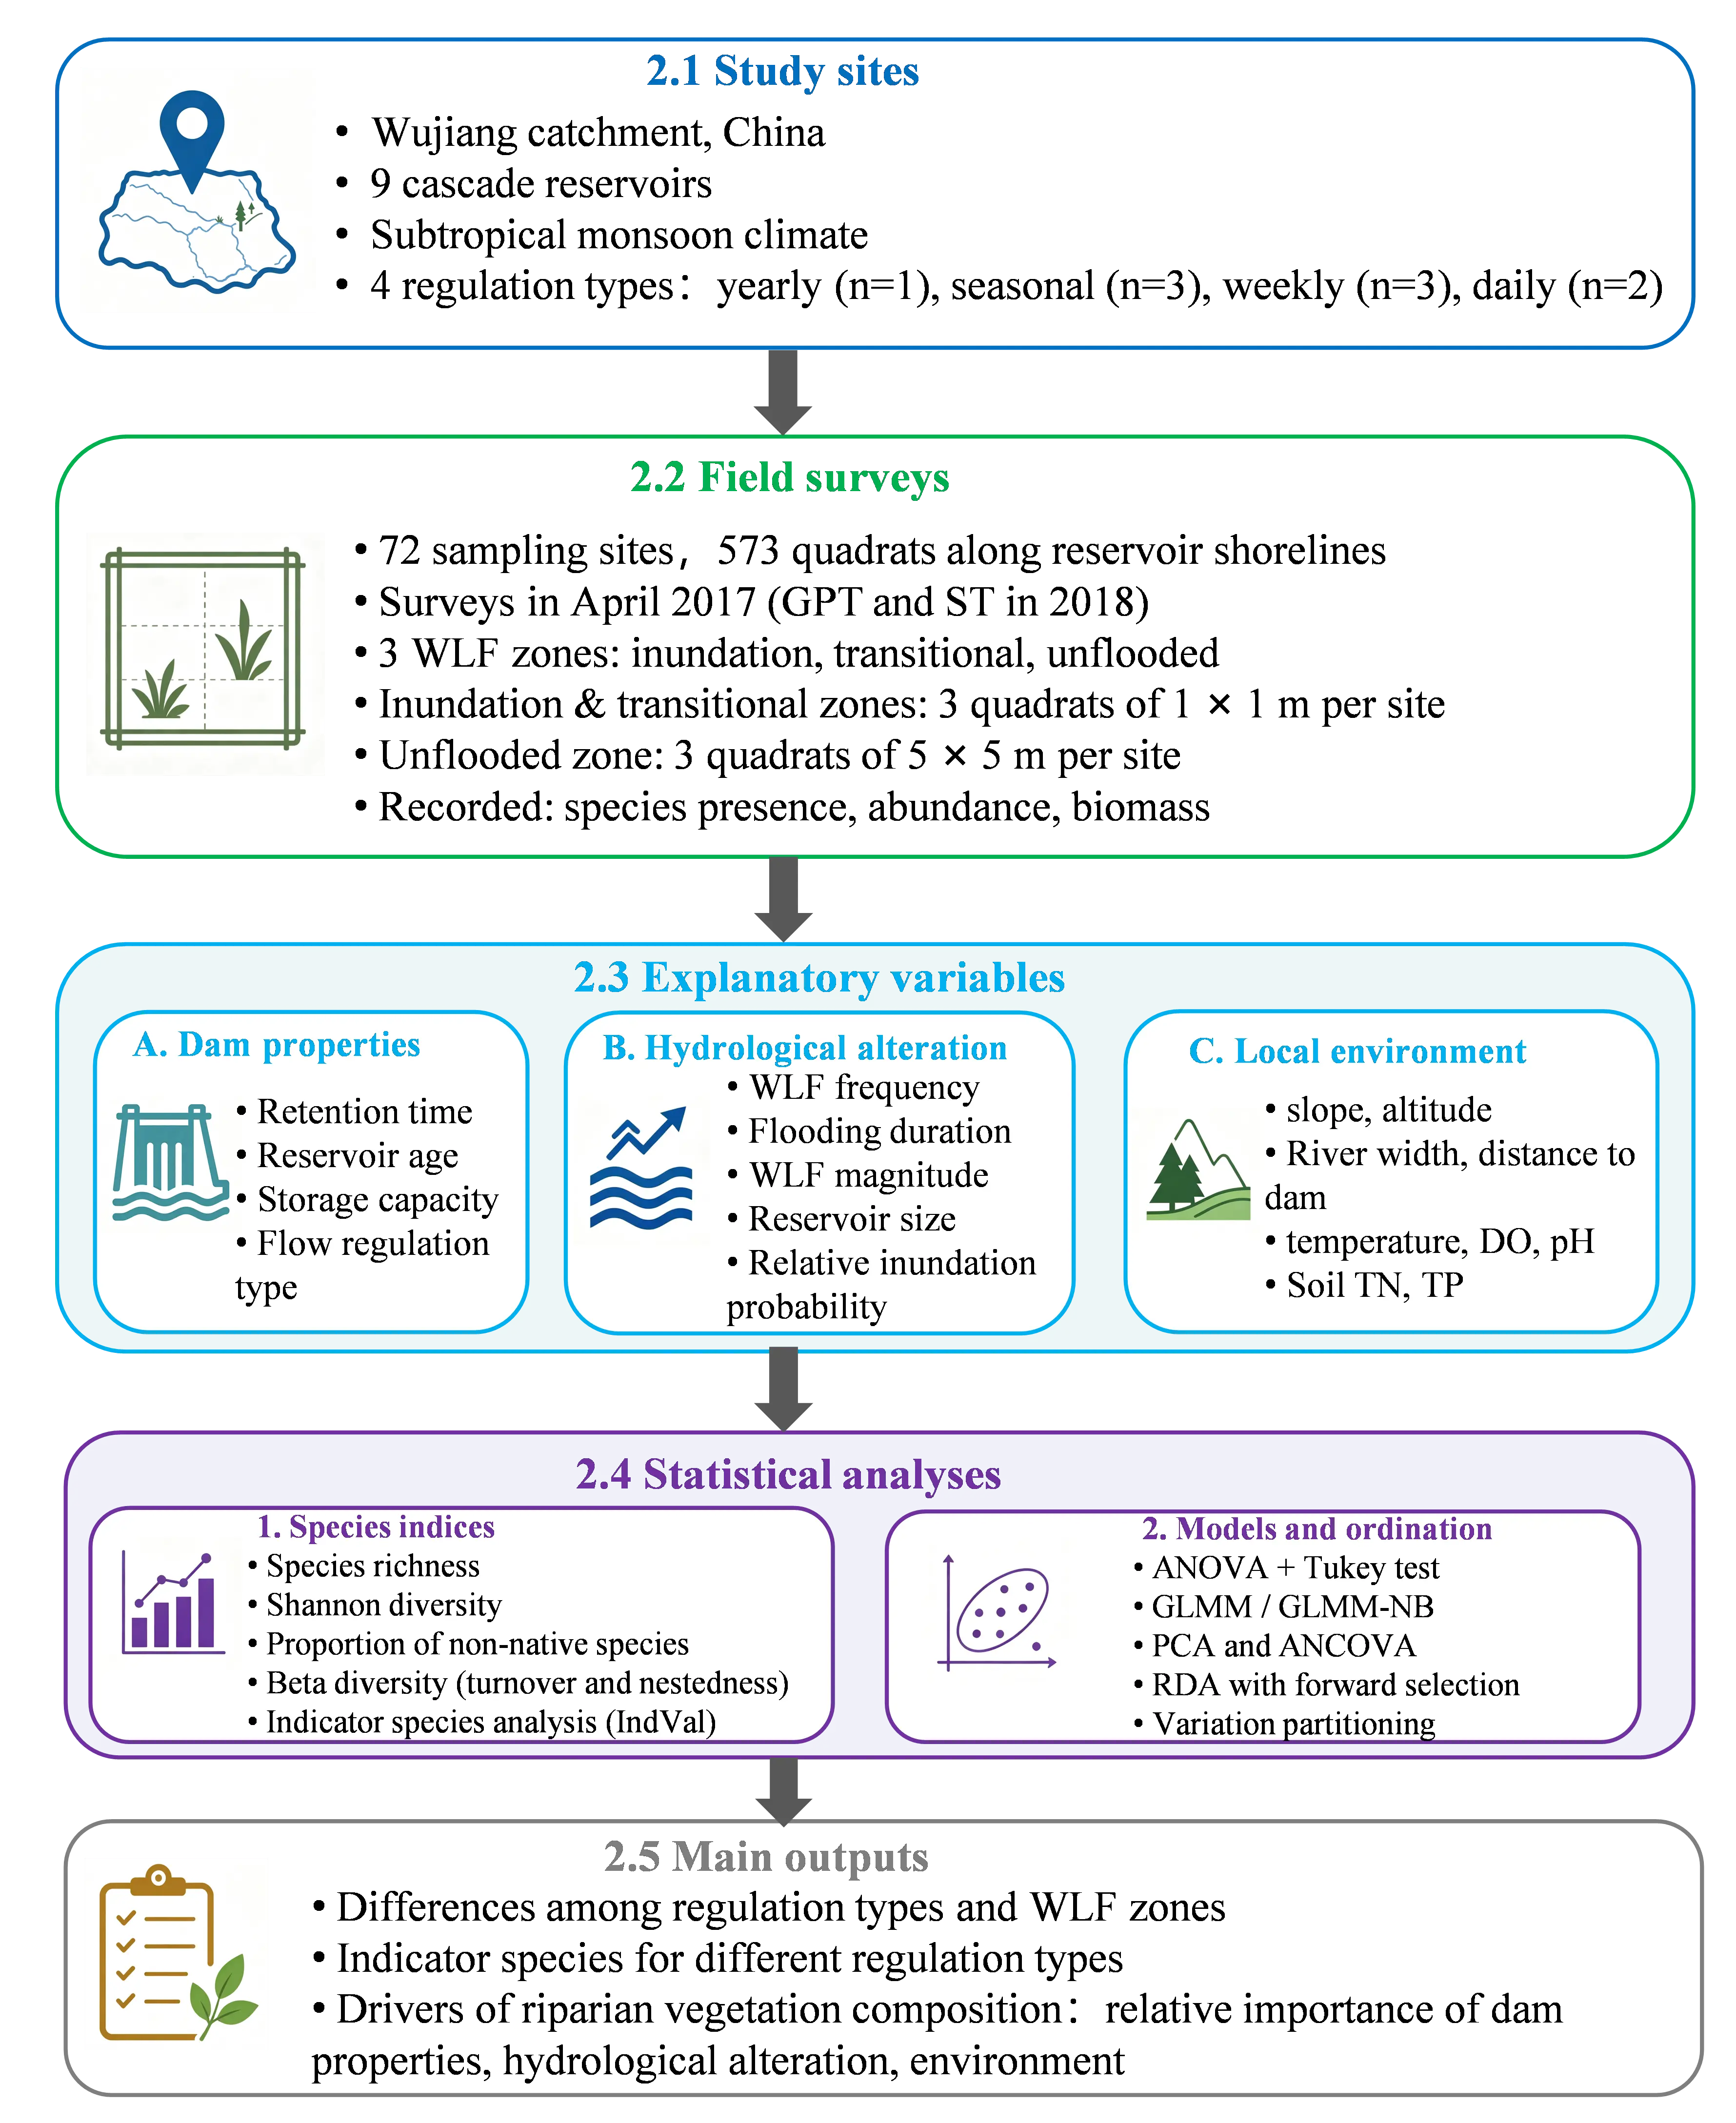
Figure 3. Methodological framework used to assess riparian vegetation responses to contrasting flow regulation regimes in the Wujiang River cascade reservoirs.
2.4.3. Driver of Species Composition of Riparian Vegetation
Independent variables with inflation factors less than 3 were grouped into three predictor datasets, i.e., dam properties, hydrological alteration, and local environmental factors. Retention time, flow regulation type, and reservoir age (years of operation) were included in the dataset of dam properties. Reservoir size and relative inundation probability were retained in the dataset of hydrological alteration, and soil characteristics and local physicochemical parameters, including DO, pH, slope, width of WLF zone, river width, distance to dam, TN of soil, TP of soil, and altitude, were retained in the dataset of local environmental factors. Redundancy analysis (RDA) was run separately with forward selection [58] on the regulation effect and local environmental dataset using the ‘ordir2step’ function in the ‘vegan’ package to identify the best variables for explaining riparian vegetation composition in the inundation, transitional, and unflooded zones, respectively. Variation partitioning [59,60] was applied with partial redundancy analysis (partial RDA) to quantify the pure and combined fraction of variance in riparian vegetation explained by the three datasets, respectively. This allowed us to quantify the share of variance that was due to two or three variable groups. A Venn diagram was constructed to represent the portion of variation explained by pure or combined explanatory matrices [60]. The significance of the pure fraction was assessed by Monte Carlo permutation tests [61].
3. Results
3.1. Different Species Indices of Riparian Vegetation
Significant differences in species richness, Shannon diversity, proportion of non-native species, beta diversity, nestedness, and species turnover were detected among regulation types and riparian zones (ANOVA, p < 0.05). After controlling for regulation type and riparian zone, the environmental PCA1 explained significant variation in species richness (F1,166 = 24.36, p < 0.001), Shannon diversity (F1,159 = 3.39, p < 0.001), and beta diversity F1,168 = 6.81, p < 0.01) (Table 2).
There were significant differences in species richness among the different flow regulation types (F3,166 = 14.58, p < 0.01) and zonation (F2,166 = 7.04, p < 0.001), controlling for local environmental variables. We recorded 315 plant species belonging to 93 families in the WLF zones of the study reservoirs (Table S3). The complete species list, including life span, growth form, family, and label abbreviation, is provided in Table S3. The main common native riparian species were identified in each reservoir. These included Oenanthe javanica, Artemisia gmelinii, Miscanthus sinensis, Miscanthus floridulus, Phragmites australis, Ulmus pumila, and Mallotus barbatus. Non-native species, such as A. philoxeroides and E. canadensis, were also recorded and identified as important indicators for some regulatory types. Differences in species richness and beta diversity (Figure 4) based on regulation type were lower in the unflooded zone compared with the inundation zone. Within the inundation zone, seasonally regulated reservoirs supported the greatest number of herbaceous species among the differently regulated reservoirs (n = 16, Figure 4) after correcting for sample effort. Weekly (n = 13) and daily reservoirs (n = 14) had significantly greater mean species richness in the transitional and unflooded zones, respectively. Species richness in the yearly regulated reservoirs was the lowest among the three zones (Figure 4).
Significant differences in the Shannon diversity index were found among the different regulation types (F3,159 = 5.75, p < 0.001) and zonation (F2,159 = 3.83, p < 0.001). Species diversity was relatively low in the transitional zone of the yearly regulated reservoirs (D = 1.65) compared to that in the inundation zone of the seasonally regulated reservoirs (D = 3.85). According to the ANOVA results, the mean proportion of non-native species did not differ significantly among the different regulation types. However, significant differences were found (F3,168 = 2.55, p < 0.05) after controlling for zonation and local environmental variables.
Based on IndVal analyses (Table 3) of vegetation in the three zonation, indicator species differed among regulation types and zones. In the inundation zone, daily regulated reservoirs were characterized by native riparian species such as Clinopodium chinense, O. javanica, and Ranunculus cantoniensis, etc. Weekly regulated reservoirs were characterized by the non-native species A. philoxeroides (IndVal = 0.499), whereas seasonally regulated reservoirs included indicators such as Galium aparine, Capsella bursa-pastoris, and the non-native E. canadensis (IndVal = 0.338).
Beta diversity (Figure 4) showed significant differences among the different regulation types (F3,168 = 2.55, p < 0.001) and zonation (F2,168 = 178.4, p < 0.001). Daily regulated reservoirs had the highest species turnover (Median = 0.82), followed by weekly (Median = 0.77), seasonally (Median = 0.76), and yearly regulated reservoirs (Median = 0.67). Nestedness was more similar among the different reservoirs compared to turnover. Yearly regulated reservoirs had the highest nestedness (Median = 0.16), followed by weekly (Median = 0.12), seasonally (Median = 0.11), and daily regulated reservoirs (Median = 0.04). The effects of regulation on beta diversity were greatly reduced in the transitional zone and were lacking altogether in the unflooded zone.
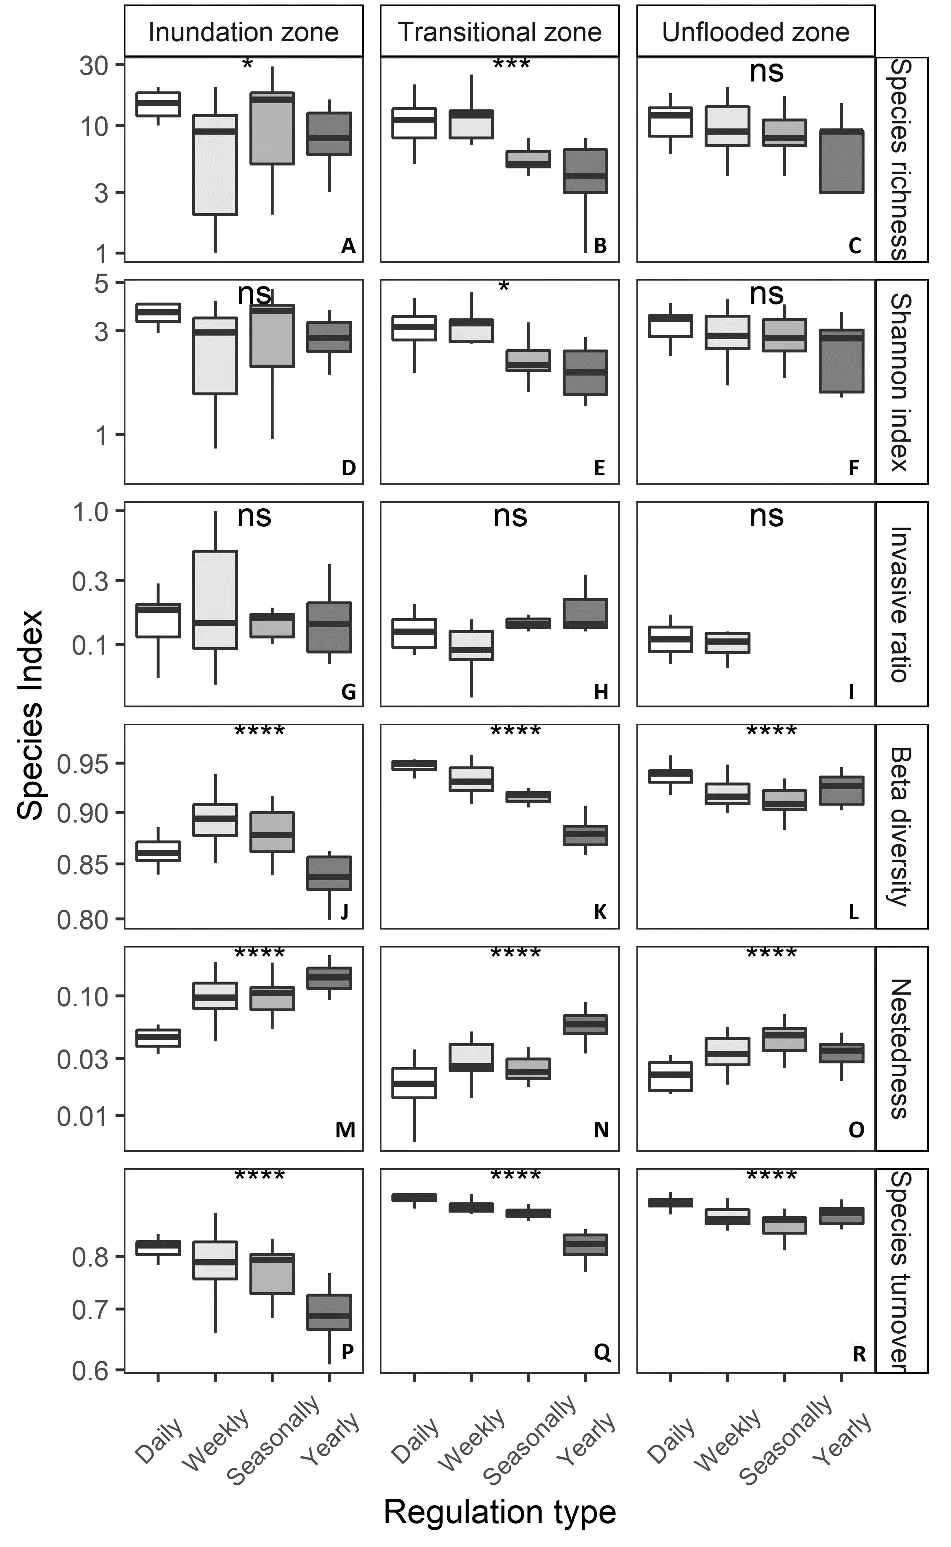
Figure 4. Species richness (A–C), Shannon diversity (D–F), proportion of non-native species (G–I), beta diversity (J–L), nestedness (M–O), and turnover (P–R) among the differently regulated reservoirs in the inundation, transitional, and unflooded zones. Boxplots show the distribution of each species index across regulation types. The labels above each panel indicate the significance of differences among regulation types within each vegetation zone: ns, not significant; * p < 0.05; *** p < 0.001; **** p < 0.0001.
Table 2. Two-way ANCOVA results for six riparian vegetation indices across dam flow regulation types and WLF zonation, with environmental PCA components included as covariates. Significant covariate × grouping factor interactions were retained in the final models (* p < 0.05, ** p < 0.01, *** p < 0.001).
|
Source of Variation |
Species Richness |
Shannon Index |
Non-Native Species Proportion |
||||||
|---|---|---|---|---|---|---|---|---|---|
|
df |
SS |
F |
df |
SS |
F |
df |
SS |
F |
|
|
Regulation type |
3 |
932.86 |
14.58 *** |
3 |
9.847 |
5.75 *** |
3 |
0.161 |
2.55 * |
|
Zonation |
2 |
300.32 |
7.04 *** |
2 |
4.376 |
3.83 *** |
2 |
0.703 |
16.72 *** |
|
Regulation type × Zonation |
6 |
384.72 |
3.01 *** |
6 |
13.381 |
3.91 *** |
6 |
0.37 |
2.93 *** |
|
Covariates |
|||||||||
|
Environmental PCA1 |
1 |
519.36 |
24.36 *** |
1 |
1.937 |
3.39 *** |
- |
- |
- |
|
Zonation × Environmental PCA1 |
2 |
251.92 |
5.91 *** |
2 |
13.342 |
11.7 *** |
- |
- |
- |
|
Regulation type × Environmental PCA1 |
- |
- |
- |
3 |
7.935 |
4.63 *** |
- |
- |
- |
|
Environmental PCA2 |
- |
- |
- |
1 |
1.675 |
2.93 *** |
- |
- |
- |
|
Regulation type × Environmental PCA2 |
- |
- |
- |
3 |
6.026 |
3.52 *** |
- |
- |
- |
|
Error |
166 |
3538.7 |
159 |
90.6 |
168 |
3.5 |
|||
|
Source of Variation |
Beta Diversity |
Nestedness |
Species Turnover |
||||||
|
df |
SS |
F |
df |
SS |
F |
df |
SS |
F |
|
|
Regulation type |
3 |
0.033 |
38.97 *** |
3 |
0.044 |
27.94 *** |
3 |
0.103 |
29.16 *** |
|
Zonation |
2 |
0.1 |
178.45 *** |
2 |
0.152 |
145.34 *** |
2 |
0.458 |
194.96 *** |
|
Regulation type × Zonation |
6 |
0.029 |
17.07 *** |
6 |
0.027 |
8.69 *** |
6 |
0.064 |
9.02 *** |
|
Covariates |
|||||||||
|
Environmental PCA1 |
1 |
0.002 |
6.816 ** |
- |
- |
- |
- |
- |
- |
|
Environmental PCA2 |
- |
- |
- |
- |
- |
- |
- |
- |
- |
|
Error |
168 |
0.047 |
168 |
0.088 |
167 |
0.196 |
|||
Table 3. The best indicator species obtained by IndVal analyses by zonation and regulation types of daily, weekly, seasonal, and yearly reservoirs.
|
Zones |
Daily |
Weekly |
Seasonally |
Yearly |
||||
|---|---|---|---|---|---|---|---|---|
|
Species |
IndVal |
Species |
IndVal |
Species |
IndVal |
Species |
IndVal |
|
|
Inundation zone |
Clinopodium chinense |
0.805 |
Alternanthera philoxeroides |
0.499 |
Galium aparine |
0.412 |
Chenopodium album |
0.483 |
|
Rorippa indica |
0.657 |
Aster indicus |
0.209 |
Capsella bursa-pastoris |
0.361 |
Pseudognaphalium affine |
0.446 |
|
|
Reynoutria japonica |
0.551 |
Viola philippica |
0.143 |
Medicago sativa |
0.353 |
Cynodon dactylon |
0.403 |
|
|
Oenanthe javanica |
0.536 |
Erigeron canadensis |
0.338 |
Hemisteptia lyrata |
0.339 |
|||
|
Ranunculus cantoniensis |
0.502 |
Salvia plebeia |
0.296 |
Solanum nigrum |
0.218 |
|||
|
Artemisia gmelinii |
0.468 |
|||||||
|
V. anagallis-aquatica |
0.429 |
|||||||
|
Equisetum giganteum |
0.402 |
|||||||
|
Transitional zone |
Digitaria violascens |
0.534 |
Vitex negundo |
0.304 |
Solanum virginianum |
0.285 |
Setaria viridis |
0.5 |
|
Ficus tikoua |
0.284 |
Miscanthus sinensis |
0.25 |
Fastigiata sp. |
0.152 |
Artemisia sp. |
0.2 |
|
|
Artemisia lancea |
0.267 |
Torilis scabra |
0.223 |
Solanum nigrum |
0.2 |
|||
|
Pyracantha fortuneana |
0.205 |
Pogonatherum crinitum |
0.2 |
|||||
|
Drynaria roosii |
0.2 |
Medicago sativa |
0.2 |
|||||
|
Pteris vittata |
0.2 |
|||||||
|
Urena lobata |
0.16 |
|||||||
|
Unflooded zone |
Cornus quinquenervis |
0.334 |
Miscanthus floridulus |
0.272 |
Solanum virginianum |
0.215 |
Pyracantha fortuneana |
0.295 |
|
Digitaria violascens |
0.333 |
Platycladus orientalis |
0.225 |
Lespedeza bicolor |
0.176 |
Capillipedium parviflorum |
0.231 |
|
|
Cipadessa baccifera |
0.267 |
Pogonatherum crinitum |
0.174 |
Populus lasiocarpa |
0.165 |
|||
|
Phragmites australis |
0.246 |
Lonicera japonica |
0.174 |
Ulmus pumila |
0.138 |
|||
|
Viburnum chinshanense |
0.242 |
Miscanthus sinensis |
0.142 |
Lactuca sibirica |
0.133 |
|||
|
Debregeasia orientalis |
0.241 |
Broussonetia × kazinoki |
0.13 |
|||||
|
Mallotus barbatus |
0.233 |
|||||||
|
Pteroceltis tatarinowii |
0.219 |
|||||||
3.2. Drivers of Vegetation Community in the WLF Zone
The explanatory variables collectively explained 34.7%, 11.1%, and 8.1% of total variation in species composition in the inundation, transitional, and unflooded zones, respectively (Figure 5). Dam properties, hydrological alteration, and environmental variables explained 20.1%, 1.9%, and 3.8% in the inundation zone, 5.8%, 1.6%, and 1.7% in the transitional zone, and 4.8%, 1.2%, and 1.2% in the unflooded zone, respectively, of total variation in vegetation composition in the WLF zone of the reservoirs (Figure 5A–C). The shared fraction between two or three datasets was relatively high in the inundation zone (fractions [d] to [g] in Figure 5A; 9.2%). Global model importance and variables retained in forward selection for use in the final variance partitioning model are listed in Table 4. Reservoir retention time explained 10.4%, 2.7%, and 2.5% of the variance in riparian vegetation in each zone, respectively, indicating that although the effects of WLF were most intense in the inundation zone, they were not confined to this zone. RDA indicated that the relative importance of each predictor varied in the different sampling zones. For example, within the inundation zone, plant composition varied depending on reservoir age (adj-r2 = 0.089) and slope (adj-r2 = 0.034, p = 0.005). Reservoir size (adj-r2 = 0.037) and DO (adj-r2 = 0.030) were important in explaining variation in vegetation within the transitional zone. Reservoir size (adj-r2 = 0.025) was the most important variable in the unflooded zone. RDA triplots (Figure 6) were used to describe all significant (p < 0.05) relationships of explanatory variables with vegetation composition. The life histories of plant species varied according to the regulation type in the inundation zone. Daily and weekly regulated reservoirs were dominated by perennial species, while the seasonally and yearly regulated reservoirs were dominated by annual and perennial species.
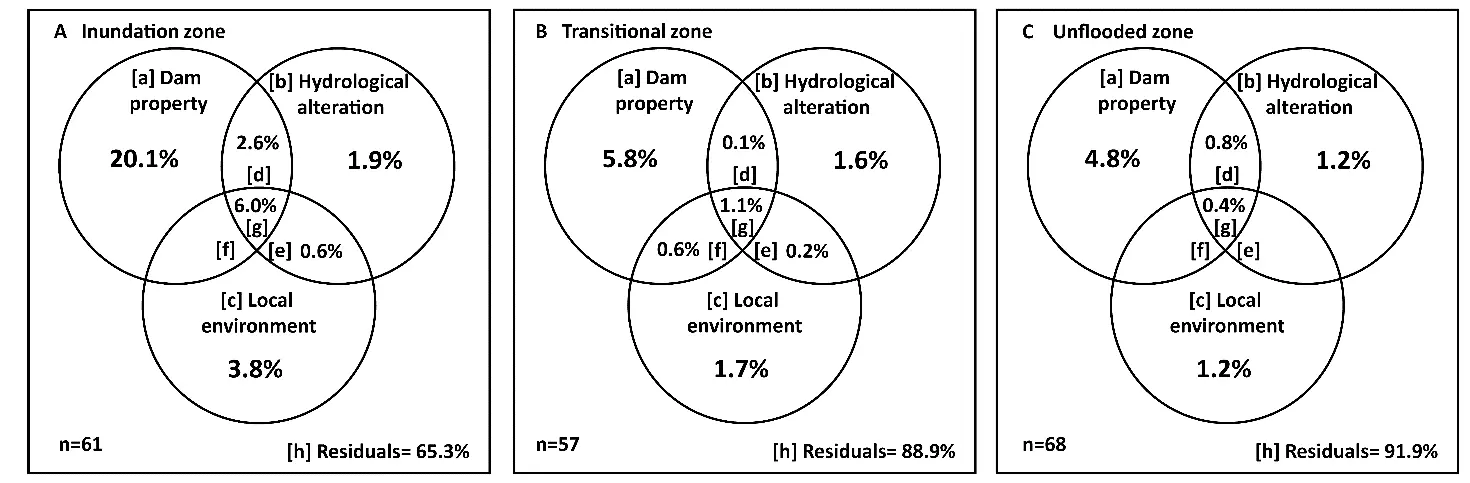
Figure 5. Variation partitioning of the Hellinger-transformed riparian vegetation data into a dam properties component (upper left-hand circle), a hydrological alteration component (upper right-hand circle), and a local environmental component (lower circle). The forward selected variables included in each dataset could be checked in Table 4. This generates 8 fractions: 3 pure effects of the dam properties, hydrological alteration, and local environmental datasets (Fractions [a] to [c]) plus 4 joint effects of the two or three separate sets (Fractions [d] to [g]) and 1 unexplained component of the variance (Residuals [h]). Values indicate the fraction of the explanatory set (as adj-r2) in the (A) inundation zone, (B) transitional zone, and (C) unflooded zone. Monte Carlo permutation tests were used to determine the significance of the pure fraction.
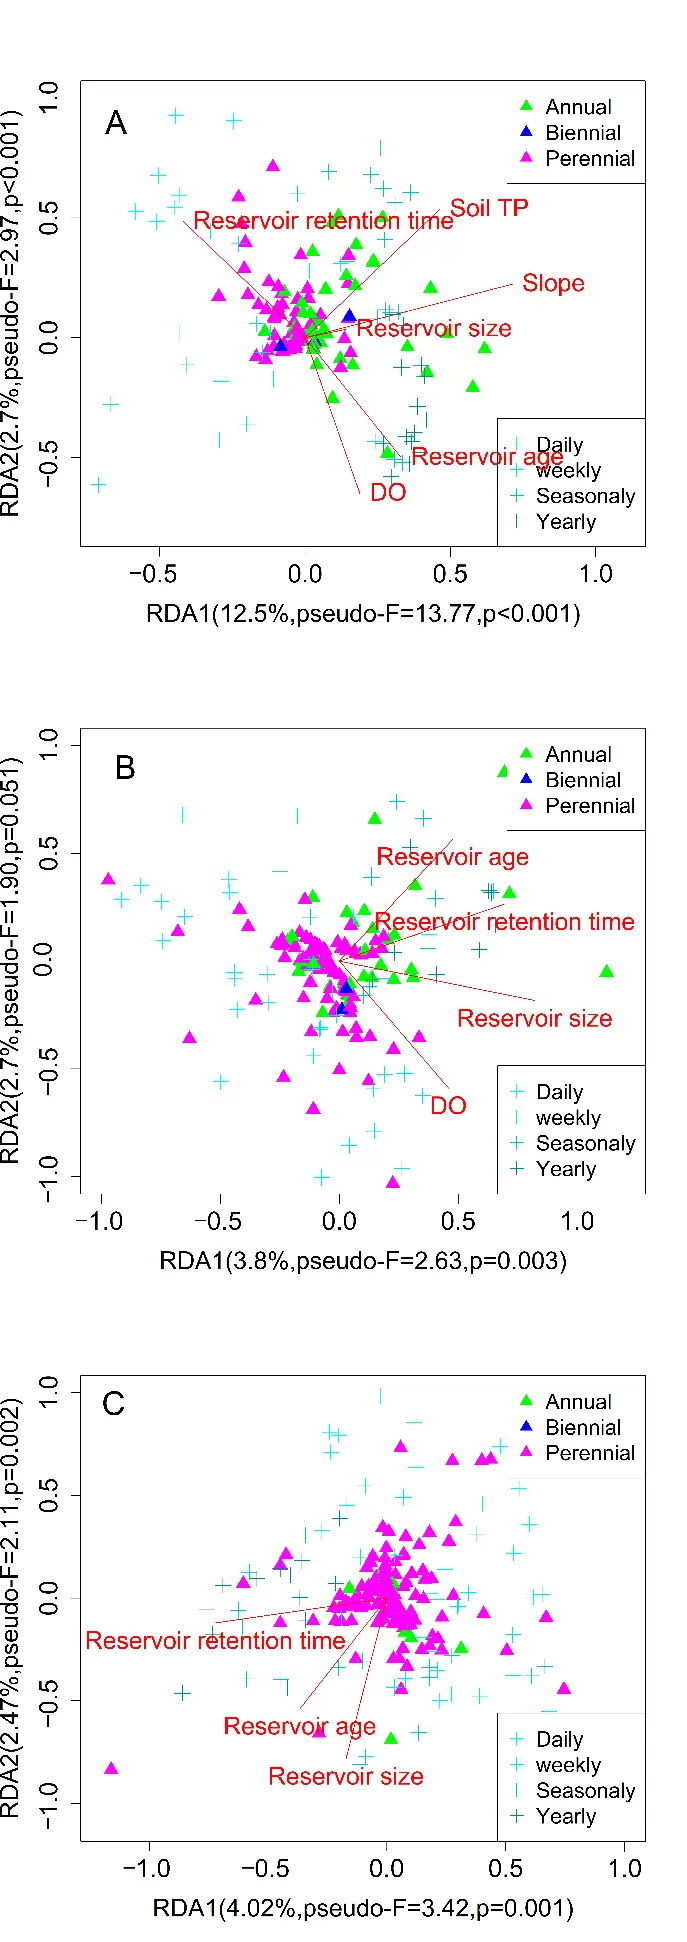
Figure 6. The triplot of the Redundancy analysis (RDA) on the riparian plant abundance data with forward selected regulation and environmental variables in the (A) Inundation zone, (B) transitional zone, (C) unflooded zone. Crosspoints (+) represent different sampling quadrates scores belonging to reservoirs of different regulation: daily, weekly, seasonally, and yearly. Triangles (Δ) indicate different riparian plant species grouped as annual, biennial, and perennial. Abbreviations of the explanatory variables are provided in Table 1.
Table 4. Details of RDA and variation partitioning results covering the significance of the global model for each predictor dataset and the variables retained after forward selection to be used in the variance partitioning model for the inundation zone, transitional zone and unflooded zone.
|
Zones |
Predictor Datasets |
Variables in Original Dataset |
Significance of the Global Model |
The Variable Retained after the Forward Selection |
|---|---|---|---|---|
|
Inundation zone |
Dam properties |
Reservoir retention time, Reservoir age, Flow regulation type |
F = 5.67, p < 0.001 |
Weekly type (r2 = 0.111, p < 0.001); Daily type (r2 = 0.125, p < 0.001); Reservoir age (r2 = 0.040, p < 0.001); Yearly type (r2 = 0.029, p < 0.001); Reservoir retention time (r2 = 0.039, p < 0.001) |
|
Hydrological alteration |
Reservoir size, Relative inundation probability |
F = 7.86, p < 0.001 |
Relative inundation probability (r2 = 0.177, p < 0.001); Reservoir size (r2 = 0.039, p < 0.001) |
|
|
Local environment |
Do, Slope, River width, Width of inundation zone, Soil TN, Soil TP, Altitude |
F = 2.33, p < 0.001 |
Width of inundation zone (r2 = 0.089, p < 0.001); DO (r2 = 0.036, p = 0.006); Altitude (r2 = 0.031, p = 0.014); Slope (r2 = 0.028, p = 0.017) |
|
|
All variables |
Reservoir retention time, Reservoir age, Reservoir size, Relative inundation probability, Do, Slope, River width, Width of inundation zone, Soil TN, Soil TP, Altitude |
F = 3.17, p < 0.001 |
Relative inundation probability (r2 = 0.177, p < 0.001); Reservoir age (r2 = 0.046, p < 0.001); Reservoir retention time (r2 = 0.048, p < 0.001); Reservoir size (r2 = 0.038, p < 0.001); DO (r2 = 0.024, p = 0.004); Soil TP (r2 = 0.023, p = 0.005) |
|
|
Transitional zone |
Dam properties |
Reservoir retention time; Reservoir age, Flow regulation type |
F = 1.68, p < 0.001 |
daily type (r2 = 0.079, p < 0.001); Weekly type (r2 = 0.056, p < 0.001); Reservoir retention time (r2 = 0.032, p = 0.006); Reservoir age (r2 = 0.028, p = 0.008) |
|
Hydrological alteration |
Reservoir size, relative inundation probability |
F = 2.04, p < 0.001 |
Relative inundation probability (r2 = 0.049, p < 0.001); Reservoir size (r2 = 0.031, p = 0.007) |
|
|
Local environment |
Do, Slope, River width, Width of transitional zone, Soil TN, Soil TP, Altitude |
F = 1.36, p < 0.001 |
DO (r2 = 0.030, p = 0.01); Width of transitional zone (r2 = 0.028, p = 0.01) |
|
|
All variables |
Reservoir retention time, Reservoir age, Reservoir size, Relative inundation probability, Do, Slope, River width, Width of transitional zone, Soil TN, Soil TP, Altitude |
F = 1.41, p < 0.001 |
Relative inundation probability (r2 = 0.049, p < 0.001); Reservoir size (r2 = 0.032, p < 0.001); DO (r2 = 0.031, p = 0.009); Reservoir retention time (r2 = 0.031, p = 0.006) |
|
|
Unflooded zone |
Dam properties |
Reservoir retention time; Reservoir age, Flow regulation type |
F = 1.92, p < 0.001 |
Daily type (r2 = 0.035, p < 0.001); Weekly type (r2 = 0.034, p < 0.001); Yearly type (r2 = 0.021, p = 0.009); Reservoir retention time (r2 = 0.022, p = 0.002) |
|
Hydrological alteration |
Reservoir size, relative inundation probability |
F =1.85, p < 0.001 |
Relative inundation probability (r2 = 0.046, p < 0.001); Reservoir size (r2 = 0.027, p < 0.001) |
|
|
Local environment |
Do, Slope, River width, Width of WLF zone, Soil TN, Soil TP, Altitude |
F = 1.29, p < 0.001 |
Width of WLF zone (r2 = 0.030, p = 0.003); Soil TN (r2 = 0.021, p = 0.01) |
|
|
All variables |
Reservoir retention time, Reservoir age, Reservoir size, Relative inundation probability, Do, Slope, River width, Width of inundation zone, Soil TN, Soil TP, Altitude |
F = 1.53, p < 0.001 |
Relative inundation probability (r2 = 0.046, p < 0.001); Reservoir size (r2 = 0.031, p < 0.001); Reservoir retention time (r2 = 0.026, p < 0.001); Reservoir age (r2 = 0.023, p = 0.001) |
4. Discussions
Water level regulation has a profound influence on reservoir riparian vegetation. In the nine Wujiang River cascade reservoirs, plants in the inundation zone were exposed to the strongest disturbance (Figure S2). In this zone, the plant community was dominated by short herbs, while herbs and tall grasses dominated the transitional zone, and shrubs and trees the unflooded zone (Figure 2). These results are consistent with previous studies in the Three Gorges Reservoir, showing that the inundation zone was mostly colonised by small short herbaceous plants [16,62]. Shallow soils, frequent inundation, substrate instability, and repeated exposure may favour short-lived or disturbance-tolerant herbaceous species in the inundation zone, whereas deeper and more stable soils in the transitional and unflooded zones may support taller grasses, shrubs, and trees.
More importantly, our study showed that vegetation composition was associated with reservoir regulation type, highlighting the importance of assessing changes to biodiversity across a gradient of WLF magnitude and frequency. However, these differences should not be interpreted as synchronous vegetation responses to water-level conditions in the survey year alone. In this study, regulation type was treated as a proxy for the long-term hydrological disturbance regime imposed by reservoir operation. Therefore, vegetation patterns associated with daily, weekly, seasonal, and yearly regulation are more appropriately interpreted as the cumulative outcome of repeated inundation, shoreline exposure, local environmental filtering, and reservoir operation history. Vegetation in the reservoir inundation zone within the same river system responded differently to the magnitude, frequency, and duration of WLF, while the vegetation in the adjacent unflooded zone changed little between reservoirs. We found a shift from annual to perennial vegetation as WLF frequency increased (Figure 6). Specifically, the seasonally and yearly regulated reservoirs were characterised by a mixture of annual and perennial plants, whilst daily or weekly regulated reservoirs were dominated by perennial species. This pattern may reflect not only differences in disturbance intensity but also delayed demographic responses, such as seed-bank germination, seedling establishment, clonal expansion, and competitive replacement across multiple growing seasons.
4.1. Species Richness and Diversity in Response to Regulation Type
Species richness and diversity differed significantly among regulation types and vegetation zones after controlling for local environmental variables. For the inundation zone, the seasonally regulated reservoirs had the highest mean species richness, followed by daily and weekly, and finally yearly-regulated reservoirs. The higher nestedness and lower turnover in the yearly reservoir indicated that differences in species richness between sampling sites were caused less by species replacement. Daily-regulated reservoirs showed the opposite trend, with beta diversity mainly determined by species turnover.
In seasonally regulated reservoirs, the quarterly inundation regime probably provided riparian plants with adequate water to survive and reproduce [45,63], thereby accommodating a range of life histories and supporting higher species richness. This regulation type also most closely resembled the natural regime of water level fluctuations. In daily and weekly reservoirs, continuous disruption throughout the year resulted in a shift in species composition towards communities richer in waterlogging tolerant species [64,65]. In the yearly reservoir, prolonged drawdown and desiccation risk were the main controls on vegetation [63]. Our observations may be partly consistent with the intermediate disturbance hypothesis (IDH), because peak species richness occurred under intermediate levels of WLF disturbance [66,67]. In this context, moderate water-level fluctuation may reduce competitive exclusion by dominant species while creating exposed microsites for colonization, thereby increasing habitat heterogeneity and species richness within the inundation zone. The dynamic equilibrium hypothesis provides a complementary explanation by emphasizing that the diversity response to disturbance can be modified by productivity and resource supply [68]. Thus, IDH mainly explains the role of disturbance intensity, whereas the dynamic equilibrium hypothesis helps explain why similar disturbance regimes may produce different diversity outcomes under different productivity conditions. However, more intensive sampling and direct measurements of productivity would be needed to test these mechanisms explicitly.
Temporal lag effects may be particularly important for interpreting the observed differences in annual and perennial dominance and beta diversity. Annual species depend strongly on seed-bank persistence, germination timing, seedling recruitment, flowering, and seed production. These processes may require at least one complete growing season and may be disrupted by frequent inundation or rapid water-level changes. In contrast, perennial species may persist through rhizomes, stolons, culms, or other clonal structures, allowing them to withstand repeated inundation and re-establish after water levels recede. Therefore, the dominance of perennial species in daily and weekly regulated reservoirs may reflect cumulative filtering over multiple disturbance cycles, rather than only the hydrological conditions of the survey period. Similarly, higher species turnover in frequently regulated reservoirs may partly reflect delayed replacement processes, in which species unable to regenerate are gradually replaced by species with greater tolerance to waterlogging, scouring, or repeated exposure.
4.2. Non-Native Species in Reservoir WLF Zones
The high discharge and intermittent shoreline exposure imposed by hydropower generation may facilitate the establishment of disturbance-adapted vegetation within the reservoir inundation zone. As such, it is also conducive to the establishment of non-native plants [26,27]. In this study, we observed that the proportion of non-native species differed among regulation types after controlling for the environmental variables. More specifically, different non-native species occupied reservoirs according to the regulation type. A. philoxeroides dominated the inundation zone of weekly reservoirs, and E. canadensis dominated in seasonally regulated reservoirs. E. canadensis is one of the most widely distributed non-native plants in China, inhibiting the growth of neighbouring vegetation via allelopathy [69]. In seasonally regulated reservoirs, water levels rise gradually during the wet season and remain high for weeks to months. This extended high-water phase may facilitate seed transport and create suitable recruitment windows after drawdown. After the water level recedes, exposed nutrient-rich sediments may further promote colonisation [70]. By contrast, daily or weekly regulated reservoirs experience frequent but short-lived high-water events (hours to days) with a narrow water level range. Such intermittent conditions may limit the establishment of some annual non-native species, but may favour disturbance-adapted, amphibious species. Indeed, A. philoxeroides may benefit from these intermittent conditions due to its strongly stoloniferous and amphibious growth form [71].
Nevertheless, the establishment and dominance of non-native species should also be interpreted in light of potential temporal lags. Invasion success is determined not only by hydrological disturbance but also by propagule pressure, dispersal pathways, interspecific competition, community invasibility, and species-specific regeneration strategies. Non-native species may not respond immediately to a single inundation event [72]; instead, their dominance may develop gradually through repeated propagule input, survival of vegetative fragments, local clonal expansion, and release from competition after native species decline. For example, the dominance of A. philoxeroides in weekly regulated reservoirs may reflect its ability to accumulate biomass and expand clonally across multiple exposure periods, while the occurrence of E. canadensis in seasonally regulated reservoirs may depend on repeated seed arrival and successful recruitment during suitable drawdown windows. Thus, non-native species patterns in WLF zones likely represent the cumulative interaction between long-term hydrological disturbance and species-specific regeneration strategies.
The WLF zone associated with the reservoir regulation is thus potentially susceptible to the establishment of some non-native species [73]. This is probably because (1) initial impoundment by the reservoir submerges a large amount of surrounding cultivated and urban land, which may provide propagules of non-native species [27]; (2) the original riparian vegetation cannot tolerate the new altered flow regime, whereas the non-native species have a higher tolerance to either waterlogging or substrate exposure [74]. The encroachment of non-native plants can further impact riparian plant communities, reducing biodiversity and altering soil properties [75,76], thereby representing an added pressure on an already compromised habitat. However, this interpretation should be regarded as a potential risk rather than evidence of inevitable invasion. Future monitoring should evaluate propagule pressure, establishment success, and population expansion of non-native species in WLF zones.
4.3. Drivers of Riparian Vegetation Composition
The flow regime in natural rivers controls variables such as water depth, substrate, and nutrient supply, which can impact riparian plant growth [77,78,79,80]. In our study, riparian vegetation composition was strongly associated with dam properties and regulation type across different vegetation zones. Dam properties can modify reservoir flow regimes and local environmental conditions, thereby indirectly influencing riparian plant communities [81]. This is consistent with previous studies in the Three Gorges Reservoir showing that artificially controlled WLF can alter riparian plant distribution and composition [24]. Unexplained variation was high in the unflooded zone, although soil-related variables, including soil TN, soil TP, and soil texture, were included in the analysis. This suggests that other unmeasured factors, such as soil moisture, soil organic matter, seed-bank composition, land-use history, dispersal limitation, biotic interactions, or stochastic processes, may also contribute to vegetation composition. However, because these factors were not quantified, this remains an untested hypothesis. The relatively high shared fraction among the three datasets in the inundation zone (fractions [d]–[g] in Figure 5A; 9.2%) indicates that dam properties, hydrological alteration, and local environmental variables partly covaried. Therefore, the unique effects of each dataset should be interpreted cautiously. Given the observational nature of our study and the possibility of lagged vegetation responses, these relationships should be interpreted as associations with long-term regulation regimes rather than as evidence of immediate causal responses to water-level conditions during the survey year.
Following impoundment, dominant plant species are often replaced by those capable of enduring long-term submergence using laterally extending rhizomes, culms, and stolons [82]. Our results indicated that species responses also reflected contrasting regulation regimes. In the yearly regulated HJD reservoir, Cynodon dactylon was dominant in the inundation zone. This species can tolerate long-term inundation through rhizome growth and waterlogging tolerance [81,83]. Other herbaceous species, such as Chenopodium album and Persicaria lapathifolia, may rapidly establish after sediment exposure and survive flooding or scouring due to their growth form and resistance to uprooting [84,85]. In daily regulated reservoirs, frequent 1–2 m fluctuations reduced the dominance of annual species and favoured flood-tolerant perennials, such as Clinopodium chinense, Rorippa indica, Reynoutria japonica, and Oenanthe javanica. Annual plants may be disadvantaged because frequent WLF can prevent them from completing flowering and seed production, whereas perennial species may persist through clonal growth and rapid regrowth after disturbance [86,87].
A key limitation of this study is that the vegetation survey provides a spatial comparison among reservoirs under contrasting regulation types, but does not directly quantify temporal lag effects. Because most vegetation data were collected during a single survey period, we cannot fully distinguish immediate responses to recent water-level conditions from cumulative responses to previous years of reservoir operation. Future studies should combine multi-year vegetation monitoring, long-term water-level records, and measurements of seed-bank dynamics, clonal propagation, and propagule dispersal to quantify lagged vegetation responses and predict vegetation trajectories under alternative regulation scenarios.
5. Conclusions
We observed consistent riparian vegetation patterns across the WLF zones of the nine cascade reservoirs on the Wujiang River. Within this high-dam cascade reservoir system in a subtropical monsoon region, riparian vegetation patterns were strongly associated with different long-term dam flow regulation regimes, which modulated downstream flows and altered the frequency and duration of shoreline inundation. These patterns most likely reflect cumulative responses to contrasting long-term flow regulation regimes, rather than synchronous responses to water-level fluctuation in a single survey year. Our results support the hypothesis that riparian vegetation composition and diversity are associated with contrasting flow regulation regimes, particularly in the inundation zone. Herbaceous plants in the inundation zone were more sensitive to flow regulation than to local environmental filtering. Perennial vegetation was distributed across a range of regulation types, while annual species were largely excluded from the daily regulated reservoirs. The results also partly support the hypothesis that dam properties and hydrological alteration are more important than local environmental variables in structuring riparian vegetation, although their effects varied among vegetation zones. Seasonally regulated reservoirs supported the highest species richness and beta diversity, suggesting that seasonal WLF may help maintain riparian plant diversity by providing heterogeneous shoreline conditions. However, this implication should be interpreted cautiously because vegetation responses may involve temporal lags and cumulative effects. Non-native species, such as E. canadensis and A. philoxeroides, may pose a potential risk to WLF zone vegetation. The WLF zone should thus be considered as a disturbed habitat that may facilitate the establishment of some non-native plants, although invasion success also depends on propagule pressure, interspecific competition, and community invasibility. Our study highlights the vulnerability of vegetation under altered flow regulation in the Wujiang River cascade reservoirs and can aid reservoir management and prioritisation of areas for restoration.
Supplementary Materials
The following supporting information can be found at: https://www.sciepublish.com/article/pii/1180, Figure S1: Data classification framework for the effect of dam and reservoir properties on the riparian vegetation; Figure S2: Schematic representations of the vegetation in the water level fluctuation zone of different regulated reservoirs; Figure S3: The correlation between the indicators in the analyses; Table S1: Characteristics of the sampled cascade hydroelectricity dams in Wujiang Catchment; Table S2: The sampling size of the zonation, sampling sites and quadrats in the study reservoirs; Table S3: The list of the study riparian species with their binary classification, growth form, family and label abbreviation; Table S4: The introduction of the important concepts appears in the manuscript; Table S5: The relative inundation probability (RIP) from the relative height of the plot against the width of each zonation; Table S6: The introduction of the research questions as well as the relevant predictor and explanatory variables; Table S7: The remaining independent explanatory variables in the study; Table S8: Forward model selection of generalized linear mixed-effect model (GLMMs.NB) for species richness; Table S9: Forward model selection of generalized linear mixed-effect model (GLMMs) for Shannon index; Table S10: Forward model selection of generalized linear mixed-effect model (GLMMs) for invasive species proportion; Table S11: Forward model selection of generalized linear mixed-effect model (GLMMs) for Beta diversity; Table S12: Forward model selection of generalized linear mixed-effect model (GLMMs) for Nestedness; Table S13: Forward model selection of generalized linear mixed-effect model (GLMMs) for Species turnover; Table S14: The correlation value for each selected variable in each environmental component.
Statement of the Use of Generative AI and AI-Assisted Technologies in the Writing Process
During the preparation of this manuscript, the authors used ChatGPT (OpenAI) to improve the language, readability, and grammatical accuracy of the manuscript. After using this tool, the authors carefully reviewed and edited the content as needed and take full responsibility for the content of the published article.
Author Contributions
W.L. supervised and led the study. N.J.W. formulated the research questions, while J.S., Z.P. and N.J.W. developed the methodological approach. All authors contributed to data collection. J.S. and Z.P. conducted the statistical analyses and interpreted the results. J.S., Z.P. and N.J.W. led the preparation of the manuscript, while X.Q., F.L., Y.C., W.W., and T.L. contributed to reviewing and editing the manuscript. All authors have read and approved the final version of the manuscript.
Ethics Statement
Not applicable.
Informed Consent Statement
Not applicable.
Data Availability Statement
The data used for the analysis of this study can be found in the supplementary materials.
Funding
This research was funded by the National Key Research and Development Program of China, grant number 2016YFA0601001, and the National Natural Science Foundation of China, grant number 32471665.
Declaration of Competing Interest
The authors declare that they have no known competing financial interests or personal relationships that could have appeared to influence the work reported in this paper.
References
- Wu J, Huang J, Han X, Xie Z, Gao X. Three-Gorges Dam—Experiment in Habitat Fragmentation? Science 2003, 300, 1239–1240. DOI:10.1126/science.1083312 [Google Scholar]
- Xie P. Three-Gorges Dam: Risk to Ancient Fish. Science 2003, 302, 1149–1151. DOI:10.1126/science.302.5648.1149b [Google Scholar]
- Ward JV, Stanford JA. The serial discontinuity concept: Extending the model to floodplain rivers. Regul. Rivers Res. Manag. 1995, 10, 159–168. DOI:10.1002/rrr.3450100211 [Google Scholar]
- Wang J, Sheng Y, Tong TSD. Monitoring decadal lake dynamics across the Yangtze Basin downstream of Three Gorges Dam. Remote Sens. Environ. 2014, 152, 251–269. DOI:10.1016/j.rse.2014.06.004 [Google Scholar]
- Park Y, Chang J, Lek S, Cao W, Brosse S. Conservation Strategies for Endemic Fish Species Threatened by the Three Gorges Dam. Conserv. Biol. 2003, 17, 1748–1758. DOI:10.1111/j.1523-1739.2003.00430.x [Google Scholar]
- Gehrke PC, Gilligan DM, Barwick M. Changes in fish communities of the Shoalhaven River 20 years after construction of Tallowa Dam, Australia. River Res. Appl. 2002, 18, 265–286. DOI:10.1002/rra.669 [Google Scholar]
- Merritt DM, Nilsson C, Jansson R. Consequences of propagule dispersal and river fragmentation for riparian plant community diversity and turnover. Ecol. Monogr. 2010, 80, 609–626. DOI:10.1890/09-1533.1 [Google Scholar]
- Bi Y, Zhu K, Hu Z, Zhang L, Yu B, Zhang Q. The effects of the Three Gorges Dam’s (TGD’s) experimental impoundment on the phytoplankton community in the Xiangxi River, China. Int. J. Environ. Stud. 2010, 67, 207–221. DOI:10.1080/00207231003704196 [Google Scholar]
- Albert JS, Destouni G, Duke-Sylvester SM, Magurran AE, Oberdorff T, Reis RE, et al. Scientists’ warning to humanity on the freshwater biodiversity crisis. Ambio 2021, 50, 85–94. DOI:10.1007/s13280-020-01318-8 [Google Scholar]
- Dudgeon D, Strayer DL. Bending the curve of global freshwater biodiversity loss: what are the prospects? Biol. Rev. 2025, 100, 205–226. DOI:10.1111/brv.13137 [Google Scholar]
- Vörösmarty CJ, McIntyre PB, Gessner MO, Dudgeon D, Prusevich A, Green P, et al. Global threats to human water security and river biodiversity. Nature 2010, 467, 555–561. DOI:10.1038/nature09440 [Google Scholar]
- Hoque MM, Islam A, Ghosh S. Environmental flow in the context of dams and development with special reference to the Damodar Valley Project, India: A review. Sustain. Water Resour. Manag. 2022, 8, 62. DOI:10.1007/s40899-022-00646-9 [Google Scholar]
- Widén Å, Malm Renöfält B, Degerman E, Wisaeus D, Jansson R. Environmental Flow Scenarios for a Regulated River System: Projecting Catchment‐Wide Ecosystem Benefits and Consequences for Hydroelectric Production. Water Resour. Res. 2022, 58, e2021WR030297. DOI:10.1029/2021WR030297 [Google Scholar]
- Xu R, Zeng Z, Pan M, Ziegler AD, Holden J, Spracklen DV, et al. A global-scale framework for hydropower development incorporating strict environmental constraints. Nat. Water 2023, 1, 113–122. DOI:10.1038/s44221-022-00004-1 [Google Scholar]
- Dézerald O, Roussel JM, Lanoë E, Beauverger T, Bazin A, Rodríguez-Pérez H, et al. Fast but transient recovery of aquatic and terrestrial communities after a large dam removal. Front. Ecol. Evol. 2023, 11, 1254462. DOI:10.3389/fevo.2023.1254462 [Google Scholar]
- Bao Y, Gao P, He X. The water-level fluctuation zone of Three Gorges Reservoir—A unique geomorphological unit. Earth-Sci. Rev. 2015, 150, 14–24. DOI:10.1016/j.earscirev.2015.07.005 [Google Scholar]
- Gasith A, Gafny S. Effects of Water Level Fluctuation on the Structure and Function of the Littoral Zone. In Large Lakes; Tilzer MM, Serruya C, Eds.; Brock/Springer Series in Contemporary Bioscience; Springer: Berlin/Heidelberg, Germany, 1990; pp. 156–171. DOI:10.1007/978-3-642-84077-7_8 [Google Scholar]
- Jansson R, Nilsson C, Renöfält B. Fragmentation of Riparian Floras in Rivers with Multiple Dams. Ecology 2000, 81, 899–903. DOI:10.1890/0012-9658(2000)081[0899:FORFIR]2.0.CO;2 [Google Scholar]
- Dai Z, Liu JT. Impacts of large dams on downstream fluvial sedimentation: An example of the Three Gorges Dam (TGD) on the Changjiang (Yangtze River). J. Hydrol. 2013, 480, 10–18. DOI:10.1016/j.jhydrol.2012.12.003 [Google Scholar]
- Wilcox DA, Nichols SJ. The effects of water-level fluctuations on vegetation in a Lake Huron wetland. Wetlands 2008, 28, 487–501. DOI:10.1672/07-129.1 [Google Scholar]
- Bejarano MD, Nilsson C, Aguiar FC. Riparian plant guilds become simpler and most likely fewer following flow regulation. J. Appl. Ecol. 2018, 55, 365–376. DOI:10.1111/1365-2664.12949 [Google Scholar]
- Janssen P, Stella JC, Piégay H, Räpple B, Pont B, Faton JM, et al. Divergence of riparian forest composition and functional traits from natural succession along a degraded river with multiple stressor legacies. Sci. Total Environ. 2020, 721, 137730. DOI:10.1016/j.scitotenv.2020.137730 [Google Scholar]
- Zhang Y, Alahuhta J, Li W, Sun JY. Variation of Riparian Plant CSR Strategies Across the Gradient of the Water Level Fluctuation and Snowmelt Along the Nyang River, Qinghai–Tibet Plateau. J. Veg. Sci. 2025, 36, e70093. DOI:10.1111/jvs.70093 [Google Scholar]
- New T, Xie Z. Impacts of large dams on riparian vegetation: applying global experience to the case of China’s Three Gorges Dam. Biodivers. Conserv. 2008, 17, 3149–3163. DOI:10.1007/s10531-008-9416-2 [Google Scholar]
- Sun J, Pattison Z, Cao Y, Fu W, Willby NJ, Li W. Comparative impacts of dam water level regimes on herbaceous plant growth strategies in cascade reservoirs and downstream reaches of a major river. Freshw. Biol. 2023, 68, 127–140. DOI:10.1111/fwb.14014 [Google Scholar]
- Čuda J, Rumlerová Z, Brůna J, Skálová H, Pyšek P. Floods affect the abundance of invasive Impatiens glandulifera and its spread from river corridors. Divers. Distrib. 2017, 23, 342–354. DOI:10.1111/ddi.12524 [Google Scholar]
- Pattison Z, Minderman J, Boon PJ, Willby N. Twenty years of change in riverside vegetation: What role have invasive alien plants played? Appl. Veg. Sci. 2017, 20, 422–434. DOI:10.1111/avsc.12297 [Google Scholar]
- Heino J, Mykrä H, Kotanen J, Muotka T. Ecological filters and variability in stream macroinvertebrate communities: Do taxonomic and functional structure follow the same path? Ecography 2007, 30, 217–230. DOI:10.1111/j.2007.0906-7590.04894.x [Google Scholar]
- Merritt DM, Wohl EE. Plant dispersal along rivers fragmented by dams. River Res. Appl. 2006, 22, 1–26. DOI:10.1002/rra.890 [Google Scholar]
- Yang F, Liu WW, Wang J, Liao L, Wang Y. Riparian vegetation’s responses to the new hydrological regimes from the Three Gorges Project: Clues to revegetation in reservoir water-level-fluctuation zone. Acta Ecol. Sin. 2012, 32, 89–98. DOI:10.1016/j.chnaes.2012.02.004 [Google Scholar]
- Zhang Z, Wan C, Zheng Z, Hu L, Feng K, Chang J, et al. Plant community characteristics and their responses to environmental factors in the water level fluctuation zone of the three gorges reservoir in China. Environ. Sci. Pollut. Res. 2013, 20, 7080–7091. DOI:10.1007/s11356-013-1702-1 [Google Scholar]
- Vervuren PJA, Blom CWPM, De Kroon H. Extreme flooding events on the Rhine and the survival and distribution of riparian plant species. J. Ecol. 2003, 91, 135–146. DOI:10.1046/j.1365-2745.2003.00749.x [Google Scholar]
- Grabas GP, Rokitnicki-Wojcik D. Characterizing daily water-level fluctuation intensity and water quality relationships with plant communities in Lake Ontario coastal wetlands. J. Great Lakes Res. 2015, 41, 136–144. DOI:10.1016/j.jglr.2014.12.019 [Google Scholar]
- Ye C, Cheng X, Zhang Y, Wang Z, Zhang Q. Soil nitrogen dynamics following short-term revegetation in the water level fluctuation zone of the Three Gorges Reservoir, China. Ecol. Eng. 2012, 38, 37–44. DOI:10.1016/j.ecoleng.2011.10.005 [Google Scholar]
- Chen Z, Fang F, Shao Y, Jiang Y, Huang J, Guo J. The biotransformation of soil phosphorus in the water level fluctuation zone could increase eutrophication in reservoirs. Sci. Total Environ. 2021, 763, 142976. DOI:10.1016/j.scitotenv.2020.142976 [Google Scholar]
- Marden M, Arnold G, Gomez B, Rowan D. Pre‐ and post‐reforestation gully development in Mangatu Forest, East Coast, North Island, New Zealand. River Res. Appl. 2005, 21, 757–771. DOI:10.1002/rra.882 [Google Scholar]
- Randle TJ, Morris GL, Tullos DD, Weirich FH, Kondolf GM, Moriasi DN, et al. Sustaining United States reservoir storage capacity: Need for a new paradigm. J. Hydrol. 2021, 602, 126686. DOI:10.1016/j.jhydrol.2021.126686 [Google Scholar]
- Law A, Baker A, Sayer C, Foster G, Gunn IDM, Taylor P, et al. The effectiveness of aquatic plants as surrogates for wider biodiversity in standing fresh waters. Freshw. Biol. 2019, 64, 1664–1675. DOI:10.1111/fwb.13369 [Google Scholar]
- Tabacchi E, Lambs L, Guilloy H, Planty‐Tabacchi AM, Muller E, Decamps H. Impacts of riparian vegetation on hydrological processes. Hydrol. Process. 2000, 14, 2959–2976. DOI:10.1002/1099-1085(200011/12)14:16/17%3C2959::AID-HYP129%3E3.0.CO;2-B [Google Scholar]
- Palmer M, Ruhi A. Linkages between flow regime, biota, and ecosystem processes: Implications for river restoration. Science 2019, 365, eaaw2087. DOI:10.1126/science.aaw2087 [Google Scholar]
- Pasquino V, Lama GFC, Peruzzi C, Chirico GB, Aberle J. Assessing bed shear stress effects on flow resistance of vegetated channel beds through Leaf Area Index (LAI). J. Hydrol. 2025, 653, 132518. DOI:10.1016/j.jhydrol.2024.132518 [Google Scholar]
- Santoro M, Vanharanta M, Villena-Alemany C, Hassenrück C, Hagemann M, Grossart HP, et al. Impact of extreme weather events on pelagic cyanobacterial communities: an in situ mesocosm study in the Gulf of Finland. J. Mar. Syst. 2026, 253, 104174. DOI:10.1016/j.jmarsys.2025.104174 [Google Scholar]
- Giovannini MRM, Lama GFC, Scopetani L, Francalanci S, Signorile A, Saracino R, et al. Evaluating the Impacts of Riparian Plants on Flood Hazard Within Vegetated Rivers. J. Flood Risk Manag. 2025, 18, e70063. DOI:10.1111/jfr3.70063 [Google Scholar]
- Zhang WL, Johnson M, Chan F, Wu NC, Xu YY, Guo ZF, et al. Unsustainable River Management Will Prevent the Achievement of the SDGs. J. Watershed Ecol. 2026, 1, 10008. DOI:10.70322/jwe.2026.10008 [Google Scholar]
- Nilsson C, Berggren K. Alterations of Riparian Ecosystems Caused by River Regulation. BioScience 2000, 50, 783. DOI:10.1641/0006-3568(2000)050[0783:AORECB]2.0.CO;2 [Google Scholar]
- Wu H, Zeng G, Liang J, Chen J, Xu J, Dai J, et al. Responses of landscape pattern of China’s two largest freshwater lakes to early dry season after the impoundment of Three-Gorges Dam. Int. J. Appl. Earth Obs. Geoinf. 2017, 56, 36–43. DOI:10.1016/j.jag.2016.11.006 [Google Scholar]
- Hu JY, Xie YH, Tang Y, Li F, Zou YA. Changes of Vegetation Distribution in the East Dongting Lake After the Operation of the Three Gorges Dam, China. Front. Plant Sci. 2018, 9, 582. DOI:10.3389/fpls.2018.00582 [Google Scholar]
- Kotowski W, Thörig W, van Diggelen R, Wassen MJ. Competition as a factor structuring species zonation in riparian fens—A transplantation experiment. Appl. Veg. Sci. 2006, 9, 231–240. DOI:10.1111/j.1654-109X.2006.tb00672.x [Google Scholar]
- Van Der Meijden R. Heukels’ Flora van Nederland, 23rd ed.; Wolters-Noordhoff: Groningen, The Netherlands, 2005. [Google Scholar]
- Wang F, Maberly SC, Wang B, Liang X. Effects of dams on riverine biogeochemical cycling and ecology. Inland Waters 2018, 8, 130–140. DOI:10.1080/20442041.2018.1469335 [Google Scholar]
- Knudsen D, Peterson GA, Pratt PF. Lithium, sodium, and potassium. In Methods of Soil Analysis: Part 2 Chemical and Microbiological Properties, 2nd ed.; ASA and SSSA: Madison, WI, USA, 1982; pp. 225–246. [Google Scholar]
- Baselga A. Partitioning the turnover and nestedness components of beta diversity. Glob. Ecol. Biogeogr. 2010, 19, 134–143. DOI:10.1111/j.1466-8238.2009.00490.x [Google Scholar]
- Dufrene M, Legendre P. Species Assemblages and Indicator Species: The Need for a Flexible Asymmetrical Approach. Ecol. Monogr. 1997, 67, 345. DOI:10.2307/2963459 [Google Scholar]
- Podani J, Csányi B. Detecting indicator species: Some extensions of the IndVal measure. Ecol. Indic. 2010, 10, 1119–1124. DOI:10.1016/j.ecolind.2010.03.010 [Google Scholar]
- Wickham H, François R, Henry L, Müller K, Vaughan D. Dplyr: A Grammar of Data Manipulation. 2019. Available online: https://cran.r-project.org/package=dplyr (accessed on 3 April 2026).
- Quinn GP, Keough MJ. Experimental Design and Data Analysis for Biologists; Cambridge University Press: New York, NY, USA, 2002. [Google Scholar]
- De Mendiburu F. agricolae: Statistical Procedures for Agricultural Research. 2019. Available online: https://CRAN.R-project.org/package=agricolae (accessed on 22 October 2023).
- Blanchet FG, Legendre P, Borcard D. Forward Selection of Explanatory Variables. Ecology 2008, 89, 2623–2632. DOI:10.1890/07-0986.1 [Google Scholar]
- Peres-Neto PR, Legendre P, Dray S, Borcard D. Variation Partitioning of Species Data Matrices: Estimation and Comparison of Fractions. Ecology 2006, 87, 2614–2625. DOI:10.1890/0012-9658(2006)87[2614:VPOSDM]2.0.CO;2 [Google Scholar]
- De Bie T, De Meester L, Brendonck L, Martens K, Goddeeris B, Ercken D, et al. Body size and dispersal mode as key traits determining metacommunity structure of aquatic organisms. Ecol. Lett. 2012, 15, 740–747. DOI:10.1111/j.1461-0248.2012.01794.x [Google Scholar]
- Borcard D, Legendre P, Drapeau P. Partialling out the Spatial Component of Ecological Variation. Ecology 1992, 73, 1045–1055. DOI:10.2307/1940179 [Google Scholar]
- Wang JC, Zhu B, Wang T. Characteristics of restoration of natural herbaceous vegetation of typical water-level fluctuation zone after flooding in the Three Gorges Reservoir area. Resour. Environ. Yangtze Basin 2011, 20, 603–610. Available online: https://www.chemalink.net/data/download/135f358f58c5bf99.html (accessed on 22 October 2023).
- Aguiar FC, Martins MJ, Silva PC, Fernandes MR. Riverscapes downstream of hydropower dams: Effects of altered flows and historical land-use change. Landsc. Urban Plan. 2016, 153, 83–98. DOI:10.1016/j.landurbplan.2016.04.009 [Google Scholar]
- Rivaes R, Boavida I, Santos JM, Pinheiro AN, Ferreira T. Importance of considering riparian vegetation requirements for the long-term efficiency of environmental flows in aquatic microhabitats. Hydrol. Earth Syst. Sci. 2017, 21, 5763–5780. DOI:10.5194/hess-21-5763-2017 [Google Scholar]
- Aguiar FC, Segurado P, Martins MJ, Bejarano MD, Nilsson C, Portela MM, et al. The abundance and distribution of guilds of riparian woody plants change in response to land use and flow regulation. J. Appl. Ecol. 2018, 55, 2227–2240. DOI:10.1111/1365-2664.13110 [Google Scholar]
- Connell JH. Diversity in Tropical Rain Forests and Coral Reefs. Science 1978, 199, 1302–1310. DOI:10.1126/science.199.4335.1302 [Google Scholar]
- Townsend CR, Scarsbrook MR, Dolédec S. The intermediate disturbance hypothesis, refugia, and biodiversity in streams. Limnol. Oceanogr. 1997, 42, 938–949. DOI:10.4319/lo.1997.42.5.0938 [Google Scholar]
- Huston MA. Biological Diversity: The Coexistence of Species on Changing Landscapes; Cambridge University Press: Cambridge, UK, 1994. [Google Scholar]
- Lu Y, Wang Y, Wu B, Wang S, Wei M, Du D, et al. Allelopathy of three Compositae invasive alien species on indigenous Lactuca sativa L. enhanced under Cu and Pb pollution. Sci. Hortic. 2020, 267, 109323. DOI:10.1016/j.scienta.2020.109323 [Google Scholar]
- Chen C, Meurk CD, Wu S. The drawdown zone of the Three Gorges Reservoir: A high risk corridor for species invasion in China? Acta Ecol. Sin. 2016, 36, 36–38. DOI:10.1016/j.chnaes.2015.07.006 [Google Scholar]
- Xiong W, Wang H, Wang Q, Tang J, Bowler P, Xie D, et al. Non-native species in the Three Gorges Dam Reservoir: Status and risks. BioInvasions Rec. 2018, 7, 153–158. DOI:10.3391/bir.2018.7.2.06 [Google Scholar]
- Xu Y-Y. What Should Ecology Study for Watershed? J. Watershed Ecol. 2026, 1, 10011. DOI:10.70322/jwe.2026.10011 [Google Scholar]
- Řepka R, Šebesta J, Maděra P, Vahalík P. Comparison of the floodplain forest floristic composition of two riparian corridors: Species richness, alien species and the effect of water regime changes. Biologia 2015, 70, 208–217. DOI:10.1515/biolog-2015-0021 [Google Scholar]
- Chen Y, Zhou Y, Yin TF, Liu CX, Luo FL. The Invasive Wetland Plant Alternanthera philoxeroides Shows a Higher Tolerance to Waterlogging than Its Native Congener Alternanthera sessilis. PLoS ONE 2013, 8, e81456. DOI:10.1371/journal.pone.0081456 [Google Scholar]
- Riis T, Sand‐Jensen K. Dispersal of plant fragments in small streams. Freshw. Biol. 2006, 51, 274–286. DOI:10.1111/j.1365-2427.2005.01496.x [Google Scholar]
- Xian L, Wan T, Cao Y, Sun JY, Wu T, Apudo AA, et al. Structural variability and functional prediction in the epiphytic bacteria assemblies of Myriophyllum spicatum. Curr. Microbiol. 2020, 77, 3582–3594. DOI:10.1007/s00284-020-02139-4 [Google Scholar]
- Cai Q. Why Watershed Ecology? J. Watershed Ecol. 2026, 1, 10001. DOI:10.70322/jwe.2026.10001 [Google Scholar]
- Pollen-Bankhead N, Simon A, Thomas RE. The Reinforcement of Soil by Roots: Recent Advances and Directions for Future Research. Treatise Geomorphol. 2013, 12, 107–124. DOI:10.1016/B978-0-12-374739-6.00325-0 [Google Scholar]
- Winkel A, Visser EJW, Colmer TD, Brodersen KP, Voesenek LACJ, Sand‐Jensen K, et al. Leaf gas films, underwater photosynthesis and plant species distributions in a flood gradient. Plant Cell Environ. 2016, 39, 1537–1548. DOI:10.1111/pce.12717 [Google Scholar]
- Baldwin DS, Mitchell AM. The effects of drying and re-flooding on the sediment and soil nutrient dynamics of lowland river-floodplain systems: A synthesis. Regul. Rivers Res. Manag. 2000, 16, 457–467. DOI:10.1002/1099-1646(200009/10)16:5%3C457::AID-RRR597%3E3.0.CO;2-B [Google Scholar]
- Zhu Z, Chen Z, Li L, Shao Y. Response of dominant plant species to periodic flooding in the riparian zone of the Three Gorges Reservoir (TGR), China. Sci. Total Environ. 2020, 747, 141101. DOI:10.1016/j.scitotenv.2020.141101 [Google Scholar]
- Luo X, He X, Luo X, Liu Y, Wang J, Dong J. Soil Organic Carbon Shapes AMF Communities in Soils and Roots of Cynodon dactylon under Anti-Seasonal Drying-Wetting Cycles. Diversity 2019, 11, 197. DOI:10.3390/d11100197 [Google Scholar]
- Yuan LB, Dai YS, Xie LJ, Yu LJ, Zhou Y, Lai YX, et al. Jasmonate Regulates Plant Responses to Postsubmergence Reoxygenation through Transcriptional Activation of Antioxidant Synthesis. Plant Physiol. 2017, 173, 1864–1880. DOI:10.1104/pp.16.01803 [Google Scholar]
- Karrenberg S, Blaser S, Kollmann J, Speck T, Edwards PJ. Root anchorage of saplings and cuttings of woody pioneer species in a riparian environment. Funct. Ecol. 2003, 17, 170–177. DOI:10.1046/j.1365-2435.2003.00709.x [Google Scholar]
- Stromberg JC, Merritt DM. Riparian plant guilds of ephemeral, intermittent and perennial rivers. Freshw. Biol. 2016, 61, 1259–1275. DOI:10.1111/fwb.12686 [Google Scholar]
- Liu Z, Cheng R, Xiao W, Guo Q, Wang N. Effect of Off-Season Flooding on Growth, Photosynthesis, Carbohydrate Partitioning, and Nutrient Uptake in Distylium chinense. PLoS ONE 2014, 9, e107636. DOI:10.1371/journal.pone.0107636 [Google Scholar]
- Li ZJ, Fan DY, Chen FQ, Yuan QY, Chow WS, Xie ZQ. Physiological integration enhanced the tolerance of Cynodon dactylon to flooding. Plant Biol. J. 2015, 17, 459–465. DOI:10.1111/plb.12254 [Google Scholar]