
Fine-Scale Taxonomic and Functional Diversity Patterns Inform Within-Site Sampling Strategies for Benthic Macroinvertebrates in an Alpine Stream

Fine-Scale Taxonomic and Functional Diversity Patterns Inform Within-Site Sampling Strategies for Benthic Macroinvertebrates in an Alpine Stream
Zhen Tian 1,2,3,4 Xianfu Li 1,3,4 Lu Tan 2 Lu Yang 1,3,4 Xiaoling Deng 5,6 Ronglong Yang 1,3,4 Qinghua Cai 2 Shuoran Liu 1,3,4,* Wen Xiao 1,3,4,*
Received: 01 June 2026 Revised: 07 July 2026 Accepted: 27 July 2026 Published: 31 July 2026

© 2026 The authors. This is an open access article under the Creative Commons Attribution 4.0 International License (https://creativecommons.org/licenses/by/4.0/).
1. Introduction
Benthic macroinvertebrates are integral to running-water ecosystems and are widely used in stream biomonitoring because their assemblages integrate the effects of local habitat, water quality, and hydrological conditions over ecologically relevant timescales [1,2]. Responses to disturbance are reflected in taxonomic composition, abundance, biological traits, and functional organization. Reliable interpretation depends not only on taxonomic resolution and metric selection but also on sampling design. Within-site replication and sample placement determine the likelihood of detecting the local taxon pool, estimating richness accurately, and comparing biological condition among sites [3,4,5]. These considerations are particularly important when surveys seek to characterize biodiversity or local assemblage structure rather than merely classify broad ecological status.
Alpine and headwater streams are particularly sensitive to sampling design because their physical conditions can vary over short distances. Narrow channels, steep gradients, coarse substrates, shallow riffles, depositional patches, and localized retention of organic matter form heterogeneous microhabitat mosaics. Local habitat filtering interacts with drift, dispersal limitation, and dendritic network connectivity [6,7,8], producing assemblage variation among riffles, patches, and short sections of the same stream [9,10,11]. An approximately 100 m reach used to represent a conventional sampling site may therefore encompass substantial internal heterogeneity. Because physical microhabitat variables were not measured at every sampling point, the observed biological patterns indicate fine-scale spatial structure but cannot be attributed quantitatively to individual habitat drivers.
Fine-scale community structure should be evaluated in both taxonomic and functional dimensions. Taxonomic beta diversity quantifies compositional differences among assemblages and can be partitioned into turnover and nestedness components [12,13]. Functional beta diversity examines whether taxonomic differences are accompanied by changes in trait composition [14]. Taxonomic replacement need not produce equivalent functional replacement because distinct taxa may share feeding modes, habitat-use strategies, life-history attributes, or other ecological roles [15]. Studies of riverine and mountain-stream macroinvertebrates likewise show that taxonomic and functional diversity may respond differently to environmental and spatial processes [16,17].
These ecological patterns have direct implications for within-site sampling. Routine stream surveys generally distribute several Surber- or kick-net replicates across a representative reach, and five replicates are often used to balance field effort, standardization, and comparability [3,4,5]. This level of replication may be inadequate where substrate, current, depth, and organic-matter patches vary over only a few metres. Sampling-curve and habitat-scale studies have shown that incomplete sampling can bias richness estimates, trait-based interpretation, and bioassessment outcomes [5,18,19,20]. Here, microhabitat-stratified allocation refers to distributing replicates among the principal substrate sizes, flow conditions, depositional patches, and retained organic matter within a site, rather than concentrating effort in visually similar habitats.
We used a dense 10 m interval design along a 1 km reach of Qingbixi Stream to relate fine-scale diversity patterns to within-site sampling strategy. Specifically, we asked: (1) how do taxonomic and functional diversity vary among short sections of an alpine stream; (2) is taxonomic turnover accompanied by functional turnover, or is functional structure predominantly nested; and (3) how completely does a conventional five-replicate design represent the observed taxon pool within simulated 100 m sites? Taxonomic and functional beta-diversity partitioning, longitudinal distance-decay analysis, order-level composition, and within-site sampling simulations were combined to evaluate sampling requirements for alpine-stream benthic macroinvertebrates.
2. Materials and Methods
2.1. Study Design and Sample Processing
The study was conducted in the Qingbixi Stream on the eastern slope of Cangshan Mountain, in Dali, Yunnan Province, China. This perennial alpine stream originates between Malong Peak and Shengying Peak. Samples were collected from 20 to 25 August 2018 along a continuous 1 km reach at 2167–2291 m elevation. The channel was approximately 3–5 m wide, discharge was low, the entire reach was wadeable during sampling, and water depth did not exceed 1 m. The streambed consisted primarily of stones, cobbles, and gravel, interspersed with localized sand or finer sediment and retained organic matter. Riffles and runs predominated, with occasional shallow depositional patches. Because substrate particle-size proportions were not measured, these habitat descriptions are qualitative. No major tributary entered the study reach, and quantitative data on catchment disturbance were unavailable.
Ninety-nine quantitative sampling points were positioned at 10 m intervals along the longitudinal gradient. Each point constituted an independent spatial sampling unit rather than a repeated collection from the same quadrat. Samples were collected from the thalweg or main-current zone, rather than the channel margin, to minimize the influence of short-term water-level variation on nearshore benthic assemblages. The term replicate is used only in the within-site simulation, where it denotes a spatial sample included within a nominal 100 m site unit.
Benthic macroinvertebrates were sampled quantitatively with a Surber net covering 30 cm × 30 cm (0.09 m2) and fitted with a 250 μm. At each point, the frame was placed on the available substrate within the main flow, and stones, cobbles, gravel, and interstitial fine material inside the frame were disturbed and cleaned by hand. Most samples came from shallow riffle or run habitat; depositional material was included when it occurred at a main-flow sampling position. Dislodged organisms were carried by the current into the net and preserved in 75% ethanol.
In the laboratory, specimens were sorted and identified to the lowest reliable taxonomic level using standard references [2,21,22]. Of the 69 final taxonomic units, 61 were resolved to genus, species, or morphospecies; the remaining eight were retained at family, subfamily, order, or another practicable higher level because of specimen condition or limitations of the available keys. Taxon names were standardized, and the final sample-by-taxon abundance matrix was screened for empty samples, duplicate names, and spelling inconsistencies before analysis.
Physicochemical variables were measured at each sampling point. In situ measurements comprised water temperature, conductivity, total dissolved solids, salinity, dissolved oxygen, pH, and oxidation-reduction potential. Water samples were analyzed in the laboratory for total nitrogen, total phosphorus, ammonia nitrogen, nitrate nitrogen, phosphate phosphorus, dissolved organic carbon, and silicate. Associations between these variables and Shannon-Wiener diversity were evaluated using Spearman rank correlations with false discovery rate correction.
2.2. Diversity Analyses and Within-Site Sampling Simulation
Taxon richness and the Shannon-Wiener diversity index were calculated for each 10 m sample. For beta-diversity analysis, consecutive samples were aggregated without overlap into 20 sequential 50 m sections: the first 19 sections each contained five samples, and the terminal section contained the remaining four. Retaining the terminal section allowed all 99 samples to contribute to the analysis. A taxon was considered present in a section if it occurred in any constituent sample. The 50 m section length was selected a priori to balance fine longitudinal resolution with the need to include multiple Surber samples per section, consistent with the short-reach scales commonly used to examine stream-assemblage variability [9,11]. Sørensen dissimilarity and its turnover and nestedness components were calculated for all 190 section pairs [13]. The overall contribution of each component was calculated as its mean divided by the mean total Sørensen dissimilarity across the 190 comparisons. Accordingly, 70.9% represents the overall contribution across all section pairs, not a value for an individual upstream or downstream section.
Associations between Shannon-Wiener diversity and each measured physicochemical variable were tested using Spearman’s rank correlation, with false discovery rate adjustment across all tests. This analysis addressed measured water chemistry and in situ conditions but could not account for unmeasured microhabitat attributes, including current velocity, local depth, substrate particle size, embeddedness, and organic-matter retention.
Beta-diversity partitioning used presence-absence data because the analysis focused on taxon replacement among short sections rather than variation in absolute abundance. Abundance-weighted dissimilarity would provide complementary information and warrants future investigation. Spatial dependence among nearby sections was addressed through matrix-based distance-decay analysis: pairwise taxonomic Sørensen dissimilarity was related to pairwise longitudinal distance, and significance was assessed with a Mantel permutation test rather than by treating the 190 pairwise comparisons as independent observations [11,13].
Functional information was obtained from the Traits worksheet of the accompanying data table. We used eight categorical traits: swimming ability, attachment, body armoring, body shape, respiration, size at maturity, habit, and trophic group. These traits comprised 26 states represented in the dataset (Table 1). Trait categories and ecological interpretations followed standard aquatic-insect references and the trait framework for lotic insects [2,23]. Functional trait-state beta diversity was defined as variation among sections in the presence or absence of these coded ecological states.
Each taxon was assigned one integer-coded state for each trait and converted by one-hot encoding into a binary taxon-by-trait-state matrix. The Species_code/Morphospecies_label fields (sp1-sp69) provided exact matches between the Traits and Abundance worksheets, while the lowest reliable taxonomic name informed the initial assignment. Trait codes were complete for all 69 taxa, so no taxon was excluded. Three blank text labels in the body-armoring state column retained valid code 3, defined in the worksheet heading as none (soft-bodied forms); these codes were retained without imputing states from other taxa. Functional composition within each section was represented by the union of trait states carried by its constituent taxa, and functional Sørensen dissimilarity was partitioned into trait-state turnover and nestedness [14].
Table 1. Eight functional traits and the 26 categorical states are represented among the 69 taxa. Each taxon was assigned one integer-coded state per trait.
|
Trait |
States Represented in the Dataset (Integer Code: State) |
|---|---|
|
Swimming ability |
1: none; 2: weak; 3: strong |
|
Attachment |
1: none/free-living; 2: some/sessile or sedentary |
|
Body armoring |
1: poor (heavily sclerotized); 2: good (including cased forms); 3: none (soft-bodied forms) |
|
Body shape |
1: streamlined (flat or fusiform); 2: not streamlined (cylindrical, round, or bluff) |
|
Respiration |
1: tegument; 2: gills; 3: plastron or spiracular/aerial |
|
Size at maturity |
1: small (<9 mm); 2: medium (9–16 mm); 3: large (>16 mm) |
|
Habit |
1: burrow; 2: climb; 3: sprawl; 4: cling; 5: swim |
|
Trophic group |
1: collector-gatherer; 2: collector-filterer; 3: herbivore/scraper-piercer-shredder; 4: predator; 5: shredder (detritus) |
To assess the representativeness of conventional within-site sampling, the ordered sample series was divided into ten consecutive nominal 100 m site units. Units U1-U9 each comprised ten 10 m samples, whereas the terminal unit U10 comprised the remaining nine. The locally observed taxon pool for each unit was defined as the union of taxa recorded in all available samples. For each replication level from one to nine, all possible combinations of that number of spatial samples were enumerated within every unit. Results for ten replicates were calculated only for U1-U9 because U10 contained nine samples. The procedure used deterministic exhaustive enumeration rather than Monte Carlo resampling: replicate number denotes the number of spatial Surber samples included in a simulated survey, not the number of simulation iterations [5,20,24].
For each sample combination, detection completeness was calculated as detected richness divided by the locally observed taxon pool of the corresponding unit. Combination-level estimates were averaged within units and then summarized as the mean and standard deviation across eligible units. Mean completeness (mean ± SD) was 82.87% ± 3.53% with five replicates, 87.42% ± 2.90% with six, and 94.61% ± 1.66% with eight. The 100% value for ten replicates applies only to the nine complete units. Marginal gain was defined as the difference in mean detected richness between adjacent replication levels.
Sampling recommendations were derived descriptively from the observed detection curve and were linked to survey objectives rather than a universal completeness threshold. Five replicates represented the conventional baseline, six to eight an intermediate increase in effort, and eight to ten replicates or explicit microhabitat stratification a high-completeness design.
All analyses were performed in R 4.5.1. Values reported in the text, tables, and figures were verified against the Environment, Abundance, and Traits worksheets.
3. Results
3.1. Community Composition and Environmental Variation
The 99 quantitative samples contained 69 benthic macroinvertebrate taxa and 15,034 individuals. Ephemeroptera was numerically dominant, followed by Diptera, Trichoptera, Coleoptera, and Plecoptera; all remaining orders together accounted for 2.02% of individuals (Table 2).
Table 2. Order-level composition of the 69 taxa and 15,034 individuals recorded in 99 quantitative samples.
|
Order |
Number of Taxa |
Individuals |
Relative Abundance (%) |
|---|---|---|---|
|
Ephemeroptera |
17 |
10,231 |
68.05 |
|
Diptera |
13 |
2491 |
16.57 |
|
Trichoptera |
13 |
961 |
6.39 |
|
Coleoptera |
8 |
815 |
5.42 |
|
Plecoptera |
6 |
233 |
1.55 |
|
Others |
12 |
303 |
2.02 |
After false discovery rate correction, Shannon-Wiener diversity was not significantly associated with any measured physicochemical variable (Table 3). Dissolved-oxygen saturation showed the strongest unadjusted association (Spearman rho = −0.264, p = 0.008, adjusted p = 0.133).
Table 3. Physicochemical variables measured at 99 sampling points and their Spearman correlations with Shannon-Wiener diversity. Adjusted p-values were calculated using false discovery rate correction.
|
Variable (Unit) |
Mean |
SD |
Min |
Max |
Spearman rho |
p |
Adjusted p |
|---|---|---|---|---|---|---|---|
|
TN (mg·L−1) |
0.23 |
0.03 |
0.08 |
0.32 |
−0.081 |
0.428 |
0.760 |
|
NO3-N (mg·L−1) |
0.18 |
0.03 |
0.05 |
0.25 |
−0.053 |
0.601 |
0.823 |
|
NH3-N (mg·L−1) |
0.04 |
0.01 |
0.02 |
0.11 |
0.051 |
0.618 |
0.823 |
|
TP (mg·L−1) |
0.02 |
0.00 |
0.01 |
0.04 |
0.035 |
0.728 |
0.832 |
|
PO4-P (mg·L−1) |
0.02 |
0.00 |
0.01 |
0.04 |
0.002 |
0.983 |
0.983 |
|
Si (mg·L−1) |
4.47 |
0.80 |
2.68 |
6.56 |
0.116 |
0.255 |
0.582 |
|
DOC (mg·L−1) |
2.80 |
1.33 |
0.64 |
6.30 |
−0.028 |
0.780 |
0.832 |
|
Chla (microgram·L−1) |
0.60 |
0.55 |
0.06 |
2.69 |
0.055 |
0.587 |
0.823 |
|
Conductivity (microS·cm−1) |
49.31 |
9.58 |
26.00 |
56.80 |
0.119 |
0.240 |
0.582 |
|
Salinity (dimensionless) |
0.03 |
0.00 |
0.01 |
0.03 |
0.161 |
0.112 |
0.582 |
|
TDS (mg·L−1) |
40.65 |
7.50 |
22.10 |
46.15 |
0.178 |
0.078 |
0.582 |
|
Water temperature (°C) |
14.03 |
0.78 |
12.80 |
19.90 |
−0.119 |
0.242 |
0.582 |
|
DO (mg·L−1) |
7.13 |
0.15 |
6.60 |
7.52 |
−0.093 |
0.358 |
0.715 |
|
DO saturation (%) |
68.84 |
2.06 |
55.50 |
72.60 |
−0.264 |
0.008 |
0.133 |
|
pH (dimensionless) |
7.44 |
0.26 |
6.88 |
7.86 |
−0.031 |
0.758 |
0.832 |
|
ORP (mV) |
144.57 |
47.61 |
68.00 |
202.70 |
0.145 |
0.151 |
0.582 |
3.2. Fine-Scale Taxonomic and Functional Diversity Patterns
Across the 190 pairwise comparisons among 20 sequential 50 m sections, mean total taxonomic Sørensen dissimilarity was 0.227 ± 0.048. Mean turnover and nestedness were 0.161 and 0.066, respectively; turnover therefore accounted for 70.9% of mean total taxonomic beta diversity and nestedness for 29.1% (Figure 1). These percentages summarize all section pairs and are not attributable to individual longitudinal sections.
Functional trait-state beta diversity exhibited the reverse component structure. Mean total pairwise functional dissimilarity was 0.018 ± 0.015, comprising a mean turnover of 0.00066 and mean nestedness of 0.01709. Turnover and nestedness consequently accounted for 3.7% and 96.3%, respectively (Figure 1), indicating that trait-state sets in less functionally rich sections were largely subsets of those in richer sections.
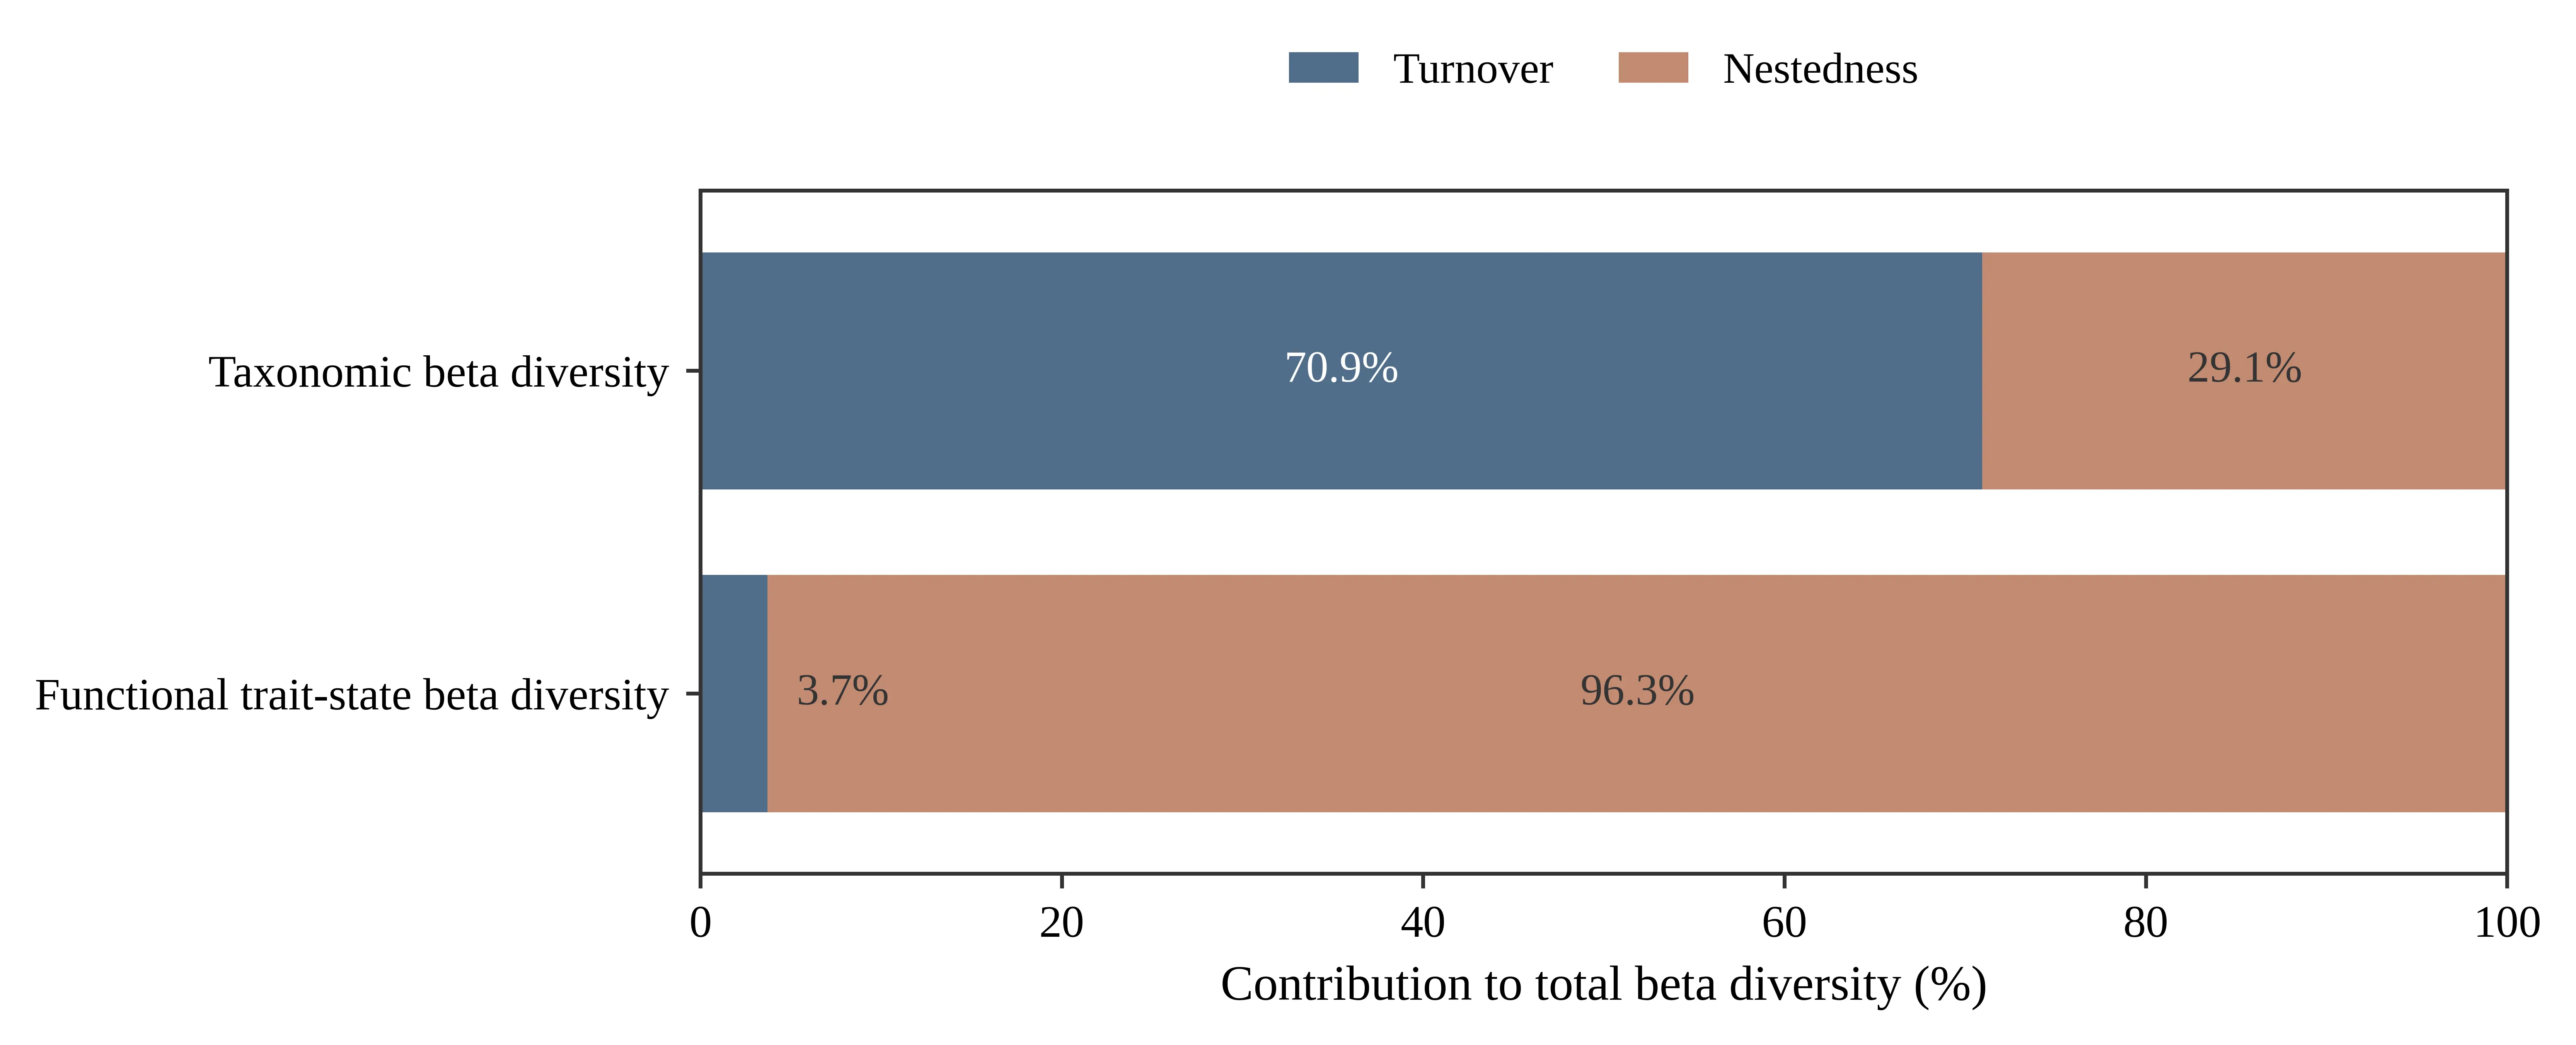
Figure 1. Relative contributions of turnover and nestedness to taxonomic and functional trait-state beta diversity among 20 sequential 50 m sections. Each bar represents the mean component divided by the mean total Sørensen dissimilarity across all 190 pairwise comparisons; the two components sum to 100% within each diversity facet. Error bars are not shown; mean total dissimilarity ± SD is reported in the text.
Taxonomic dissimilarity increased weakly with longitudinal distance among the 50 m sections (Mantel r = 0.227, p = 0.010; Figure 2). Order-level composition was broadly consistent among the ten simulated nominal 100 m site units, with Ephemeroptera, Diptera, Trichoptera, Coleoptera, and Plecoptera comprising the dominant groups (Figure 3).
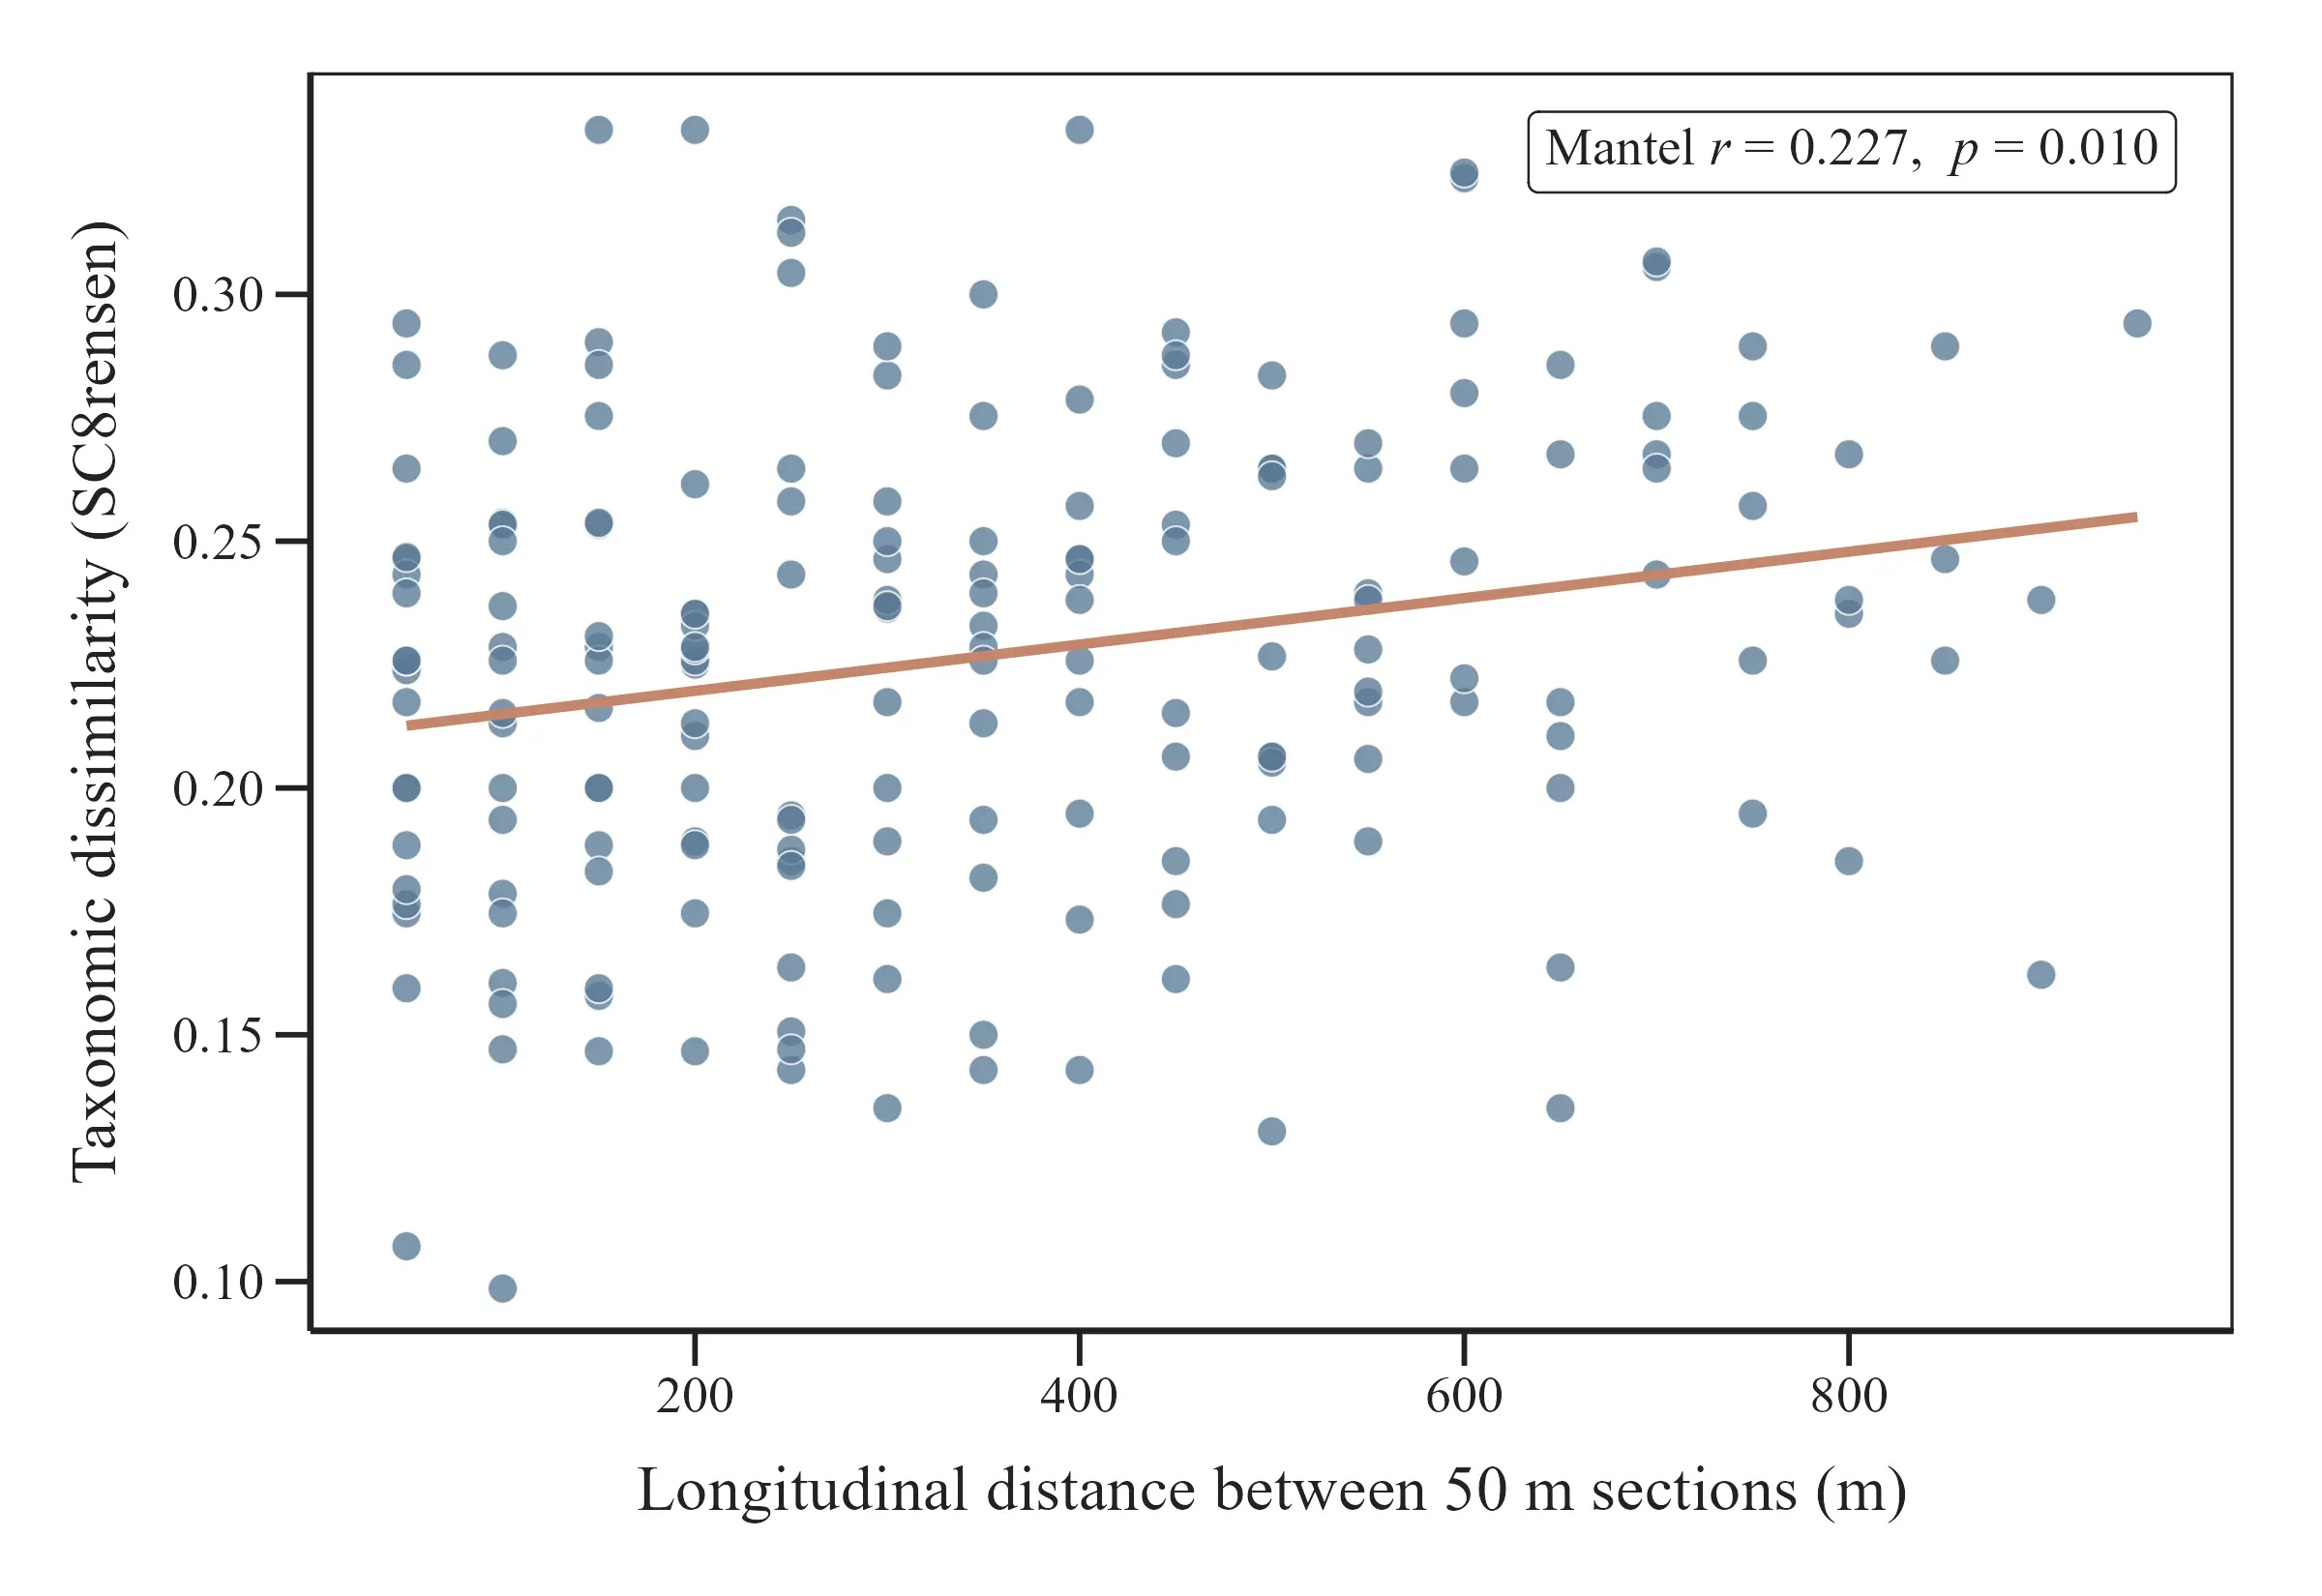
Figure 2. Relationship between taxonomic Sørensen dissimilarity and longitudinal distance for 190 pairwise comparisons among 20 sequential 50 m sections. Points represent section pairs, and the line indicates the fitted trend. Matrix association was evaluated using a Mantel permutation test (r = 0.227, p = 0.010).
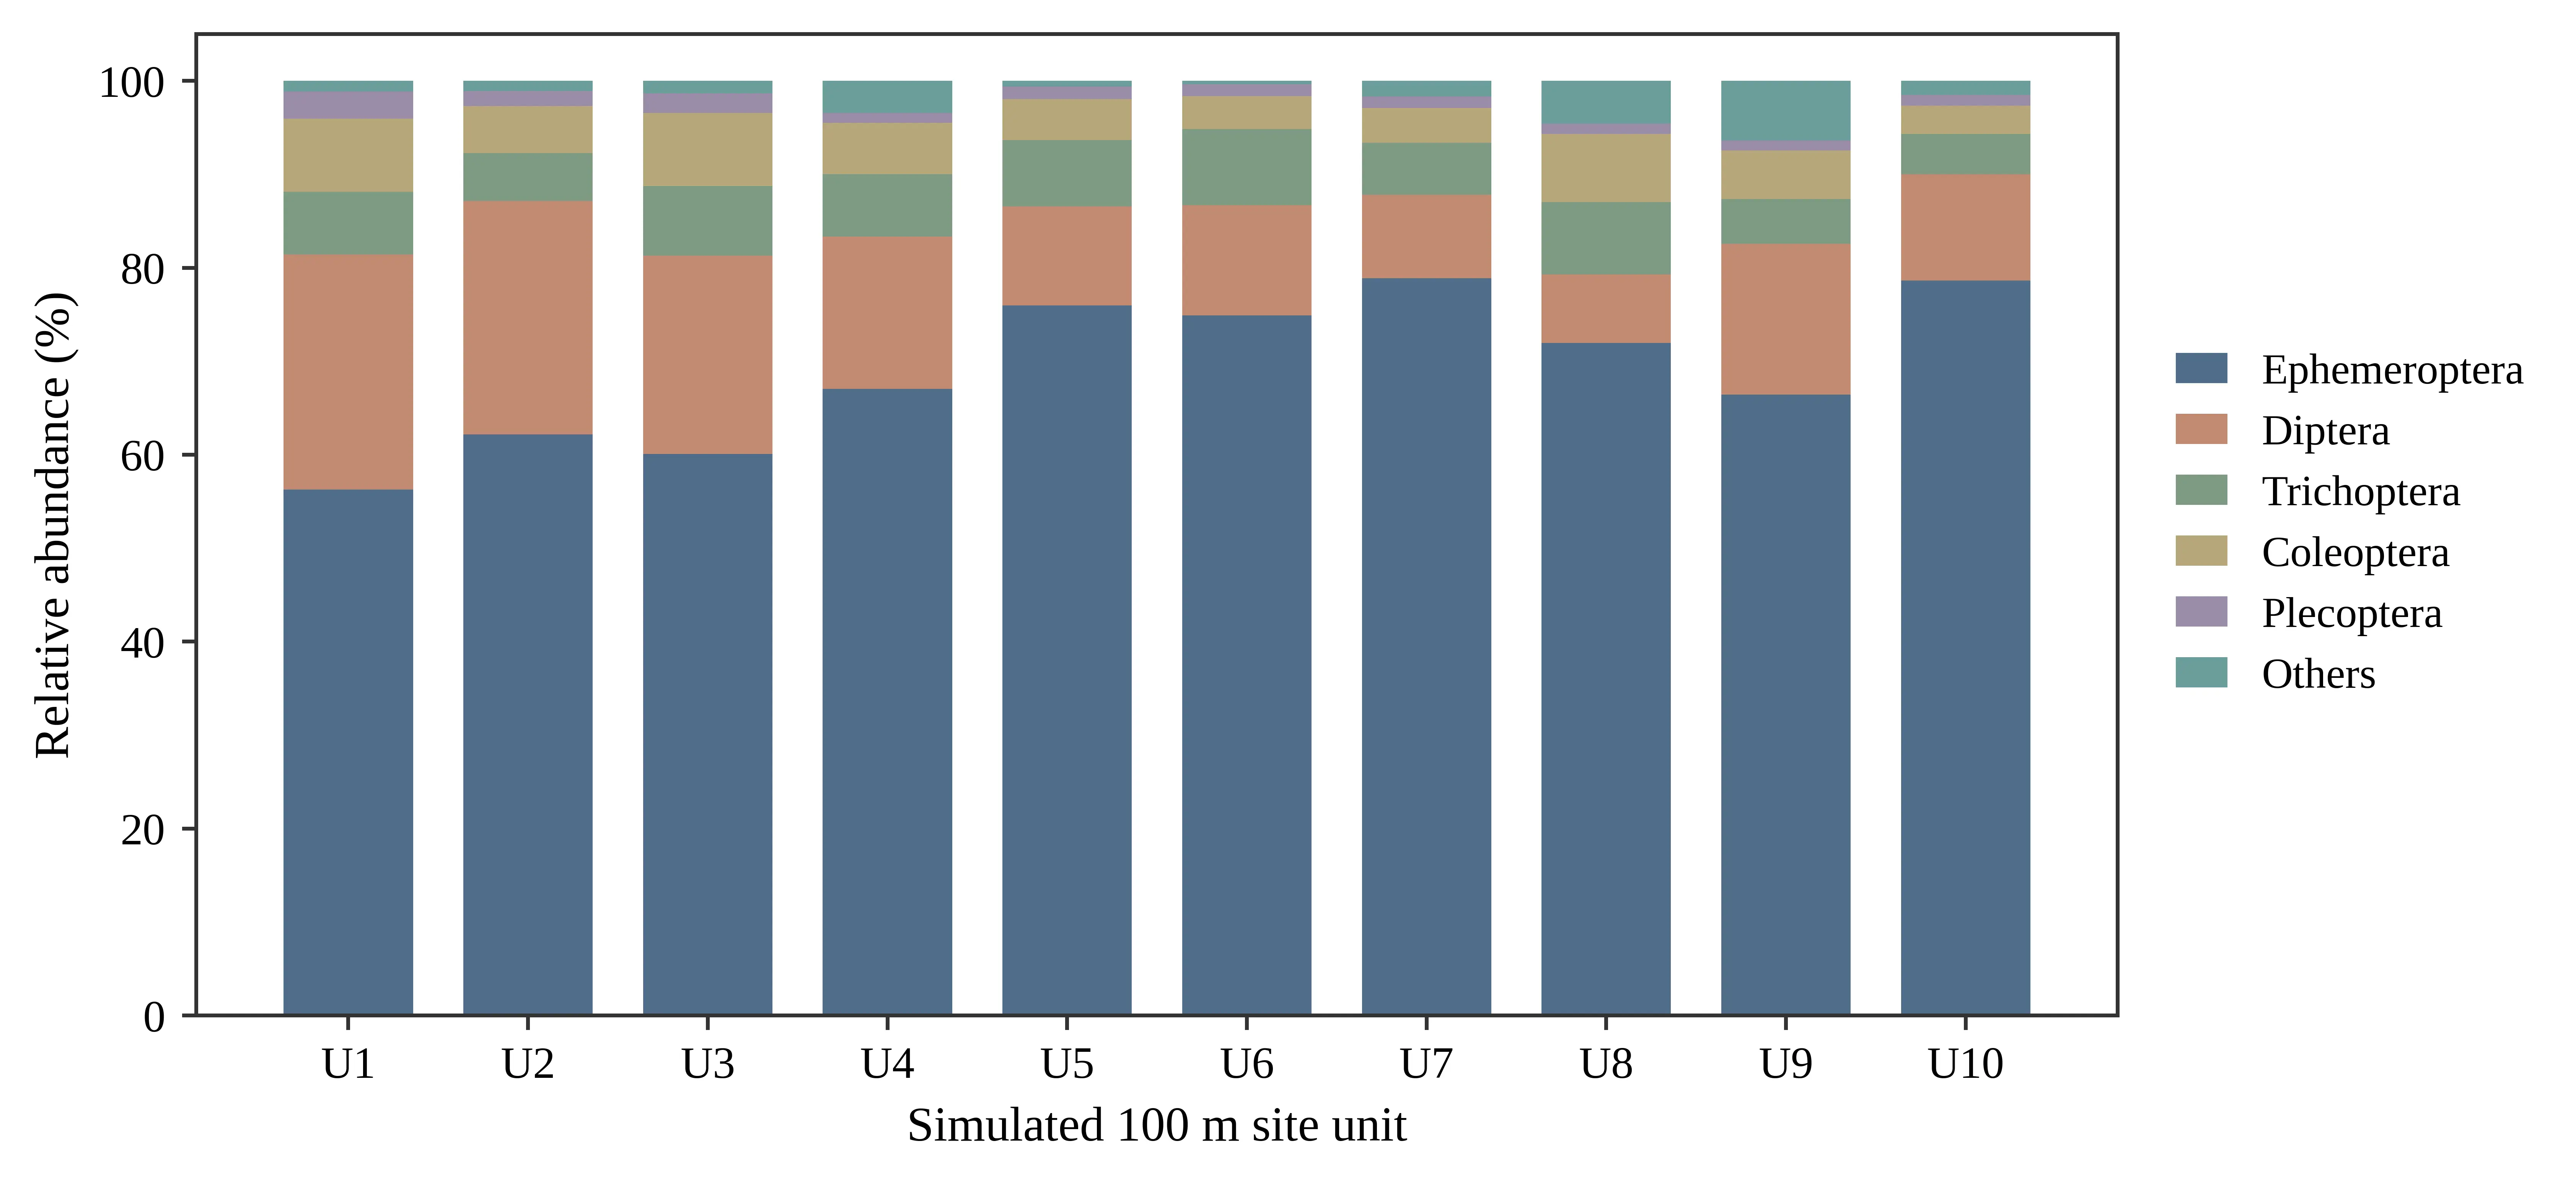
Figure 3. Order-level relative abundance in ten consecutive nominal 100 m site units along the 1 km reach. Units U1-U9 each contain ten 10 m samples, whereas terminal unit U10 contains nine; each stacked bar sums to 100%.
3.3. Within-Site Sampling Representativeness
Taxon detection increased with spatial replication across the ten simulated nominal 100 m site units (Figure 4). Mean completeness was 42.3% with one replicate, 70.0% with three, 82.9% with five, 87.4% with six, and 94.6% with eight.
Marginal gains declined but remained positive as replication increased. The sixth, seventh, and eighth replicates added an average of 1.93, 1.64, and 1.42 taxa, respectively. Nine replicates detected an average of 97.6% of the locally observed pool; ten replicates achieved 100% in the nine complete units.
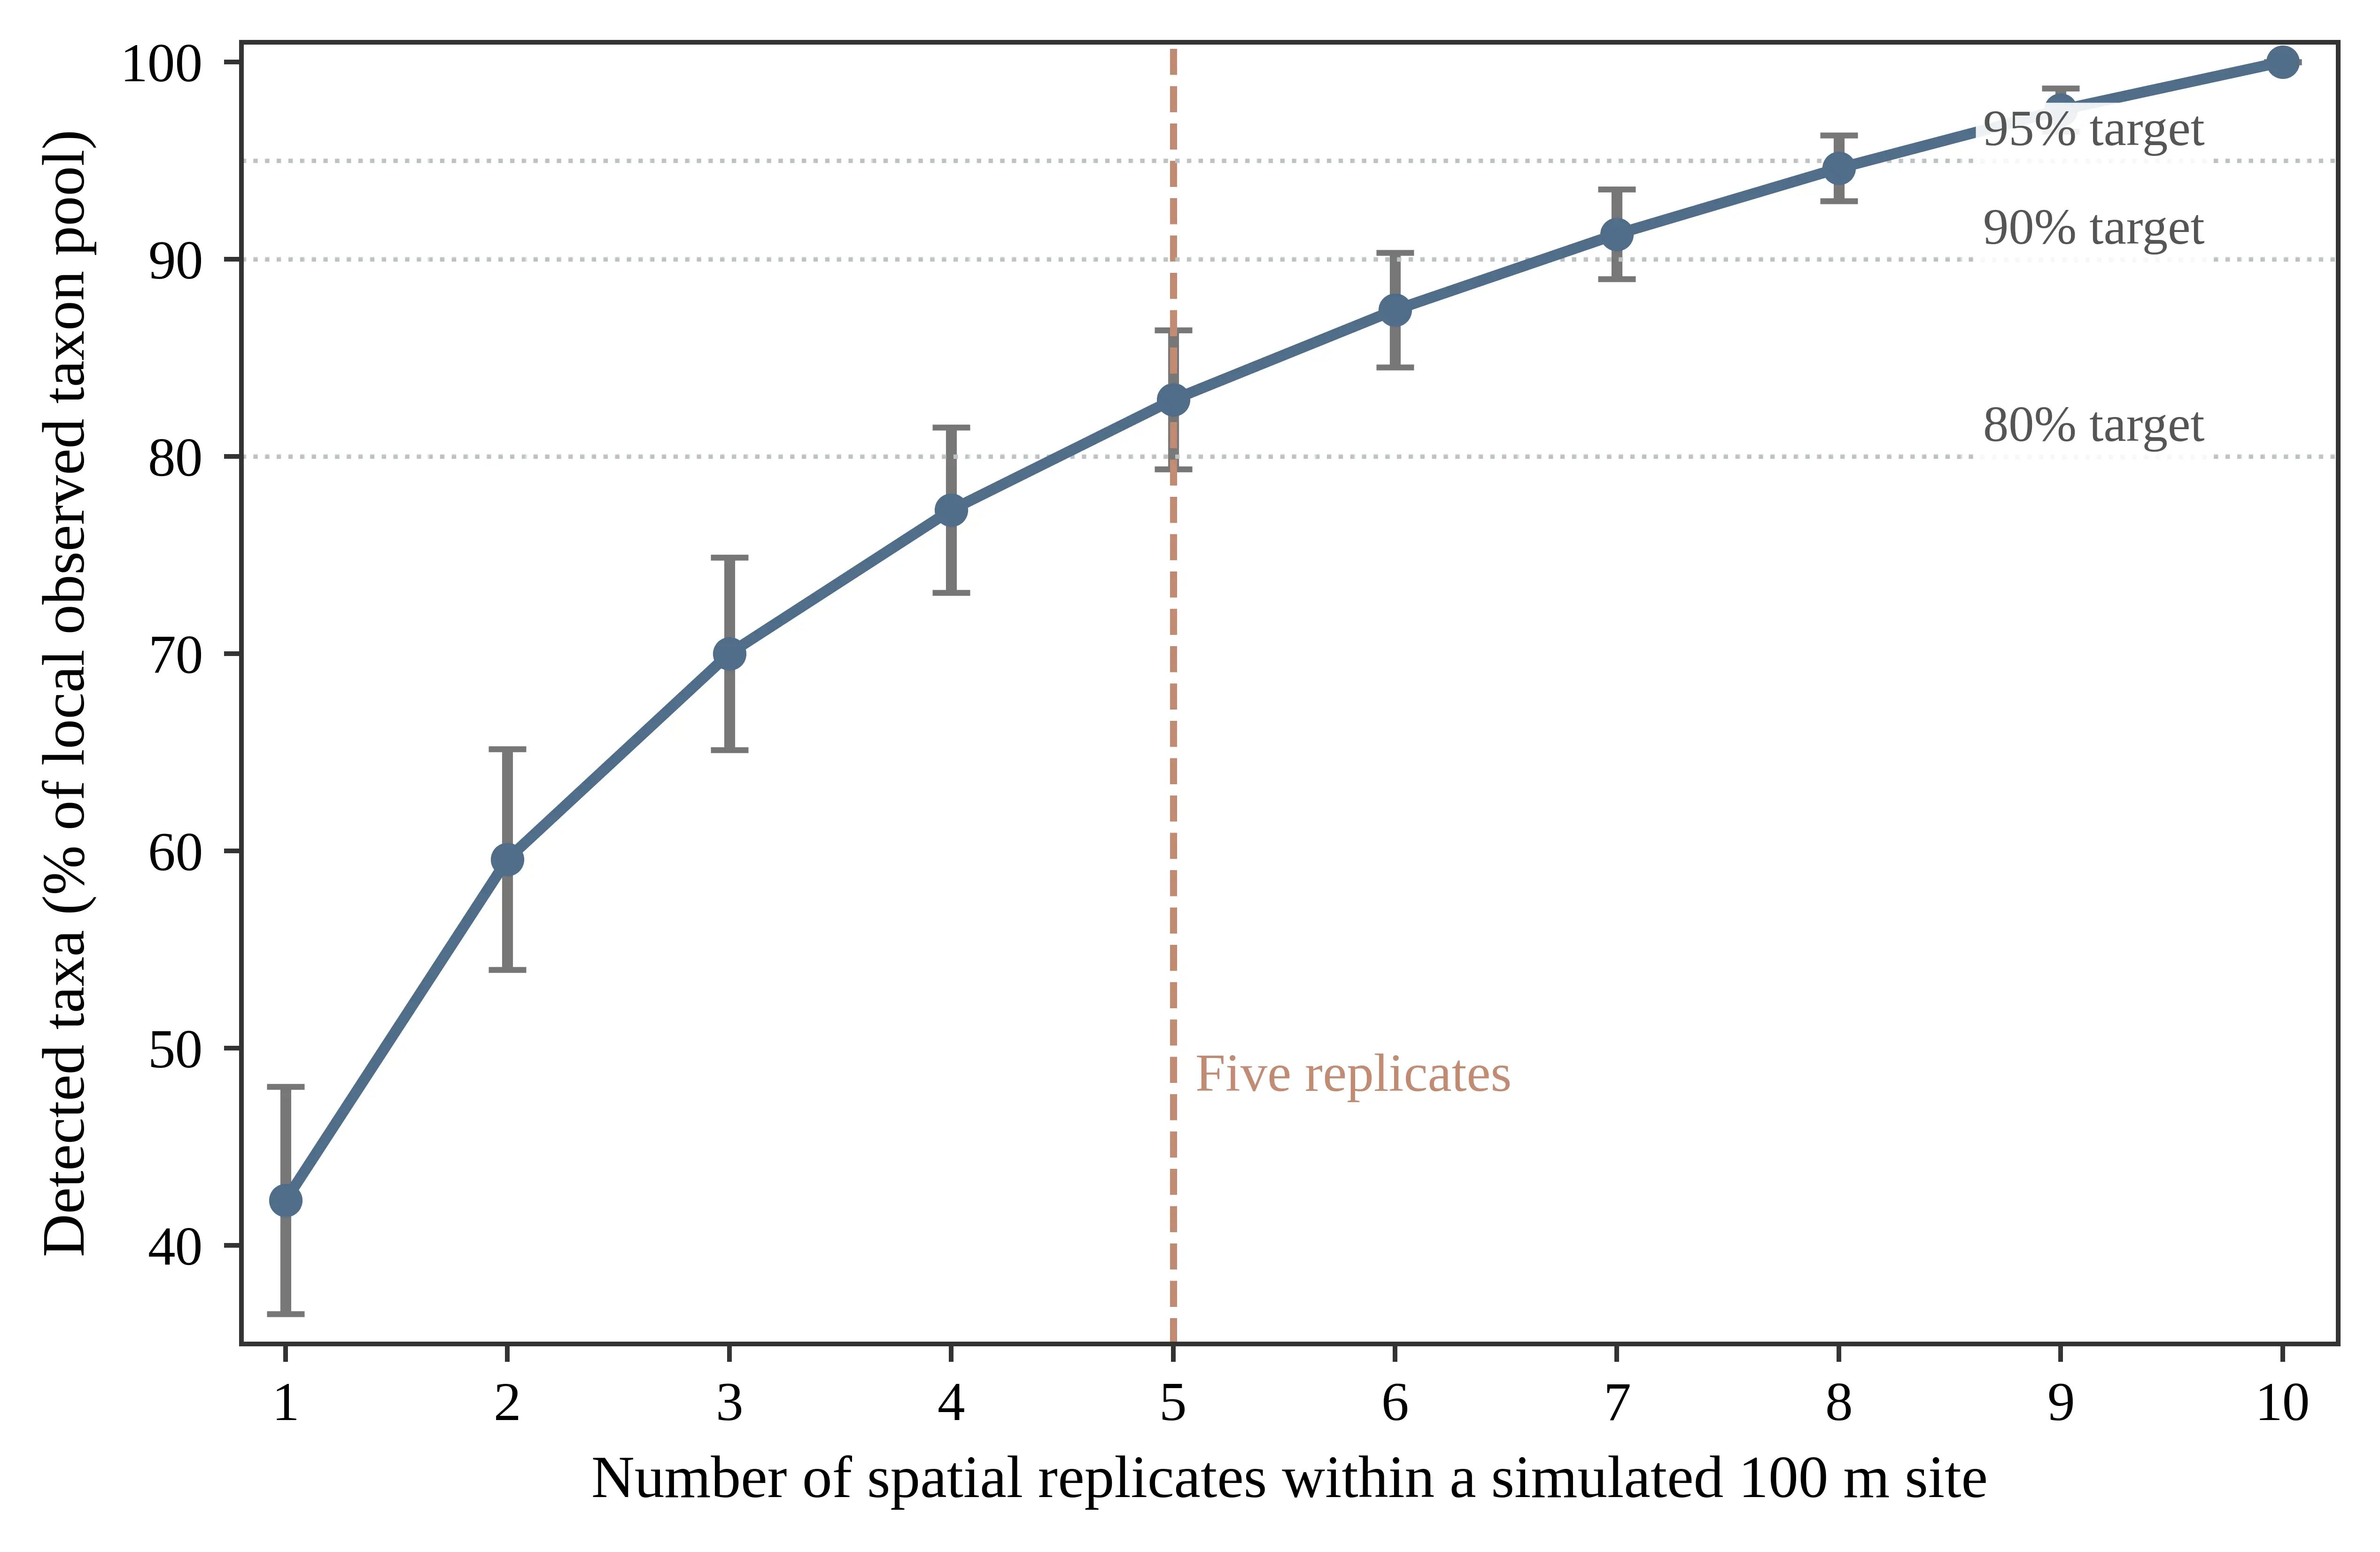
Figure 4. Taxon-detection completeness with increasing within-site replication in ten simulated nominal 100 m site units. Points and the line represent mean completeness across units; error bars denote ± 1 SD. Values for one to nine replicates are based on ten units, whereas the ten-replicate estimate is based on the nine complete units. The vertical dashed line marks the five-replicate baseline, and horizontal guides indicate 80%, 90%, and 95% completeness.
4. Discussion
4.1. Fine-Scale Diversity Patterns and Taxonomic-Functional Decoupling
Taxonomic composition varied appreciably among short sections of Qingbixi Stream despite their location within a continuous 1 km reach. This result accords with patch-scale variation reported for stream macroinvertebrate assemblages and with the influence of substrate and fine-sediment mosaics [9,10,11,18,19]. The weak but significant distance-decay relationship further indicates a modest longitudinal component. In headwater channels, local habitat filtering may interact with limited upstream dispersal, downstream drift, and dendritic connectivity to generate such spatial structure [6,7,8,10]. Restricting sampling to the main current reduced sensitivity to shifting channel margins but did not eliminate heterogeneity among benthic patches. These short-reach patterns also support a watershed-ecology perspective that links local biotic variation to nested spatial processes and watershed-scale conservation [25,26,27].
The predominance of taxonomic turnover contrasted sharply with the nested structure of functional trait states. Comparable decoupling between diversity facets has been observed when taxonomic and functional composition respond differently to environmental and spatial processes [14,16,17]. Functional redundancy offers a likely explanation: taxonomically distinct organisms may share feeding, locomotor, respiratory, body-form, or habitat-use traits [15]. Taxonomic turnover should therefore not be assumed to represent an equivalent change in broad functional composition.
The 96.3% contribution of nestedness indicates that sections with fewer trait states generally contained subsets of the states recorded in functionally richer sections, rather than distinct sets of states. This result does not imply functional invariance; instead, replacement among the 26 categorical states was limited relative to replacement of taxonomic identities at the resolution analyzed.
This contrast defines the scope of the sampling recommendations. Moderate replication may capture broad trait-state composition relatively efficiently, whereas biodiversity inventories, richness estimation, and taxonomic beta-diversity analysis require more extensive spatial coverage. Taxonomic and functional metrics thus provide complementary information and are most informative when interpreted together.
4.2. Implications for Single-Site Sampling in Alpine Streams
The simulation directly evaluated a common within-site sampling design. Five replicates detected an average of 82.9% ± 3.5% of the locally observed taxon pool, supporting their use as a practical baseline when standardization and field efficiency are priorities [3,4]. Detection nevertheless continued to increase beyond five replicates, so this baseline should not be regarded as universally optimal. Similar effects of sample size on richness and bioassessment have been reported elsewhere [5,20].
The trade-off between effort and information was clear: the sixth, seventh, and eighth samples added an average of 1.93, 1.64, and 1.42 taxa, raising completeness to 87.4%, 91.3%, and 94.6%, respectively. Because substrate composition and fine-sediment fractions can influence taxonomic and functional diversity at habitat scales [18,19], additional replicates should, where possible, be distributed among major substrate, flow, depositional, and organic-matter patches within the main channel rather than concentrated in similar riffles.
Sampling intensity should be aligned with survey objectives (Table 4). Five replicates provide a feasible baseline for routine assessment; six to eight improve general community characterization; and eight to ten, or explicit microhabitat stratification, are preferable for inventories and conservation assessments. For fine-scale taxonomic or functional beta-diversity analysis, replicate-level data should be retained because complete compositing removes within-site spatial information.
Table 4. Objective-specific within-site sampling strategies derived from the simulated nominal 100 m units.
|
Survey Objective |
Recommended Within-Site Strategy |
Rationale |
|---|---|---|
|
Routine ecological assessment |
Five Surber net replicates within a nominal 100 m reach |
A feasible, standardized baseline; mean completeness was 82.9% in this study. |
|
General community diversity survey |
Six to eight replicates when resources permit |
Mean completeness increased to 87.4–94.6%, with diminishing marginal gains. |
|
Biodiversity inventory or conservation assessment |
Eight to ten replicates or microhabitat-stratified allocation |
Improves completeness and coverage of spatially restricted taxa. |
|
Fine-scale beta or functional diversity analysis |
Retain replicate-level spatial information; avoid full compositing |
Preserves the spatial information needed to quantify within-site heterogeneity and relate taxa or traits to microhabitats. |
4.3. Limitations and Future Directions
The dense, standardized survey provides internally consistent evidence for calibrating within-site sampling in a small alpine stream, but its inference is bounded by a single August survey of one reach. Macroinvertebrate occurrence and detectability vary with hydrology, emergence, recruitment, and seasonal habitat conditions [19]. The reported values should therefore be treated as empirical benchmarks for comparable small, shallow, wadeable streams under similar seasonal conditions rather than fixed thresholds for all alpine streams.
Physical microhabitat variables were not quantified at every 10 m sampling point. Although sampling in the thalweg or main-current zone reduced confounding from short-term water-level fluctuations at channel margins, the design cannot separate the effects of current velocity, depth, substrate size, embeddedness, organic matter, and longitudinal position. Detection curves and beta-diversity components may differ in wider, low-gradient, sand-bed, intermittent, or strongly disturbed streams [16,17,18,19]. These limitations constrain extrapolation beyond comparable systems but do not affect the internal comparisons based on a consistent sampling gear and protocol.
Trait-based inference was further limited by categorical resolution and by above-species-level assignments for some taxa. Although complete eight-trait codes were available for all 69 taxa, finer trait databases, life-stage-specific information, and abundance-weighted functional analyses could reveal additional structure [23,28,29]. In addition, simulation completeness was measured against the taxon pool observed within each nominal 100 m unit rather than an estimate that included undetected taxa. The resulting recommendations are therefore objective-specific guidance, not universal guarantees of sampling completeness.
5. Conclusions
Dense sampling at 10 m intervals in Qingbixi Stream recorded 69 taxa and 15,034 individuals and revealed pronounced taxonomic variation at fine spatial scales. Across 20 sequential 50 m sections, turnover accounted for 70.9% of mean total taxonomic beta diversity, whereas nestedness accounted for 96.3% of mean total functional trait-state beta diversity. Taxonomic replacement within the reach was therefore not matched by equivalent replacement among the 26 broad ecological trait states.
Across ten simulated nominal 100 m units, five, six, and eight spatial replicates detected an average of 82.9%, 87.4%, and 94.6% of the locally observed taxon pool, respectively. Five replicates provide a defensible baseline for routine assessment; six to eight improve general community coverage; and eight to ten, or microhabitat-stratified allocation, are preferable when high taxonomic completeness is required. These recommendations apply most directly to small, wadeable alpine streams sampled under comparable seasonal conditions.
Statement of the Use of Generative AI and AI-Assisted Technologies in the Writing Process
The original manuscript was prepared before generative artificial intelligence tools became widely available. During subsequent language revision, GPT was used solely to check English grammar and improve linguistic expression. No AI tools were involved in the study design, data collection, data analysis, interpretation of results, or formulation of scientific conclusions. All authors reviewed and approved the final manuscript and take full responsibility for its content.
Author Contributions
Conceptualization, Z.T., S.L. and W.X.; Methodology, Z.T., L.T., S.L. and W.X.; Software, Z.T.; Validation, X.L., L.T., S.L. and W.X.; Formal analysis, Z.T.; Investigation, Z.T., X.L., L.T., L.Y., X.D. and R.Y.; Resources, S.L. and W.X.; Data curation, Z.T., X.L. and L.Y.; Writing—original draft preparation, Z.T.; Writing—review and editing, all authors; Visualization, Z.T.; Supervision, Q.C., S.L. and W.X.; Project administration, S.L. and W.X.; Funding acquisition, S.L. and W.X. All authors have read and agreed to the published version of the manuscript.
Ethics Statement
Ethical review and approval were not required for this study because it involved field sampling of benthic macroinvertebrates and did not involve humans or vertebrate animals.
Informed Consent Statement
Not applicable.
Data Availability Statement
The data supporting the findings of this study are available from the corresponding author upon reasonable request.
Funding
This research received no external funding.
Declaration of Competing Interest
The authors declare no known competing financial interests or personal relationships that could have influenced the work reported in this paper.
References
-
Bonada N, Prat N, Resh VH, Statzner B. Developments aquatic insect biomonitoring: A comparative analysis of recent approaches. Annu. Rev. Entomol. 2006, 51, 495–523. DOI:10.1146/annurev.ento.51.110104.151124 [Google Scholar]
-
Merritt RW, Cummins KW, Berg MB. An Introduction to the Aquatic Insects of North America, 4th ed.; Kendall/Hunt Publishing Company: Dubuque, IA, USA, 2008. [Google Scholar]
-
Barbour MT, Gerritsen J, Snyder BD, Stribling JB. Rapid Bioassessment Protocols for Use in Streams and Wadeable Rivers: Periphyton, Benthic Macroinvertebrates and Fish, 2nd ed.; EPA 841-B-99-002; U.S. Environmental Protection Agency: Washington, DC, USA, 1999. [Google Scholar]
-
Carter JL, Resh VH. After site selection and before data analysis: Sampling, sorting, and laboratory procedures used in stream benthic macroinvertebrate monitoring programs by USA state agencies. J. N. Am. Benthol. Soc. 2001, 20, 658–682. DOI:10.2307/1468095. [Google Scholar]
-
James A, Pence R, Pond G, Schoenholtz S, Timpano A, Zipper C, Entrekin S. Taxon and trait-based sampling curves can be used as a tool for assessing impairment in salinized headwater streams. Ecol. Indic. 2022, 139, 108942. DOI:10.1016/j.ecolind.2022.108942 [Google Scholar]
-
Richardson JS, Danehy RJ. A synthesis of the ecology of headwater streams and their riparian zones in temperate forests. For. Sci. 2007, 53, 131–147. DOI:10.1093/forestscience/53.2.131 [Google Scholar]
-
Fagan WF. Connectivity, fragmentation, and extinction risk in dendritic metapopulations. Ecology 2002, 83, 3243–3249. DOI:10.1890/0012-9658(2002)083[3243:CFAERI]2.0.CO;2 [Google Scholar]
-
Finn DS, Poff NL. Examining spatial concordance of genetic and species diversity patterns to evaluate the role of dispersal limitation in structuring headwater metacommunities. J. N. Am. Benthol. Soc. 2011, 30, 273–283. DOI:10.1899/10-035.1 [Google Scholar]
-
Heino J, Louhi P, Muotka T. Identifying the scales of variability in stream macroinvertebrate abundance, functional composition and assemblage structure. Freshw. Biol. 2004, 49, 1230–1239. DOI:10.1111/j.1365-2427.2004.01259.x [Google Scholar]
-
Brown BL, Swan CM. Dendritic network structure constrains metacommunity properties in riverine ecosystems. J. Anim. Ecol. 2010, 79, 571–580. DOI:10.1111/j.1365-2656.2010.01668.x [Google Scholar]
-
Soininen J. Spatial structure in ecological communities: A quantitative analysis. Oikos 2016, 125, 160–166. DOI:10.1111/oik.02241 [Google Scholar]
-
Anderson MJ, Crist TO, Chase JM, Vellend M, Inouye BD, Freestone AL, et al. Navigating the multiple meanings of beta diversity: a roadmap for the practicing ecologist. Ecol. Lett. 2011, 14, 19–28. DOI:10.1111/j.1461-0248.2010.01552.x. [Google Scholar]
-
Baselga A. Partitioning the turnover and nestedness components of beta diversity. Glob. Ecol. Biogeogr. 2010, 19, 134–143. DOI:10.1111/j.1466-8238.2009.00490.x [Google Scholar]
-
Villéger S, Grenouillet G, Brosse S. Decomposing functional beta-diversity reveals that low functional beta-diversity is driven by low functional turnover in European fish assemblages. Glob. Ecol. Biogeogr. 2013, 22, 671–681. DOI:10.1111/geb.12021 [Google Scholar]
-
Rosenfeld JS. Functional redundancy in ecology and conservation. Oikos 2002, 98, 156–162. DOI:10.1034/j.1600-0706.2002.980116.x [Google Scholar]
-
Li J, Ma M, Wang L, Jin Y, Liu Y, Yin X, et al. Ecological drivers of taxonomic, functional, and phylogenetic beta diversity of macroinvertebrates in Wei River Basin of northwest China. Front. Ecol. Evol. 2024, 12, 1410915. DOI:10.3389/fevo.2024.1410915 [Google Scholar]
-
Li S, Wang X, Tan L, Cai Q. Exploring the drivers influencing multidimensional alpha and beta diversity of macroinvertebrates in mountain streams. Water 2024, 16, 2915. DOI:10.3390/w16202915 [Google Scholar]
-
Mathers KL, Armitage PD, Hill M, Bickerton M, McKenzie M, Pardo I, et al. Context specific effects of substrate composition on the taxonomic and functional diversity of macroinvertebrate communities in temperate lowland streams. Ecol. Evol. 2024, 14, e70034. DOI:10.1002/ece3.70034 [Google Scholar]
-
Mathers KL, Armitage PD, Hill M, McKenzie M, Pardo I, Wood PJ. Seasonal variability of lotic macroinvertebrate communities at the habitat scale demonstrates the value of discriminating fine sediment fractions in ecological assessments. Ecol. Evol. 2023, 13, e10564. DOI:10.1002/ece3.10564 [Google Scholar]
-
Vlek HE, Šporka F, Krno I. Influence of macroinvertebrate sample size on bioassessment of streams. Hydrobiologia 2006, 566, 523–542. DOI:10.1007/s10750-006-0074-7 [Google Scholar]
-
Morse JC, Yang L, Tian L. Aquatic Insects of China Useful for Monitoring Water Quality; Hohai University Press: Nanjing, China, 1994; 570p. ISBN 9787563002405. [Google Scholar]
-
Epler JH. Identification Manual for the Larval Chironomidae (Diptera) of North and South Carolina; North Carolina Department of Environment and Natural Resources, Division of Water Quality: Raleigh, NC, USA, 2001. [Google Scholar]
-
Poff NL, Olden JD, Vieira NKM, Finn DS, Simmons MP, Kondratieff BC. Functional trait niches of North American lotic insects: traits-based ecological applications in light of phylogenetic relationships. J. N. Am. Benthol. Soc. 2006, 25, 730–755. DOI:10.1899/0887-3593(2006)025[0730:FTNONA]2.0.CO;2 [Google Scholar]
-
Gotelli NJ, Colwell RK. Quantifying biodiversity: Procedures and pitfalls in the measurement and comparison of species richness. Ecol. Lett. 2001, 4, 379–391. DOI:10.1046/j.1461-0248.2001.00230.x [Google Scholar]
-
Cai Q. Why Watershed Ecology? J. Watershed Ecol. 2026, 1, 10001. DOI:10.70322/jwe.2026.10001 [Google Scholar]
-
Xu Y. What Should Ecology Study for Watershed? J. Watershed Ecol. 2026, 1, 10011. DOI:10.70322/jwe.2026.10011 [Google Scholar]
-
Cai Q. Yangtze River conservation and watershed ecology. Yangtze River 2020, 51, 70–74. DOI:10.16232/j.cnki.1001-4179.2020.01.011 [Google Scholar]
-
Sotomayor G, Hampel H, Vázquez Zambrano RF, Forio MAE, Goethals PLM. Functional diversity of benthic macroinvertebrates and fluvial habitat quality: key biological trait categories. Ecol. Inform. 2025, 90, 103235. DOI:10.1016/j.ecoinf.2025.103235 [Google Scholar]
-
Gál B, Weiperth A, Farkas J, Schmera D. Road crossings change functional diversity and trait composition of stream-dwelling macroinvertebrate assemblages. Sci. Rep. 2023, 13, 20698. DOI:10.1038/s41598-023-47975-z [Google Scholar]