
Trait Number and Coding Shape Estimates of Functional Diversity
Trait Number and Coding Shape Estimates of Functional Diversity
Received: 09 March 2026 Revised: 25 May 2026 Accepted: 01 June 2026 Published: 20 July 2026

© 2026 The authors. This is an open access article under the Creative Commons Attribution 4.0 International License (https://creativecommons.org/licenses/by/4.0/).
1. Introduction
Trait-based approaches have become fundamental to modern ecology, driven by the recognition that taxonomic identity poorly predicts ecological function [1,2]. Over the past few decades, trait-based research has expanded exponentially [3,4,5]. Following the recognition that organismal attributes and functions are not equivalent across species [1,2], classifying organisms based on traits has become a central analytical framework in ecology [6,7,8]. With several milestone studies advocating a functional rethinking of ecology [3,7,9], functional diversity is now widely recognized as a key dimension of biodiversity and a fundamental pillar of modern ecological theory [10,11]. Consequently, trait-based functional diversity approaches have become routine tools for investigating ecological patterns and processes across multiple spatial and temporal scales [8,12,13].
With the rapid advancement of trait-based ecological theory, numerous methodological approaches and indices have been proposed to quantify different facets of functional diversity [14,15,16]. Early approaches often relied on single-trait metrics, providing limited insight into ecological differentiation among taxa [16]. Over time, these approaches evolved toward multidimensional frameworks that quantify functional diversity within multivariate trait space, including methods based on distance matrices, functional dendrograms, convex hulls, and hypervolumes [15,16,17]. This methodological progression reflects a broader shift in ecology from descriptive trait summaries toward integrative, mechanistic quantification of functional structure across environmental gradients and spatial scales [18,19]. To organize this expanding set of metrics, researchers have increasingly classified functional diversity into complementary yet conceptually distinct components [20,21,22]. Functional richness captures the total extent of trait dissimilarity among observations, functional evenness (or regularity) [23] describes the distribution of trait differences, functional dispersion represents mean dissimilarity among observations in multidimensional trait space, and functional redundancy links species richness to functional structure by quantifying the extent to which species share similar trait combinations [24,25,26]. Together, these four facets are conceptually independent yet complementary, and are now widely applied to characterize community functional structure and to infer underlying community assembly processes.
Although previous studies have examined how trait number affects functional diversity indices, these analyses have almost exclusively focused on continuous traits [17,27]. This overlooks a key feature of many ecological datasets (e.g., benthic macroinvertebrates), that traits are dominated by categorical variables. Core traits such as feeding mode and respiration type are all expressed as discrete modalities, and these traits fundamentally determine species’ responses to environmental filtering and their contributions to ecosystem functioning [28]. Besides, unlike continuous traits, which exhibit measurable gradients and linear distance relationships in functional space, categorical traits represent discrete states without inherent ordering or quantitative spacing. When multiple categorical traits are combined to construct multidimensional functional spaces, their discrete structure may alter interspecific distance patterns and reshape the geometry of functional space. Thus, increasing the number of categorical traits may not simply increase information content, but may systematically influence functional diversity estimates. Despite this methodological importance, the effects of categorical trait number on the stability and interpretability of functional diversity metrics remain largely unexplored.
In trait-based studies, two main trait coding methods are commonly used: fuzzy coding and binary coding. Because some traits are often difficult to measure directly [29] and may vary across life stages or environmental conditions [30,31], trait expression inherently contains uncertainty [31,32]. Fuzzy coding is therefore applied to account for this uncertainty by assigning affinity scores that quantify the strength of association between taxa and trait modalities [33,34,35]. However, fuzzy coding relies on relatively comprehensive trait knowledge. Where trait information is limited, binary coding—assigning each taxon to a single trait modality—is more commonly adopted, including in regions such as the United States [6,36], China [37], and South Africa [38]. However, both approaches are widely used in the calculation of macroinvertebrate functional diversity, and their potential to generate divergent results remains poorly understood.
The primary objective of this study is to investigate how trait number and trait coding methods influence functional diversity estimates in benthic macroinvertebrates, based on a suite of functional diversity indices that collectively describe the four principal facets of functional diversity: functional richness, functional evenness, functional dispersion, and functional redundancy. More specifically, this study aims to address the following questions: (1) how, and to what extent, does the number of categorical traits included influence each functional diversity index? and (2) do functional diversity indices differ under different trait coding methods? By addressing these questions, this study can provide a basis for a more robust interpretation of functional diversity patterns and improve the comparability of results across regions, studies, and large-scale meta-analyses.
2. Materials and Methods
2.1. Selection of Functional Diversity Indices
To characterize the four major facets of functional diversity, we selected a suite of widely used or conceptually promising indices.
For functional richness, we selected four indices: functional richness (FRic), functional dendrogram (FD), functional entities (FE), and n-dimensional hypervolume richness (Hype-ric). These indices capture complementary aspects of functional richness. FRic quantifies the volume of functional trait space occupied by species by identifying species with extreme trait values [20,39]. FD estimates functional richness as the sum of branch lengths in a dendrogram derived from hierarchical clustering of species based on trait similarity [40]. FE represents the number of groups of species sharing identical trait combinations and is particularly effective when datasets contain many functionally similar species or when traits are categorical [41]. Hype-ric quantifies the extent of functional space filled by the community [42], differing from FRic in that it incorporates species abundance within functional space.
For functional evenness, we selected two indices: functional evenness (FEve) and n-dimensional hypervolume evenness (Hype-eve). FEve describes the regularity of species distribution in functional trait space by measuring the evenness of branch lengths in the minimum spanning tree connecting species in trait space [20]. Hype-eve quantifies the regularity of both trait and abundance distributions within the functional hypervolume [22,42].
For functional dispersion, we selected four indices: functional divergence (FDiv), functional dispersion (FDis), Rao’s quadratic entropy (RaoQ), and functional specialization (FSpe). FDiv measures the abundance-weighted deviation of species from the centroid of functional trait space [20]. FDis calculates the mean distance of species to the community centroid [43]. RaoQ represents the sum of pairwise functional distances among species weighted by their relative abundances [44]. FSpe quantifies the abundance-weighted Euclidean distance of each species to the centroid of all species in functional space [45].
For functional redundancy, we selected four indices: functional redundancy (FRed1), functional vulnerability (FVuln), functional over-redundancy (FOred), and an alternative functional redundancy metric (FRed2). The first three indices are based on functional entities. FRed1 represents the average number of species per functional entity; FVuln quantifies the proportion of functional entities represented by a single species; FOred describes the degree to which certain functional entities are overrepresented in terms of species richness, calculated as the proportion of species belonging to functional entities exceeding the average functional redundancy level [41]. In contrast, FRed2 is based on functional dissimilarity and is calculated as the ratio of RaoQ to the Simpson index, allowing estimation of the contribution of individual species to overall community functional redundancy [41].
2.2. Trait Selection and Analytical Design
Trait selection was based on a synthesis of trait usage in macroinvertebrate functional diversity studies over the past two decades [46], which selected nine traits spanning four major trait groups recommended in that study. These included voltinism and ability to survive desiccation (life-history group); maximum body size, respiration mode, and body form (morphological group); locomotion and dispersal strategy (behavioral group); and feeding mode and food type (physiology group). This selection strategy was guided not only by trait availability but also by the most frequently used traits in global benthic macroinvertebrate trait-based research [46], thereby ensuring both ecological representativeness and comparability across studies. Among these traits, voltinism and maximum body size were treated as ordinal variables (i.e., ordered categorical variables), whereas all remaining traits were treated as nominal categorical variables. Specific benthic invertebrate community data were derived from surveys conducted at 46 sampling sites in the Cangshan Mountains. Detailed information on sampling design and data is provided in Ao et al., 2022 [47].
To address Question 1: how, and to what extent, does the number of traits included influence each functional diversity index? We pooled the 48 sampling sites into a single assemblage comprising 54 species. Each species had complete information for all nine traits, with no missing values. At this stage, 14 functional diversity indices were calculated using only binary-coded trait data.
To address Question 2: Do functional diversity indices differ systematically under different trait coding methods? We compiled both binary-coded and fuzzy-coded trait datasets for the same nine traits across the 54 species, following the procedure described in Ao, Li, Tian, Hu, Cai, 2022 [48]. Because complete trait information was not available for food type and dispersal strategy, these two traits were excluded from subsequent analyses. The final dataset, therefore, included seven traits. Functional diversity indices were then calculated for each of the 48 sites using both binary-coded and fuzzy-coded traits, and the resulting estimates were compared between coding approaches. Notably, functional diversity metrics based on n-dimensional hypervolume methods require trait values to be strictly non-zero [42]. Therefore, when comparing coding approaches, we excluded the hypervolume-based indices Hype-ric and Hype-eve from the analysis.
2.3. Statistical Analyses
To investigate the effects of trait number on functional diversity indices, we generated all possible combinations of traits for each trait-number scenario using the “combinat” package. For example, when evaluating five-trait combinations, we generated all possible subsets of five traits from the nine-trait pool (126 combinations in total). Functional diversity indices were calculated for each combination, and the corresponding means and standard deviations were subsequently derived. In total, we calculated 14 functional diversity indices across 501 unique trait combinations.
We then applied generalized linear models (GLMs) to quantify the relationships between trait number and both functional diversity indices and their associated standard deviations. Gaussian error distributions were primarily used to model functional diversity indices and their standard deviations [49]. Model selection between linear and quadratic formulations was performed using ANOVA to determine which model better fit the data. When GLMs indicated statistical significance (p < 0.05), trait number was considered to have a significant effect on functional diversity indices or their variability.
The 14 functional diversity indices described above were primarily calculated using the mFD package [25], the BAT package [50], and the ‘uniqueness’ function described in Ricotta et al., 2016 [24], all implemented in R. When calculating interspecific trait distances, we consistently used Gower distance, as it enables simultaneous handling of ratio, interval, and categorical variables [51].
3. Results
3.1. Relationships Between Functional Diversity Indices and Trait Number
Our results indicate that different functional diversity indices exhibit distinct responses to trait number. Overall, functional richness and functional evenness were more sensitive to changes in trait number, whereas functional dispersion and functional redundancy were comparatively less sensitive (Figure 1; Table 1). Specifically, for functional richness, FRic, FD, FE, and Hype-ric all increased with increasing trait number, with Hype-ric showing the most pronounced increase. For functional evenness, FEve increased significantly with increasing trait number, whereas Hype-eve showed the opposite pattern, approaching zero as trait number increased. For functional dispersion, trait number had relatively weak effects across the four indices examined. Although slight increases were observed, all indices still exhibited significant quadratic relationships with trait number. For functional redundancy, FRed1 and FOred decreased significantly with increasing trait number, with FRed1 showing a more pronounced decline. In contrast, FVuln increased with increasing trait number. FRed2 showed no significant relationship with trait number and remained largely invariant across different trait-number scenarios.
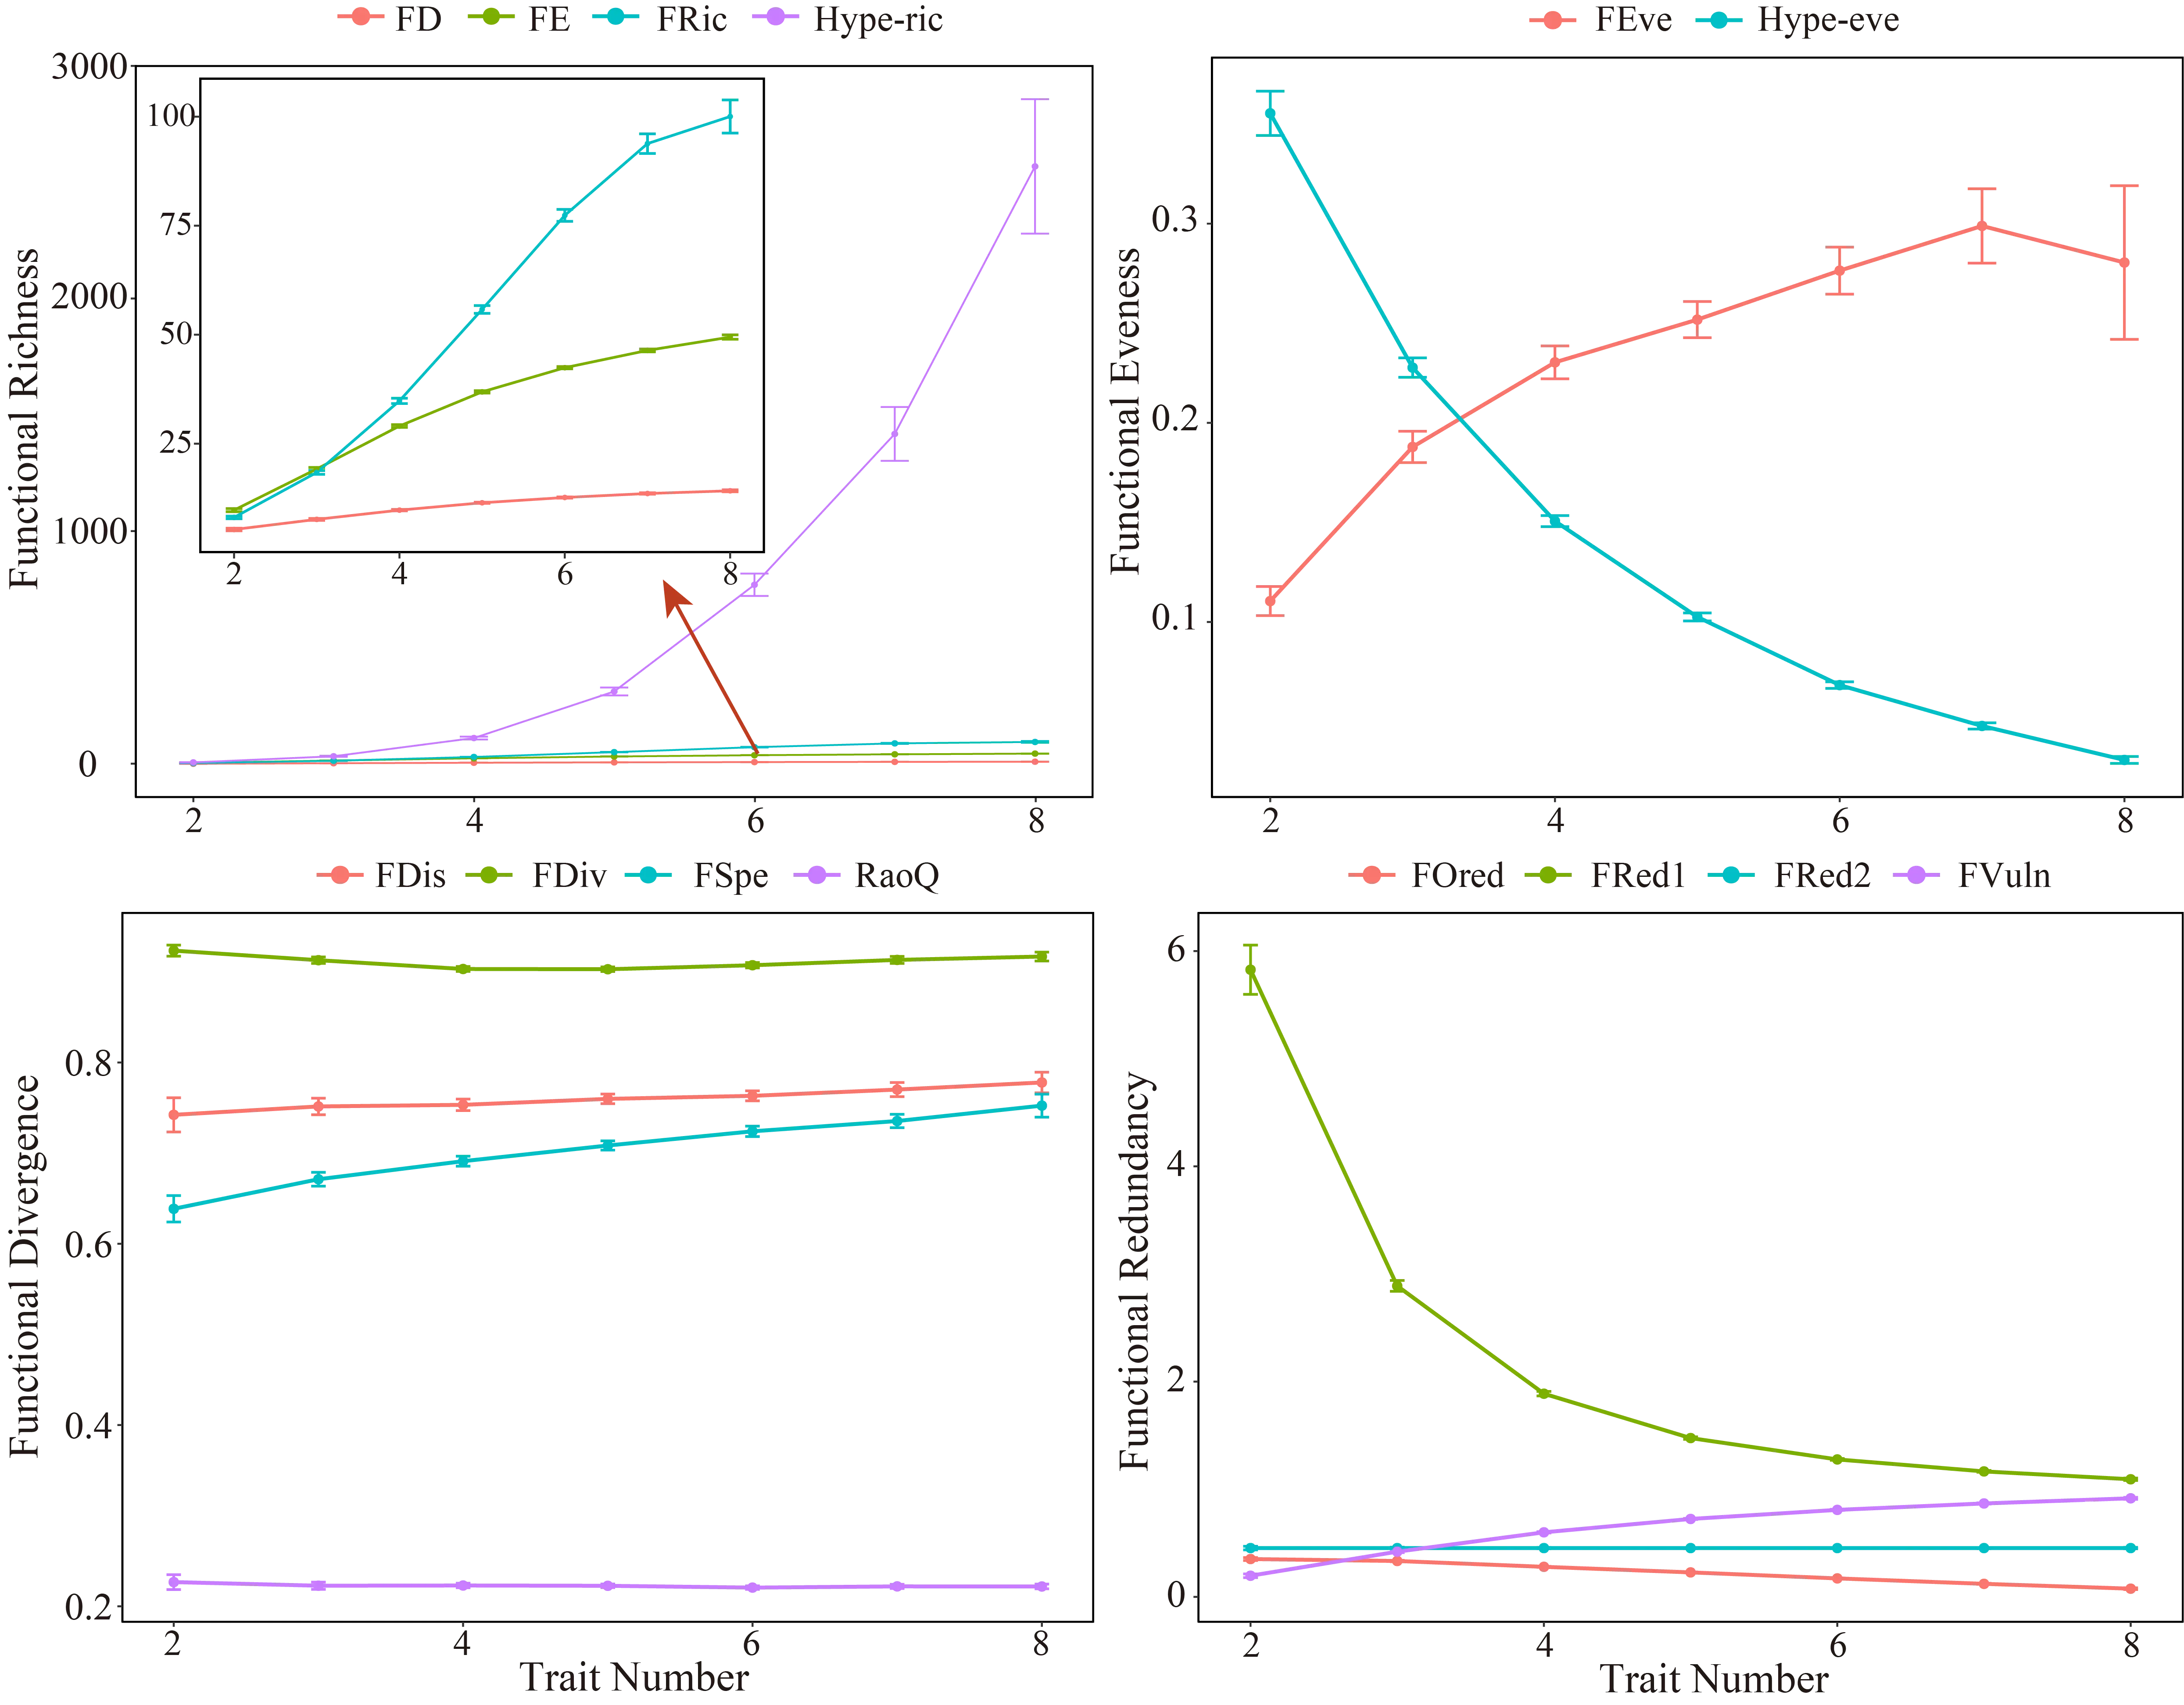
Figure 1. Influence of trait number on functional diversity index estimation. Because Hype-ric exhibited values substantially exceeding those of indices FD, FE, and FRic, thereby masking their variation, indices FD, FE, and FRic were rescaled for clarity (see red arrows). Vertical bars represent standard deviations.
Table 1. Relationships between functional diversity indices and the number of traits.
|
Functional Diversity Indices |
Type of Relation |
p Value |
R2 |
|
|---|---|---|---|---|
|
Functional richness |
FD |
Quadratic |
<0.001 |
0.998 |
|
FE |
Quadratic |
<0.001 |
0.999 |
|
|
FRic |
Linear |
<0.001 |
0.982 |
|
|
Hype_ric |
Quadratic |
<0.001 |
0.987 |
|
|
Functional evenness |
FEve |
Quadratic |
<0.001 |
0.986 |
|
Hype_eve |
Quadratic |
<0.001 |
0.987 |
|
|
Functional divergence |
FDis |
Linear |
<0.001 |
0.976 |
|
FDiv |
Quadratic |
0.008 |
0.868 |
|
|
FSpe |
Quadratic |
<0.001 |
0.992 |
|
|
RaoQ |
Quadratic |
0.034 |
0.723 |
|
|
Functional redundancy |
FOred |
Quadratic |
<0.001 |
0.991 |
|
FRed1 |
Quadratic |
0.004 |
0.906 |
|
|
FRed2 |
Linear |
0.069 |
0.419 |
|
|
FVuln |
Quadratic |
<0.001 |
0.997 |
Analysis of the standard errors associated with functional diversity metrics revealed that different indices exhibited distinct responses to increasing trait number. For most indices, standard errors showed a significant quadratic relationship with trait number (Figure 2; Table 2), reaching a minimum at intermediate trait number. For functional richness, the standard errors of FRic and Hype-ric increased significantly with increasing trait number. In contrast, FD and FE displayed clear U-shaped relationships, with minimum standard errors occurring at approximately six traits. Similar patterns were observed for functional dispersion and functional redundancy. Except for Fred, whose standard error decreased significantly with increasing trait number and reached a minimum at seven traits, the remaining seven functional diversity indices (FDis, FDiv, FSpe, RaoQ, FOred, FRed2, and FVuln) exhibited pronounced U-shaped responses, with minimum standard errors generally occurring at around five traits. For functional evenness, the standard error of FEve increased significantly with trait number. In contrast, Hype-eve exhibited a U-shaped relationship, reaching a minimum at approximately seven traits before increasing again with further increases in trait number.
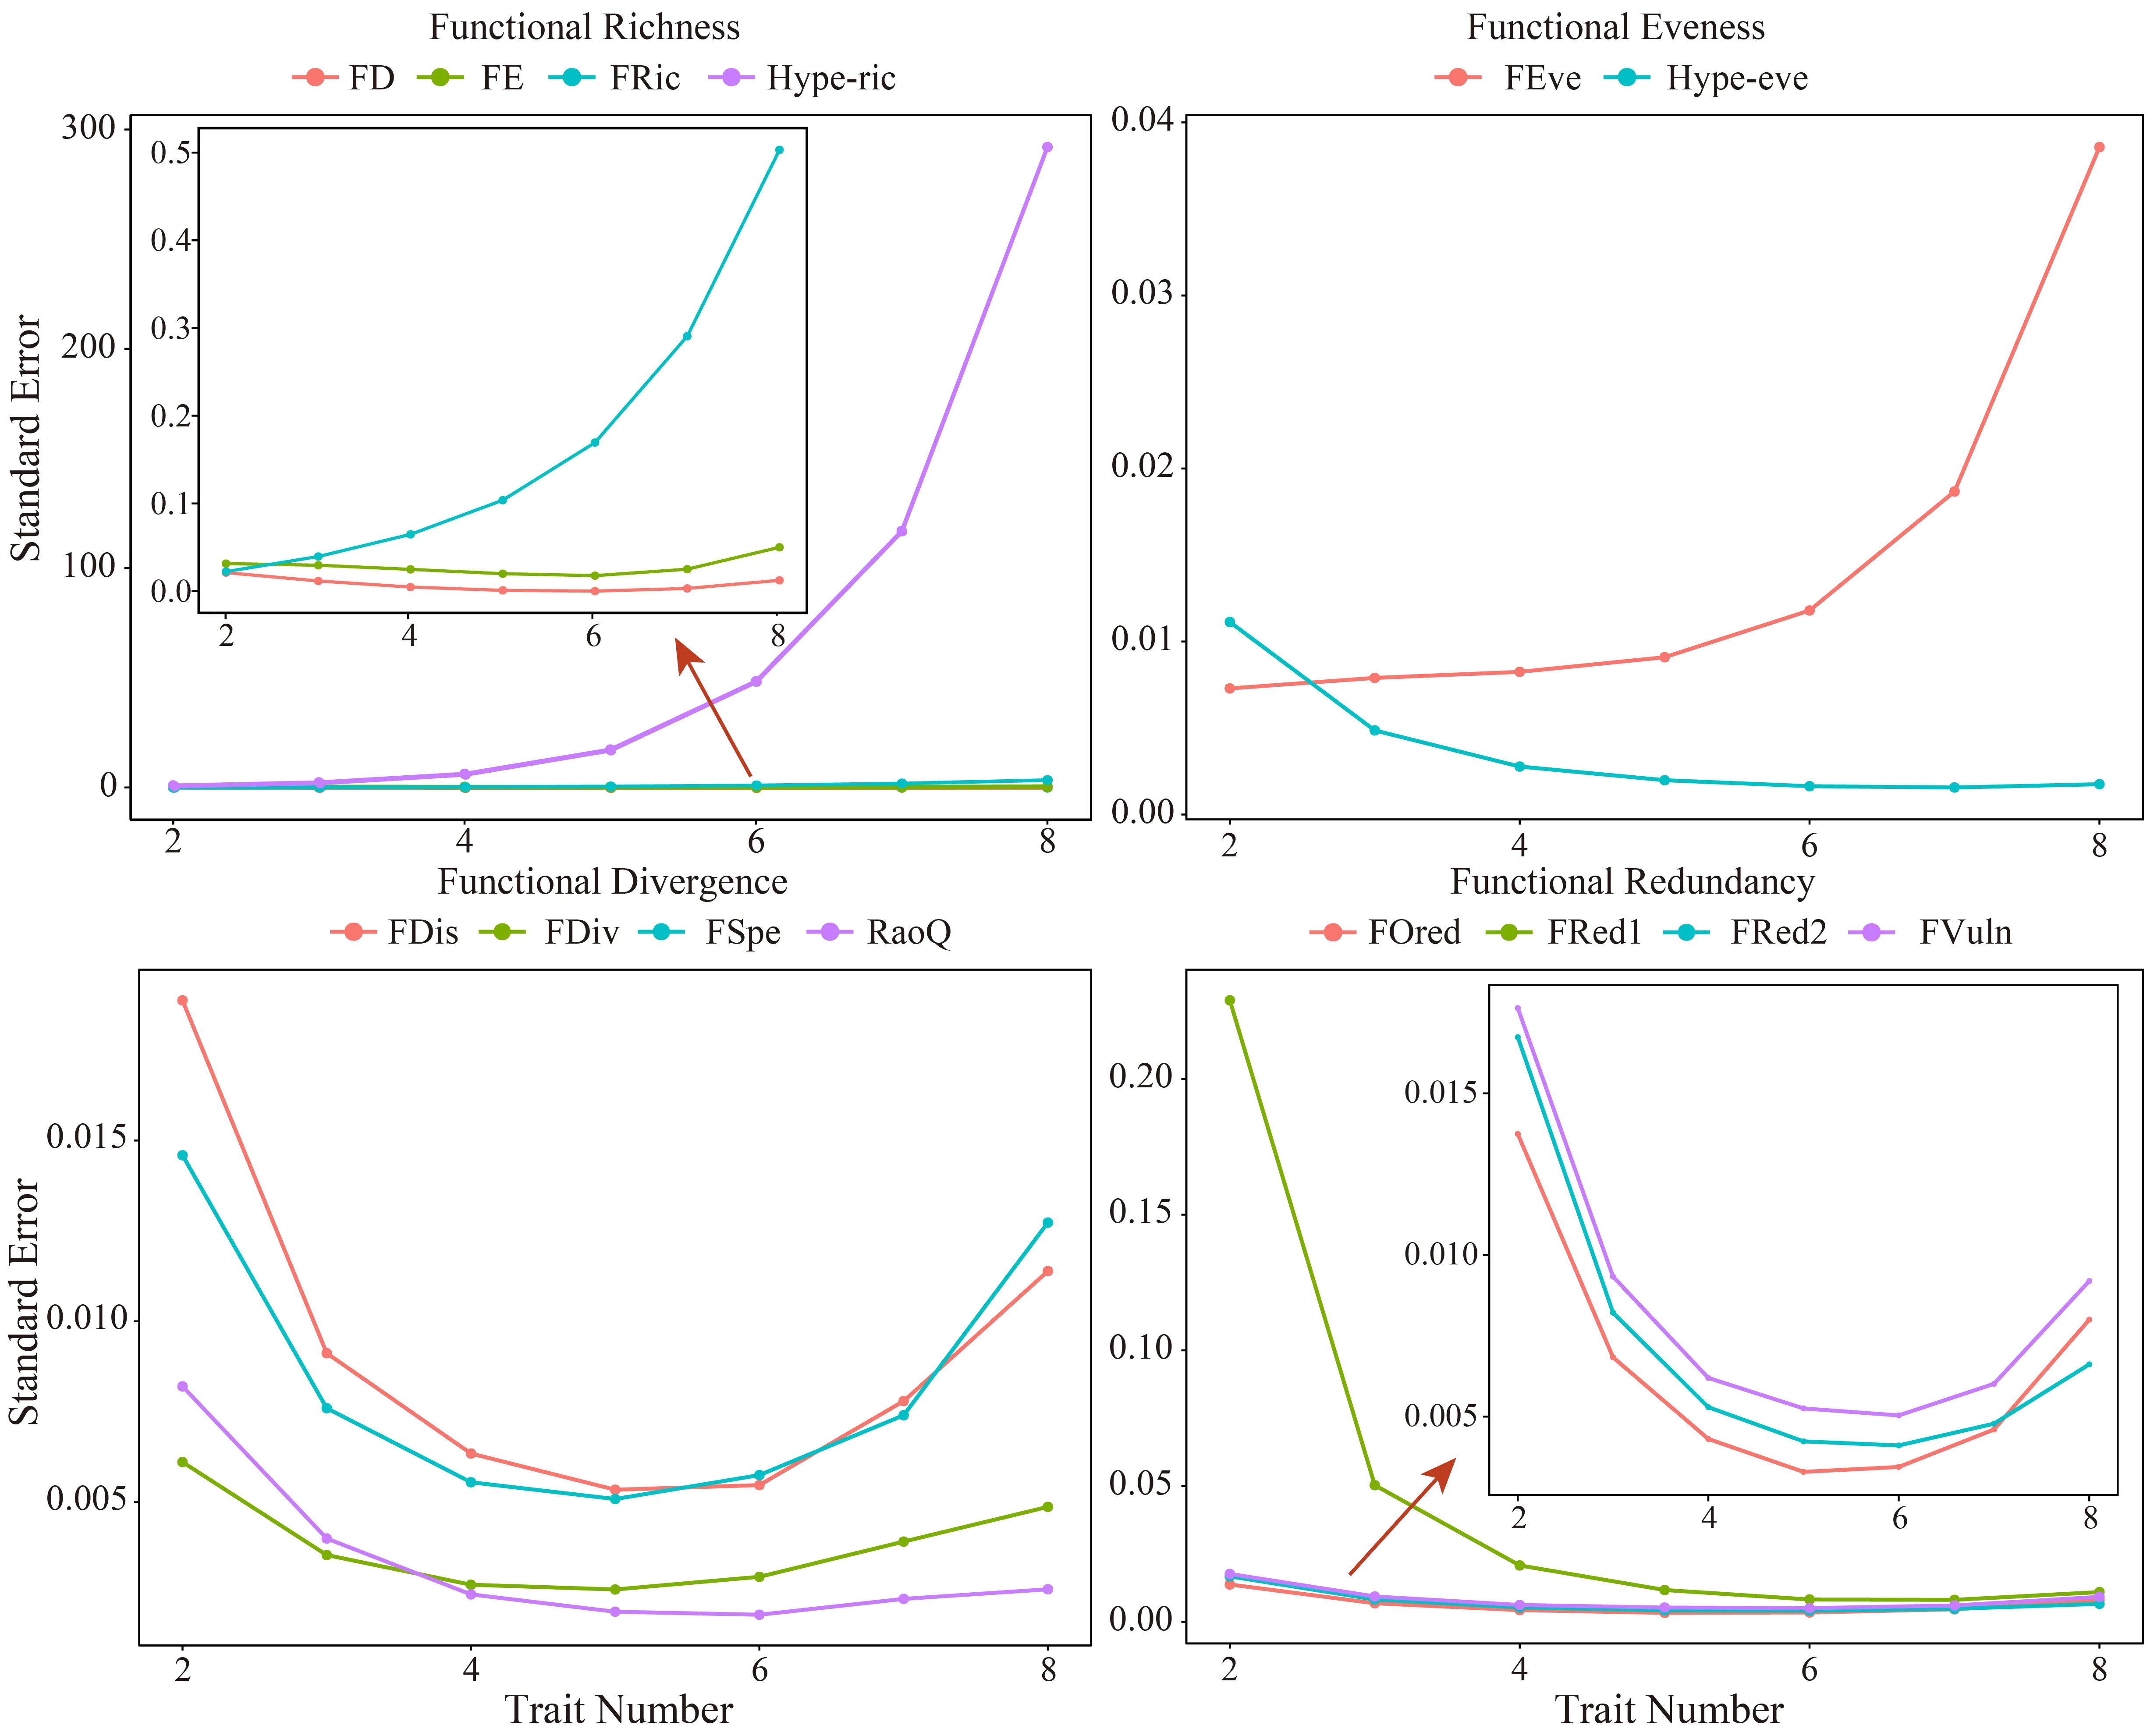
Figure 2. Influence of trait number on the standard error in estimation of functional diversity indices. Because some indices exhibited substantially larger values than other indices and thereby masked their variation, the affected indices were rescaled for clarity (see red arrows).
Table 2. Relationships between the standard errors of functional diversity indices and the number of traits.
|
Functional Diversity Indices |
Type of Relation |
p Value |
R2 |
|
|---|---|---|---|---|
|
Functional richness |
FD |
Quadratic |
<0.001 |
0.985 |
|
FE |
Quadratic |
0.052 |
0.659 |
|
|
FRic |
Quadratic |
0.002 |
0.931 |
|
|
Hype_ric |
Quadratic |
0.002 |
0.928 |
|
|
Functional evenness |
FEve |
Quadratic |
0.005 |
0.897 |
|
Hype_eve |
Quadratic |
0.004 |
0.902 |
|
|
Functional divergence |
FDis |
Quadratic |
0.002 |
0.928 |
|
FDiv |
Quadratic |
0.004 |
0.907 |
|
|
FSpe |
Quadratic |
0.001 |
0.949 |
|
|
RaoQ |
Quadratic |
0.005 |
0.899 |
|
|
Functional redundancy |
FOred |
Quadratic |
<0.001 |
0.959 |
|
FRed1 |
Quadratic |
0.021 |
0.783 |
|
|
FRed2 |
Quadratic |
0.003 |
0.921 |
|
|
FVuln |
Quadratic |
0.001 |
0.946 |
3.2. Consistency Between Binary and Fuzzy Trait Coding
By comparing functional diversity indices calculated using binary and fuzzy coding approaches across the 48 sampling sites, we found that most indices exhibited high levels of concordance between the two coding schemes (Table 3). Among the 12 functional diversity indices examined, all functional richness metrics, as well as the FDis and RaoQ in the functional dispersion metrics, showed strong correlations between coding approaches (r > 0.755). Functional evenness (FEve) showed a moderate correlation between methods (r = 0.556). In contrast, the functional dispersion indices FDiv and FSpe, as well as the functional redundancy metric FRed2, showed no significant correlation between coding approaches. In addition, FOred, FRed1, and FVuln yielded identical values under the fuzzy coding approach across all samples; therefore, correlations could not be evaluated using the Spearman test.
Table 3. Spearman correlation results between binary- and fuzzy-coded functional diversity indices.
|
Functional Diversity Indices |
p Value |
r |
|
|---|---|---|---|
|
Functional diversity |
FD |
<0.001 |
0.889 |
|
FE |
<0.001 |
0.992 |
|
|
FRic |
<0.001 |
0.755 |
|
|
Functional evenness |
FEve |
<0.001 |
0.556 |
|
Functional divergence |
FDis |
<0.001 |
0.862 |
|
FDiv |
0.028 |
0.316 |
|
|
FSpe |
0.274 |
0.161 |
|
|
RaoQ |
<0.001 |
0.951 |
|
|
Functional redundancy |
FOred |
- |
- |
|
FRed1 |
- |
- |
|
|
FRed2 |
0.815 |
0.035 |
|
|
FVuln |
- |
- |
4. Discussion
Differences in the computational approaches among functional diversity metrics lead to their distinct responses to trait number. Both the convex hull underlying FRic and the hypervolume used for Hype-ric are based on the construction of geometric objects in multidimensional trait space. As trait number increases, interspecific distances tend to increase, resulting in wider spacing among species in trait space and consequently larger geometric structures (i.e., convex hulls or hypervolumes [20,42]). In contrast, FE represents groups of species sharing identical trait combinations [25]. As the trait number increases, the number of unique trait combinations increases, leading to higher FE values. FD, which is based on dendrogram construction, reflects the total branch length of the functional tree [40]. Increasing trait number increases interspecific functional distances, which in turn lengthens total branch length and results in higher FD values.
For functional evenness, FEve and Hype-eve showed contrasting responses to trait number. FEve increased with increasing trait number in our study, contrasting with previous findings [27,52], which reported weak sensitivity of FEve to trait number. This discrepancy likely reflects differences in trait types, as previous studies primarily used continuous variables. FEve captures the regularity of distances between species and their nearest neighbors, weighted by relative abundance [20], and is only weakly influenced by species richness [53]. In contrast, Hype-eve quantifies the overlap between the observed hypervolume and a theoretical hypervolume assuming uniformly distributed traits and abundances [22,54]. As the number of traits increases, trait space becomes more complex, reducing overlap with the theoretical hypervolume and leading to lower Hype-eve values [22].
For functional dispersion, trait number showed weak effects across the four dispersion indices. Although our analyses indicated statistically significant relationships, the response curves were nearly parallel to the x-axis, indicating a limited effect size. This contrasts with the results of Legras [27], who reported decreasing FSpe, RaoQ, and FDis with increasing trait number when using Gower distances. Our findings partially support the results of Zhang [52], who observed that RaoQ’s response to trait number depends on distance metric, while Legras et al., 2020 [27] used mixed traits. Together with our results, this suggests that the distance metric mediates trait number effects more strongly than index choice. Together, these results suggest that RaoQ may respond differently to categorical versus continuous traits: remaining relatively stable for categorical traits but increasing with dimensionality when continuous traits are included.
For functional redundancy, all indices except FRed2 were significantly influenced by trait number. FRed1, FOred, and FVuln are derived from functional entities and therefore closely track FE responses to trait number. As trait number increases, more species occupy unique trait combinations, increasing the proportion of singleton functional entities. This causes FRed1 to decline and FVuln to rise. At the same time, because FE increases and FRed1 decreases, species become more spread out across functional entities, lowering FOred. By contrast, FRed2 is a standardized functional differentiation metric linking observed functional diversity to the maximum diversity expected under the same abundance distribution [24]. Because FRed2 is calculated as the ratio between RaoQ and Simpson diversity, and species richness (and thus Simpson diversity) remained constant in our single-community dataset, FRed2 remained largely insensitive to trait number, similar to RaoQ.
Regarding uncertainty, most indices exhibited minimal standard deviation at approximately five traits. FRic showed zero variance because values remained constant. Hype-eve and FRed1 showed decreasing standard deviation with increasing trait number and became highly stable beyond approximately six traits. Hype-ric and FEve, however, showed increasing standard deviation with trait number. For Hype-ric, the rate of index increase exceeded the increase in standard deviation when trait numbers were low (<8), resulting in relatively stable estimates. However, at higher trait numbers, uncertainty may exceed signal strength, reducing reliability. For FEve, standard deviation remained stable (~0.008) below five traits but increased rapidly beyond this threshold. FEve was the only index requiring trait number constraints (≤6) for reliability. All other nine indices achieved minimum uncertainty at 5–6 traits and remained stable thereafter, aligning remarkably with Mouillot et al., 2021 [17] identified dimensionality trade-off across scales.
Our findings indicate that the similarity between binary and fuzzy coding in six of the nine functional diversity indices should be interpreted cautiously, as this consistency is inherently data-dependent. While fuzzy coding captures more detailed biological information, it may also introduce noise from regionally inconsistent trait expression. In reality, macroinvertebrate traits often respond predictably to environmental gradients within regions, suggesting that local expression may be less variable than fuzzy-coded databases imply. This concern is illustrated by Li et al., 2020 [55], who found mayfly voltinism shifts with elevation. Under fuzzy coding, such variation would be preserved as within-species flexibility; under binary coding, it might be lost or averaged. As Bonada and Dolédec [30] showed for the Tachet database, fuzzy-coded traits can reflect central European conditions better than peripheral regions, potentially introducing systematic bias when applied outside the calibration area. To mitigate such uncertainties where regional databases are incomplete, we suggest that researchers should first prioritize local validation by calibrating key traits through field observations or targeted literature reviews rather than relying solely on generalized databases. Second, highly plastic traits, such as life-history attributes sensitive to environmental gradients, should be explicitly identified and screened; if included, their impact on functional space construction should be assessed via sensitivity analysis.
Looking forward, grounded in the perspective of environmental determinism, we recommend: (1) developing region-specific or watershed-specific trait databases, where environmental filters are relatively consistent within a watershed. Such databases would greatly facilitate the refinement of ecosystem health assessments from a watershed ecology perspective [56,57]. Alternatively, (2) adopting multi-trait binary approaches that treat intraspecific variation as multiple fixed states rather than continuous probabilities. Both strategies acknowledge the role of environmental determinism while helping to balance the noise-information trade-off identified in this study. Future work should further examine whether regionally calibrated coding improves the strength of the trait-environment relationship.
More broadly, selecting indices that accurately capture key aspects of community functional diversity remains a complex task [17,27]. Index choice depends strongly on study objectives, data structure, trait identity, and trait number. Mouillot et al., 2014 [41] proposed testing the robustness of functional diversity metrics to trait number and identity by rerunning analyses across all possible (n − 1)-trait combinations. Such approaches help distinguish true ecological signals from mathematical artefacts. Another strategy to mitigate trait-number sensitivity involves comparing observed index values against null models calculated under identical analytical conditions (e.g., identical trait numbers and distance metrics). Several studies [20,45,53,58] have recommended null-model approaches to address index sensitivity to species richness. Extending this logic, analogous randomization-based null models could be implemented to explicitly evaluate and control for sensitivity to trait number.
5. Conclusions
By analysing nine functional traits of macroinvertebrates, we evaluated how functional diversity responds to trait number and trait encoding methods across four major components: functional richness, functional evenness, functional dispersion, and functional redundancy. Our results demonstrate that sensitivity to trait number differed markedly among indices—functional richness and evenness metrics showed strong responses, while dispersion and redundancy indices remained relatively stable. Notably, uncertainty analysis revealed that most indices achieved minimum estimation variability at approximately five traits, suggesting a ‘sweet spot’ where functional space resolution and statistical stability are optimally balanced. Comparisons between binary and fuzzy trait encoding indicated high consistency for functional richness, functional evenness, and parts of functional dispersion metrics, whereas functional redundancy metrics showed weaker concordance.
These findings are currently limited to categorical traits and cannot be directly transferred to studies based on continuous traits. Moreover, our trait dataset did not explicitly distinguish between ordinal and nominal categorical traits, which may introduce additional uncertainty and warrants future research. More broadly, our results highlight a persistent challenge in functional ecology: the mathematical structure and ecological interpretation of many functional diversity indices remain only partially understood. This issue becomes particularly pronounced when indices are calculated within high-dimensional trait spaces, where small methodological choices can substantially influence outcomes.
While current research has increasingly focused on the development of new functional diversity metrics, our findings strongly emphasize the need for sustained methodological efforts to evaluate the mathematical properties, robustness, and limitations of existing indices. Without this foundational work, the field risks building increasingly complex ecological interpretations on incompletely understood mathematical foundations. We therefore recommend that future functional diversity studies report the exact number of traits and the coding methods used, to ensure reproducibility and facilitate cross-study comparability.
Statement of the Use of Generative AI and AI-Assisted Technologies in the Writing Process
During the preparation of this manuscript, the author used Grammarly in order to improve the English language, grammar, clarity and flow of the text. After using this tool, the author reviewed and edited the content as needed and takes full responsibility for the content of the published article.
Acknowledgments
We give special thanks to Yao-Yang Xu for his support of our research.
Author Contributions
Conceptualization, S.-C.A. and Q.-H.C.; Methodology, S.-C.A.; Formal Analysis, S.-C.A.; Writing—Original Draft, S.-C.A.; Writing—Review & Editing, S.-C.A., A.J.P., X.-Y.L. and M.-C.C.; Visualization, S.-C.A., X.-Y.L.; Supervision, Q.-H.C.; Funding Acquisition, S.-C.A.
Ethics Statement
Not applicable.
Informed Consent Statement
Not applicable.
Data Availability Statement
No new biological data were created. The macroinvertebrate dataset is available online at Mendeley Data Repository (DOI:10.17632/nd7tyydww4.1).
Funding
This work was supported by the Young Scientists Fund of the National Natural Science Foundation of China (Grant No. 32301334).
Declaration of Competing Interest
The authors declare that they have no known competing financial interests or personal relationships that could have appeared to influence the work reported in this paper.
References
-
Petchey OL, Gaston KJ. Functional diversity: Back to basics and looking forward. Ecol. Lett. 2006, 9, 741–758. DOI:10.1111/j.1461-0248.2006.00924.x [Google Scholar]
-
Ryabov A, Blasius B, Hillebrand H, Olenina I, Gross T. Estimation of functional diversity and species traits from ecological monitoring data. Proc. Natl. Acad. Sci. USA 2022, 119, e2118156119. DOI:10.1073/pnas.2118156119 [Google Scholar]
-
Martini S, Larras F, Boye A, Faure E, Aberle N, Archambault P, et al. Functional trait-based approaches as a common framework for aquatic ecologists. Limnol. Oceanogr. 2021, 66, 965–994. DOI:10.1002/lno.11655 [Google Scholar]
-
Fisher JC, Dallimer M, Irvine KN, Aizlewood SG, Austen GE, Fish RD, et al. Human well-being responses to species’ traits. Nat. Sustain. 2023, 6, 1219–1227. DOI:10.1038/s41893-023-01151-3 [Google Scholar]
-
Weigelt A, Mommer L, Andraczek K, Iversen CM, Bergmann J, Bruelheide H, et al. The importance of trait selection in ecology. Nature 2023, 618, E29–E30. DOI:10.1038/s41586-023-06148-8 [Google Scholar]
-
Poff NL, Olden JD, Vieira NKM, Finn DS, Simmons MP, Kondratieff BC. Functional trait niches of North American lotic insects: Traits-based ecological applications in light of phylogenetic relationships. J. N. Am. Benthol. Soc. 2006, 25, 730–755. DOI:10.1899/0887-3593(2006)025[0730:Ftnona]2.0.Co;2 [Google Scholar]
-
Gutiérrez-Cánovas C, Stubbington R, von Schiller D, Bolpagni R, Colls M, Datry T, et al. Use of trait concepts and terminology in freshwater ecology: Historic, current, and future perspectives. Freshw. Biol. 2024, 69, 477–495. DOI:10.1111/fwb.14230 [Google Scholar]
-
Lundgren EJ, Bergman J, Trepel J, le Roux E, Monsarrat S, Kristensen JA, et al. Functional traits—Not nativeness—Shape the effects of large mammalian herbivores on plant communities. Science 2024, 383, 531–537. DOI:10.1126/science.adh2616 [Google Scholar]
-
McGill BJ, Enquist BJ, Weiher E, Westoby M. Rebuilding community ecology from functional traits. Trends Ecol. Evol. 2006, 21, 178–185. DOI:10.1016/j.tree.2006.02.002 [Google Scholar]
-
Malaterre C, Dussault AC, Rousseau-Mermans S, Barker G, Beisner BE, Bouchard F, et al. Functional diversity: An epistemic roadmap. BioScience 2019, 69, 800–811. DOI:10.1093/biosci/biz089 [Google Scholar]
-
Jarzyna MA, Jetz W. Detecting the multiple facets of biodiversity. Trends Ecol. Evol. 2016, 31, 527–538. DOI:10.1016/j.tree.2016.04.002 [Google Scholar]
-
Wu N, Wang Y, Wang Y, Sun X, Faber C, Fohrer N. Environment regimes play an important role in structuring trait- and taxonomy-based temporal beta diversity of riverine diatoms. J. Ecol. 2022, 110, 1442–1454. DOI:10.1111/1365-2745.13859 [Google Scholar]
-
Barajas Barbosa MP, Craven D, Weigelt P, Denelle P, Otto R, Díaz S, et al. Assembly of functional diversity in an oceanic island flora. Nature 2023, 619, 545–550. DOI:10.1038/s41586-023-06305-z [Google Scholar]
-
Schleuter D, Daufresne M, Massol F, Argillier C. A user’s guide to functional diversity indices. Ecol. Monogr. 2010, 80, 469–484. DOI:10.1890/08-2225.1 [Google Scholar]
-
Mammola S, Carmona CP, Guillerme T, Cardoso P. Concepts and applications in functional diversity. Funct. Ecol. 2021, 35, 1869–1885. DOI:10.1111/1365-2435.13882 [Google Scholar]
-
Schmera D, Heino J, Podani J, Eros T, Doledec S. Functional diversity: A review of methodology and current knowledge in freshwater macroinvertebrate research. Hydrobiologia 2017, 787, 27–44. DOI:10.1007/s10750-016-2974-5 [Google Scholar]
-
Mouillot D, Loiseau N, Grenié M, Algar AC, Allegra M, Cadotte MW, et al. The dimensionality and structure of species trait spaces. Ecol. Lett. 2021, 24, 1988–2009. DOI:10.1111/ele.13778 [Google Scholar]
-
Haight JD, Hall SJ, Fidino M, Adalsteinsson SA, Ahlers AA, Angstmann J, et al. Urbanization, climate and species traits shape mammal communities from local to continental scales. Nat. Ecol. Evol. 2023, 7, 1654–1666. DOI:10.1038/s41559-023-02166-x [Google Scholar]
-
Opedal ØH, Armbruster WS, Hansen TF, Holstad A, Pélabon C, Andersson S, et al. Evolvability and trait function predict phenotypic divergence of plant populations. Proc. Natl. Acad. Sci. USA 2023, 120, e2203228120. DOI:10.1073/pnas.2203228120 [Google Scholar]
-
Villeger S, Mason NWH, Mouillot D. New multidimensional functional diversity indices for a multifaceted framework in functional ecology. Ecology 2008, 89, 2290–2301. DOI:10.1890/07-1206.1 [Google Scholar]
-
Mason NWH, Mouillot D, Lee WG, Wilson JB. Functional richness, functional evenness and functional divergence: The primary components of functional diversity. Oikos 2005, 111, 112–118. DOI:10.1111/j.0030-1299.2005.13886.x [Google Scholar]
-
Mammola S, Cardoso P. Functional diversity metrics using kernel density n-dimensional hypervolumes. Methods Ecol. Evol. 2020, 11, 986–995. DOI:10.1111/2041-210x.13424 [Google Scholar]
-
Tucker CM, Cadotte MW, Carvalho SB, Davies TJ, Ferrier S, Fritz SA, et al. A guide to phylogenetic metrics for conservation, community ecology and macroecology. Biol. Rev. 2017, 92, 698–715. DOI:10.1111/brv.12252 [Google Scholar]
-
Ricotta C, Bello F, Moretti M, Caccianiga M, Cerabolini BEL, Pavoine S. Measuring the functional redundancy of biological communities: A quantitative guide. Methods Ecol. Evol. 2016, 7, 1386–1395. DOI:10.1111/2041-210x.12604 [Google Scholar]
-
Magneville C, Loiseau N, Albouy C, Casajus N, Claverie T, Escalas A, et al. mFD: An R package to compute and illustrate the multiple facets of functional diversity. Ecography 2022, 2022, e05904. DOI:10.1111/ecog.05904 [Google Scholar]
-
Womack TM, Crampton JS, Hannah MJ, Collins KS. A positive relationship between functional redundancy and temperature in Cenozoic marine ecosystems. Science 2021, 373, 1027–1029. DOI:10.1126/science.abf8732 [Google Scholar]
-
Legras G, Loiseau N, Gaertner JC, Poggiale JC, Gaertner-Mazouni N. Assessing functional diversity: The influence of the number of the functional traits. Theor. Ecol. 2020, 13, 117–126. DOI:10.1007/s12080-019-00433-x [Google Scholar]
-
Germain RR, Feng S, Chen G, Graves GR, Tobias JA, Rahbek C, et al. Species-specific traits mediate avian demographic responses under past climate change. Nat. Ecol. Evol. 2023, 7, 862–872. DOI:10.1038/s41559-023-02055-3 [Google Scholar]
-
Kunz S, Kefford BJ, Schmidt-Kloiber A, Matthaei CD, Usseglio-Polatera P, Graf W, et al. Tackling inconsistencies among freshwater invertebrate trait databases: Harmonising across continents and aggregating taxonomic resolution. Freshw. Biol. 2021, 67, 275–291. DOI:10.1111/fwb.13840 [Google Scholar]
-
Bonada N, Dolédec S. Does the Tachet trait database report voltinism variability of aquatic insects between Mediterranean and Scandinavian regions? Aquat. Sci. 2018, 80, 7. DOI:10.1007/s00027-017-0554-z [Google Scholar]
-
Wilkes MA, Edwards F, Jones JI, Murphy JF, England J, Friberg N, et al. Trait-based ecology at large scales: Assessing functional trait correlations, phylogenetic constraints and spatial variability using open data. Glob. Change Biol. 2020, 26, 7255–7267. DOI:10.1111/gcb.15344 [Google Scholar]
-
Barabás G, Parent C, Kraemer A, Van de Perre F, De Laender F. The evolution of trait variance creates a tension between species diversity and functional diversity. Nat. Commun. 2022, 13, 2521. DOI:10.1038/s41467-022-30090-4 [Google Scholar]
-
Chevenet F, Doledec S, Chessel D. A fuzzy coding approach for the analysis of long-term ecological data. Freshw. Biol. 1994, 31, 295–309. DOI:10.1111/j.1365-2427.1994.tb01742.x [Google Scholar]
-
Usseglio-Polatera P, Bournaud M, Richoux P, Tachet H. Biological and ecological traits of benthic freshwater macroinvertebrates: Relationships and definition of groups with similar traits. Freshw. Biol. 2000, 43, 175–205. DOI:10.1046/j.1365-2427.2000.00535.x [Google Scholar]
-
Tachet H, Bournaud M, Philippe R, Usseglio-Polatera P. Invertebres d’eau douce—Systematique, Biologie, Ecologie; CNRS Editions: Paris, France, 2010. [Google Scholar]
-
Twardochleb L, Hiltner E, Pyne M, Zarnetske P. Freshwater insects CONUS: A database of freshwater insect occurrences and traits for the contiguous United States. Glob. Ecol. Biogeogr. 2021, 30, 826–841. DOI:10.1111/geb.13257 [Google Scholar]
-
Li Z, Heino J, Liu Z, Meng X, Chen X, Ge Y, et al. The drivers of multiple dimensions of stream macroinvertebrate beta diversity across a large montane landscape. Limnol. Oceanogr. 2021, 66, 226–236. DOI:10.1002/lno.11599 [Google Scholar]
-
Odume O, Ntloko P, Akamagwuna F, Dallas H, Barber-James H. Development of Macroinvertebrate Trait-Based Approach for Assessing and Managing Ecosystem Health in South African Rivers–Incoporating a Case Study in the Tsitsa River and Its Tributaries, Eastern Cape; WRC Project No: K1/7157; Water Research Commission: Pretoria, South Africa, 2018. [Google Scholar]
-
Cornwell WK, Schwilk DW, Ackerly DD. A trait-based test for habitat filtering: Convex hull volume. Ecology 2006, 87, 1465–1471. DOI:10.1890/0012-9658(2006)87[1465:ATTFHF]2.0.CO;2 [Google Scholar]
-
Petchey OL, Gaston KJ. Functional diversity (FD), species richness and community composition. Ecol. Lett. 2002, 5, 402–411. DOI:10.1046/j.1461-0248.2002.00339.x [Google Scholar]
-
Mouillot D, Villéger S, Parravicini V, Kulbicki M, Arias-González JE, Bender M, et al. Functional over-redundancy and high functional vulnerability in global fish faunas on tropical reefs. Proc. Natl. Acad. Sci. USA 2014, 111, 13757–13762. DOI:10.1073/pnas.1317625111 [Google Scholar]
-
Blonder B, Lamanna C, Violle C, Enquist BJ. The n-dimensional hypervolume. Global Ecol. Biogeogr. 2014, 23, 595–609. DOI:10.1111/geb.12146 [Google Scholar]
-
Laliberte E, Legendre P. A distance-based framework for measuring functional diversity from multiple traits. Ecology 2010, 91, 299–305. DOI:10.1890/08-2244.1 [Google Scholar]
-
Botta-Dukát Z. Rao’s quadratic entropy as a measure of functional diversity based on multiple traits. J. Veg. Sci. 2005, 16, 533–540. DOI:10.1111/j.1654-1103.2005.tb02393.x [Google Scholar]
-
Villéger S, Miranda JR, Hernández DF, Mouillot D. Contrasting changes in taxonomic vs. functional diversity of tropical fish communities after habitat degradation. Ecol. Appl. 2010, 20, 1512–1522. DOI:10.1890/09-1310.1 [Google Scholar]
-
Ao S, Chiu M-C, Lin X, Cai Q. Trait selection strategy for functional diversity in freshwater systems: A case framework of macroinvertebrates. Ecol. Indic. 2023, 153, 110450. DOI:10.1016/j.ecolind.2023.110450 [Google Scholar]
-
Ao S, Ye L, Liu X, Cai Q, He F. Elevational patterns of trait composition and functional diversity of stream macroinvertebrates in the Hengduan Mountains region, Southwest China. Ecol. Indic. 2022, 144, 109558. DOI:10.1016/j.ecolind.2022.109558 [Google Scholar]
-
Ao S, Li X, Tian Z, Hu J, Cai Q. Harmonizing and searching macroinvertebrate trait information in alpine streams: Method and application—A case study in the Three Parallel Rivers Region, China. Front. Ecol. Evol. 2022, 10, 945824. DOI:10.3389/fevo.2022.945824 [Google Scholar]
-
Jyväsjärvi J, Virtanen R, Ilmonen J, Paasivirta L, Muotka T. Identifying taxonomic and functional surrogates for spring biodiversity conservation. Conserv. Biol. 2018, 32, 883–893. DOI:10.1111/cobi.13101 [Google Scholar]
-
Cardoso P, Rigal F, Carvalho JC. BAT—Biodiversity Assessment Tools, an R package for the measurement and estimation of alpha and beta taxon, phylogenetic and functional diversity. Methods Ecol. Evol. 2015, 6, 232–236. DOI:10.1111/2041-210x.12310 [Google Scholar]
-
Podani J, Schmera D. On dendrogram-based measures of functional diversity. Oikos 2006, 115, 179–185. DOI:10.1111/j.2006.0030-1299.15048.x [Google Scholar]
-
Zhang Z, Hou J, He N. Predictability of functional diversity depends on the number of traits. J. Resour. Ecol. 2021, 12, 332–345. DOI:10.5814/j.issn.1674-764x.2021.03.003 [Google Scholar]
-
Mouchet MA, Villeger S, Mason NW, Mouillot D. Functional diversity measures: An overview of their redundancy and their ability to discriminate community assembly rules. Funct. Ecol. 2010, 24, 867–876. DOI:10.1111/j.1365-2435.2010.01695.x [Google Scholar]
-
Carmona CP, de Bello F, Mason NW, Lepš J. Trait probability density (TPD): Measuring functional diversity across scales based on TPD with R. Ecology 2019, 100, e02876. DOI:10.1002/ecy.2876 [Google Scholar]
-
Li X-F, Tan L, Du H, Li S-D, Guo S-H, Mo J-Y, et al. Life history flexibility of Drunella submontana Brodsky, 1930 (Ephemeroptera: Ephemerellidae) along altitude gradients in Shennongjia National Park, China. Aquat. Insects 2020, 41, 55–66. DOI:10.1080/01650424.2019.1708405 [Google Scholar]
-
Cai Q. Yangtze River conseivation and watershed ecology. Yangtze River 2020, 51, 70–74. DOI:10.16232/j.cnki.1001-4179.2020.01.011 [Google Scholar]
-
Cai Q. Why Watershed Ecology? J. Watershed Ecol. 2026, 1, 10001. DOI:10.70322/jwe.2026.10001 [Google Scholar]
-
Mason NW, Irz P, Lanoiselée C, Mouillot D, Argillier C. Evidence that niche specialization explains species–energy relationships in lake fish communities. J. Anim. Ecol. 2008, 77, 285–296. DOI:10.1111/j.1365-2656.2007.01350.x [Google Scholar]