
Water–Energy–Food Nexus and Circular Economy Analysis of Melon (Cucumis melo L.) and Grape (Vitis vinifera L.) Value Chains: A Life Cycle, Water Footprint, and Exergy Assessment with Turkish Case Studies
Water–Energy–Food Nexus and Circular Economy Analysis of Melon (Cucumis melo L.) and Grape (Vitis vinifera L.) Value Chains: A Life Cycle, Water Footprint, and Exergy Assessment with Turkish Case Studies

Received: 02 May 2026 Revised: 02 July 2026 Accepted: 20 July 2026 Published: 30 July 2026

© 2026 The authors. This is an open access article under the Creative Commons Attribution 4.0 International License (https://creativecommons.org/licenses/by/4.0/).
1. Introduction
The interlinkages among water, energy, and food systems—collectively framed as the WEF Nexus since the Bonn 2011 Conference [1]—have become a central organizing concept in environmental sustainability research. Agricultural production and agro-industrial processing represent major simultaneous consumers of all three resources: irrigated farming accounts for approximately 70% of global freshwater withdrawals [2], while food systems contribute 19–29% of global greenhouse gas emissions [3]. Against this backdrop, crop and product selection for nexus analysis carries significant implications; crops with high water productivity, large global production volumes, and complex agro-industrial value chains offer the greatest analytical leverage.
Melon (Cucumis melo L.) and grape/wine (Vitis vinifera L.) represent two such systems and were selected for this study on the following grounds.
Melon is among the most widely cultivated cucurbit crops globally, with Türkiye ranking as the world’s fourth-largest producer at approximately 1.7 million tonnes per year [4]. Melon cultivation is particularly sensitive to irrigation scheduling in semi-arid climates, making it an ideal candidate for water footprint assessment [5,6]. Furthermore, packhouse processing generates large volumes of rind and seed residues—amounting to 30–40% of fresh weight—that represent underutilized streams with valorization potential for pectin, seed oil, and biogas [7].
Grapevines and winemaking present complementary analytical richness. Vitis vinifera L. is cultivated across all major Mediterranean and continental climate zones, and the winemaking process is among the most energy- and water-intensive agro-industrial operations, involving temperature-controlled fermentation, cleaning-in-place (CIP) cycles, filtration, and glass packaging [8,9]. Türkiye is of particular interest because it hosts more than 80 indigenous cultivars catalogued by TAGEM and Morgounov et al. [10], yet remains understudied in the international LCA and water footprint literature [4]. Semi-arid growing regions such as Elazığ, Diyarbakır, and Cappadocia are heavily reliant on groundwater irrigation, resulting in blue-water shares substantially above the global average [11,12].
Several authors have published LCA-based carbon footprint analyses of the wine sector [3,8], and ref. [9] have conducted energy and exergy analyses of winery operations. Water footprint methodologies applicable to crop systems were established by Hoekstra et al. [2] and further extended to comparative global assessments by Hoekstra and Mekonnen [11] and Vanham et al. [12]. However, to the authors’ knowledge, no single study has simultaneously integrated LCA, water footprint assessment, exergy analysis, and circular economy evaluation across both melon and grape value chains within a WEF nexus framework. The present study addresses this gap, with Türkiye as the primary geographic focus.
2. Materials and Methods
2.1. System Boundaries and Functional Units
All analyses are conducted within a cradle-to-gate system boundary encompassing agricultural production (field operations, irrigation, fertilization, crop protection) through farm gate or winery gate, as appropriate. Four functional units are defined:
-
-
1 tonne of fresh melon at the farm gate
-
-
1 tonne of fresh grapes at the farm gate
-
-
1 × 0.75 L wine bottle at winery gate
-
-
1 tonne of by-product (for CE valorization scenarios)
The study region is Türkiye (primary), with global average data used for comparative benchmarking. This is a literature- and database-informed nexus assessment rather than one based on new primary field metering: production statistics are drawn from TÜİK national records [4], LCA background unit processes from the ecoinvent v3.9 database (Section 2.2), and water-balance and variety parameters from the peer-reviewed and institutional sources cited throughout this section, combined following the calculation procedures described in Sections 2.2–2.6.
The specific study areas underlying the Türkiye-focused results are as follows. Melon data centre on the Aegean (Manisa province, home to the GI-registered Kırkağaç 637 landrace), Central Anatolian (Konya, Kırşehir), and South-Eastern Anatolian (Diyarbakır) growing regions. Wine-grape data centre on the semi-arid Eastern and South-Eastern Anatolian basins of Elazığ (Öküzgözü) and Diyarbakır (Boğazkere), the Central Anatolian Cappadocia/Nevşehir basin (Emir), and Ankara province (Kalecik Karası), together with Aegean and Thracian basins (Bornova Misketi, Papazkarası); these regions were selected because they host the indigenous cultivars catalogued by TAGEM and Morgounov et al. [10] and because their largely groundwater-fed irrigation regimes place them among the country’s most blue-water-intensive viticultural areas. Where Turkish primary or national statistical data were unavailable for a specific parameter, values derived from the global literature were substituted for benchmarking purposes and are identified as such in the relevant tables.
2.2. Life Cycle Assessment (LCA)
LCA was conducted in accordance with ISO 14040:2006 [13] and ISO 14044:2006 [14]. Environmental impact characterization followed the ReCiPe 2016 midpoint (Hierarchist) method [15], covering GWP100, water depletion, land use, fossil resource scarcity, freshwater eutrophication, and human toxicity (non-cancer). The background database used was ecoinvent v3.9.
The circular economy (CE) scenario was evaluated using system expansion per ISO 14044 [14], in which avoided environmental burdens from displaced products are credited against the system. Credits are calculated for pomace bioethanol, polyphenol extraction, grape seed oil, tartaric acid recovery from wine lees, and anaerobic digestion of melon rind.
Results for the six LCA midpoint impact categories are presented in Table 1.
Table 1. LCA midpoint impact categories (ReCiPe 2016-H).
|
Impact Category |
Unit |
Melon (1 t) |
Table Grape (1 t) |
Wine Grape (1 t) |
Wine (1 Bottle) |
|---|---|---|---|---|---|
|
GWP100 |
kg CO2eq |
178 |
220 |
298 |
1.38 |
|
Water depletion |
m3 H2O eq |
139 |
174 |
227 |
1.05 |
|
Land use |
m2 crop eq·yr |
1850 |
2240 |
2650 |
12.3 |
|
Fossil resource scarcity |
kg oil eq |
38 |
45 |
68 |
0.32 |
|
Freshwater eutrophication |
kg P eq |
0.12 |
0.18 |
0.24 |
0.0011 |
|
Human toxicity (non-cancer) |
CTUh |
4.2 × 10⁻⁷ |
6.8 × 10⁻⁷ |
8.1 × 10⁻⁷ |
3.7 × 10⁻⁹ |
2.3. Water Footprint Assessment (WFA)
Water footprint assessment followed the Hoekstra et al. Water Footprint Assessment Manual [2], distinguishing three components:
where Blue WF is surface and groundwater consumed through irrigation (m3/t), Green WF is effective precipitation evapotranspired by the crop (m3/t), and Grey WF is freshwater volume required to dilute pollutant loads (primarily nitrogen from fertilizers) to ambient quality standards, calculated as:
where $$\alpha$$ is the leaching fraction, $${A}_{fert}$$ is the nitrogen application rate (kg/ha), $${c}_{max}$$ is the maximum acceptable concentration, and $${c}_{nat}$$ is the natural background concentration.
Reference evapotranspiration ($$E{T}_{0}$$) was calculated using the FAO-56 Penman–Monteith equation [16]:
where $${R}_{n}$$ is net radiation, $$G$$ is soil heat flux, $$T$$ is mean air temperature, $${u}_{2}$$ is the wind speed at 2 m height, $${e}_{s}-{e}_{a}$$ is the vapour pressure deficit, $$\mathrm{\Delta }$$ is the slope of the saturation vapour pressure curve, and $$\gamma$$ is the psychrometric constant. The blue/green split was derived from a soil water balance using CLIMWAT 2.0 station data for key Turkish provinces.
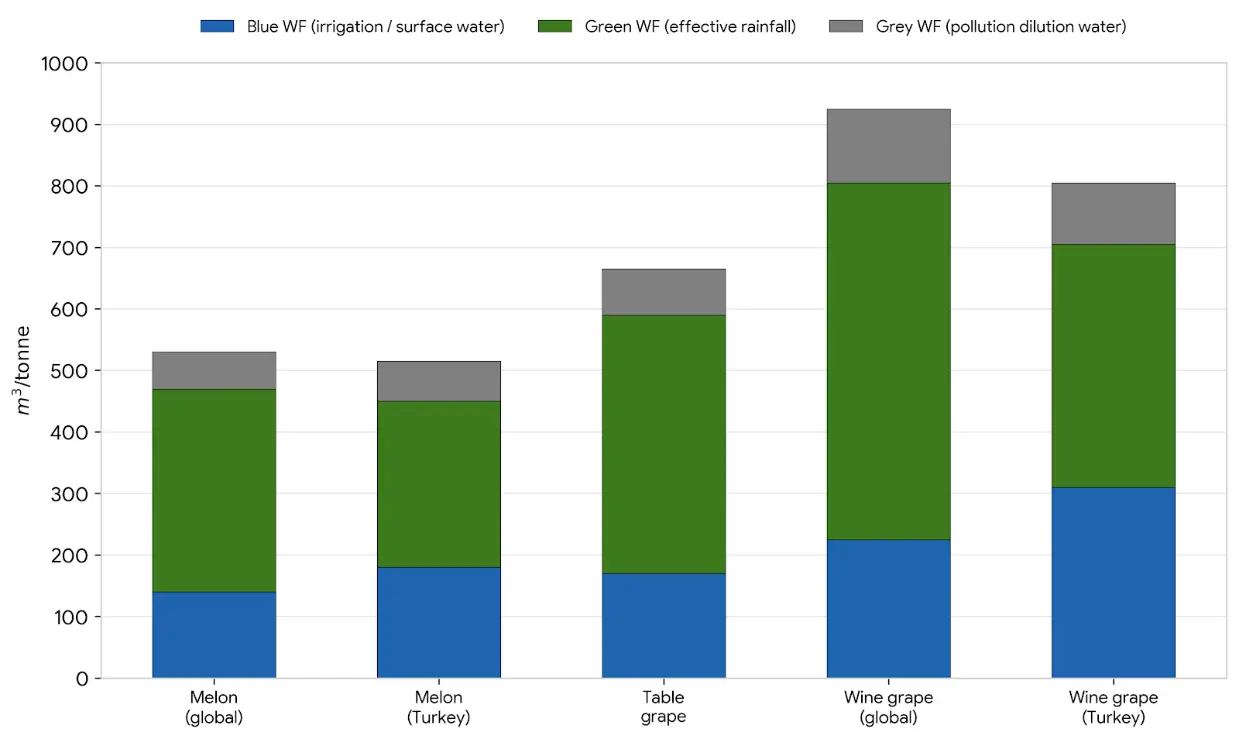
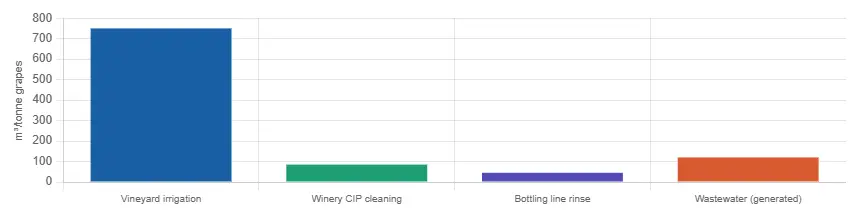
Comparative water footprint data are summarized in Table 2, and component breakdowns by product category are illustrated in Figure 1. Water demand by value chain stage for the wine system is shown in Figure 2.
Table 2. Water footprint components.
|
Product |
Blue WF (m3/t) |
Green WF (m3/t) |
Grey WF (m3/t) |
Total (m3/t) |
Blue Share (%) |
|---|---|---|---|---|---|
|
Melon—global avg |
139 |
334 |
61 |
534 |
26 |
|
Melon—Türkiye avg |
182 |
267 |
68 |
517 |
35 |
|
Table grape—global |
174 |
421 |
71 |
666 |
26 |
|
Wine grape—global |
227 |
579 |
119 |
925 |
25 |
|
Wine grape—Türkiye |
310 |
398 |
98 |
806 |
38 |
2.4. Exergy Analysis
Exergy analysis was conducted following Szargut [17] with reference to the environmental conditions of $${T}_{0}$$ = 25 °C and $${P}_{0}$$ = 101.325 kPa. The second-law (exergy) efficiency for each processing stage is defined as:
and exergy destruction is calculated as:
For the refrigeration subsystem (temperature-control), the exergy input is the electrical work supplied to the compressor, and the useful exergy output is the reversible refrigeration work equivalent. For fermentation, the exergy input encompasses the chemical exergy of glucose ($${ex}_{ch,glucose}$$= 2872 kJ/mol) and the thermal exergy of the fermenter heat load, while the useful exergy output is the chemical exergy of ethanol ($${ex}_{ch,ethanol}$$ = 1367 kJ/mol). Exergy results by winery stage are summarized in Table 3.
Table 3. Exergy analysis summary.
|
Stage |
Energy (MJ/t) |
Share |
Energy Type |
Exergy Eff. (%) |
Ex. Destr. (MJ/t) |
Key Mitigation |
|---|---|---|---|---|---|---|
|
Crushing/destemming |
45 |
5% |
Electrical |
42 |
26 |
VFD blade motors |
|
Fermentation |
120 |
14% |
Thermal + biochem. |
28 |
86 |
Heat recovery; biogas capture |
|
Temperature control |
280 |
32% |
Electrical (refrigeration) |
31 |
193 |
Earthen cellars; night-air cooling |
|
Pumping/transfer |
95 |
11% |
Electrical |
38 |
59 |
Variable-speed drives (VSDs) |
|
Filtration |
85 |
10% |
Electrical + pressure |
45 |
47 |
Membrane optimization |
|
Bottling line |
175 |
20% |
Electrical + compressed air |
52 |
84 |
Lightweight glass; line speed opt. |
|
Wastewater treatment |
65 |
8% |
Electrical |
35 |
42 |
Anaerobic digestion for biogas |
|
Total/weighted avg. |
865 |
100% |
— |
36 |
537 |
— |
2.5. Circular Economy (CE) Scenario and Biorefinery Cascade
The CE framework followed the Ellen MacArthur Foundation butterfly model [18] and the Bonn WEF Nexus framework [1]. By-product generation rates and valorization pathways were compiled from the literature [7,19] and are presented in Table 4. The biorefinery cascade logic prioritizes high-value extraction steps (polyphenols, seed oil) before lower-value thermochemical conversion (bioethanol, anaerobic digestion), consistent with the cascade principle under the ISO 14044 system expansion [14]. The overall WEF nexus flow structure, including circular feedback loops, is shown in Figure 3, and CE valorization flows are mapped in Figure 4.
Table 4. CE valorization pathways.
|
By-Product |
Source |
Generation Rate |
Valorization Pathway |
Yield |
Market (€/kg) |
GHG Credit (kg CO2/t) |
|---|---|---|---|---|---|---|
|
Grape pomace |
Winery |
200–250 kg/t wine |
Bioethanol (SSF process) |
45 kg ethanol/t |
0.55 |
−88 |
|
Grape pomace |
Winery |
200–250 kg/t wine |
Polyphenol extract |
12 kg/t |
15–80 |
−24 |
|
Grape pomace |
Winery |
200–250 kg/t wine |
Anaerobic digestion → biogas |
180 m3 CH4/t |
— |
−145 |
|
Grape seeds |
Winery |
50–100 kg/t pomace |
Cold-press seed oil |
150 l/t seeds |
8–12 |
−35 |
|
Grape stems |
Winery |
60–80 kg/t grapes |
Vermicompost |
680 kg/t |
0.08–0.15 |
−52 |
|
Wine lees |
Winery |
15–20 l/hl wine |
Tartaric acid recovery |
5.2 kg/t wine |
4–6 |
−18 |
|
Melon rind |
Packhouse |
300–400 kg/t melon |
Pectin extraction |
8.5 kg/t rind |
12–20 |
−28 |
|
Melon rind |
Packhouse |
300–400 kg/t melon |
Anaerobic digestion → biogas |
95 m3 CH4/t |
— |
−78 |
|
Melon seeds |
Packhouse |
20–40 kg/t melon |
Cold-press oil/protein flour |
30% oil content |
6–10 |
−15 |
Table 4 shows that anaerobic digestion of grape pomace offers the single largest GHG credit among the nine pathways compiled from the literature [7,19] (−145 kg CO2/t), while pectin extraction from melon rind commands the highest market value per kilogram (€12–20/kg) despite a smaller absolute credit; this value–volume trade-off is what motivates the cascade sequencing described above rather than single-pathway processing.
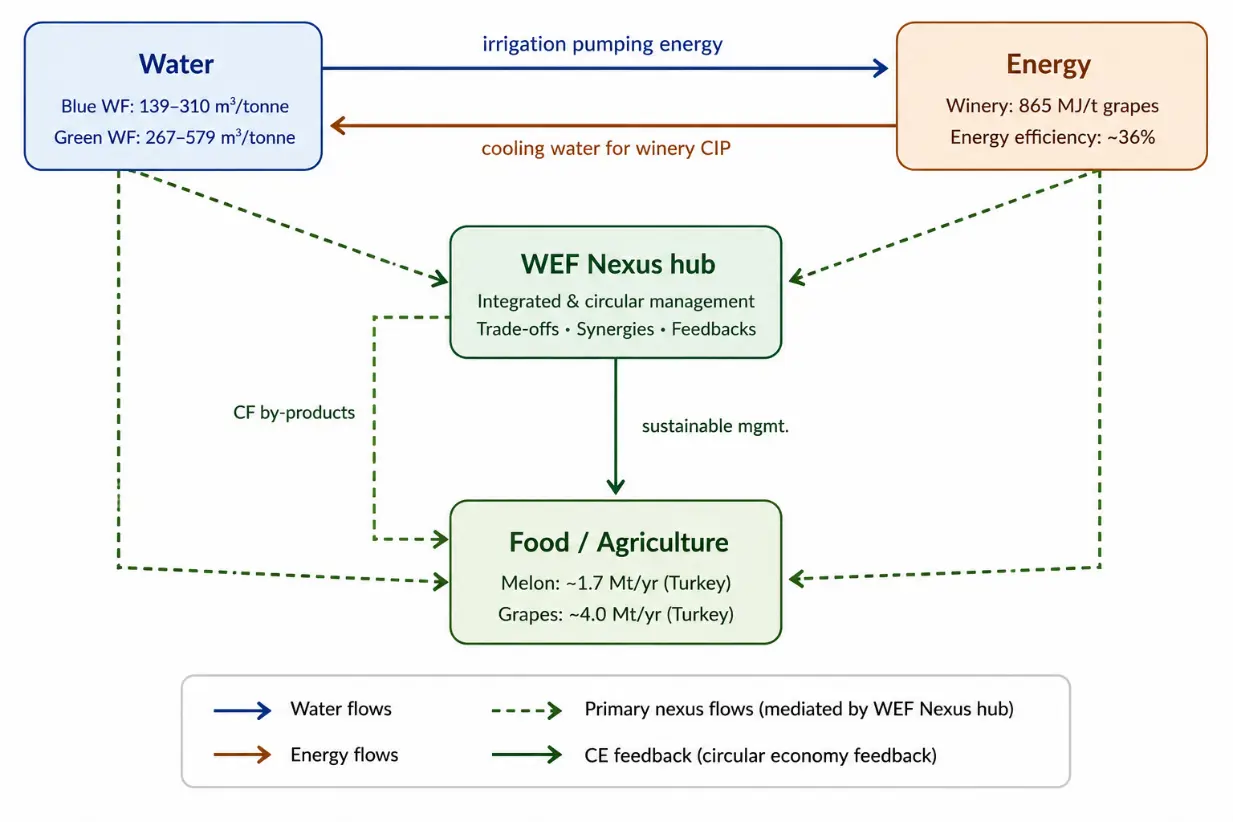
Figure 3 situates these by-product flows within the wider WEF nexus, linking irrigation water and process energy inputs to the melon and grape value chains and closing the loop through the circular feedback pathways summarized in Table 4. Figure 4 then isolates the CE sub-system to detail how each of the four by-product streams is routed to specific high-value product categories.
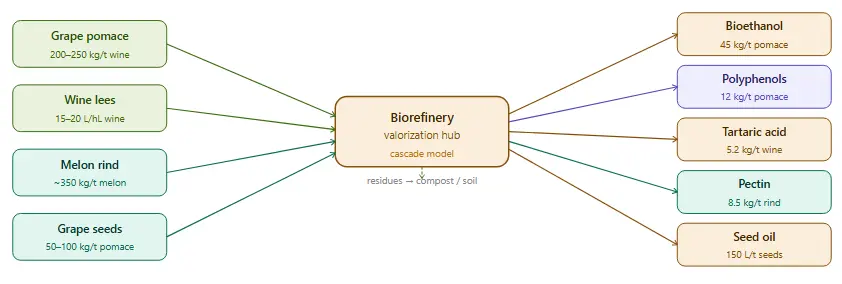
Figure 4. CE valorization flow: four by-product source streams → biorefinery hub → five high-value product categories.
2.6. Variety Characterization
Melon and grape variety data—including botanical classification, water footprint, GWP at farm gate, blue-water share, and flavor/use characteristics—were compiled from TÜİK [4], and the TAGEM landrace catalogue for Turkish varieties [10]. Variety comparison tables are presented as Table 5 (melon) and Table 6 (grape) [6,11].
Table 5. Melon variety comparison.
|
Variety |
Botanical Group |
Origin |
Brix (°) |
WF (m3/t) |
GWP (kg/t) |
Note |
|---|---|---|---|---|---|---|
|
Global commercial varieties |
||||||
|
Honeydew |
Inodorus |
USA/France |
10–14 |
510 |
138 |
Fresh export; long shelf-life |
|
Cantaloupe |
Reticulatus |
USA |
11–14 |
545 |
155 |
Fresh market; IQF processing |
|
Charentais |
Cantalupensis |
France |
12–16 |
558 |
162 |
Premium gastronomy |
|
Galia |
Reticulatus |
Israel |
12–15 |
528 |
148 |
Export hybrid; aromatic |
|
Piel de Sapo |
Inodorus |
Spain |
11–14 |
503 |
131 |
Long shelf-life; export |
|
Hami |
Inodorus |
China (Xinjiang) |
14–18 |
482 |
125 |
Premium; low water FP |
|
Amarillo/Canary |
Inodorus |
Spain |
11–14 |
518 |
143 |
Yellow skin; commercial |
|
Crenshaw |
Inodorus × Cantalupensis |
USA |
11–14 |
524 |
145 |
Hybrid; fresh market |
|
Turkish varieties and landraces (GI-registered or TAGEM-catalogued) |
||||||
|
Kırkağaç 637 |
Reticulatus |
Manisa (Aegean) |
13–17 |
497 |
128 |
GI-registered; premium aroma |
|
Yuva |
Inodorus |
C. Anatolia |
11–14 |
521 |
142 |
Local market dominance |
|
Hasanbey |
Inodorus |
Konya (C. Anatolia) |
12–15 |
514 |
138 |
Regional landrace; firm flesh |
|
Kara Kavun |
Inodorus |
Diyarbakır (SE Anatolia) |
14–18 |
541 |
152 |
Dark skin; landrace; very sweet |
|
Sarı Kavun |
Reticulatus |
Erzincan (E. Anatolia) |
12–14 |
508 |
135 |
Yellow-orange; regional |
|
Ananas Kavun |
Reticulatus |
Aegean |
11–14 |
518 |
141 |
Pineapple aroma; commercial |
|
Doğal Kavun |
Inodorus |
SE Anatolia |
13–16 |
532 |
149 |
Traditional landrace; local use |
|
Kaşıkçı Kavun |
Inodorus |
Çukurova |
12–15 |
509 |
137 |
Spoon melon; seed eaten |
Table 6. Grape variety comparison.
|
Variety |
Color |
Origin |
Primary Use |
WF (m3/t) |
Blue WF% |
Flavor/Character |
|---|---|---|---|---|---|---|
|
International wine varieties |
||||||
|
Cabernet Sauvignon |
Red |
Bordeaux, FR |
Red wine |
870 |
24% |
Full-bodied, tannic, cassis |
|
Merlot |
Red |
Bordeaux, FR |
Red wine |
820 |
21% |
Soft, plummy, medium body |
|
Chardonnay |
White |
Burgundy, FR |
White wine |
760 |
23% |
Full, buttery, tropical |
|
Pinot Noir |
Red |
Burgundy, FR |
Red wine |
840 |
26% |
Light, earthy, red fruits |
|
Syrah/Shiraz |
Red |
Rhône, FR |
Red wine |
810 |
25% |
Spicy, bold, dark fruits |
|
Tempranillo |
Red |
Rioja, ES |
Red wine |
740 |
19% |
Medium, leathery, cherry |
|
Sangiovese |
Red |
Tuscany, IT |
Red wine |
800 |
22% |
High acid, cherry, herbal |
|
Riesling |
White |
Mosel, DE |
White wine |
690 |
18% |
Aromatic, crisp, petrol |
|
Grenache |
Red |
Rioja, ES |
Red wine/blend |
780 |
23% |
Fruity, herbal, medium |
|
Sauvignon Blanc |
White |
Loire, FR |
White wine |
720 |
20% |
Grassy, citrus, crisp |
|
Turkish indigenous varieties (Vitis vinifera)—>80 catalogued cultivars |
||||||
|
Öküzgözü |
Red |
Elazığ, E. Anatolia |
Red wine |
750 |
41% |
Soft, ruby, cherry aromas |
|
Boğazkere |
Red |
Diyarbakır, SE Anatolia |
Red wine |
780 |
40% |
Deeply tannic, robust, spicy |
|
Narince |
White |
Tokat, C. Anatolia |
White wine |
720 |
33% |
Floral, mineral, peach |
|
Emir |
White |
Nevşehir, Cappadocia |
White wine |
700 |
31% |
Crisp, citrus, high acid |
|
Kalecik Karası |
Red |
Ankara, C. Anatolia |
Red wine |
745 |
38% |
Aromatic, elegant, raspberry |
|
Sultani Çekirdeksiz |
White |
Manisa, Aegean |
Table/raisin |
680 |
27% |
Sweet, seedless, world export |
|
Papazkarası |
Red |
Tekirdağ, Thrace |
Red wine |
710 |
22% |
Light, fruity, Thracian style |
|
Bornova Misketi |
White |
İzmir, Aegean |
Muscat/table |
695 |
28% |
Muscat, intensely fragrant |
|
Hasandede |
White |
Kırşehir, C. Anatolia |
Table grape |
650 |
29% |
Sweet, low acid, thin skin |
|
Tilki Kuyruğu |
Red |
Malatya, E. Anatolia |
Table grape |
660 |
35% |
Elongated cluster, sweet |
3. Results
3.1. Variety Characteristics and Water Footprint by Cultivar
The analysis of melon and grape cultivars revealed substantial within-crop variation in both water footprint and GWP (Table 5 and Table 6). Among melon varieties, total water footprints ranged from 482 m3/t (Hami, China) to 558 m3/t (Charentais, France). Turkish landraces showed intermediate values, with Kırkağaç 637—the GI-registered premium variety of Manisa—recording one of the lowest footprints among Turkish cultivars at 497 m3/t and the lowest GWP at 128 kg CO2eq/t, comparable to internationally competitive varieties such as Hami. By contrast, Kara Kavun (Diyarbakır) showed the highest water footprint among Turkish melons at 541 m3/t and GWP of 152 kg/t, reflecting the more arid conditions and greater irrigation demand of southeastern Anatolia. Across all eighteen Turkish and international melon varieties in Table 5, GWP and total water footprint were strongly co-located: the three cultivars with the lowest water footprints (Hami, Kırkağaç 637, and Piel de Sapo, all below 510 m3/t) also recorded the three lowest GWP values, suggesting that irrigation-linked pumping energy is a shared driver of both indicators rather than two independent burdens.
For grape varieties (Table 6), total water footprints ranged from 650 m3/t (Hasandede) to 870 m3/t (Cabernet Sauvignon). A defining distinction of Turkish indigenous wine varieties was their elevated blue-water share: Öküzgözü (Elazığ) and Boğazkere (Diyarbakır) recorded blue-water fractions of 41% and 40%, respectively, against an international wine grape average of approximately 22%. This reflects the strong irrigation dependency of eastern and southeastern Anatolian viticulture, where green water availability is constrained by precipitation seasonality.
3.2. Water Footprint Components by Product Category
Aggregated water footprint data across five product categories are presented in Table 2 and illustrated by component in Figure 1. Turkish wine grapes showed a markedly higher blue-water share (38%) compared to the global wine grape average (25%), while their total WF (806 m3/t) was somewhat lower than the global average (925 m3/t), owing to more efficient green water utilization during the growing season. Turkish melons showed a comparable pattern: higher blue-water share (35% vs. 26% global) but slightly lower total WF (517 vs. 534 m3/t), driven by concentration of production in regions with moderate growing-season precipitation.
Grey-water footprint was highest for wine grapes (119 m3/t globally; 98 m3/t Türkiye), reflecting nitrogen-intensive fertilization practices driven by yield-quality trade-offs in viticulture. The winery stage adds significant process water demand through CIP operations (55–80 l/hl wine), generating wastewater with COD of 1000–15,000 mg/l, as shown in Figure 2. Vineyard irrigation dominates total water consumption at 93% of the chain total.
Expressed as a share of total water footprint rather than in absolute terms, grey-water contribution was remarkably consistent across products and geographies: 13.2% for Turkish melon, 12.9% for global wine grapes, and 12.2% for Turkish wine grapes (Table 2). This convergence, despite an almost twofold difference in absolute grey-water volumes between melon and wine grapes, indicates that nitrogen-dilution requirements scale roughly in proportion to total crop water demand across both value chains, rather than wine grapes carrying a disproportionate grey-water burden once normalized.
3.3. LCA Midpoint Results
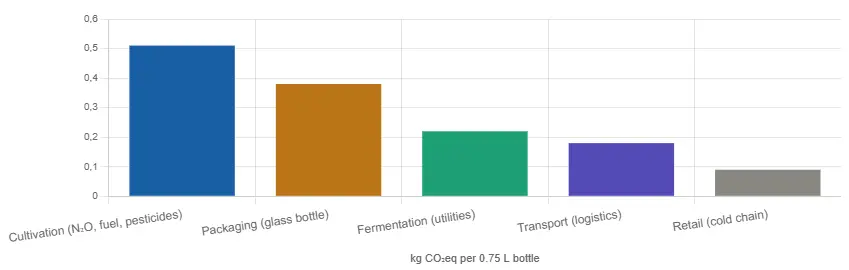
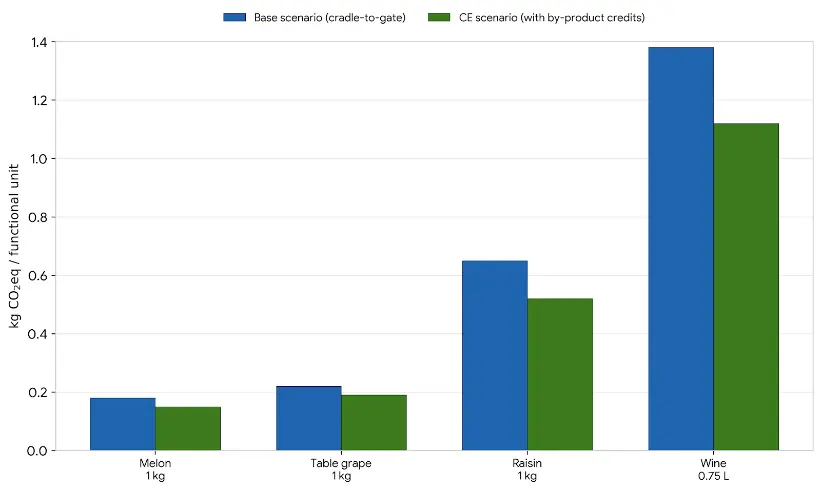
Full LCA midpoint results across six impact categories (ReCiPe 2016-H) are presented in Table 1. Wine grapes showed the highest GWP at farm gate (298 kg CO2eq/t), approximately 68% higher than melon (178 kg/t), primarily due to the greater energy input requirements of quality-driven viticulture (mechanized canopy management, pesticide applications, irrigation pumping). At the functional unit of a 0.75 L wine bottle, the base-case GWP was 1.38 kg CO2eq, consistent with the range reported by Rugani et al. [3] and Notarnicolia et al. [8] for European wines. Carbon footprint hotspot analysis (Figure 5) identified cultivation (37%) as the dominant stage, with glass packaging (28%) and transport (13%) following. Under the CE scenario, the wine bottle GWP fell to 1.12 kg CO2eq (−19%), driven primarily by the pomace bioethanol credit (−88 kg CO2/t pomace) and anaerobic digestion credit (−145 kg CO2/t pomace).
The remaining ReCiPe midpoint categories in Table 1 display a consistent ranking across products, with wine grapes exceeding table grapes and melon in every category. Land use per tonne was highest for wine grapes (2650 m2 crop-eq·yr), 43% above melon (1850 m2 crop-eq·yr), reflecting the lower per-hectare yield typical of quality-oriented viticulture relative to intensive melon cultivation. Freshwater eutrophication followed the same pattern (0.24 vs. 0.12 kg P eq/t for wine grapes and melon, respectively—a two-fold difference), consistent with the higher nitrogen application rates associated with grape-quality management, as referenced in Section 2.3. Human toxicity (non-cancer) was three orders of magnitude lower for the bottled-wine functional unit (3.7 × 10⁻⁹ CTUh) than for any farm-gate tonne-based unit, a scale effect arising from the functional-unit mass difference (0.75 L bottle vs. 1 t) rather than a genuine reduction in toxicity intensity per unit mass.
The GWP comparison across base and CE scenarios for all functional units is shown in Figure 6. Raisins exhibited the highest relative CE benefit (−19.4%) owing to the large by-product streams available from the drying process.
3.4. Winery Energy and Exergy Analysis
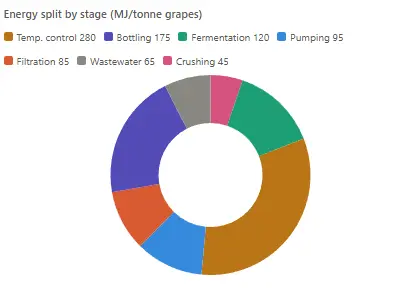
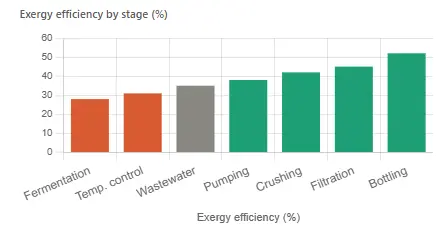
Total cumulative energy demand (CED) for winemaking was 865 MJ/t grapes. Temperature-controlled fermentation and storage dominated the energy balance (280 MJ/t; 32%), followed by the bottling line (175 MJ/t; 20%), as detailed in Table 3. The overall second-law (exergy) efficiency of the winery was 36%, indicating that 537 MJ/t of exergy—equivalent to 62% of total exergy input—was destroyed through irreversibilities.
Fermentation recorded the lowest stage-level exergy efficiency (28%), a consequence of the thermodynamic irreversibility of the biochemical sugar-to-ethanol conversion, in which the Gibbs free energy change (ΔG ≈ −226 kJ/mol) is dissipated as heat rather than captured as work. Temperature-control refrigeration, despite being the largest energy consumer, achieved a slightly higher exergy efficiency (31%) but contributed the single largest absolute exergy destruction (193 MJ/t), because mechanical work (compressor electricity) is used to move heat across a finite temperature gradient—an inherently irreversible process. These findings are consistent with Genç et al. [9], who reported similar second-law efficiencies for temperature-control subsystems in Italian wineries (Figure 7).
Passive mitigation (earthen cellars, night-air free-cooling) can reduce refrigeration CED by 35–50% in semi-arid continental climates. Heat recovery from exothermic fermentation (ΔH ≈ −100 kJ/mol ethanol; total 35–45 MJ/t grapes) can pre-heat CIP water, directly linking energy savings to grey-water load reduction—a textbook WEF nexus co-benefit.
The remaining winery stages in Table 3 followed a broadly consistent pattern of higher exergy efficiency for predominantly mechanical/electrical operations relative to thermally or biochemically driven ones: the bottling line achieved the highest stage-level exergy efficiency (52%), aided by the largely mechanical nature of filling, capping, and compressed-air handling, while crushing/destemming (42%) and filtration (45%) fell in an intermediate range. Pumping and transfer operations, despite comprising only 11% of total energy demand, destroyed 59 MJ/t through throttling and friction losses recoverable in part through variable-speed drives, and wastewater treatment—the smallest energy consumer at 8% of the total—nonetheless destroyed 42 MJ/t at a comparatively low 35% efficiency, indicating scope for anaerobic digestion of the treatment stream itself to capture some of this loss as biogas (Table 4).
3.5. Circular Economy—By-Product Valorization
By-product streams from both value chains and their valorization yields, market values, and GHG avoidance credits are compiled in Table 4, and the CE flow is mapped in Figure 4. The highest single-pathway GHG credit was anaerobic digestion of grape pomace (−145 kg CO2/t), followed by pomace bioethanol (−88 kg CO2/t). For the melon chain, anaerobic digestion of rind offered the largest credit (−78 kg CO2/t rind), while pectin extraction generated the highest market value (€12–20/kg). The optimal cascade sequence—seed oil pressing → polyphenol extraction → bioethanol SSF → anaerobic digestion of stillage → compost of digestate—captures approximately three times the value of single-pathway processing.
Scaled to Türkiye’s estimated 600,000 t/yr pomace generation (Section 4.4), the anaerobic-digestion pathway alone (−145 kg CO2/t, Table 4) corresponds to an indicative national mitigation potential on the order of 8.7 × 10⁴ t CO2/yr, underscoring the national-scale relevance of the by-product pathways quantified in Table 4, even before accounting for the additional bioethanol and polyphenol credits captured under the full cascade.
4. Discussion
4.1. Water Footprint in Context
The blue-water share of Turkish wine grapes (38–41%) substantially exceeds the global average for the category (~25%) documented by Hoekstra and Mekonnen [11] and Vanham et al. [12], confirming that the semi-arid Anatolian viticulture model is significantly more irrigation-dependent than its Mediterranean or Atlantic-climate counterparts. This has direct implications for water scarcity risk: Aldaya et al. [20] demonstrate that blue-water consumption in water-scarce basins carries a substantially greater environmental cost than equivalent green-water consumption. The Euphrates–Tigris headwaters region, which supplies groundwater to Elazığ and Diyarbakır vineyards, is classified as a high water-stress area by FAO AQUASTAT, making the elevated blue-water share of Öküzgözü and Boğazkere cultivation a priority management issue.
For melon, the Turkish WF (517 m3/t) compares favourably to the global average (534 m3/t) reported by Hoekstra and Mekonnen [11], despite higher blue-water dependence. This reflects the concentration of Turkish melon production in Aegean and central Anatolian regions with moderate growing-season precipitation, consistent [6], who found that irrigation scheduling substantially determines the green-to-blue water ratio in Mediterranean cucurbit systems. Water use efficiency studies in the Harran Plain [5] further corroborate the sensitivity of melon WF to irrigation method: drip irrigation reduces blue-water consumption by 30–45% relative to furrow irrigation, though at the cost of 35–55 kWh/ha additional pumping energy—a direct WEF trade-off requiring nexus-aware decision-making.
4.2. Carbon Footprint and LCA Comparison
The base-case wine bottle GWP of 1.38 kg CO2eq/0.75 L falls within, but toward the upper range of, values reported for Turkish and Mediterranean wine systems. Rugani et al. [3] report a range of approximately 0.99–2.85 kg CO2eq per bottle across European and global case studies, with glass packaging consistently identified as the second-largest hotspot regardless of geography. This study’s packaging contribution (28%) is consistent with Notarnicolia et al. [8], who found packaging to account for 23–31% of wine LCA GWP depending on bottle weight. The implication is clear: lightweight glass (420 g vs. 550 g standard) combined with high recycled cullet content (≥60%) represents one of the most actionable decarbonization levers available to Turkish wineries, independently of vineyard management changes.
The CE scenario reduction of 19% (1.38 → 1.12 kg CO2eq) is comparable to circular economy gains reported by Devesa-Rey et al. [7] for Spanish wineries that apply pomace valorization, though our cascade approach, incorporating polyphenol extraction ahead of fermentation, captures additional value not modeled in single-pathway studies.
For melon, comparable published carbon footprint benchmarks remain scarce. Figueirêdo et al. [21] reported a substantially higher carbon footprint of 710 kg CO2eq/t for Brazilian yellow melon destined for European export markets—roughly four times the 178 kg CO2eq/t farm-gate value obtained here for Turkish melon. This gap is attributable primarily to system-boundary differences rather than production inefficiency: the Brazilian figure incorporates packing materials and long-haul export transport to the United Kingdom and the Netherlands, whereas the present farm-gate functional unit excludes post-harvest logistics. Figueirêdo et al. [21] identify nitrogen fertilization and irrigation-related energy as the dominant GWP hotspots for melon production, consistent with the irrigation-intensive Turkish melon regions characterized in Section 2.1 and the pumping-energy trade-offs noted in Section 4.1. This relative scarcity of melon-specific carbon footprint literature—compared with the comparatively well-studied wine sector [3,8]—reinforces the contribution of the present study in extending quantitative WEF nexus and LCA evidence to an under-represented cucurbit value chain.
4.3. Exergy Analysis and Energy Quality
Genç et al. [9] provide the most directly comparable exergy dataset for winery operations, reporting second-law efficiencies of 29–34% for temperature-control systems in northern Italian wineries—consistent with the 31% obtained here. The lower fermentation exergy efficiency found in this study (28% vs. approximately 32% reported for optimized fermenters with heat recovery in [9]) reflects the absence of heat recovery in the Turkish baseline scenario. This gap identifies fermentation heat integration as a priority intervention: recovering 35–45 MJ/t of fermentation heat for CIP pre-heating would simultaneously improve exergy efficiency and reduce process water heating energy, directly benefiting both the energy and water dimensions of the WEF nexus.
The exergy-based approach adopted here follows the broader methodological consensus around exergetic indicators as a sustainability assessment tool for the food and beverage sector [22]. Among the few facility-level exergy studies of winemaking, Genc et al. [9] analysed a red wine production line and reported energetic and exergetic efficiencies of 57.2% and 41.8%, respectively—a second-law efficiency moderately above the 36% obtained here—and identified the open fermenter as the single largest site of exergy destruction in their system. This is a striking point of convergence with the present findings, in which fermentation likewise emerged as the least exergy-efficient stage (28%, Table 3), reinforcing that the thermodynamic penalty of biochemical sugar-to-ethanol conversion is a structural feature of winemaking rather than an artefact of the Turkish baseline scenario modelled here.
4.4. Circular Economy and Turkish Policy Context
Despite Türkiye’s estimated annual grape pomace generation of approximately 600,000 tonnes, formal biorefinery infrastructure remains nascent, with most pomace currently landfilled or used as low-value animal feed. This contrasts sharply with the situation in Spain and Italy, where tartaric acid distilleries, pomace distilleries (producing marc brandy), and polyphenol extraction facilities are well-established industrial ecosystems [7,19]. The valorization pathways quantified here—particularly tartaric acid recovery (€4–6/kg product; −18 kg CO2/t wine) and polyphenol extraction (€15–80/kg)—could displace significant imports currently sourced from Southern European producers. Türkiye’s Green Deal adaptation pathway (2024–2030) presents a policy window to incentivize such investments, aligned with the EU Taxonomy criteria for sustainable agro-industrial activities.
Magalhães and Oliveira [23], in a 2026 review of grape pomace valorization, similarly identify polyphenol extraction and bioenergy recovery (anaerobic digestion, bioethanol, biomass pelletization) among the most industrially advanced valorization pathways, while cautioning that regulatory harmonization across wine-producing regions—rather than extraction technology alone—remains a key bottleneck to large-scale industrial deployment. This aligns with the Turkish policy gap identified above: several of the pathways quantified in Table 4 are already commercially established in Spain and Italy [7,19], suggesting that institutional and infrastructural barriers, rather than technological ones, are the primary constraint on Turkish uptake.
More broadly, this pattern of concentrated WEF nexus scholarship is documented at the European scale: Rezaei Kalvani and Celico [24], reviewing WEF nexus studies across 27 European countries, found that Spain and Italy—both semi-arid, irrigation-dependent Mediterranean economies—account for a disproportionate share of the published nexus literature. Türkiye shares this semi-arid, irrigation-dependent agricultural profile but falls outside the EU-27 scope of that review, illustrating a geographic gap in the WEF nexus literature that the present integrated assessment of Turkish melon and grape value chains helps to address.
5. Conclusions
This study demonstrates that a simultaneous WEF nexus, LCA, water footprint, and exergy analysis framework provides substantially richer and more actionable insights than any single methodology applied in isolation. The principal findings are: (1) Turkish viticulture is disproportionately blue-water intensive relative to global benchmarks, representing a material sustainability risk in water-scarce eastern Anatolian basins; (2) cultivation and glass packaging together account for 65% of wine chain GWP, with readily available technical solutions (lightweight glass, recycled cullet, precision N-fertilization) capable of significantly reducing both; (3) winery exergy efficiency is low (36% overall), with temperature control and fermentation representing the highest-priority targets for improvement; and (4) a full biorefinery cascade applied to grape pomace and melon rind can reduce GWP by up to 19% while generating significant economic co-benefits.
Several methodological limitations should be acknowledged when interpreting these findings. First, this is a literature- and database-informed nexus assessment rather than one grounded in new primary field metering: LCA background data draw on the ecoinvent v3.9 database, and exergy and water-balance parameters are drawn from published literature and national statistics (Section 2.1), so results inherit the uncertainty and temporal lag of those secondary sources and may not fully capture site-specific variability among individual Turkish farms and wineries. Second, no formal uncertainty or sensitivity analysis (e.g., Monte Carlo propagation of input parameter ranges) was conducted; the values reported in Table 1, Table 2, Table 3 and Table 4 should therefore be interpreted as central, literature-consistent estimates rather than statistically bounded results. Third, the analysis represents a static, single-year snapshot that does not capture interannual climate variability, which is particularly relevant for blue-water-dependent regions such as Elazığ and Diyarbakır, where irrigation demand fluctuates with precipitation anomalies. Fourth, the winery exergy analysis uses literature-typical process parameters rather than site-metered energy data from a specific Turkish winery, and the circular economy credits in Table 4 assume literature-reported valorization yields that have not yet been demonstrated at commercial scale within Türkiye; realized performance may therefore differ once these pathways are deployed locally. Finally, the water footprint values are not weighted by local water-scarcity indices, so the comparative severity of water consumption across regions with differing baseline water stress is likely understated for the most arid basins—a gap addressed by the AWARE-weighting extension proposed below.
Several avenues warrant investigation in future work. First, a cradle-to-grave extension of the system boundary to include distribution, retail refrigeration, consumer handling, and end-of-life glass recycling would provide a more complete GWP and water depletion profile, particularly for export-oriented wines where transport emissions are material. Second, spatially resolved water scarcity weighting (using AWARE or similar characterization factors) should be applied to the Turkish blue-water footprints, as the current grey-area of treating m3 consumed in Elazığ the same as m3 consumed in Thrace significantly underestimates the relative scarcity impact of eastern Anatolian irrigation. Third, techno-economic and life cycle costing (LCC) analysis of the proposed biorefinery cascade is needed to identify the commercially viable valorization pathway combinations under Turkish market conditions. Fourth, the potential of solar-powered drip irrigation to simultaneously reduce both blue-water consumption and energy-related GWP should be evaluated as a coupled nexus intervention across the major Turkish melon and grape production regions. Finally, variety-level comparative LCA of Turkish indigenous cultivars versus international varieties—particularly comparing Öküzgözü/Boğazkere against Cabernet Sauvignon under equivalent growing conditions—would provide actionable guidance for variety selection decisions aimed at minimizing the combined environmental footprint of the Turkish wine sector.
Statement of the Use of Generative AI and AI-Assisted Technologies in the Writing Process
During the preparation of this article, the author(s) used the ChatGPT (OpenAI) tool/service for language formatting. After using this tool/service, the author(s) reviewed and edited the content as needed and are fully responsible for the content of the published article.
Ethics Statement
Not applicable.
Informed Consent Statement
Not applicable.
Data Availability Statement
The data used in this study were obtained from the Turkish Statistical Institute (TÜİK) database.
Funding
This research received no external funding.
Declaration of Competing Interest
The author declares that he has no known competing financial interests or personal relationships that could have appeared to influence the work reported in this paper.
References
- Hoff H. Understanding the Nexus: Background Paper for the Bonn 2011 Conference—The Water, Energy and Food Security Nexus; Stockholm Environment Institute (SEI): Stockholm, Sweden, 2011. [Google Scholar]
- Hoekstra AY, Chapagain AK, Aldaya MM, Mekonnen MM. The Water Footprint Assessment Manual: Setting the Global Standard; Earthscan: London, UK, 2011. [Google Scholar]
- Rugani B, Vázquez-Rowe I, Benedetto G, Benetto E. A comprehensive review of carbon footprint analysis as an extended environmental indicator in the wine sector. J. Clean. Prod. 2013, 54, 61–77. DOI:10.1016/j.jclepro.2013.04.036 [Google Scholar]
- TÜİK. Bitkisel Üretim İstatistikleri—Crop Production Statistics. Available online: https://www.tuik.gov.tr (accessed on 1 May 2026).
- Aydogdu MH, Karli B, Parlakci Dogan H, Sevinc G, Eren ME, Kucuk N. Economic Analysis of Agricultural Water Usage Efficiency in the GAP-Harran Plain: Cotton Production Sampling, Sanliurfa-Turkey. Int. J. Adv. Agric. Sci. 2018, 3, 12–19. Available online: https://www.semanticscholar.org/paper/Economic-Analysis-of-Agricultural-Water-Usage-in-Aydo%C4%9Fdu-Karl%C4%B1/21bf57b8520702b88a36fe82bcf2dc15bc957423 (accessed on 1 May 2026).
- Cabello MJ, Castellanos MT, Romojaro F, Martinez-Madrid C, Ribas F. Yield and quality of melon grown under different irrigation and nitrogen rates. Agric. Water Manag. 2009, 96, 866–874. DOI:10.1016/j.agwat.2008.11.006 [Google Scholar]
- Devesa-Rey R, Vecino X, Varela-Alende JL, Barral MT, Cruz JM, Moldes AB. Valorization of winery waste vs. the costs of not recycling. Waste Manag. 2011, 31, 2327–2335. DOI:10.1016/j.wasman.2011.06.001 [Google Scholar]
- Notarnicola B, Tassielli G, Nicoletti GM. 17-Life cycle assessment (LCA) of wine production. In Environmentally-Friendly Food Processing, Woodhead Publishing Series in Food Science, Technology and Nutrition; Woodhead Publishing: Delhi, India, 2003; pp. 306–326. DOI:10.1533/9781855737174.2.306 [Google Scholar]
- Genç M, Genç S, Goksungur Y. Exergy analysis of wine production: Red wine production process as a case study. Appl. Therm. Eng. 2017, 117, 511–521. DOI:10.1016/j.applthermaleng.2017.02.009 [Google Scholar]
- Morgounov A, Keser M, Kan M, Küçükçongar M, Özdemir F, Gummadov N, et al. Wheat landraces currently grown in Turkey: Distribution, diversity, and use. Crop Sci. 2016, 56, 3112–3124. DOI:10.2135/cropsci2016.03.0192 [Google Scholar]
- Hoekstra AY, Mekonnen MM. The water footprint of humanity. Proc. Natl. Acad. Sci. USA 2012, 109, 3232–3237. DOI:10.1073/pnas.1109936109 [Google Scholar]
- Vanham D, Hoekstra AY, Wada Y, Bouraoui F, de Roo A, Mekonnen MM, et al. Physical water scarcity metrics for monitoring progress towards SDG target 6.4: An evaluation of indicator 6.4.2 “Level of water stress”. Sci. Total Environ. 2018, 613–614, 218–232. DOI:10.1016/j.scitotenv.2017.09.056 [Google Scholar]
- ISO 14040:2006; Environmental Management—Life Cycle Assessment—Principles and Framework. ISO: Geneva, Switzerland, 2006. [Google Scholar]
- ISO 14044:2006; Environmental Management—Life Cycle Assessment—Requirements and Guidelines. ISO: Geneva, Switzerland, 2006. [Google Scholar]
- Huijbregts MAJ, Steinmann ZJN, Elshout PMF, Stam G, Verones F, Vieira M, et al. ReCiPe 2016: A harmonised life cycle impact assessment method at midpoint and endpoint level. Int. J. Life Cycle Assess 2017, 22, 138–147. DOI:10.1007/s11367-016-1246-y [Google Scholar]
- Allen RG, Pereira LS, Raes D, Smith M. FAO Irrigation and Drainage Paper 56: Crop Evapotranspiration—Guidelines for Computing Crop Water Requirements; FAO: Rome, Italy, 1998. [Google Scholar]
- Szargut J. Exergy Method: Technical and Ecological Applications; WIT Press: Southampton, UK, 2005. [Google Scholar]
- Ellen MacArthur Foundation. Towards the Circular Economy: Economic and Business Rationale for an Accelerated Transition; EMF: Cowes, UK, 2013; Volume 1. [Google Scholar]
- Kokkinomagoulos E, Kandylis P. Sustainable wine fining: Evaluating grape pomace as a natural alternative to commercial agents. Beverages 2025, 11, 31. DOI:10.3390/beverages11020031 [Google Scholar]
- Aldaya MM, Chapagain AK, Hoekstra AY, Mekonnen MM. The Water Footprint of Food; Routledge: London, UK, 2020. [Google Scholar]
- Brito de Figueirêdo MC, Kroeze C, Potting J, da Silva Barros V, Sousa de Aragão FA, Gondim RS, et al. The carbon footprint of exported Brazilian yellow melon. J. Clean. Prod. 2013, 47, 404–414. DOI:10.1016/j.jclepro.2012.09.015 [Google Scholar]
- Zisopoulos FK, Rossier-Miranda FJ, van der Goot AJ, Boom RM. The use of exergetic indicators in the food industry—A review. Crit. Rev. Food Sci. Nutr. 2017, 57, 197–211. DOI:10.1080/10408398.2014.975335 [Google Scholar]
- Magalhães R, Oliveira MBPP. Grape pomace valorization: Extraction of bioactive compounds and industrial applications within a circular economy framework. Sustainability 2026, 18, 5663. DOI:10.3390/su18115663 [Google Scholar]
- Rezaei Kalvani S, Celico F. The water–energy–food nexus in European countries: A review and future perspectives. Sustainability 2023, 15, 4960. DOI:10.3390/su15064960 [Google Scholar]