
Energy Effectiveness and Economic Competitiveness of Two Emerging Solar Space Heating Technologies

Energy Effectiveness and Economic Competitiveness of Two Emerging Solar Space Heating Technologies
Viorel Badescu
1,2,*

Received: 18 May 2026 Revised: 17 June 2026 Accepted: 06 July 2026 Published: 29 July 2026

© 2026 The authors. This is an open access article under the Creative Commons Attribution 4.0 International License (https://creativecommons.org/licenses/by/4.0/).
1. Introduction
Solar space heating is usually accomplished by using flat-plate or low-concentration solar collectors. About 87% of solar heating applications involve the traditional technology based on solar water collectors ([1], p. 18). While solar water collector technology has reached maturity, opportunities to enhance its performance further still exist [2]. Another traditional technology, involving solar air collectors, is very often found in applications in North America, Japan, and China, but is less used in Europe ([1], p. 44).
Several new solar space-heating technologies have been promoted in recent years. One of these emerging technologies consists of heat pumps driven by PV cells ([1], p. 39). A good review paper on heat pumps assisted by PV cells is [3], where combinations between heat pumps and solar collectors are also considered. Applications consist of supplying municipalities with district heating and sometimes involve combined heat and power units to be used during those periods when the PV system cannot provide the necessary electricity. Another new solar space heating technology consists of photothermal collectors coupled with heat extractors [4]. A heat extractor is a device that extracts heat from one or more sources and provides it to a user. Generally, it consists of a combination of direct and reverse thermal machines, including a heat pump as a particular case. Solar heating based on radiation energy converters made of semiconductor materials and different heat extractor configurations is considered in [4]. In the ideal case, the heat extractor technology may provide about 470% to 560% more heat per unit of collection surface area than traditional solar photothermal heating. When the present-day performance of heat engines and heat pumps is considered, this range of values decreases to about 260% to 300%. Common metallic photothermal collectors have been studied in [5], demonstrating that their combination with the heat extractor technology yields significantly improved heating performance. Numerical examples show that it is possible to obtain more than 50% more heat per unit surface area than conventional solar selective collectors may provide.
A comparison is presented here between the energy performance of traditional and emerging solar space heating technologies. The objective is not to analyze if solar space heating is advantageous in respect with classical space heating using fuels. The assumption is that solar space heating is wanted, and the objective is to find which of the different technologies is more advantageous when used to cover the heating need (the thermal load) of a given building. The structure of the paper is complex, and the approach has been simplified to a very large extent. Creating a detailed model that covers the multitude of technical comparisons within a dynamically changing pricing framework would result in a massive construct, which would be highly difficult to design and present within a limited number of pages. This simplification has allowed us—at the cost of a reduced degree of specificity—to cover a large number of possible scenarios within a relatively confined editorial space.
The traditional and emerging solar space heating technologies are shortly presented in Section 2, and their implementation is shown in Section 3. The application is performed by using the meteorological and radiometric database presented in Section 4. A comparison between solar space heating technologies is performed in Section 5. The analysis is made per unit solar energy collection surface area. First, the capacity of solar air collectors to replace solar water collectors for space heating is analyzed. Next, the capacity of the emerging technologies based on PV-driven heat pumps and solar heat extractors to replace the traditional technologies is discussed. Finally, a crude economic analysis is presented. Section 6 contains the conclusions.
2. Traditional and Emerging Solar Space Heating Technologies
Several solar space heating technologies are treated next. First, there is traditional space heating using photothermal solar collectors (PT technology), which serves as the reference. Second, the emerging solar space heating technology based on photothermal solar collectors and heat extractors (PT+Hext technology) is considered. Third, there is the solar space heating technology based on heat pumps driven by photovoltaic solar cells (PV+HP technology). The paper is complex because it covers both technical modeling and economic modeling, focusing on two emerging technologies and three conventional solar technologies. Furthermore, the PV+HP technology itself encompasses four sub-technologies. One-to-one cross-comparison of this multitude of technologies, from both technical and economic perspectives, results in a complex structure. Therefore, in order to help the reader, Table 1 provides the number of the sections containing information relevant for different solar space heating technologies, including the sections where the performance of each technology is evaluated.
Table 1. The number of sections containing information relevant for different solar space heating technologies. PT—technology based on water (w) or air (a) photothermal solar collectors. PT+Hext—technology based on photothermal solar collectors and heat extractors. PV+HP—technology based on heat pumps driven by photovoltaic solar cells.
|
Technology |
Model |
Implementation |
Energy Performance |
Economic Comparison |
|---|---|---|---|---|
|
PT |
2.1 |
3.1 (3.1.1—PTw) (3.1.2—PTa) |
5.1.1 (comparison PTa vs. PTw) 5.1.3 (comparison with PV+HP) 5.1.5 (comparison with PT+Hext) |
5.2.1 (comparison PTa vs. PTw) |
|
PT+Hext |
2.2 |
3.2 |
5.1.4 (comparison with PT) 5.1.5 (comparison with PV+HP) |
5.2.3 (comparison with PT) |
|
PV+HP |
2.3 |
3.3 |
5.1.2 (HP driven by different PV cells) |
5.2.2 (comparison with PT) |
The basic performance indicators of these technologies are presented in the following.
2.1. Solar Space Heating Based on Photothermal Collectors (PT Technology)
The photothermal solar collector array has a surface area Ac. The collector surface, which absorbs solar energy and becomes hotter than the environment, constitutes a heat source for the working fluid. The temperature of the collector surface and the working fluid temperature increase in the direction of fluid flow, with the first temperature being always larger than the former temperature. The working fluid enters the collector array at temperature Tf,i and exits at temperature Tf,e by carrying a useful heat flux QPT which is supplied to the user. The photothermal collector efficiency εPT is defined as:
where Isol is the solar global irradiance at the level of the collectors’ array surface. Therefore, the main extensive and intensive performance indicators of the PT technology are QPT and εPT, respectively.
2.2. Solar Space Heating Based on Photothermal Collectors and Heat Extractors (PT+Hext Technology)
When space heating based on heat extractors driven by photothermal conversion of solar energy is considered, the heat flux QPT provided by solar collectors at temperature Tc is not directly delivered to the user but to the heat extractor, which in its simplest configuration consists of a heat engine and a heat pump. The heat engine receives the heat flux QPT and generates power used to drive the heat pump. The user (the indoor air) receives from the heat engine and the heat pump the total heat flux QPT+Hext:
where εHE and εHP are the performance indicators of the direct and reverse thermal machines (or, in other words, the efficiency of the heat engine and the coefficient of performance of the heat pump). Further details may be found in [5]. The heating gain factor GPT+Hext is defined as the ratio
Over unitary values of GPT+Hext mean that the technology based on photothermal collectors and heat extractors is more energy effective than the traditional technology based on photothermal collectors only. Usage of Equation (2) and Equation (3) yields:
The heat flux delivered to the building per unit collector surface area is given by:
Here Equation (1) and Equation (2) have been used. Therefore, the main extensive and intensive performance indicators of the PT+Hext technology are QPT+Hext and [1 + εHE(εHP − 1)]εPT, respectively.
2.3. Solar Space Heating Based on Heat Pumps Driven by Photovoltaic Solar Cells (PV+HP Technology)
This technology involves a solar cells array which provides electrical energy to a heat pump used for space heating. The electrical power WPV provided by the solar cells array of surface area Ac is given by:
where εPV is the conversion efficiency of solar panels. The electrical power WPV is used to drive the heat pump whose coefficient of performance is denoted εHP. The assumption adopted here is that no power losses exist during the energy transfer between the PV panels and the electric motor of the heat pump. Therefore, the heat flux QPV+HP delivered to the heated body (i.e., the indoor air) by the heating technology based on a heat pump driven by photovoltaic conversion is given by:
The heat flux supplied to the building per unit collector surface area is obtained by using Equation (6) and Equation (7):
Therefore, the main extensive and intensive performance indicators of the PV+HP technology are QPV+HP and εPVεHP, respectively.
3. Implementation of Solar Space Heating Technologies
Several ways of implementing the three solar space heating technologies are considered. The heated body at the user is the indoor air, and the following value is adopted here for indoor air temperature: Tint = 294 K, which is in the limit of thermal comfort for people. Another assumption is that the space heating system does not operate when the ambient (outdoor) temperature Tamb exceeds 288 K.
3.1. Technology Based on Photothermal Collectors (PT)
The value of the exit fluid temperature Tf,e should be higher than Tint, but stating its specific value requires a more involved analysis. Radiative and convective energy losses in the collector array decrease by decreasing working fluid temperature, reaching a minimum when Tf,e equals Tint. In practice, this is not possible since a temperature drop occurs in the pipes or ducts connecting the collector array and the building. Also, an infinite conductance would be required in the usual case where the working fluid is a liquid and heat is transferred to the indoor air via floor heating and radiators. Therefore, Tf,e should be higher than Tint by a certain quantity ΔTint-e:
The value of ΔTint-e depends on implementation details, as discussed next. The average working fluid temperature in the collector array may be expressed as:
There is a habitude in the solar energy utilization community to express the useful heat flux per unit collector surface area, QPT/Ac, by:
where the coefficients a and b are related to the optical efficiency and the convective heat losses of the collector, respectively. The values of these coefficients depend on implementation details as shown in the following. The collector operates properly if QPT > 0. This condition puts some constraints on the minimum level of the solar irradiance Isol, allowing collector operation.
Two ways of implementing the technology based on traditional photothermal solar collectors are considered in the following Sections 3.1.1 and 3.1.2.
3.1.1. Water Photothermal Collectors (PTw Technology)
Solar water collectors of different types are characterized by different values of the coefficients a and b entering Equation (11). Table 2 shows the values of a and b adopted here after a literature survey. They correspond to the collector HT-A, tilted 45 degrees, operating with fluid 40% glycol/water at a flow rate of 25 L/min in the report [6].
Usual photothermal collectors having a liquid working fluid operate in a closed circuit, and heat is transferred to the indoor air by radiators or floor serpentines. The common hot water temperatures for floor serpentines and radiators are about 40 and 80 °C, respectively. Floor heating is considered here, and the following value is adopted to ensure proper heat transfer and to account for temperature losses in the connecting pipes (assumed to be about 10 °C). The temperature of the liquid when exiting the floor serpentines should be higher than Tint and the following conservative value is adopted for the fluid temperature at the collector array inlet: Tf,i = Tint.
3.1.2. Air Photothermal Collectors (PTa Technology)
Solar air collectors of different types are characterized by different values of the coefficients a and b entering Equation (11). Table 2 shows the values of a and b adopted here after a literature survey. They correspond to a collector tilted at 45 degrees with a flow rate of 0.03 kg/(s·m2) [7].
When the solar air heaters operate in closed circuit (PTac technology), the following value is adopted for the fluid temperature at the collector array inlet: Tf,i = Tint. Also, the value ΔTint-e = 10 °C is adopted in order to cover the temperature losses on the ducts connecting the solar collector array and the building.
When the solar air heaters operate in open circuit (PTao technology), the fluid temperature at collector array inlet equals the ambient temperature (Tf,i = Tamb) and the value ΔTint-e = 10 °C is adopted.
Table 2. Parameter values used during the implementation of technologies based on photothermal collectors. a and b are parameters entering Equation (11) for technologies PTw [6] and PTa [7].
|
Technology |
Tf,i (°C) | ΔTint-e (°C) | a (-) | b (Wm−2K−1) |
|---|---|---|---|---|
|
Solar water heaters (PTw technology). |
Tint |
30 |
0.845 |
3.8 |
|
Solar air heaters in closed circuit (PTac technology). |
Tint |
10 |
0.65 |
5 |
|
Solar air heaters in open circuit (PTao technology). |
Tamb |
10 |
0.65 |
5 |
3.2. Technology Based on Photothermal Collectors and Heat Extractors (PT+Hext)
The photothermal collector surface is the source of heat for the working fluid. One denotes Tc the highest collector surface temperature, which is higher than, or equal to, the exit fluid temperature Tf,e. The following conservative assumption is adopted here:
Therefore, the photothermal collectors constitute a heat source of temperature Tc delivering a heat flux QPT directly either to the user (the indoor air) or to a heat extractor. In the last case, the heat extractor, which consists of a heat engine and a heat pump, supplies to the indoor air the heat flux QPT+Hext given by Equation (2). Details follow about the models used here to compute the heat engine efficiency εHE and the coefficient of performance εHP entering Equation (2). The efficiency εHE of the heat engine is assumed to have the form [5]:
where α ∈ (0,1] is a coefficient denoting departure from reversible operation, when α = 1. The lower the value of α, the higher the departure from reversible operation. From practice, one knows that the performance metrics of actual heat engines and heat pumps are approximately half of what is predicted under the assumption of reversible operation [8]. This means that α = 0.5.
Several relationships are available in literature between the coefficient of performance of heat pumps, εHP, and the difference of temperature between the indoor temperature, Tint, and the outdoor temperature, Tamb:
For instance, in [9] one finds:
where ΔTint−amb enters in degrees centigrade. Equation (15) has been proposed as a best fit to the industry-averaged data (see Equation (4) and figure 9a of [9]). This relationship applies to air source heat pumps under the constraint that 15 °C ≤ ΔTint−amb ≤ 60 °C. In this work, to manage hours where the temperature difference falls outside this range, a threshold approach was implemented: for ΔTint−amb ≤ 15 °C, εHP is capped at its 15 °C value, and for ΔTint−amb ≥ 60 °C, it is kept equal to its 60 °C value. Since the heat pump coefficient of performance naturally increases at lower temperature differences, maintaining a constant εHP for ΔTint−amb ≤ 15 °C represents a conservative assumption that avoids overestimating the performance of the PV+HP system during milder heating hours. Equation (15), along with these boundary conditions, is used throughout this paper.
The value of the heat flux QPT supplied to the user depends on technology (PTw, PTac, or PTao). Any of these technologies may be combined with a heat extractor, yielding different values of the heat flux QPT+Hext in each case.
3.3. Technology Based on Heat Pumps Driven by PV Cells (PV+HP)
Photovoltaic solar cells generate electrical energy, which is used to drive heat pumps supplying heat to the indoor air. The intensive performance indicator for this combination is εPVεHP (see Equation (8)). Details follow on the computation of the solar cell efficiency εPV and the coefficient of performance εHP of the heat pump.
While various PV cell technologies are currently at different stages of development—including the highly promising perovskite cells (see, e.g., [10])—this study focuses exclusively on PV technologies which are in a more mature phase of commercial deployment. The following technologies are considered: semitransparent crystalline (c) silicon (PVa), opaque crystalline (c) silicon (PVb), amorphous (a) silicon (PVc), cadmium telluride (CdTe) (PVd), and copper indium gallium selenide (CIGS) (PVe). The PV cell performance is highly influenced by a wide range of environmental and operational variables (see, e.g., [11]). Simple relationships for the conversion efficiency of solar energy into electrical energy, εPV, are shown for all PV technologies in Appendix A. These relationships depend on several parameters, such as the ambient temperature Tamb, the incident solar global irradiance Isol, and the characteristics of the PV cells’ materials, and take into account that in operation, the cell temperature is larger than the ambient temperature.
The heat pump coefficient of performance εHP is computed as described in Section 3.2 (see Equation (15)).
4. Meteorological Data
The energetic performance of solar space heating technologies is analyzed as an example under the climate and latitude of a US location (Rock Springs, latitude 40.7167 °N, longitude −77.9167 °E, altitude 376 m). The climate of Rock Springs is temperate, according to the Köppen-Geiger climate classification. Meteorological and radiometric data provided by the NASA POWER Project [12] have been used. The NASA POWER Project provides meteorology, surface solar energy, and climatology data for various needs: renewable energy, building energy efficiency, and agricultural activities. The surface solar energy data is available at a global scale with a spatial resolution of 1/2 by 1/2 arc degree longitude and latitude. The physical quantities extracted for this study are the All-Sky Insolation Incident on a Horizontal Surface (ALLSKY_SFC_SW_DWN) and air temperature at the ground surface. The solar radiation data provided by the POWER platform were taken from NASA’s Global Energy and Water Exchanges—Surface Radiation Budget Project Release 3.0 archive and from NASA’s CERES Fast Longwave and Shortwave Radiative Fluxes (FLASHFlux) project [13]. Hourly values of air temperature, ground albedo, and incident solar global irradiation on a horizontal surface have been collected for the time interval 1 January 2001–31 December 2022.
5. Comparison Between Solar Space Heating Technologies
Several words about the methodology adopted here are useful. Generally, the operation and performance of the energy supplying system depend on the operation and performance of the energy consuming system. In case of solar space heating, the heat supplied is finally received by the air inside the building. When the heat supply exceeds the thermal losses of the building, thermal energy is accumulated inside, the indoor air temperature increases, and at some moment there is no need for further heating. Then, the operation of the heat supplying system should be stopped, or the heat supplied should be stored in a heat accumulator. The objective here is not to analyze the energy performance of a building or the interaction between the heat supplying system and the building, but the intrinsic energy performance of different solar space heating technologies. The assumption is that the system that manages the energy obtained by converting solar energy is able either to consume it immediately or to store it as thermal or electrical energy. An equivalent alternative is to consider a building with infinite thermal capacity. This means that the indoor air temperature does not change in time and space heating is continuously needed.
Solar irradiance data on a horizontal plane are available in the POWER Project database. Consequently, horizontal solar thermal collectors and solar cells have been considered in this work. While practical solar thermal and PV systems designed for heating are conventionally tilted to optimize yield, a horizontal orientation is adopted here as a baseline configuration. This simplified boundary condition allows for a controlled evaluation of the energy effectiveness hierarchy of the investigated technologies, though further site-specific sensitivity analyses would be required to definitively confirm whether this ranking remains identical for tilted devices. The energy performance of solar space heating technologies has been evaluated for those hours when the incident solar global irradiance exceeded 50 W/m2.
5.1. Energy Performance
5.1.1. Solar Water Collectors and Solar Air Collectors
The performance of solar space heating technologies based on solar heaters depends on the type of photothermal collectors and their operation mode (or, in other words, on the fact that they are operating in closed or open circuit or they operate at higher or lower temperature). Solar water heaters have a priori higher energy performance than solar air heaters since the value of their intercept factor a is higher and the thermal losses factor b is lower (see Table 2). However, the useful heat flux QPT depends on the mean working fluid temperature Tf,m (see Equation (11)). The lower Tf,m is, the higher QPT is. But Tf,m depends on the inlet fluid temperature Tf,i and the exit fluid temperature Tf,e (see Equation (10)), which, in turn, depends on the temperature difference Δint−e (see Equation (9)). The mean working fluid temperature Tf,m is higher for solar water heaters than for solar air heaters since the temperature difference Δint−e is higher in the former case. Therefore, from the point of view of Tf,m, higher thermal losses are expected for water heaters than for air heaters. Also, the air heaters operating in closed circuit have higher inlet temperature Tf,i than those operating in open circuit. Therefore, from the point of Tf,i, closed circuit operation is associated with higher thermal losses that open circuit operation.
Solar water heaters consistently achieve higher thermal efficiency across most operating ranges due to the superior heat transfer fluid properties of water compared to air, while open-circuit air configurations display intermediate performance limited by ambient intake temperatures. Figure 1 shows the heat flux densities provided by technologies based on solar water collectors and solar air collectors operating in closed circuit (QPTw and QPTac, respectively) vs. the heat flux density provided by the technology based on solar air collectors operating in open circuit (QPTao). Generally, the PTw technology has the highest energy performance, while the PTac technology has the lowest performance. The PTao technology is between. The maximum useful heat flux density provided by the PTw, PTac, and PTao technologies is about 750, 575, and 575 W/m2, respectively. Notice that in the case of small values of the useful heat flux QPT, which are associated with small values of the incident solar irradiance Isol, the solar air heaters in open circuit outperform solar water heaters. This is explained by the higher value of the mean fluid temperature Tf,m that water heaters have in this case. Also, at very small values of solar irradiance Isol, solar air heaters in open circuit still provide useful heat, but the operation of the air heaters in closed circuit and the water heaters is stopped, since QPT given by Equation (11) would become negative in those cases.
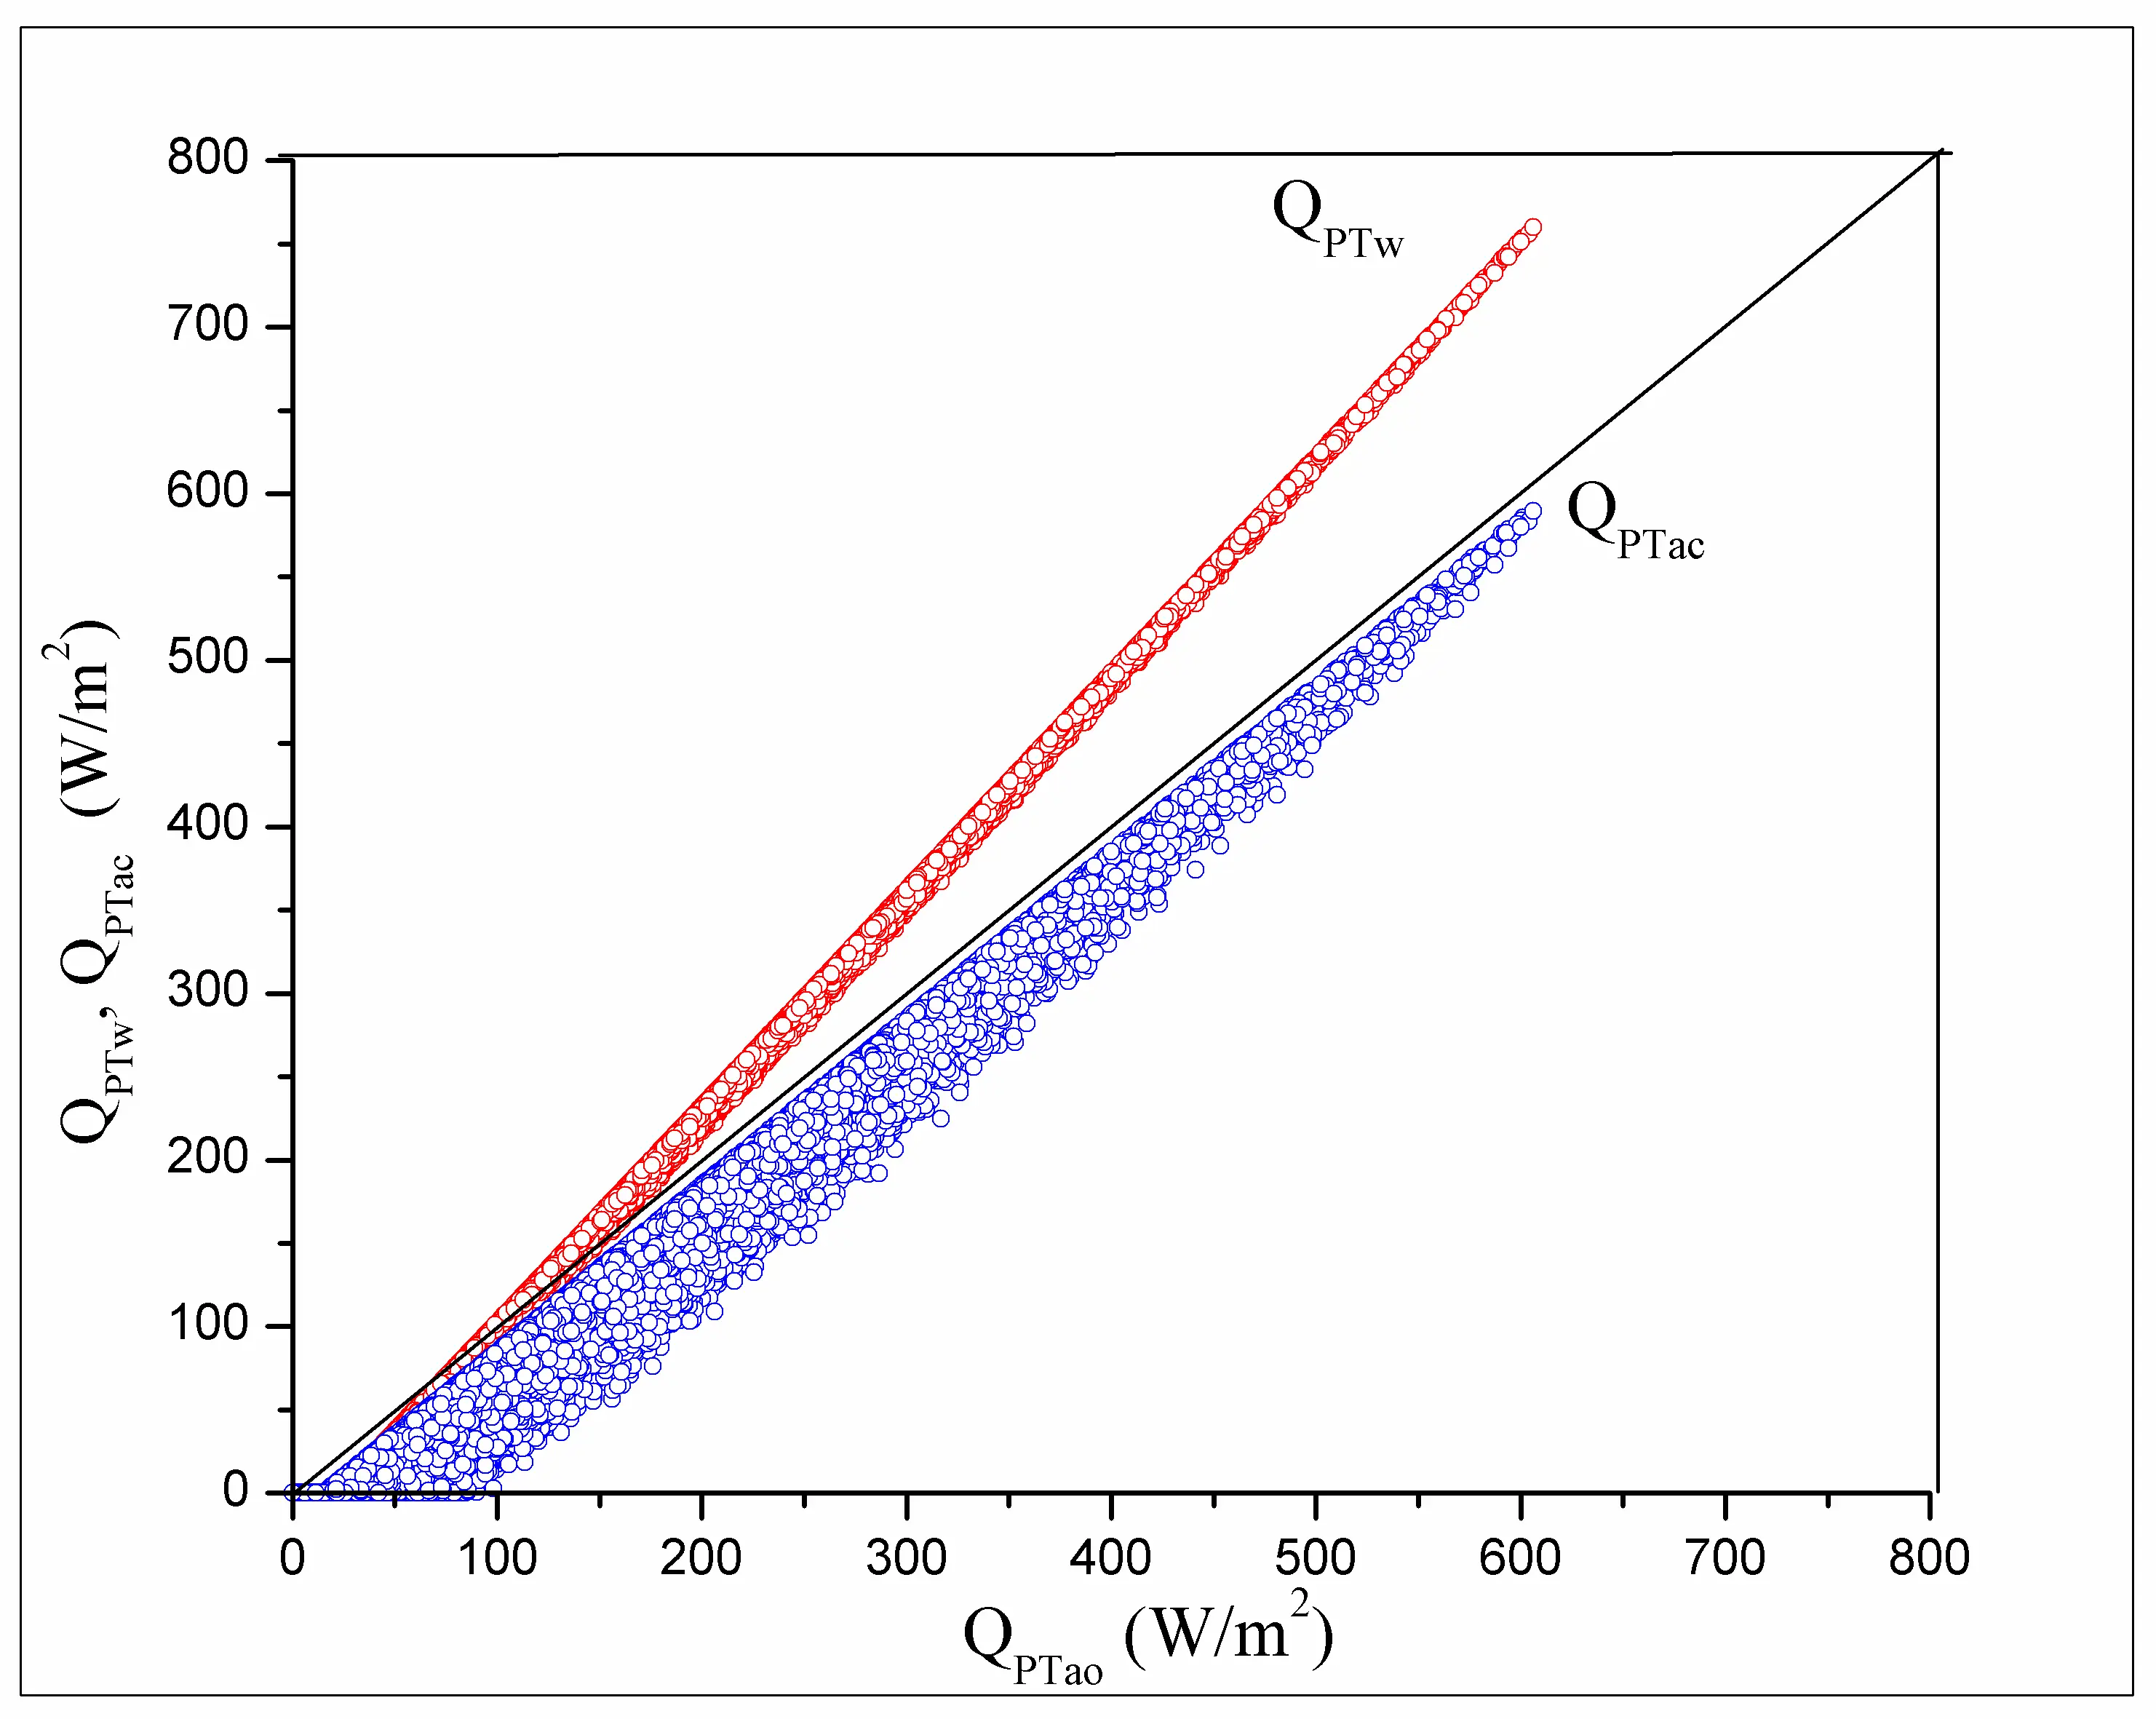
Figure 1. Heat flux densities provided by technologies based on solar water collectors and solar air collectors operating in closed circuit (QPTw and QPTac, respectively) vs. heat flux density provided by the technology based on solar air collectors operating in open circuit (QPTao). Hourly values of ambient air temperature and solar global irradiance on the horizontal plane during the years 2001 to 2022 at Rock Springs, US, have been used.
5.1.2. Heat Pumps Driven by Different Types of PV Cells
Two scenarios were evaluated in [14] for covering Australian household energy needs: a standalone PV system for both electricity and hot water versus a combined solar thermal and PV system sharing the same roof space. The integrated system emerged as the better option. In line with these findings, the present work analyzes the performance of the combination between heat pumps and PV cells.
The useful heat flux provided by photothermal collectors and the electric power provided by solar cells depend on the level of the solar global irradiance Isol and ambient temperature Tamb. In both cases the energy flux increases by increasing Isol. The efficiency εPT of photothermal conversion increases by increasing Tamb since the thermal losses decreases in this case (see Equation (1) and Equation (11)). On the contrary, the efficiency εPV of photovoltaic conversion decreases by increasing the solar cell temperature Tc. But the increase of Tc is caused by the increase of ambient temperature and/or the increase of solar global irradiance Isol. Notice that the dependence of εPV on solar cell temperature is taken into account in the relationships presented in Appendix A since they have the solar global irradiance Isol as input parameter. The coefficient of performance εHP of the heat pump increases by increasing Tamb. Therefore, when the ambient temperature increases, the heat flux QPV+HP provided by the technology based on PV-driven heat pumps (see Equation (8)) has a tendency to decrease (due to the decrease of εPV), combined with a tendency to increase (due to the increase of εHP). The dependence of QPV+HP on the level of solar global irradiance Isol is complicated since two contradictory effects should be taken into account. First, QPV+HP obviously increases when Isol increases (see Equation (8)). Second, when Isol increases, the solar cell temperature increases and the efficiency εPV entering Equation (8) decreases, making QPV+HP to decrease.
The electrical efficiency and temperature coefficients of different semiconductor materials directly dictate the thermal output of the heat pump. The performance is primarily attributed to the baseline electrical conversion efficiency of crystalline structures under cloudy sky conditions and at different ambient temperatures. Opaque crystalline silicon PV panels (PVb) absorb slightly more solar energy than semitransparent ones (PVa). This modifies the value of the empirical factor that multiplies the temperature coefficient (as shown by comparing Equations (A1) and (A2) in Appendix A), ultimately leading to a slight drop in efficiency, whose overall impact is very small, even after annual accumulation. To avoid redundancy, only results for the semitransparent crystalline silicon PV panels are presented hereafter. Figure 2 shows that the technology consisting of heat pumps driven by semitransparent crystalline silicon solar cells (PVa) is the most energy effective, while the usage of amorphous silicon solar cells (PVc) is the least energy effective. The technology based on cadmium telluride solar cells (PVd) is between. The difference between the performance of these technologies increases at higher values of the useful heat flux. The maximum useful heat flux density provided by the PVa+HP, PVc+HP and PVd+HP technologies is about 640, 340 and 500 W/m2, respectively.
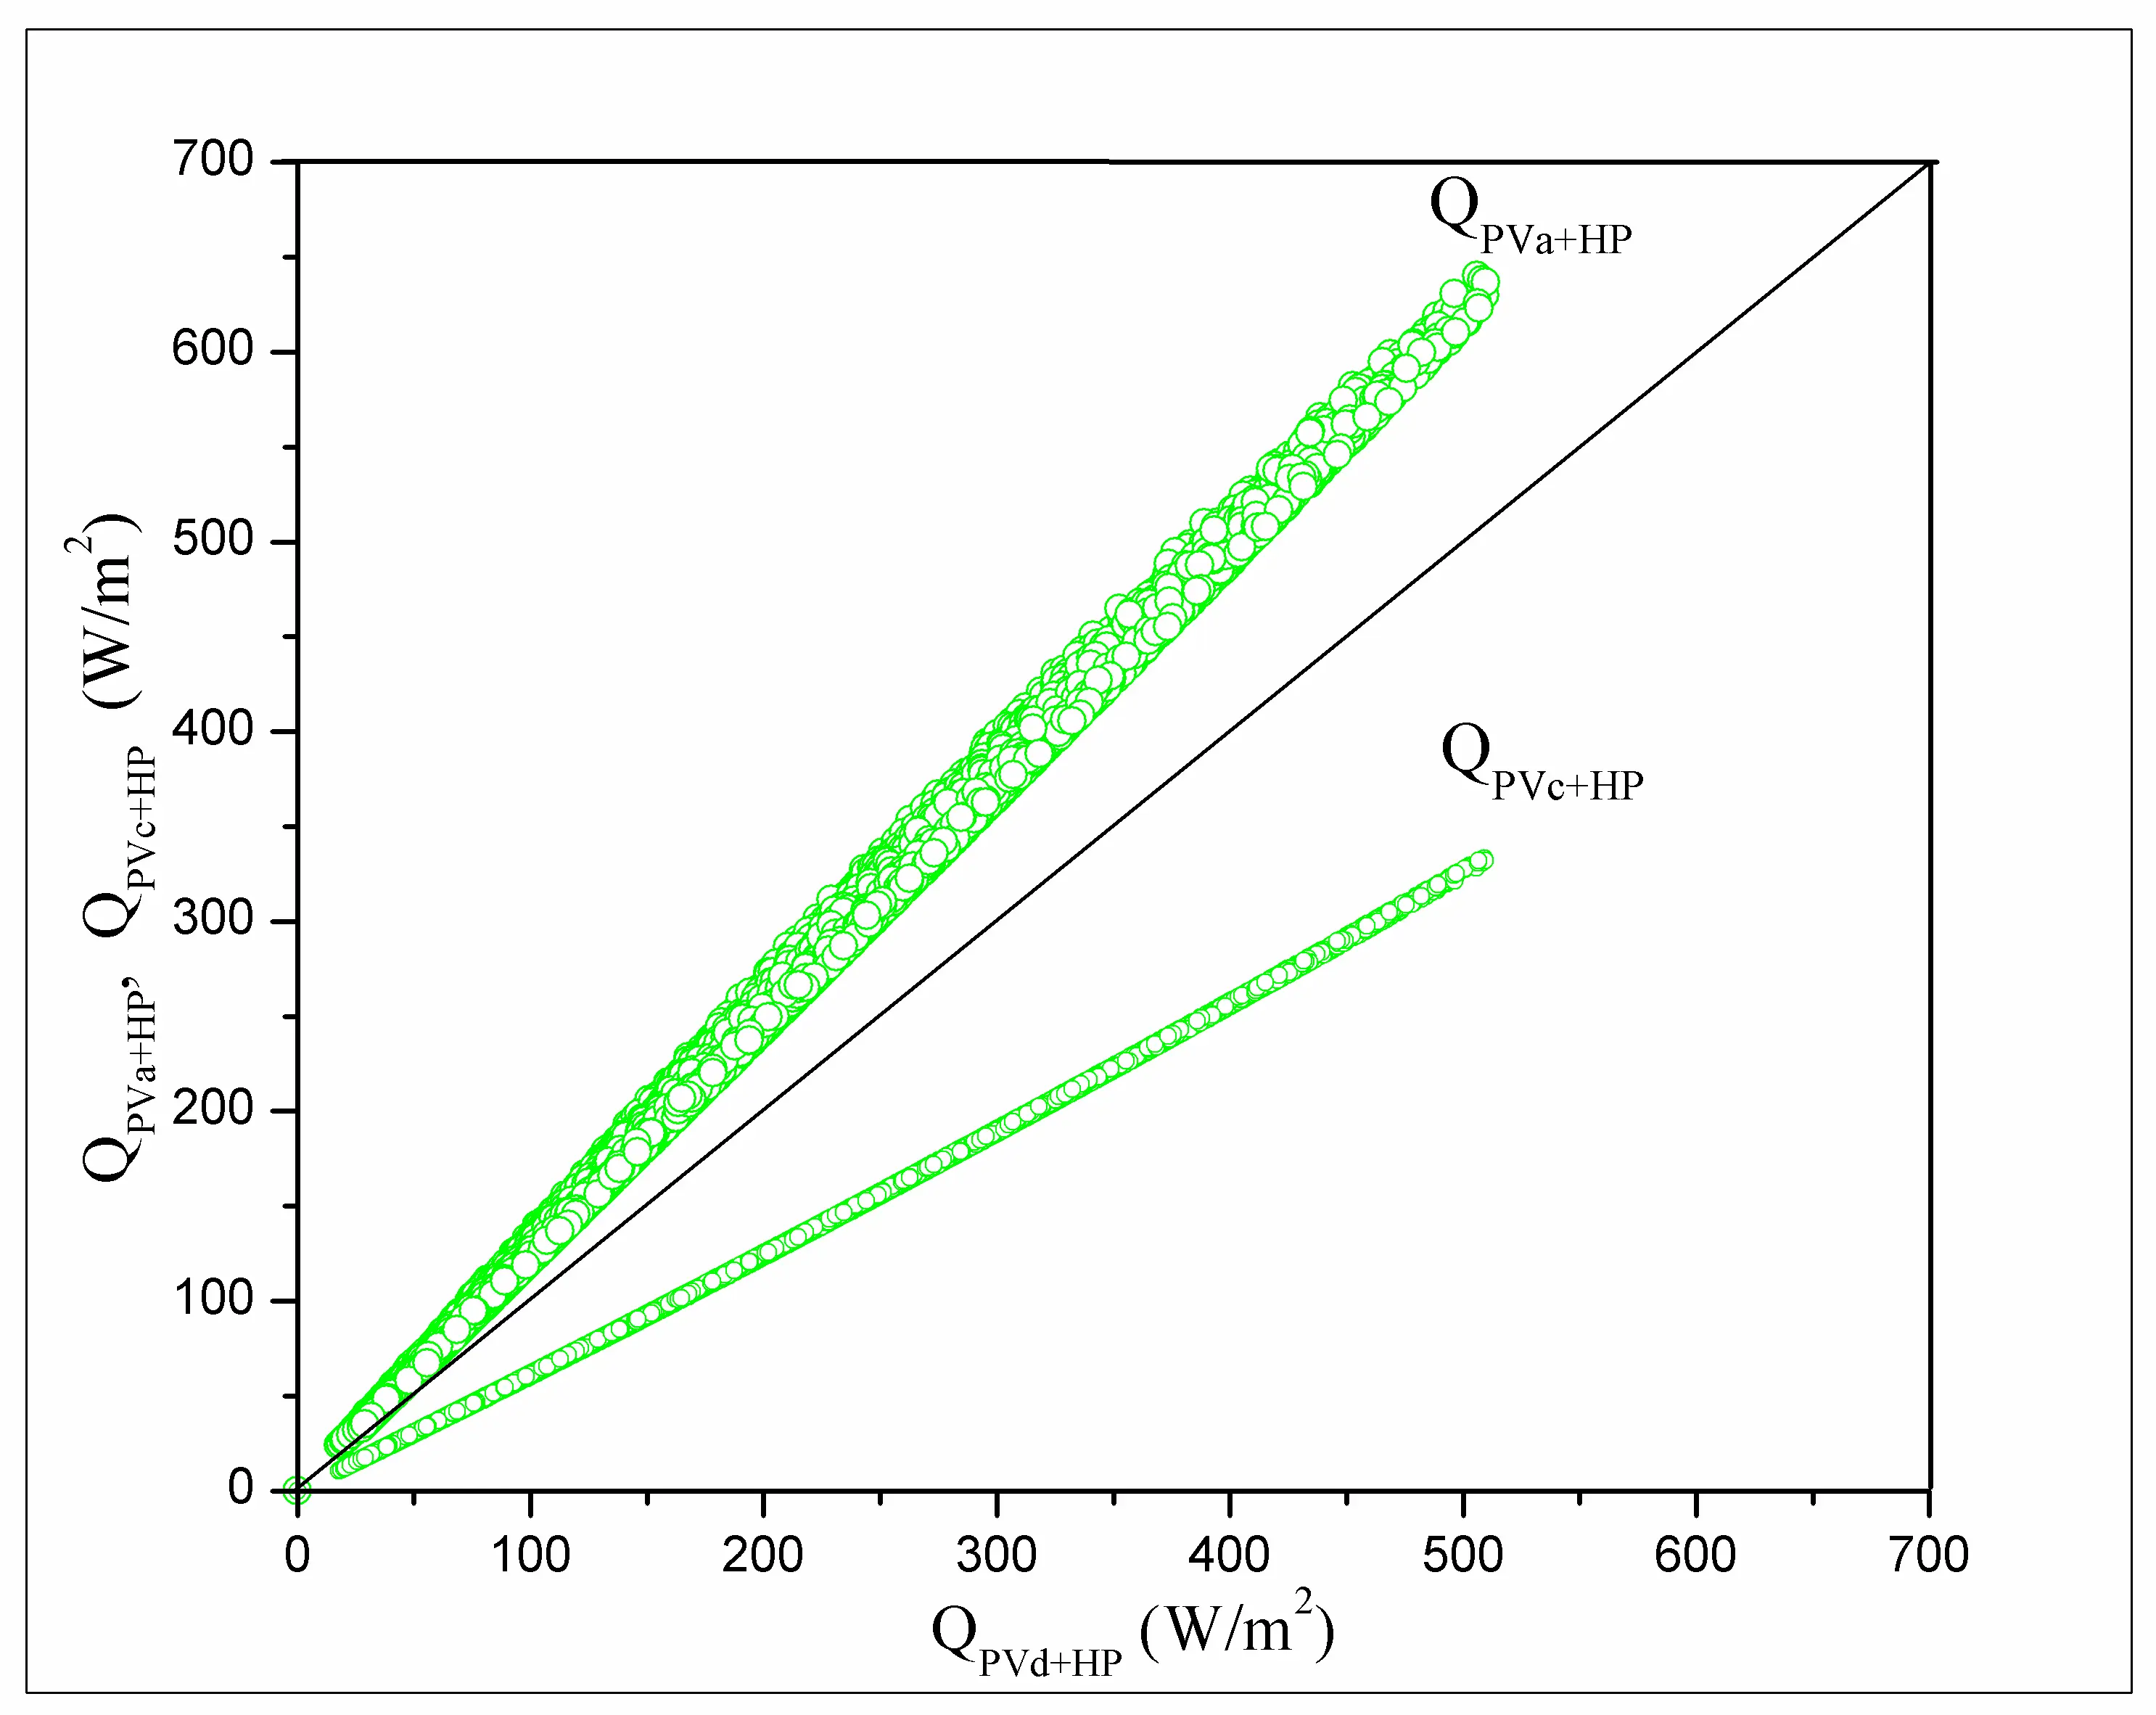
Figure 2. Heat flux densities QPVa+HP and QPVc+HP provided by heat pumps driven by PVa technology (semitransparent crystalline silicon solar cells) and PVc technology (amorphous silicon solar cells) vs. heat flux density QPVd+HP provided by heat pumps driven by PVd technology (cadmium telluride solar cells). Hourly values of ambient air temperature and solar global irradiance on horizontal plane during the years 2001 to 2022 at Rock Springs, US, have been used.
5.1.3. Photothermal Collectors and PV-Driven Heat Pumps
The major conclusion of [3] is that despite solar thermal collectors are highly efficient, the concept of a PV-assisted heat pump is gaining popularity. A comparison between Figure 1 and Figure 2 show that the maximum useful heat flux density supplied by traditional solar heating technologies based on thermal collectors is generally larger than that provided by heat pumps driven by solar cells. A more detailed analysis is useful. Figure 3a shows a scatter plot of the useful heat flux values provided by the most energy effective traditional technology based on solar water heaters (PTw) vs. the useful heat flux values provided by the most energy effective technology based on solar cells utilization, which is PVa+HP. The traditional technology PTw is more energy effective than the emerging technology PVa+HP at higher values of the useful heat flux, which are usually associated with higher values of the incident solar global irradiance Isol. At smaller useful heat flux values, the traditional technology PTw is less effective. Indeed, the distribution of points demonstrates that under low-to-moderate solar irradiance, the PVa+HP configuration maintains a steady thermal output, whereas the PTw system performance drops significantly due to high thermal losses to the environment. Moreover, at very small useful heat flux values, the emerging technology PVa+HP still operates while the traditional technology PTw stops operation.
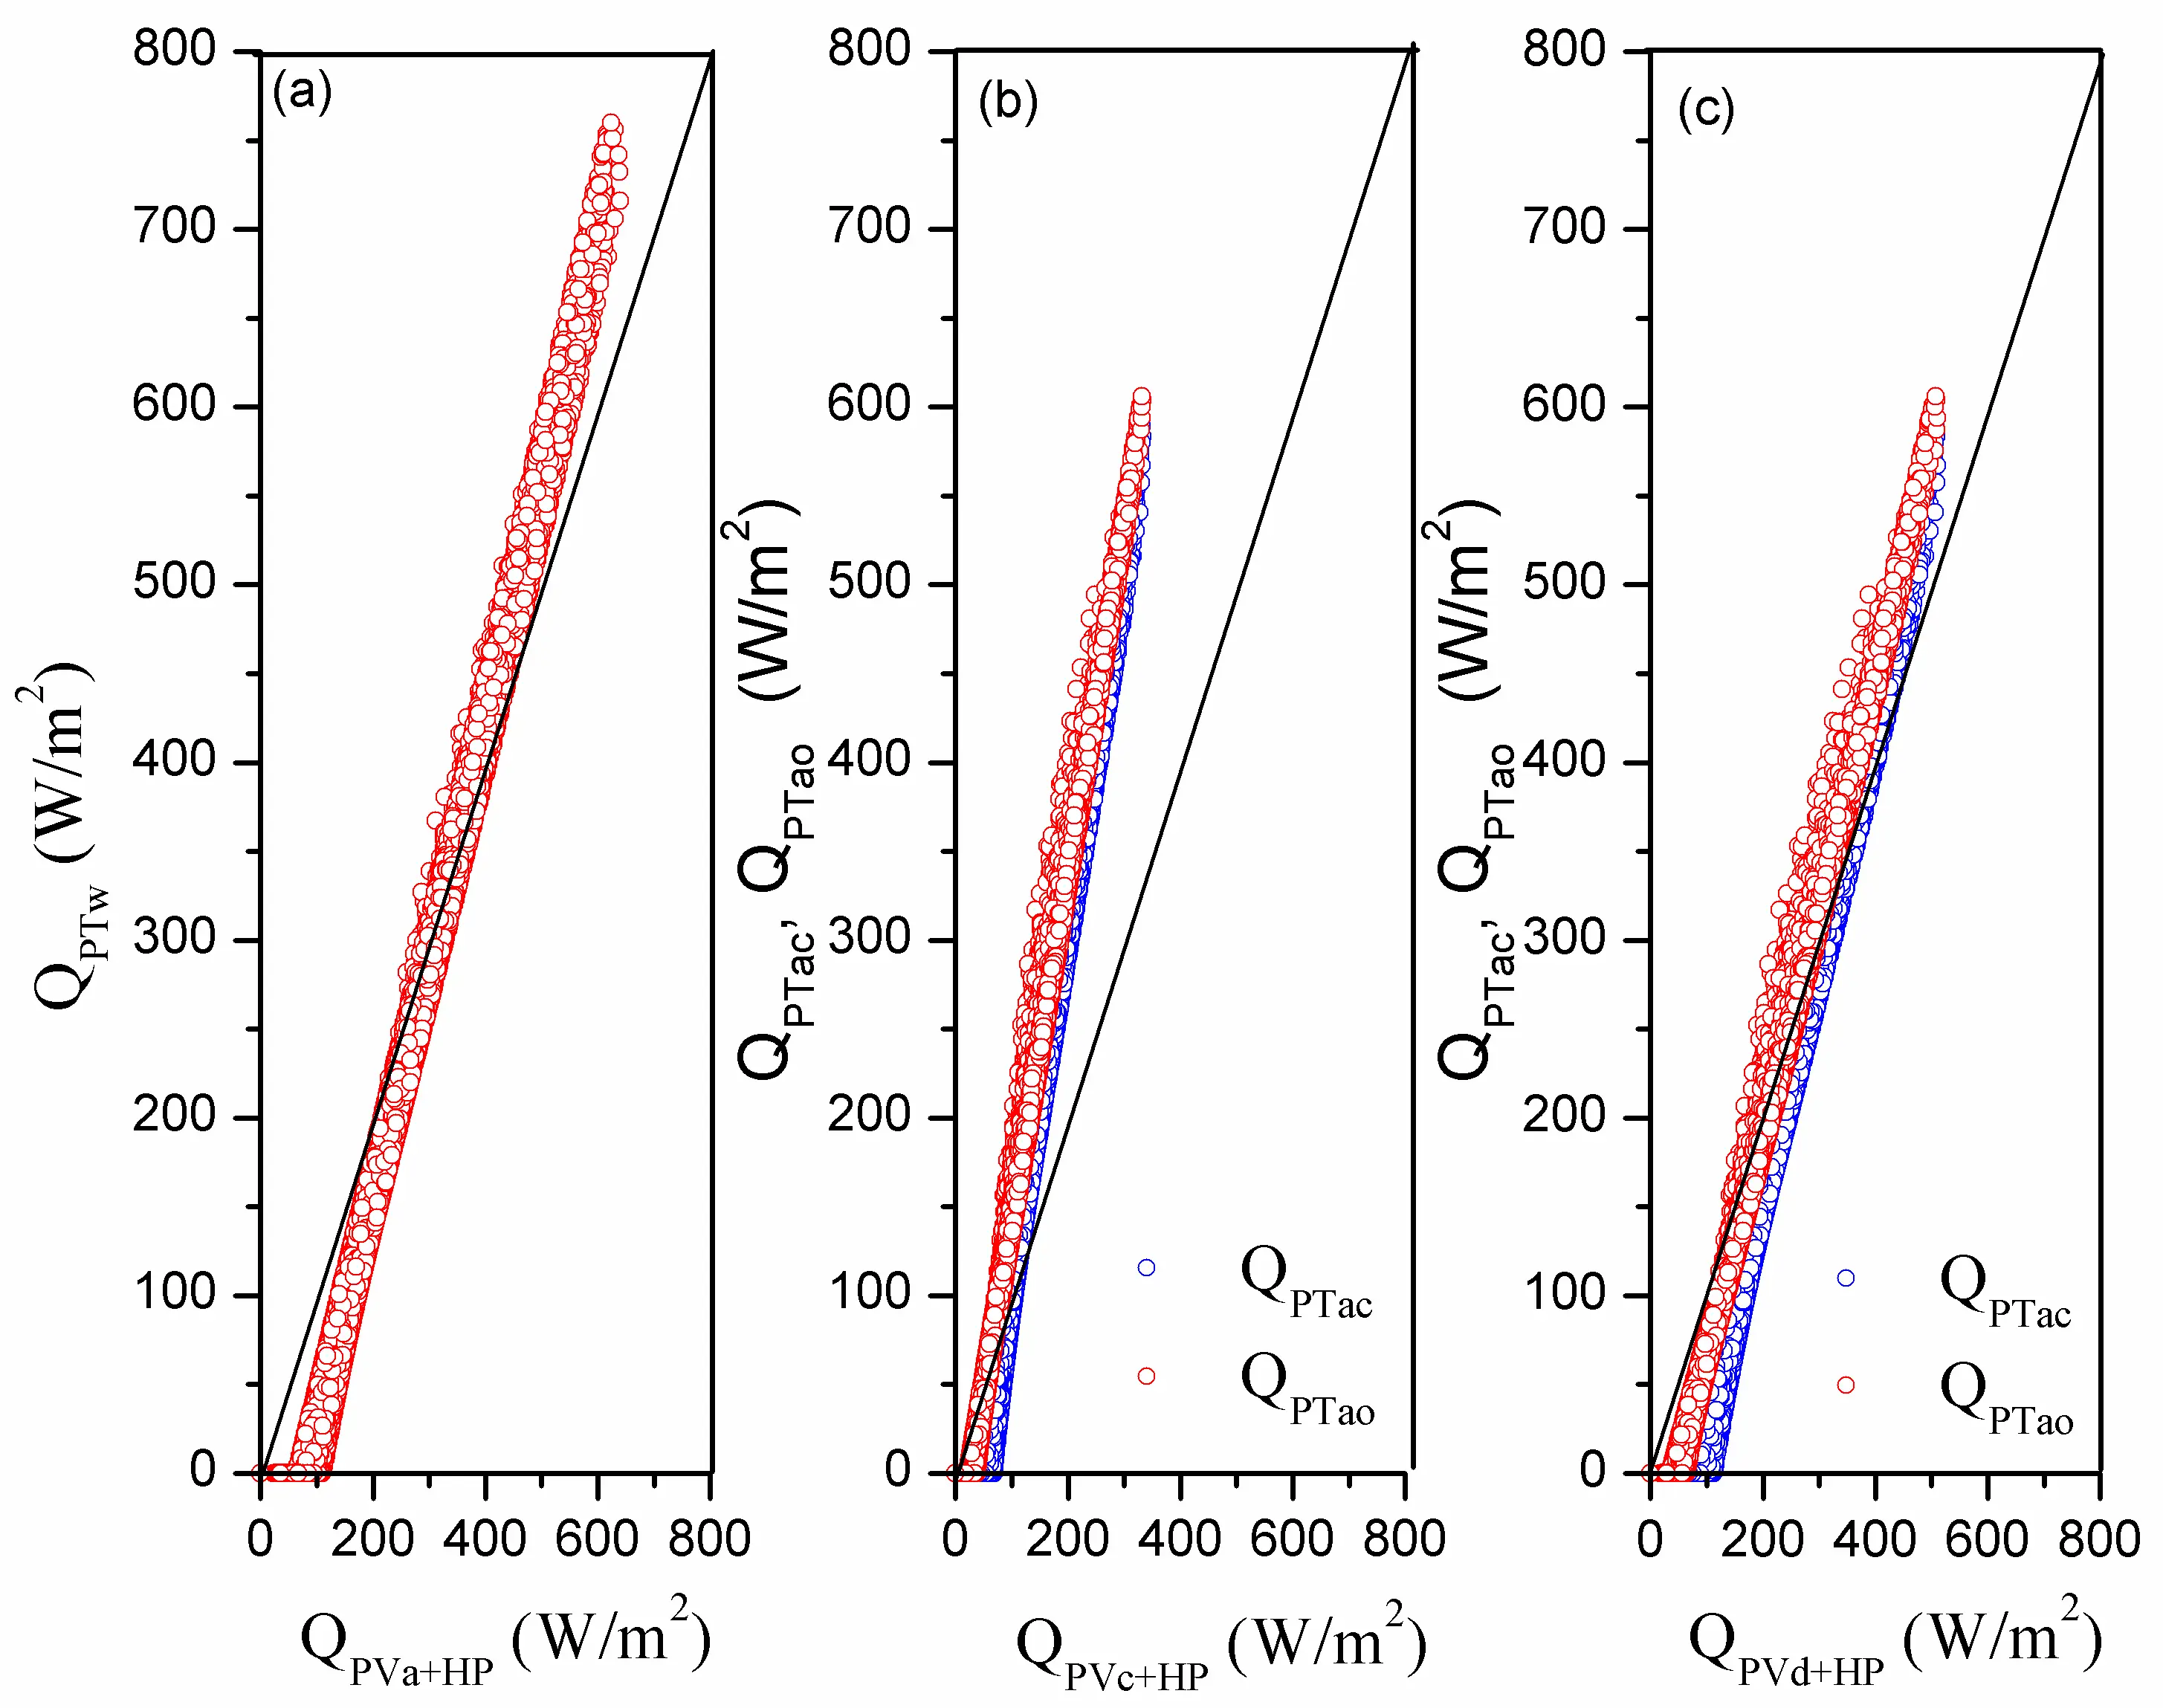
Figure 3. Heat flux density provided by several traditional photothermal space heating technologies vs. heat flux density provided by several technologies based on heat pumps driven by PV cells. (a) QPTw (water solar collectors) vs. QPVa+HP (semitransparent crystalline silicon solar cells); (b) QPTac and QPTao (air solar collectors operating in closed and open circuit, respectively) vs. QPVc+HP (amorphous silicon solar cells); (c) QPTac and QPTao (air solar collectors operating in closed and open circuit, respectively) vs. QPVd+HP (cadmium telluride solar cells). Hourly values of ambient air temperature and solar global irradiance on the horizontal plane during the years 2001 to 2022 at Rock Springs, US, have been used.
Figure 3b shows a comparison between traditional solar space heating technologies based on solar air heaters and the least energy effective technology based on solar cells utilization, which is PVc+HP. The solar air heaters operating in open circuit perform better than those operating in closed circuit, and both types of air collectors outperform the technology PVc+HP, except in the case of very small values of the useful heat flux density. The two types of solar air heaters are compared in Figure 3c with the technology PVd+HP based on cadmium telluride solar cells, which is more energy effective than the PVc+HP technology. The solar air collectors outperform the emerging technology PVd+HP only for larger or medium values of the useful heat flux density. The results of Figure 3 show that at large values of the useful heat flux, the traditional solar space heating technologies outperform the emerging technologies based on heat pumps driven by solar cells. However, when the energy performance of traditional and emerging solar space heating technologies is compared over the long term, the result is likely to depend on the radiative climate of the location, or, in other words, on the number of hours with higher or lower values of global solar irradiance.
5.1.4. Photothermal Collectors and PT-Driven Heat Extractors
Solar space heating technologies based on photothermal solar collectors combined with heat extractors (PT+Hext) are more energy efficient than traditional technologies based on solar water and air heaters. Indeed, Figure 4 shows that the heating gain factors of these emerging technologies are larger than unity and increase by increasing the ambient temperature, as expected. This physical behavior occurs because higher ambient temperatures naturally reduce the thermal gradient between the collector surface and the surroundings, thereby decreasing convective heat losses and allowing the heat extractor to operate with higher performance. The technology based on water heaters (PTw+Hext) has the largest value of the heating gain factor, while the gain factors of the technologies based on air heaters operating in closed and open circuit (PTac+Hext and PTao+Hext, respectively) are almost the same and significantly smaller than that of PTw+Hext technology. Therefore, emerging technologies based on solar air heaters are not likely to be of future interest. The emerging technology based on solar water heaters might be of interest, especially in climates where air temperatures do not drop far below freezing.
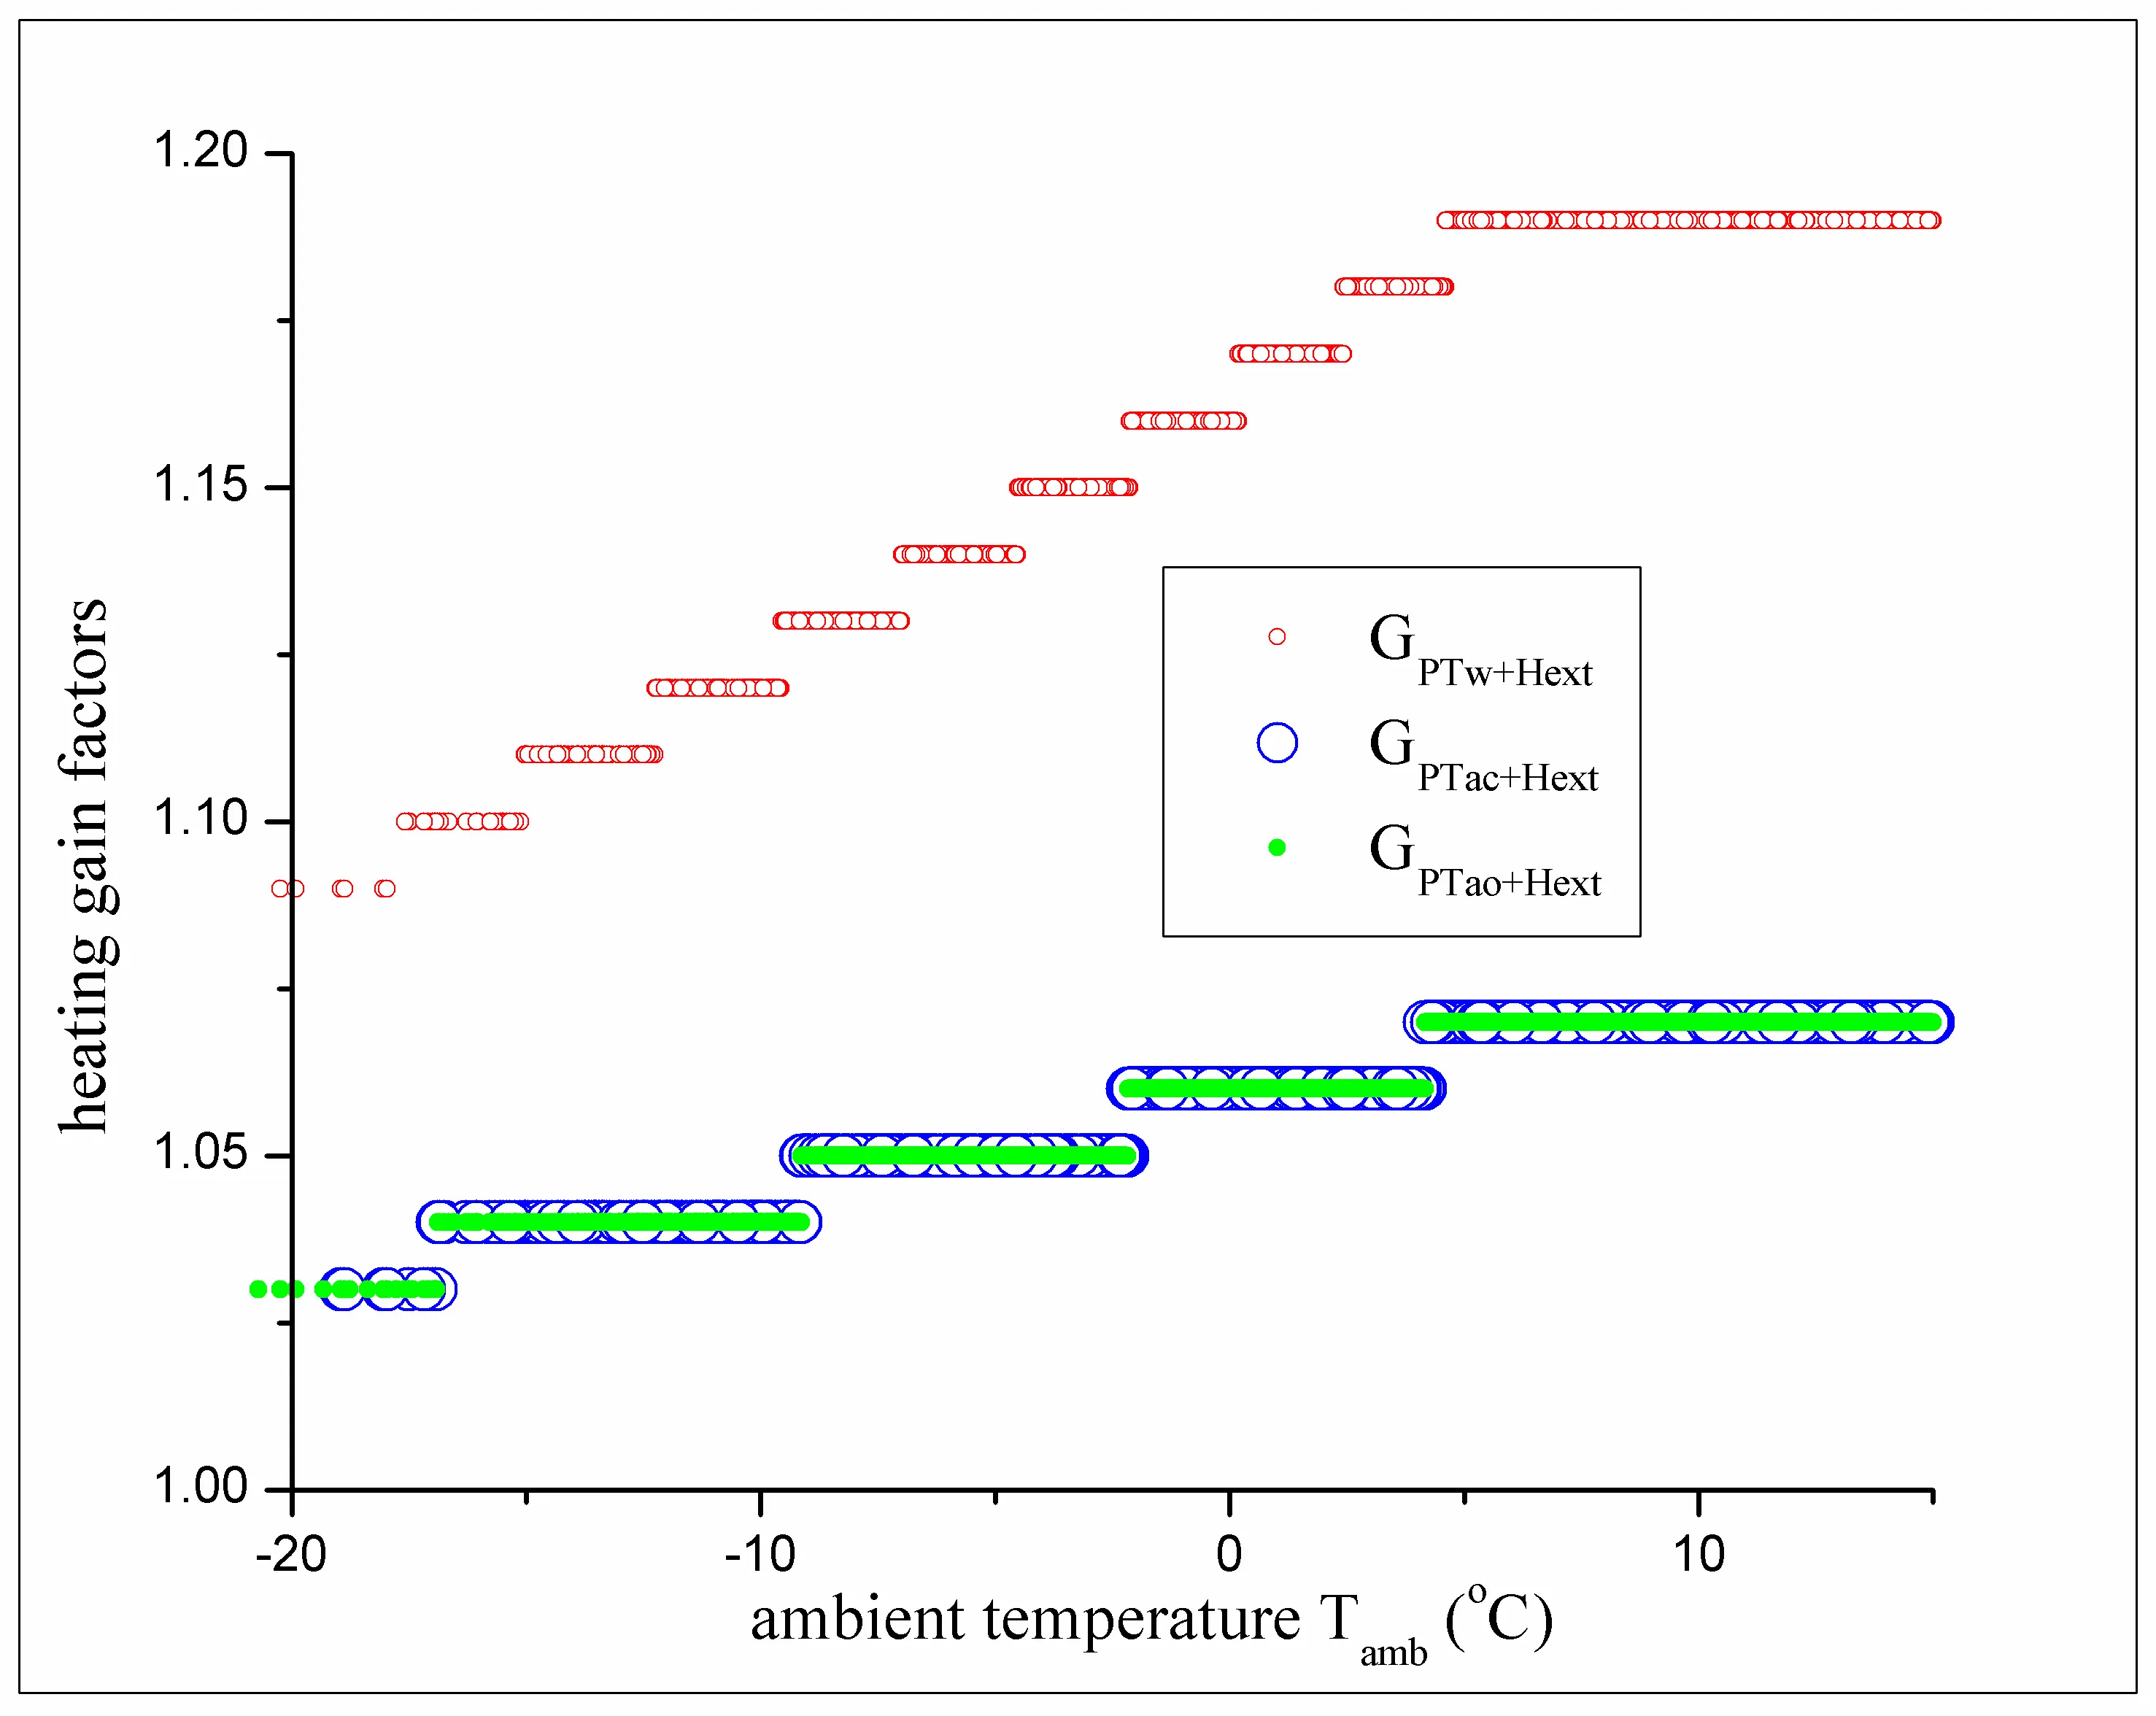
Figure 4. Dependence on ambient temperature Tamb of space heating gain factors for technologies based on photothermal collectors and heat extractors. GPTw+Hext (water solar collectors), GPTac+Hext (solar air collector operating in closed circuit), GPTao+Hext (solar air collector operating in open circuit). Hourly values of ambient air temperature and solar global irradiance on the horizontal plane during the years 2001 to 2022 at Rock Springs, US, have been used.
Assume that during a time interval of one hour, the heat flux density provided by the technology PTw QPTw (units W/m2) is constant. Then, the heat density provided during one hour by the PTw technology is obtained by QPTw times one hour, and it is numerically equal with QPTw but its units are Wh/m2. The heat density provided during one year per unit of solar energy collection surface area by the PTw technology is obtained by summing the contributions of all one-hour intervals during which solar water heaters are in operation. This quantity is denoted ∑QPTw, with units Wh/m2. Similar notation and units are used for the heat density provided during one year per unit solar energy collection surface area by the other traditional and emerging solar space heating technologies.
5.1.5. Comparison Between Classical and Emerging Solar Heating Technologies
Figure 5a,b show that the heat density provided yearly changes significantly from year to year for all technologies. However, a range of variation may be identified for the yearly values of the heat density supplied, which is between about 20–35% of the maximum value for the PT-based technologies (Figure 5a), and between about 15–20% of the maximum value for the PV-based technologies (Figure 5b). This notable interannual variability emphasizes that relying on a single ‘standard meteorological year’ can lead to substantial under- or over-estimation of solar heating capabilities. The data reveal that photothermal systems are more sensitive to yearly cloud-cover variations, experiencing larger percentage swings in annual yield compared to the more resilient PV-driven heat pump systems. The technology PTw is the most effective among the traditional technologies, as expected (see ∑QPTw in Figure 5a). Combining the PTw technology with heat extractors increasing the heat supplied by about 16% (compare ∑QPTw and ∑QPTw+Hext in Figure 5a). The emerging technologies based on semitransparent crystalline silicon and opaque crystalline silicon (technologies PVb+HP and PVa+HP, respectively) provide yearly almost similar heat density values (Figure 5b), which are significantly larger that those of the other PV-based technologies. Notice that the PVa+HP and PVb+HP technologies supply larger heat density values per year than the most effective PT-based solar heat extractor technology, which is PTw+Hext (compare ∑QPVa+HP and ∑QPVb+HP in Figure 5b with ∑QPTw+Hext in Figure 5a).
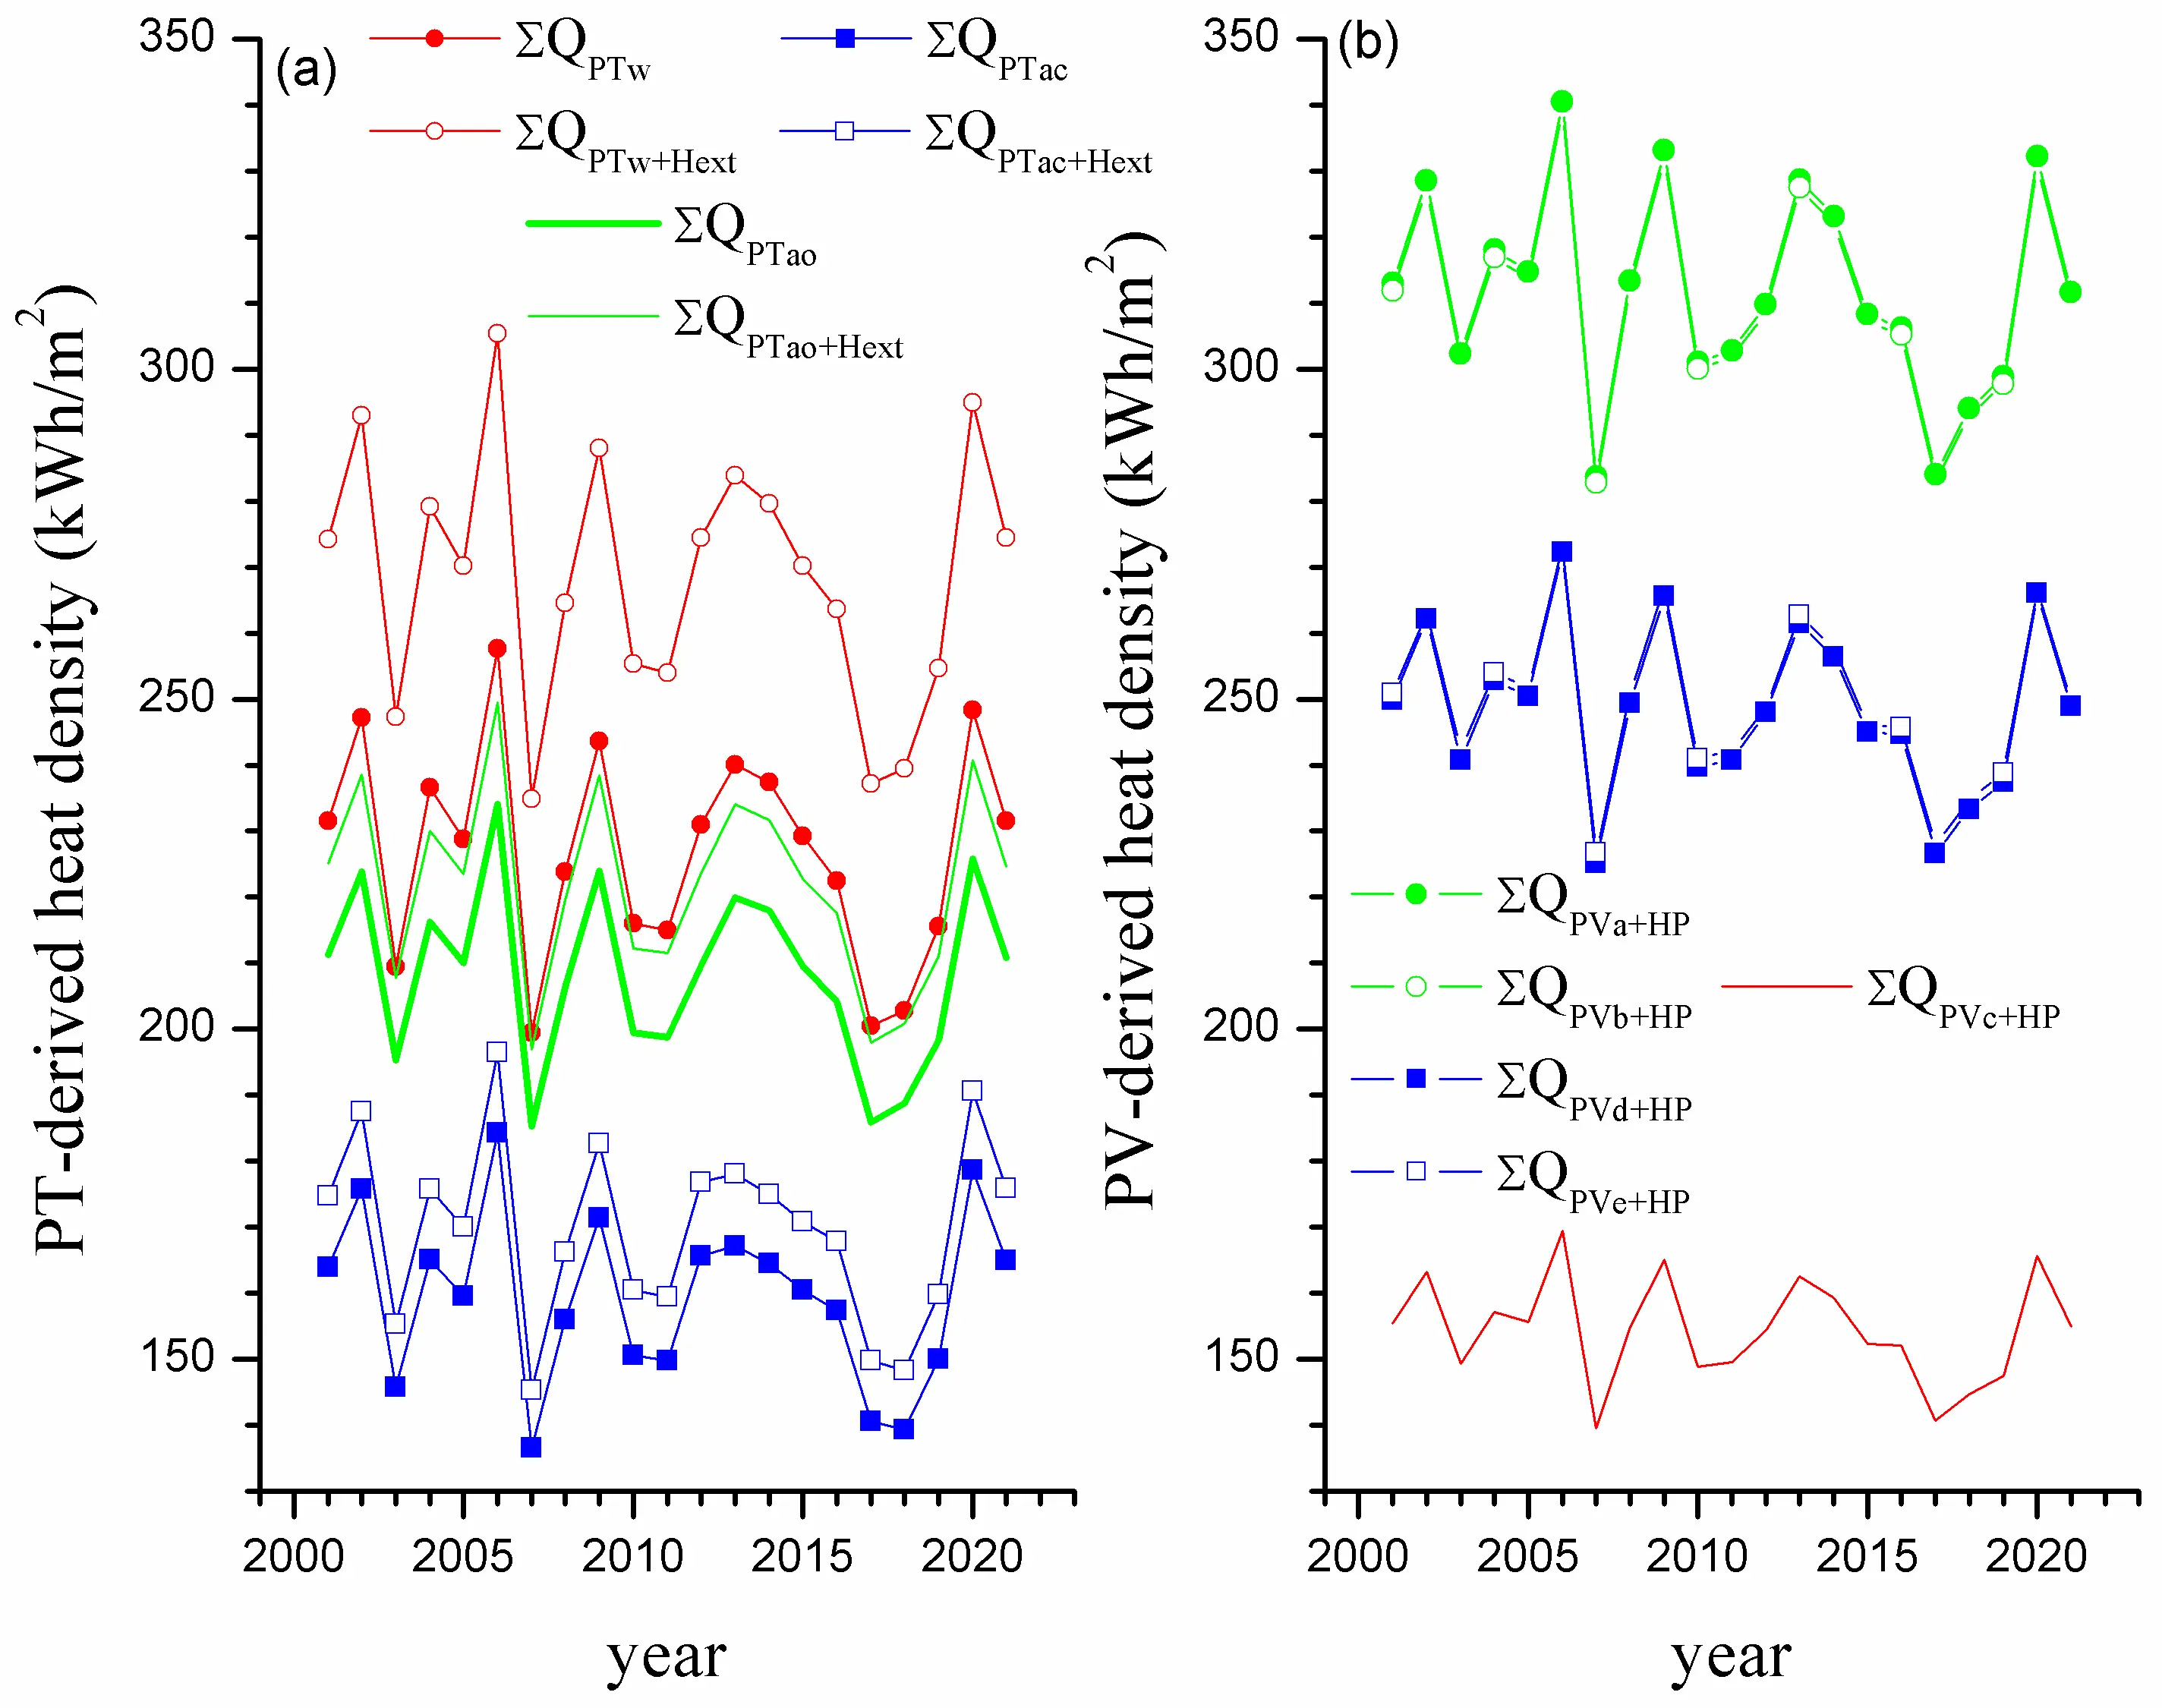
Figure 5. Heat provided per unit solar energy collection surface area by different space heating technologies in the years 2001 to 2021. (a) Traditional technologies based on solar water collectors (w) and solar air collectors in closed or open circuit (ac and ao, respectively) and the same technologies enhanced by using heat extractors (Hext); (b) technologies based on heat pumps driven by different types of solar cells PVa (semitransparent crystalline silicon), (PVb—opaque crystalline silicon), PVc (amorphous silicon), PVd (cadmium telluride), PVe (copper indium gallium selenide). Hourly values of ambient air temperature and solar global irradiance on the horizontal plane during the years 2001 to 2022 at Rock Springs, US, have been used.
Moreover, the emerging technologies based on cadmium telluride solar cells and cooper indium gallium selenide solar cells (PVd+HP and PVe+HP technologies, respectively) supply a larger heat density values per year than the most effective traditional PT-based technology, which is PTw (compare ∑QPVd+HP and ∑QPVe+HP in Figure 5b with ∑QPTw in Figure 5a). However, they provide a slightly smaller heat density values per year than the most effective emerging PT-based technology, which is PTw+Hext (compare ∑QPVd+HP and ∑QPVe+HP in Figure 5b with ∑QPTw+Hext in Figure 5a). The emerging technology based on amorphous silicon (PVc+HP) has almost similar performance with the traditional and emerging PT technologies based on solar air heaters operation in closed circuit (compare ∑QPVc+HP in Figure 5b with ∑QPTac and ∑QPTac+Hext in Figure 5a).
Several comments are useful. Figure 5a,b show that during one year of operation, the PVa+HP technology is more effective than the PTw technology (despite Figure 3a shows that the PTw technology outperforms the PVa+HP technology at large values of the heat flux supplied). This is explained by the fact that during most part of the heating season, the incident solar global irradiance at Rock Springs is rather low level. Therefore, the heat supplied is rather small level and in this case the PVa+HP technology is more effective than the PTw technology.
To understand the dynamic, real-time response of these systems during critical heating periods, a high-resolution hourly analysis was conducted for the onset of the winter and spring seasons. Figure 6 shows hourly values of several parameters during the first seven days of the first five months of the year 2008 at Rock Springs. This transient profile illustrates the day-night operational cycling, showing how the PV+HP system and the traditional solar collectors start operating early mornings. During most days in January and February (Figure 6a,b), the solar irradiance is smaller than 400 W/m2, and the heat supplied by the PVa+HP technology is obviously larger than that supplied by the PTw technology. In March and April (Figure 6c,d), the solar irradiance increases, but the PVa+HP technology is still the most effective for the majority of days. A notable exception is the day including the hour index 2220, when the solar irradiance has the largest value in Figure 6, and the PTw technology outperforms the PVa+HP technology, as expected. In June (Figure 6e), the ambient temperature often exceeds in many cases the threshold of 15 °C when the space heating system does not operate. Heating is supplied for a limited time on several mornings, when both technologies have similar performance.
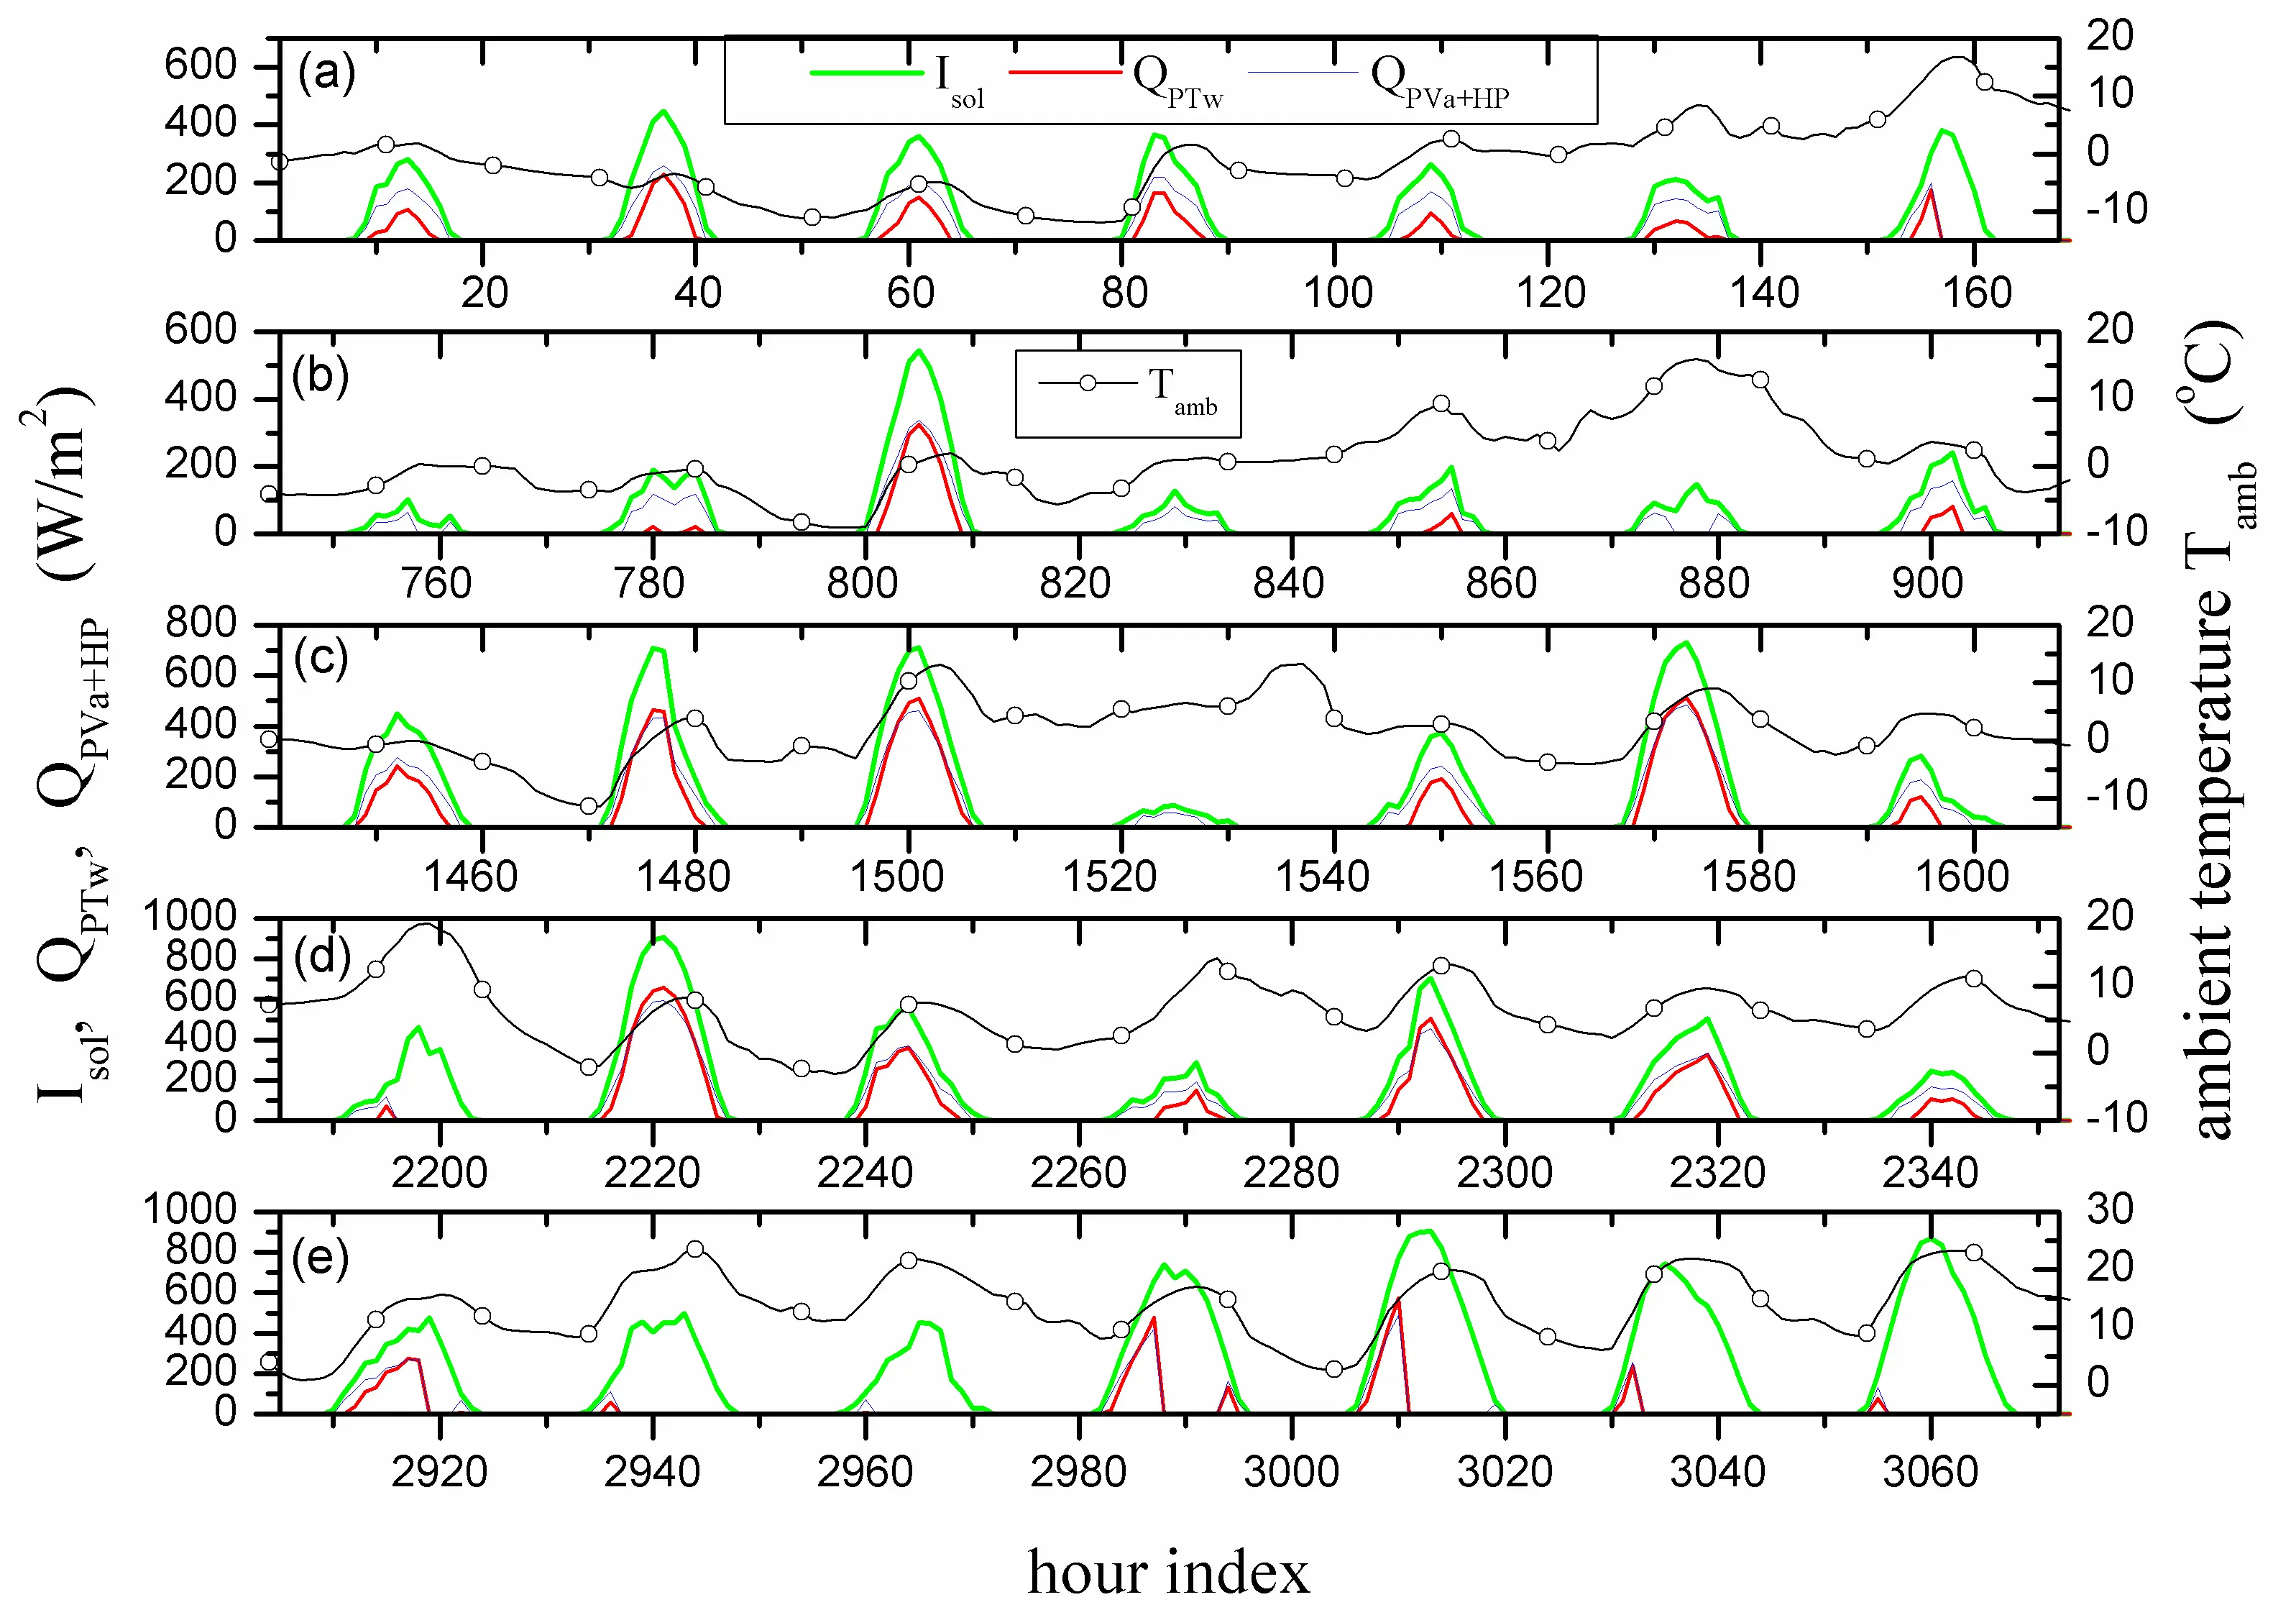
Figure 6. Hourly values of several parameters during the first seven days of January (a), February (b), March (c), April (d), and May (e) of the year 2008 at Rock Springs, US. Tamb—ambient temperature, Isol—solar global irradiance on horizontal surface, QPTw (black area)—heat flux provided per unit of solar energy collection surface area by traditional solar water collectors, QPVa+HP—heat flux provided per unit of solar energy collection surface area by heat pumps driven by semitransparent crystalline silicon (c-Si) solar cells (PVa technology).
5.2. Economic Considerations
While a thorough economic analysis should consider the entire solar system value chain (encompassing design, construction, operation, end-of-life, and recovery or disposal) along with circular strategies for a sustainable business model [15], such an extensive approach is beyond the scope of this work. The primary objective of these economic considerations is to provide a comprehensive perspective that captures a vast multitude of practical scenarios within a concise framework. Creating a model that is both universally applicable and highly specific is a known challenge in renewable energy studies, especially when dealing with data that is inherently dispersed across different temporal and spatial scales.
In real-world applications, solar photovoltaic and thermal systems, as well as heat pumps, are characterized by extreme variability. A truly exhaustive investment analysis must account for several critical dimensions, including:
- (i).
-
Temporal Dynamics: The rapid evolution of technology costs, energy inflation, and the shifting of discount rates over a 25–30-year lifetime.
- (ii).
-
Climatic Diversity: The dependence of system performance on local radiative climates, which directly introduces localized performance and economic variability.
- (iii).
-
System Complexity: The technical nuances of storage requirements, annual degradation rates of components (PV cells, collectors), and installation constraints.
- (iv).
-
Market Fluctuations: The wide range of capital expenditures for equipment like PV panels, solar collectors, and heat pumps.
To address this vast diversity without producing an unmanageably dense study or relying on a single, restrictive case study, the methodology employs broad cost-parameter intervals rather than fixed point-estimates. By utilizing expanded ranges for equipment capital costs (CAPEX), the financial variations caused by fluctuating market prices, regional availability, and long-term operational uncertainties are effectively ‘absorbed’ within the upper and lower bounds of our sensitivity envelope. Consequently, this method deliberately trades high-resolution, site-specific precision for a generalized, macroscopic coverage. This approach allows us to:
- (a)
-
Encompass both legacy cost structures and modern price drops within the same sensitivity envelope.
- (b)
-
Provide a ‘first-order’ economic perspective that remains valid across different regions by accounting for the highest and lowest probable investment thresholds.
- (c)
-
Offer a generalized cost screening framework that serves as a preliminary decision-making tool, identifying trends that persist even when accounting for broad market uncertainties.
While this results in a ‘cruder’ model compared to a localized LCOE or a full Life Cycle Assessment (LCA), it serves the vital purpose of identifying the economic ‘center of gravity’ for these emerging solar space heating technologies amidst a highly fragmented global market. Specifically, rather than modeling multi-year operational and financial timelines as fixed explicit variables, factors such as operation and maintenance (O&M) expenses, inverter replacement costs, heat-pump lifetime limitations, hardware degradation rates, auxiliary electricity penalties, and financial discounting are implicitly encapsulated and absorbed within the broad boundaries of the evaluated cost intervals. This parametric approach ensures that the resulting trends remain robust across a wide spectrum of regional market conditions without binding the conclusions to a single, rigid financial scenario.
Values of the yearly heat provided per unit surface area by different solar space heating systems in 2008 at Rock Springs, US, are shown in Table 3 together with the maximum values of the work density generated by the heat engines of the heat extractors and the maximum values of the photovoltaic power density for different types of solar cells. The heat engines, heat pumps, and solar panels should be sized to cover these maximum values, and, in turn, knowing specific sizes allows for evaluating specific costs. The economic model uses as input the energy performance results for 2008. Figure 5 shows that the energy performance exhibits fluctuations lower than ±20% during 2001–2021. Therefore, this is the expected fluctuation effect on the next economic results. Since data for a single US location are used here, these economic results are expected to better apply in the case of similar temperate climate conditions.
The technologies considered here are used for solar space heating, and they constitute alternatives for classical space heating technologies based on fuels burning. There is a need to know the cost cenergy of thermal energy originating from different energy resources. When heat is provided in the cold season by solar water heaters, the cost ranged worldwide in 2017 between 0.12 and 0.19 USD/kWh for small thermosiphon and pumped systems, respectively [16], and increases for larger systems with larger tanks and pumps. DOE documents state that, for 2023, the average US values were 0.053, 0.114, and 0.158 USD/kWh for natural gas, heating oil, and electricity, respectively [17]. A local natural gas provider in Rock Springs states that for 2023–2024, the cost is 0.043 USD/kWh [18]. In order to cover most available energy sources and the efficiency of burning conventional fuels, the values of cenergy adopted here range between 0.05 and 0.25 USD/kWh.
Table 3. Quantities associated with the operation of different solar space heating technologies in Rock Springs, US, during the year 2008.
|
Yearly Heat Density Provided by Different Systems (kWh/(m2y)) |
||
|---|---|---|
|
Technology |
Symbol |
Value |
|
PTw |
QPTw |
223.8 |
|
PTac |
QPTac |
156.0 |
|
PTao |
QPTao |
206.3 |
|
PTw+Hext |
QPTw+Hext |
264.5 |
|
PTac+Hext |
QPTac+Hext |
166.2 |
|
PTao+Hext |
QPTao+Hext |
219.6 |
|
PVa+HP |
QPVa+HP |
313.4 |
|
PVb+HP |
QPVb+HP |
312.3 |
|
PVc+HP |
QPVc+HP |
154.8 |
|
PVd+HP |
QPVd+HP |
249.3 |
|
PVe+HP |
QPVe+HP |
250.7 |
|
Maximum heat engine power density for different systems (kW/m2) |
||
|
PTw+Hext |
WPTw+Hext,max |
0.03275 |
|
PTac+Hext |
WPTac+Hext,max |
0.00897 |
|
PTao+Hext |
WPTao+Hext,max |
0.00932 |
|
Maximum photovoltaic power density for different systems (kW/m2) |
||
|
PVa |
WPVa,max |
0.1151 |
|
PVb |
WPVb,max |
0.1141 |
|
PVc |
WPVc,max |
0.0606 |
|
PVd |
WPVd,max |
0.0930 |
|
PVe |
WPVe,max |
0.0903 |
The following rules are adopted to simplify the rough economic evaluation. First, the lifetime of a specific solar energy conversion installation is supposed to be 25 to 30 years. Therefore, for an installation to be economically effective, the investment recovery time should be shorter than this time period. Second, heat extractors are used only for improving the energy performance of a given traditional technology. For instance, it makes sense to compare the economic performance of a traditional solar water technology with that of a solar water technology enhanced with a heat extractor, but it makes little sense to compare it with that of a solar air technology enhanced with a heat extractor. Third, since the energy performance of PVa and PVb technologies is quite similar, results for the economic performance of just one of them (PVa) are shown. Fourth, only results for the economic performance of PVd technology are shown since the PVe technology is quite similar in energy performance. Fifth, results for the economic performance of PVc technology are not shown since this technology has a rather reduced energy performance.
5.2.1. Usage of Solar Water Heaters Instead of Solar Air Heaters
Traditional solar space heating is based on flat-plate glazed water heaters and glazed or unglazed air heaters. Water heaters are common in Europe, while air heaters are more popular in North America. Usually, water heaters may provide space heating but also domestic hot water, while air heaters provide only space heating. Therefore, solar water heating has some advantages against solar air heating. However, if only space heating is considered, solar air heating seems to be in a better position. The conditions under which solar water technology can replace solar air technologies for space heating are now being studied.
Table 3 shows that the solar water heating technology provides a larger amount of heat per unit surface area than the two solar air heating technologies considered here (closed circuit and open circuit, respectively). The yearly specific energy saving ΔQ by using the PTw technology instead of PTa technology is given by:
where PTa stands for any of the technologies PTac or PTao. Units for these quantities are given in Table 4.
Table 4. Specific energy and economic quantities associated with the operation of different solar space heating technologies in Rock Springs, US, during the year 2008.
|
Quantity |
Symbol and Units |
|---|---|
|
Yearly heat density provided by systems PTw, PTac and PTao |
QPT (kWh/(m2y)) |
|
Yearly heat density provided by systems PTw+Hext, PTac+Hext and PTao+Hext |
QPT+Hext (kWh/(m2y)) |
|
Yearly heat density provided by systems PVa+HP, PVb+HP, PVc+HP, PVd+HP and PVe+HP |
QPV+HP (kWh/(m2y)) |
|
Yearly specific energy saving |
ΔQ (kWh/(m2y)) |
|
Yearly specific financial economy |
Δm (USD/(m2y)) |
|
Cost of 1 kWh of thermal energy |
cenergy (USD/kWh) |
|
Cost of 1 m2 of installed systems PTw, PTac and PTao |
cPT (USD/m2) |
|
Cost of 1 kW installed of systems PVa, PVb, PVc, PVd and PVe |
cPV (USD/kW) |
|
Cost of 1 kW installed of heat engine |
cHE (USD/kW) |
|
Cost of 1 kW installed of heat pump |
cHP (USD/kW) |
|
Specific investment for systems PTw, PTac and PTao |
iPT (USD/m2) |
|
Specific investment for systems PTw+Hext, PTac+Hext and PTao+Hext |
iPT+Hext (USD/m2) |
|
Specific investment for heat engine |
iHE (USD/m2) |
|
Specific investment for heat pump |
iHP (USD/m2) |
|
Specific investment difference |
Δi (USD/m2) |
|
Investment recovery time |
y (year) |
The yearly specific financial economy Δm obtained by replacing the technology PTa with the technology PTw is given by:
where cenergy is the cost of 1 kWh of thermal energy.
The specific investment iPTw for the water heating technology consists of the cost of unit installed surface area of solar water collector, cPTw, while the specific investment iPTa for the solar air heating technology consists of the cost of unit installed surface area of solar air collector cPTa. The cost of installed solar water collectors ranged in Europe in 2007 between 700 and 1200 EUR/m2 [19]. This includes the cost of collectors, storage tanks and pumps, controllers, and plumbing. More recent US reports show that in 2025 the cost per square meter of collector area ranges from 300–600 USD for flat-plate systems and 400–800 USD for evacuated tube systems, with installation typically adding 30–50% to equipment costs [20]. A cost of around 1000 USD per installed square meter of solar water heaters is mentioned for residential buildings in 2003 for Europe [21] and in 2025 for North America [22]. The covering values of cPTw adopted here range between 700 and 1500 USD/m2. Rather, reduced information exists in commercial or governmental documents about the cost of unit installed surface area of solar air collectors. For agricultural thermal applications, a value of 300 USD/m2 is mentioned for Canada in 2025 [23]. A technical industry document published in 2019 in Australia states that the cost of installed glazed solar air collectors ranges from 300 to 600 USD/m2 [24]. The values of cPTa adopted here range between 300 and 600 USD/m2.
The specific difference of investments Δi between the PTw and PTa technologies, respectively, is given by:
while the investment recovery time y is given in years by:
The investment recovery time y in case that the solar air collectors in open circuit (PTao technology) are replaced by solar water collectors (PTw technology) is very large, of the order of tens or hundreds of years, for cost of installed water collectors cPTw > 700 USD/m2 and the cost of thermal energy cenergy > 0.05 USD/kWh. Therefore, this case of technology replacement is not likely to succeed unless the need for thermal energy storage and domestic hot water is a primary requirement.
Moving from technical viability to financial feasibility, the economic metrics govern the market adoption of these systems. Figure 7 shows the investment recovery time y for replacing solar air collectors in a closed circuit (PTac technology) by solar water collectors. The curves indicate that the financial amortization is highly sensitive to the initial capital expenditure (CAPEX) of the water loop. The PTw technology may be a suitable alternative in case of lower cost of solar water heaters (cPTw < 800 USD/m2) but only if the cost of thermal energy is high (cenergy > 0.2 USD/kWh). The investment recovery time is significantly shorter in case the cost of the air solar collectors to be replaced is high.
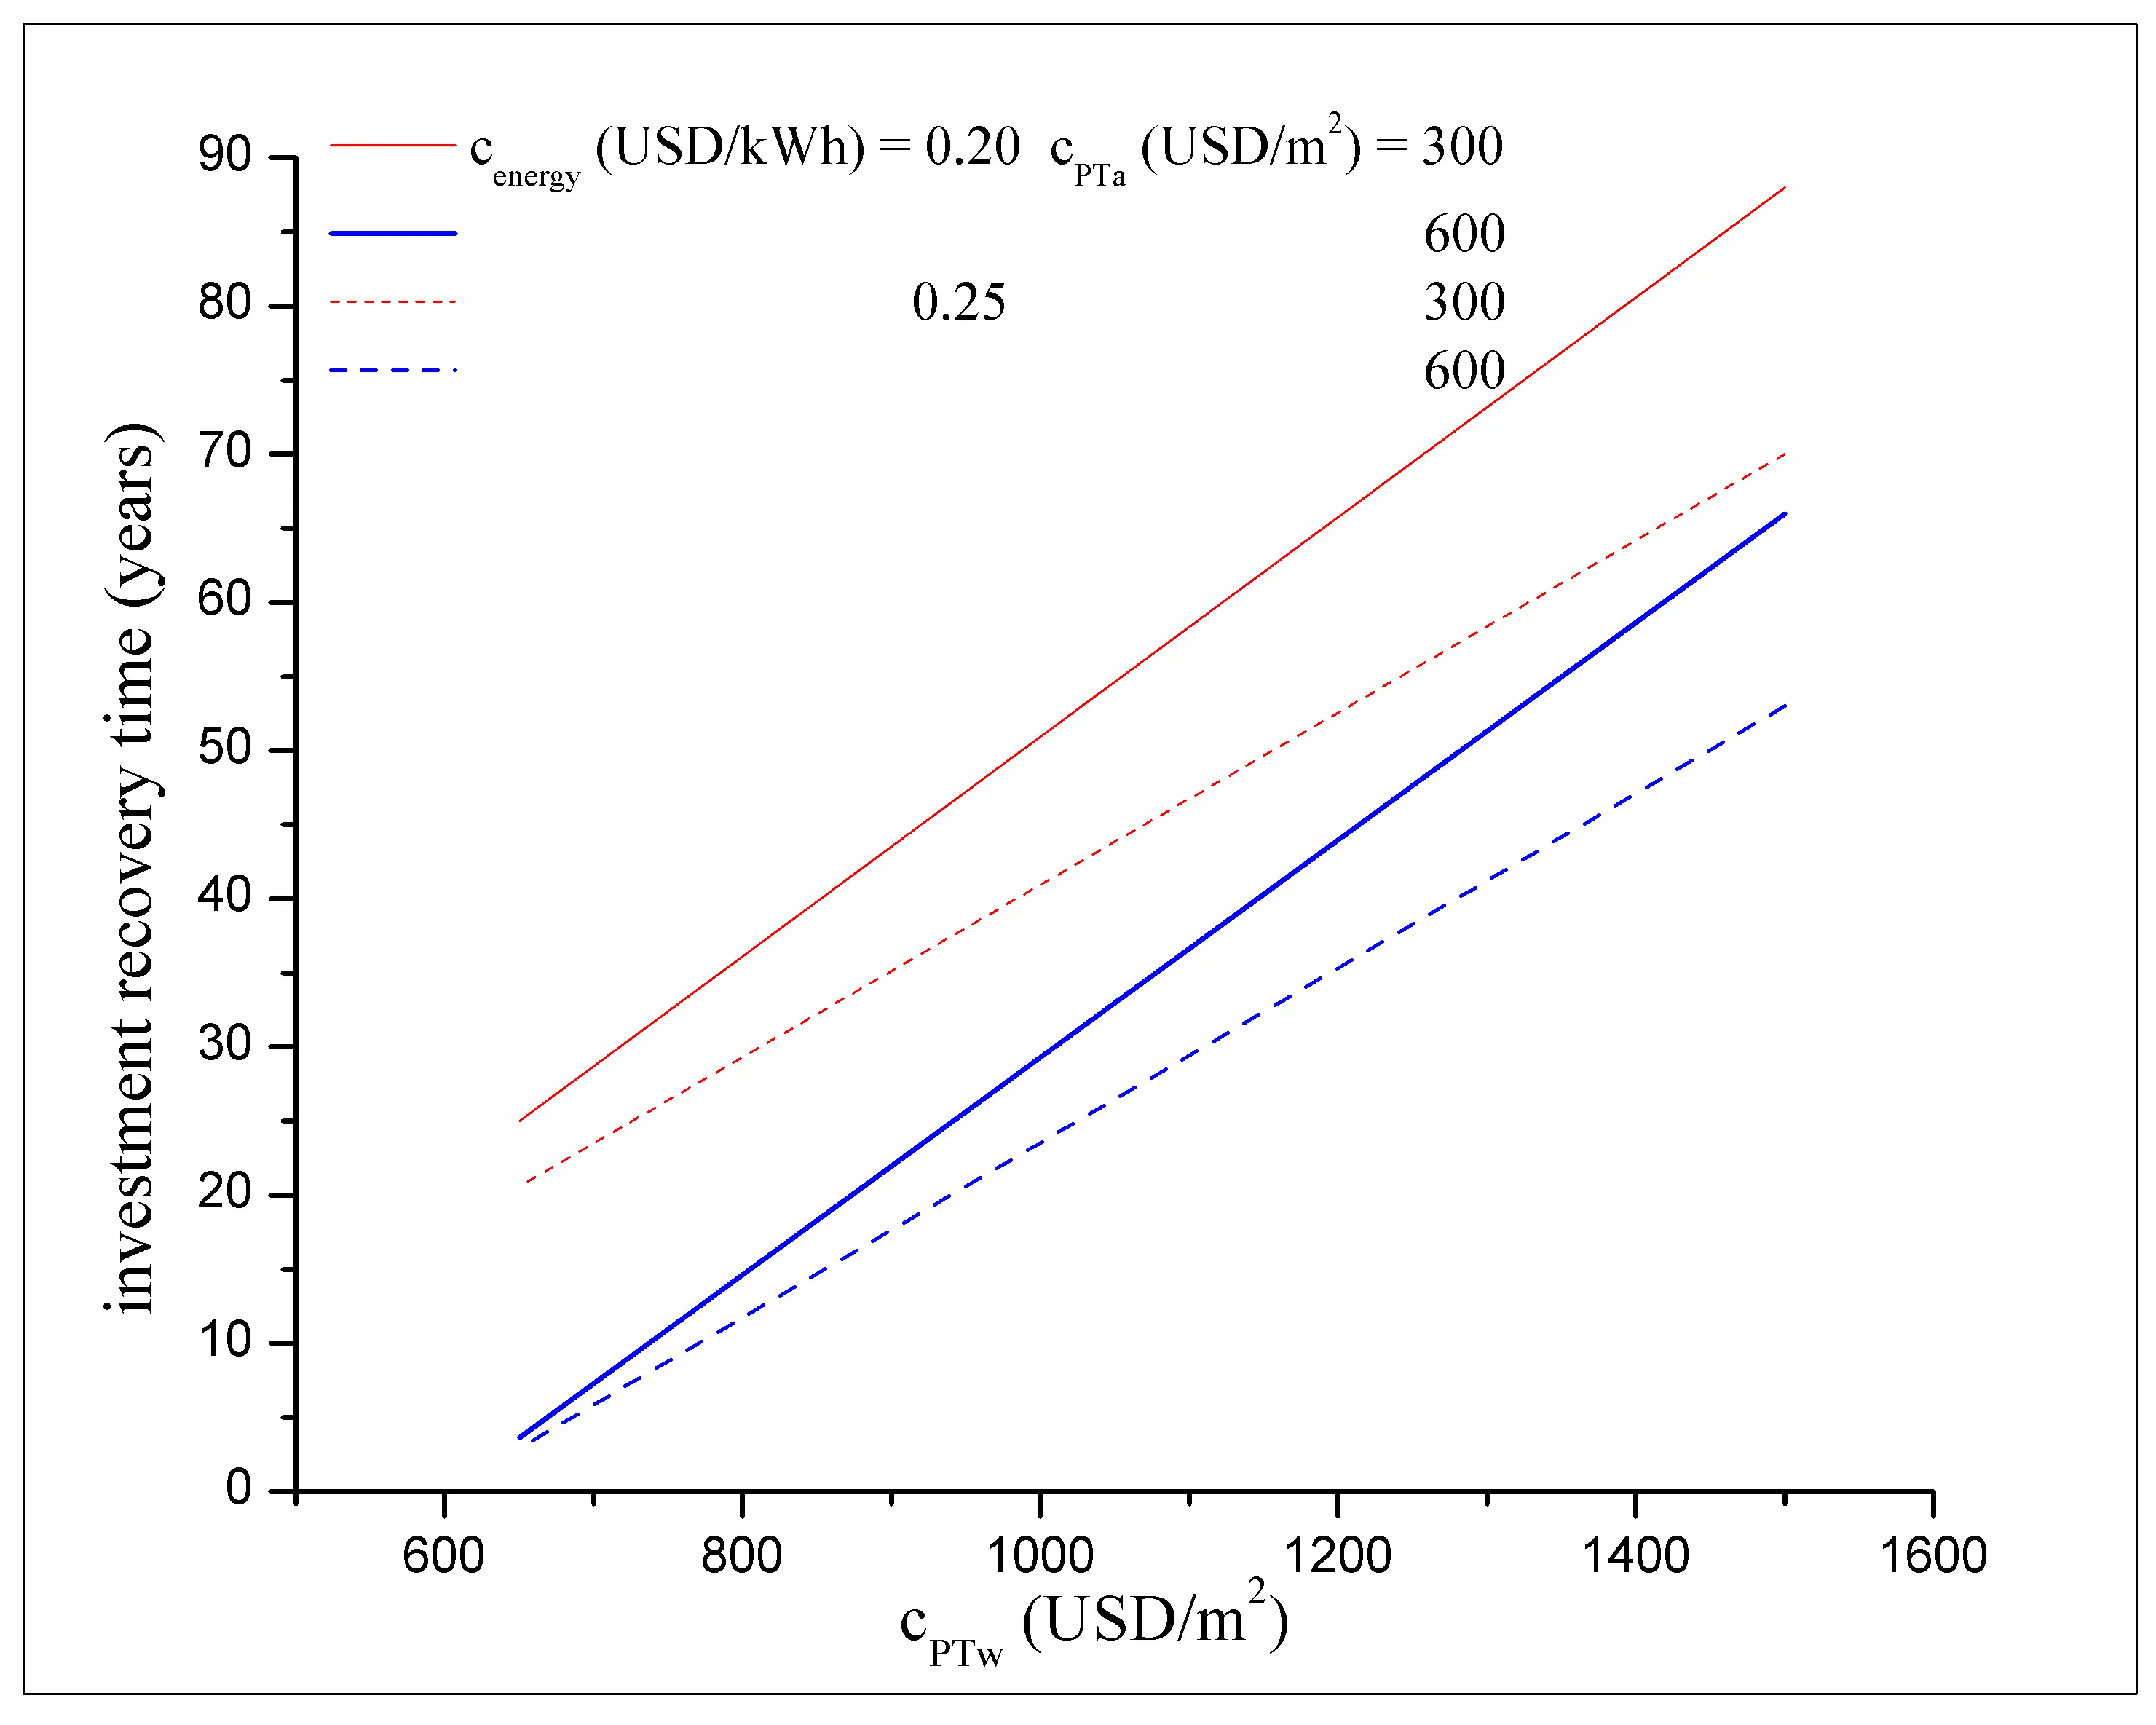
Figure 7. Investment recovery time y for replacing solar air collectors in closed circuit (PTac technology) by solar water collectors (PTw technology) as a function of the specific cost cPTw of installed solar water collectors, for different values of the cost cenergy of thermal energy and cost cPTa of solar air collectors.
Few comments are useful. The main advantage that makes solar water systems preferred in practice for space heating compared to solar air systems is that they also supply domestic hot water. In addition, solar water systems can store thermal energy in tanks for usage during periods when the solar resource is not available. This is a common case in practice. Solar air systems can also store thermal energy, typically in rock beds, but this is not usually done in practice. As a result of this practice, the cost of storage tanks is included in the cost per 1 m2 of installed solar water system. At the same time, the cost of an energy storage unit is not included when calculating the cost per 1 m2 of installed solar air system. Therefore, a more accurate economic comparison between solar water and solar air systems should systematically account for the contribution of storage units to costs in both cases. This means either increasing the cost per 1 m2 of installed solar air system, to account for the cost contribution of a potential energy storage system, or reducing the cost per 1 m2 of installed solar water system, in order to remove the cost contribution of storage.
5.2.2. Usage of PV-Driven Heat Pumps Instead of Photothermal Collectors
Replacing traditional solar space heating systems based on water or air heaters (PTw and PTa technologies) with the emerging technology based on heat pumps driven by PV panels (PV+HP technology) is considered next. Table 3 shows that the systems based on PV cells generate a larger amount of heat per unit collection surface area than photothermal collectors. Therefore, the yearly specific energy saving ΔQ when using the PV+HP technology is given by:
where PV stands for any of the panels PVa, PVb, PVc, PVd, or PVe, while PT stands for any of the technologies PTw, PTac, or PTao. The yearly specific financial economy Δm obtained by replacing the PT technology with the PV+HP technology is given by Equation (17).
The specific investment iPT for the PT technology consists of the cost of the installed unit surface area of the solar thermal water (or air) collector cPT. The specific investment iPV for the PV panel is:
where cPV is the cost of 1 kW generated per installed PV panel. In Equation (21) one has taken into consideration that the size of the PV panel should be large enough to generate the power WPV,max associated with the maximum available solar radiation flux.
Crystalline silicon (PVa and PVb) panels are the vast majority of US deployments and installed cost per kW includes the module cost and the cost of inverters, rectifying wiring, labor, permitting and soft cost. For typical residential US systems, the cost ranged in 2023 between about 2500 and 3100 USD/kW [25]. A 2025 report shows that the cost of PVb ranges for typical residential houses between 2500 and 3500 USD/kW for basic installation in the US, while in Germany/The Netherlands and Spain/Italy it ranges between 1200–1800 and 1000–1400 EUR/kW, respectively [26]. The values of cPVa adopted here range between 2500 and 3500 USD/kW.
Thin films PV cells (including CdTe) (PVd) are less often installed than crystalline silicon PV cells. An installed cost estimate for a CdTe PV system located in Albuquerque, US, is 3100 USD/kW [27]. Since the cost is expected to decrease when the PVd technology becomes more mature, the following range of variation for the cost cPVd is adopted here: 2000 to 3100 USD/kW.
The specific investment iHP for the heat pump is given by:
where cHP is the cost of 1 kW consumed per installed heat pump. In Equation (22), one has taken into consideration that the size of the heat pump should be large enough to be driven by the power WPV,max generated by the PVa or PVd panels.
Heat pumps based on Organic Rankine Cycles (ORCs) are well suited to be used for residential applications in the range of temperatures considered here. An industry document used for ORC presentation mentioned a cost of 1800 to 3000 USD/kW [28]. The values of cHP adopted here range between 1800 and 3500 USD/kW.
The specific investment for the PV+HP technology is given by:
The specific difference of investments Δi between the PV+HP and PT technologies, respectively, is given by:
while the investment recovery y is given in years by Equation (19).
The investment cost in the PV-driven heat pumps (PV+HP technology) per unit area of solar energy collection surface is lower than that in the case of solar water collectors (PTw technology). Also, the energy provided by PVa+HP and PVd+HP technologies is higher than that of PTw technology (see Table 3). Therefore, from an economical point of view, the PVa and PVd-driven heat pumps may be used to replace solar water collectors, unless the need for domestic hot water is a primary requirement.
Replacing solar air collectors by PV-driven heat pumps requires further comments. Figure 8 shows the investment recovery time y for replacing solar air collectors in a closed circuit (PTac technology) by the PVa+HP and PVd+HP technologies. Generally, the investment recovery time y decreases by decreasing the cost cPV of installed PV cells, as expected.
The case of PVa cells and low cost thermal energy (cenergy = 0.1 USD/kWh) is considered in Figure 8a. Then, the investment recovery time y is small for high cost of solar air collectors, and it is negative for low cost heat pumps. This applies even for large cost values of PVa cells. Therefore, in these cases the PVa+HP technology is a recommended replacement alternative for PTac technology. For more expensive solar air heaters and low-cost heat pumps, the recovery time is less than 20 years, but increases significantly by increasing the cost of the heat pumps.
The investment recovery time y is very small (less than 1 year) in case the PVd+HP technology replaces expensive solar air collectors (cFTa = 600 USD/m2) at a thermal energy cost of 0.1 USD/kWh. Figure 8b shows the recovery time y in case low-cost solar air collectors (cFTa = 300 USD/m2) in closed circuit are replaced by the PVd+HP technology. Smaller values of y are obtained in the case of low-cost heat pumps and thermal energy cost of 0.15 USD/kWh.
Generally, the PVa+HP technology is in a better position than the technology PVd+HP to replace solar air collectors operating in a closed circuit (compare the investment recovery time in Figure 8a,b).
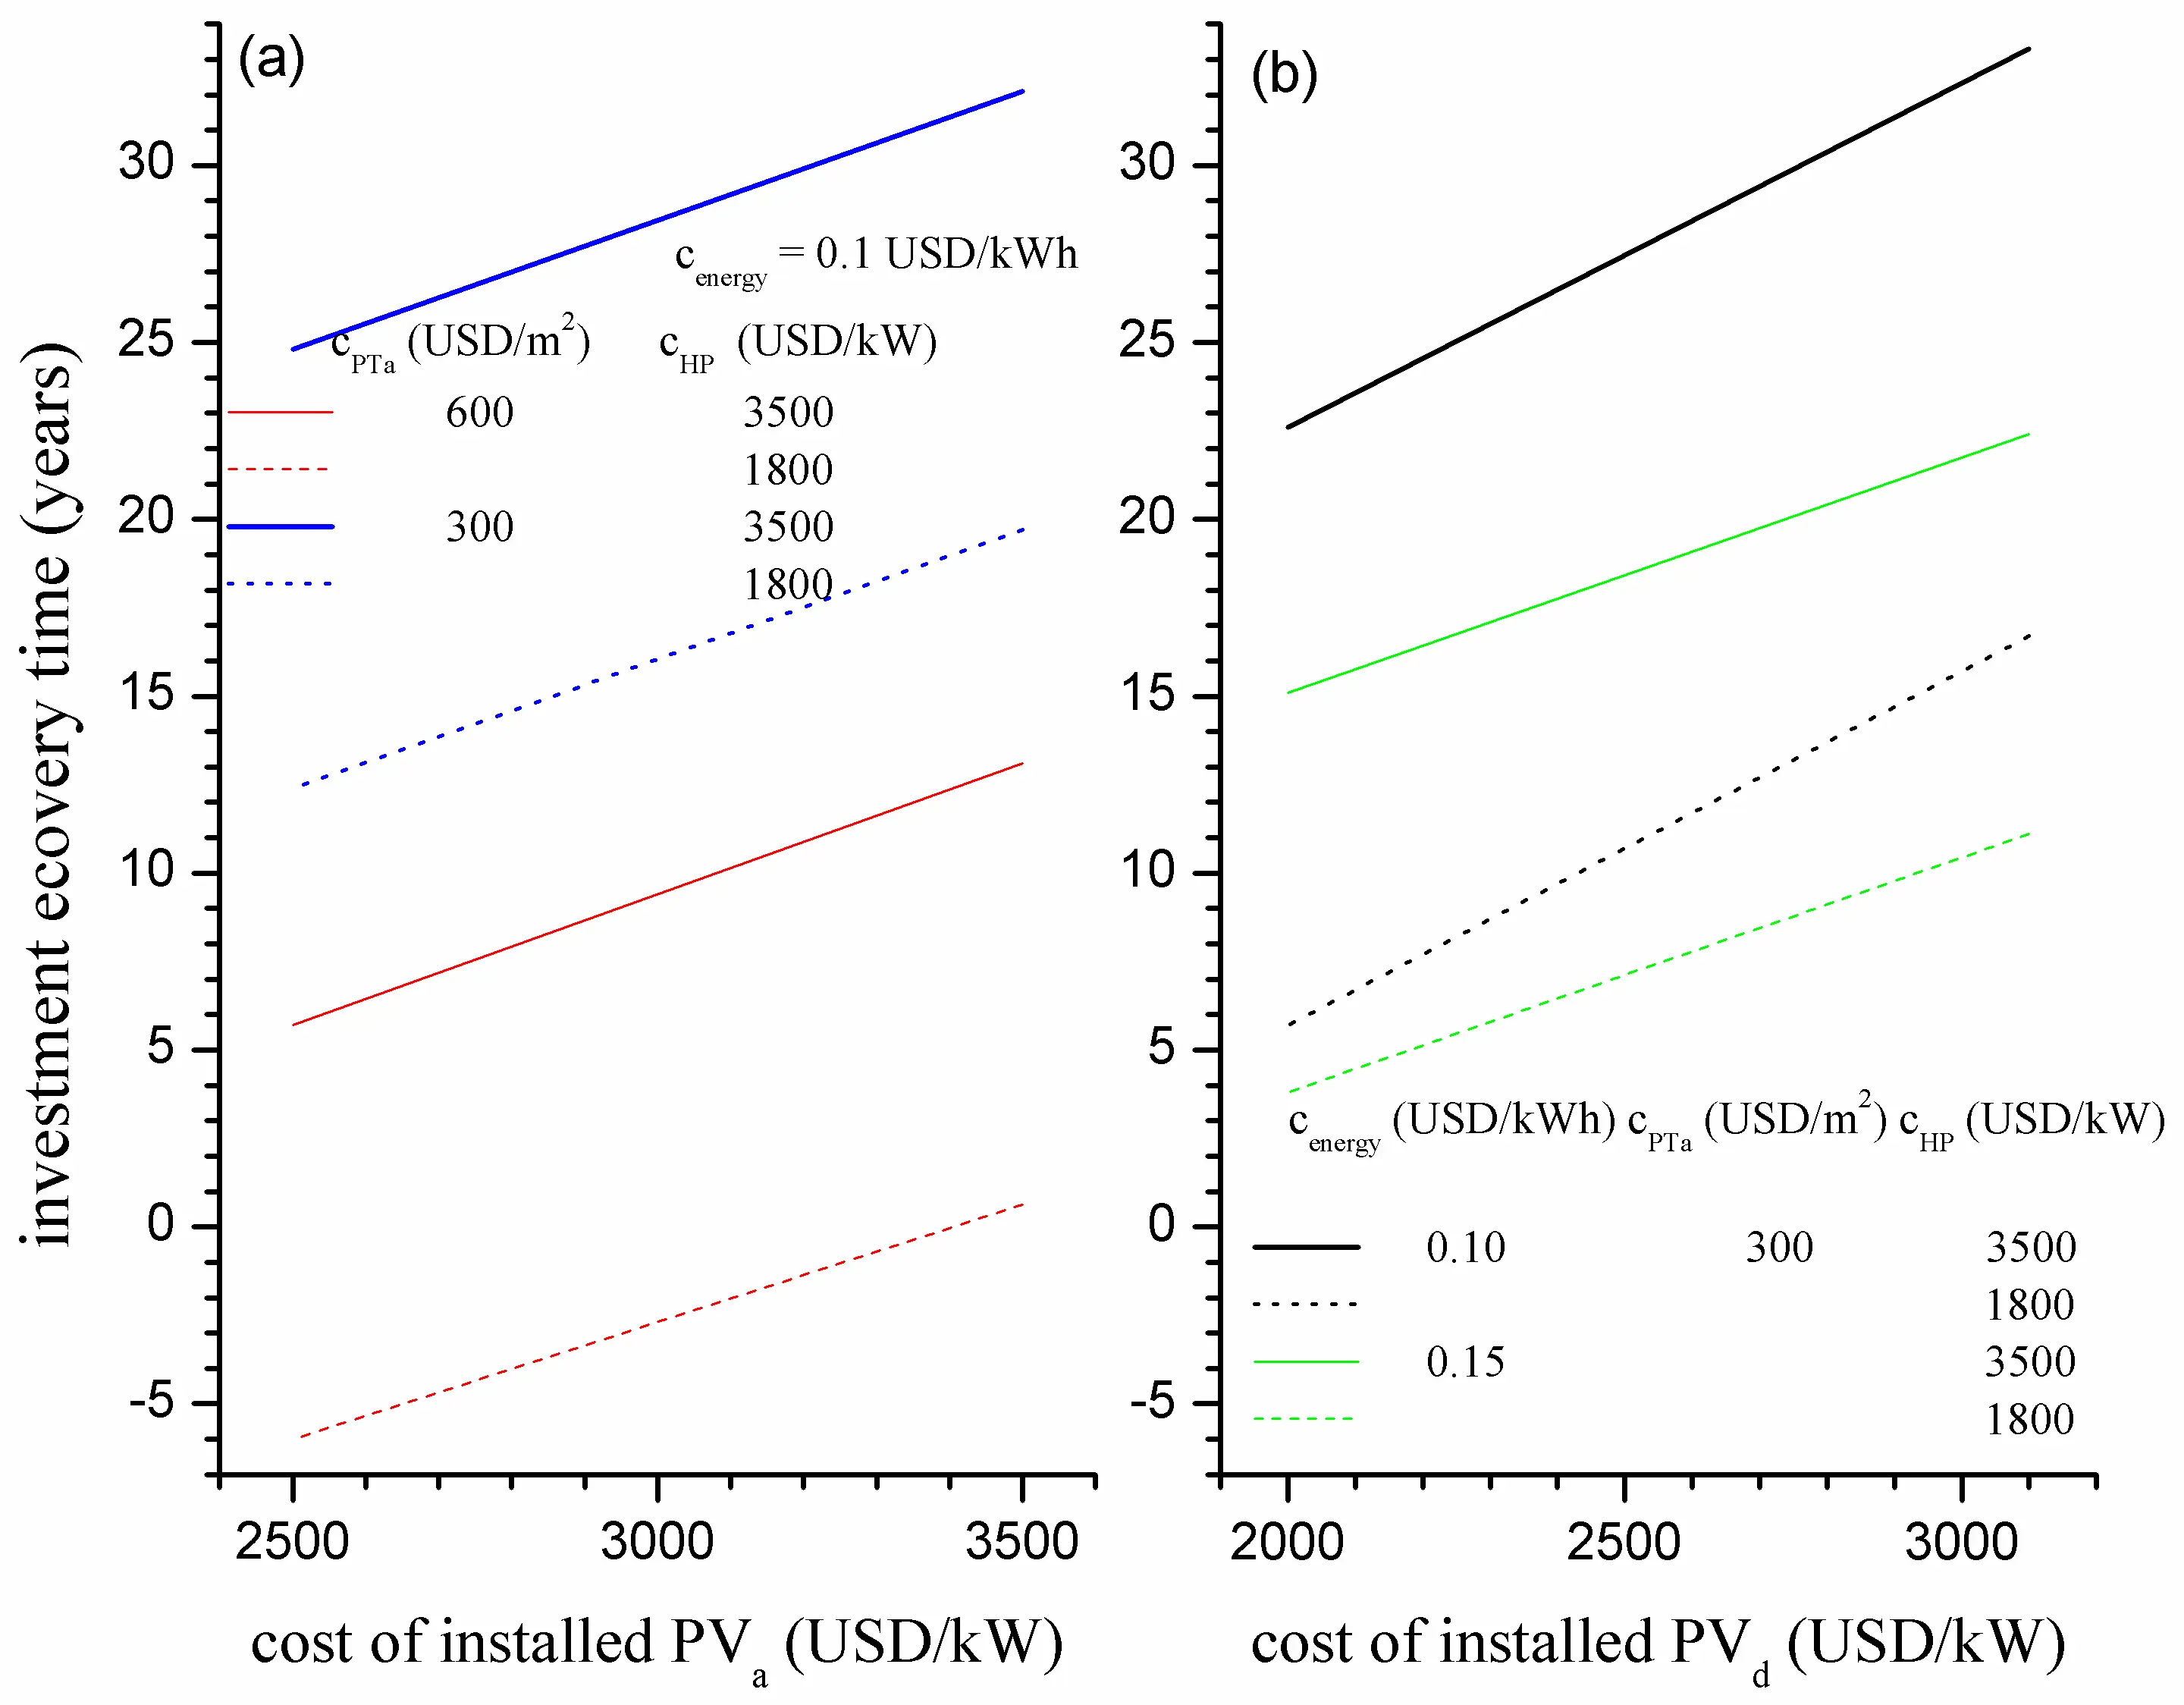
Figure 8. (a) Investment recovery time y for replacing solar air collectors in a closed circuit (PTac technology) by heat pumps driven by crystalline silicon solar cells (PVa+HP technology) as a function of the specific cost cPVa of installed PVa panels. (b) as (a) for replacing the PTac technology with (cFTa = 300 USD/m2) by heat pumps driven by CdTe solar cells (PVd+HP technology) as a function of the specific cost cPVd of installed PVd panels. Different values of the specific cost cenergy of thermal energy, specific cost cPTa of solar air heaters, and specific cost cHP of heat pumps are considered.
The investment recovery time y for replacing solar air collectors in open circuit (PTao technology) by the PVa+HP and PVd+HP technologies is very high, exceeding 30 years, in case the cost cenergy of thermal energy is lower than, or equal with 0.1 USD/kWh. At higher energy costs the PV+HP technology becomes competitive (see Figure 9). Generally, the investment recovery time y decreases by decreasing the cost cPV of installed PV cells, as expected. The trends in Figure 9 clearly mark the critical tipping points where escalating conventional electricity tariffs drastically compress the investment recovery time, making the PV-driven heat pump an economically dominant solution when conventional energy prices cross the 0.25 USD/kWh threshold.
Semitransparent crystalline silicon (PVa) cells are attractive at $$c_{{energy}} = 0.1\ \mathrm{USD/kWh}$$ as a replacement for solar air collectors of high-cost ($$c_{{FTa}} = 600\ \mathrm{USD/m^2}$$) operating in open circuit (Figure 9a). When low-cost heat pumps are considered ($$c_{{HP}} = 1800\ \mathrm{USD/kW}$$), y becomes negative for lower cost PVa cells. Therefore, in this case, the PVa+HP technology is recommended as a replacement for the PTao technology since it has a lower investment cost and higher annual heat supply. The investment recovery time for lower cost solar air collectors ($$c_{{FTa}} = 300\ \mathrm{USD/m^2}$$) in open circuit is rather small, only for low-cost heat pumps ($$c_{{HP}} = 1800\ \mathrm{USD/kW}$$) and reduced cost of the PVa cells.
CdTe (PVd) cells become economically attractive only for costs of thermal energy higher than 0.2 USD/kWh (Figure 9b). Shorter investment recovery time of the PVd+HP technology occurs in case of low-cost heat pumps ($$c_{{HP}} = 1800\ \mathrm{USD/kW}$$).
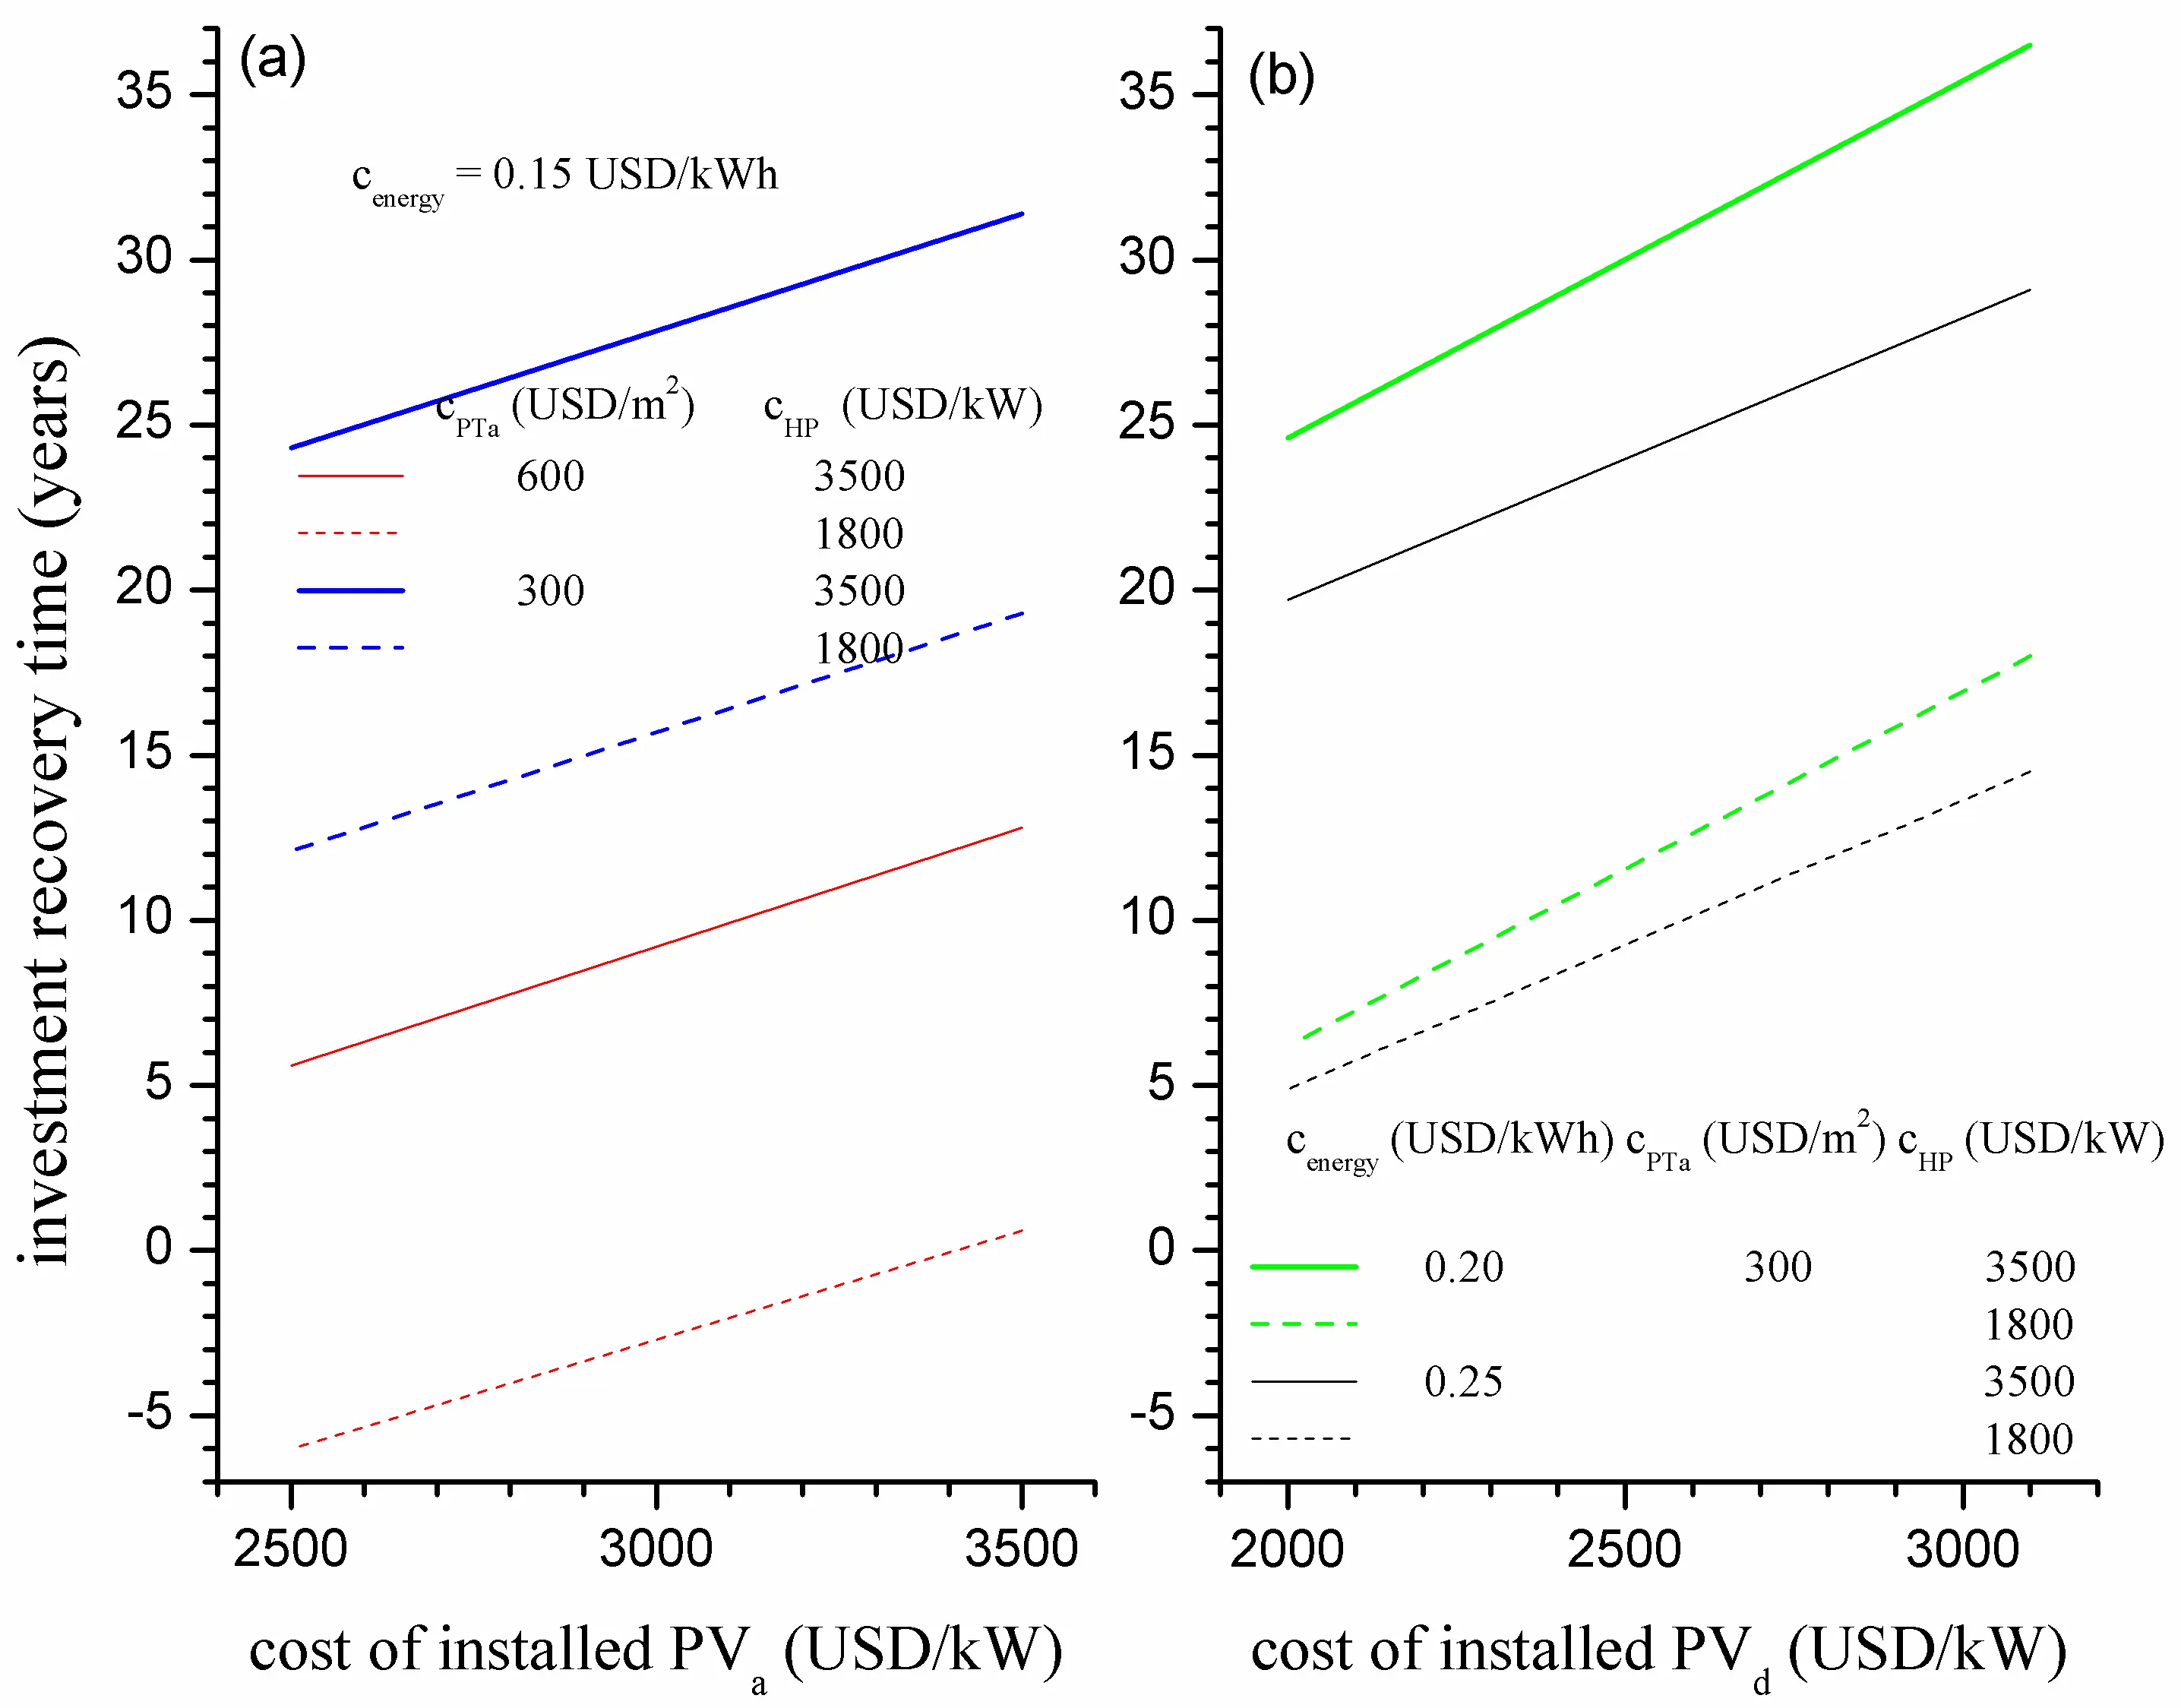
Figure 9. (a) Investment recovery time y for replacing the PTao technology by the PV1+HP technology as a function of the specific cost cPVa of installed PVa panels. (b) as (a) for replacing the PTao technology with $$c_{{FTa}} = 300\ \mathrm{USD/m^2}$$ by the PVd+HP technology as a function of the specific cost cPVd of installed PVd panels. Different values of the specific cost cenergy of thermal energy, specific cost cPTa of solar air heaters, and specific cost cHP of heat pumps are considered.
Generally, the PVa+HP technology is in a better position than the technology PVd+HP to replace solar air collectors operating in open circuit (compare the investment recovery time in Figure 9a,b). Also, the PV+HP technologies are less suited to replace air collectors in open circuit than air collectors in closed circuit (compare Figure 8 and Figure 9).
5.2.3. Usage of Heat Extractor Technology Instead of Photothermal Collectors
Replacing traditional solar space heating systems based on water or air heaters with the emerging technology based on solar heat extractors is considered next. Table 3 shows that the solar heat extractor technology (PT+Hext) supplies a larger amount of heat per unit collection surface area than traditional photothermal (PT) technologies. Therefore, the yearly specific energy saving $$\Delta Q$$ when using the PT+Hext technology is given by:
where PT stands for any of the technologies PTw, PTac, or PTao. The yearly specific financial economy $$\Delta m$$ obtained by replacing the technology PT with the technology PT+Hext is given by Equation (17).
The specific investment $$i_{PT}$$ for the PT technology consists of the cost $$c_{PT}$$ of unit installed surface area of thermal solar collector, while the specific investment for the technology PT+Hext is given by:
where $$c_{HE}$$ and $$c_{HP}$$ are the cost of 1 kW installed of a heat engine and a heat pump, respectively. In Equation (26) one has taken into consideration that the power provided by the heat engine is integrally consumed by the heat pump and that the size of the heat engine and heat pump should be large enough to be driven by the maximum available heat flux density provided by the photothermal collectors.
Organic Rankine Cycles (ORCs), Thermoelectric generators (TEGs), and Stirling engines are recommended to be used for low grade heat recovery. For medium to large scale installed ORC systems the cost ranged in 2025 between 1500 and 3500 USD/kW [29]. The initial capital cost for TEGs is large, depending on material quality and manufacturing complexity. A field test cost analysis of a geothermal power project estimates that an installed TEG system with a 152 °C temperature difference would cost about 13,900 USD/kW [30]. The cost of installed Stirling engines ranges between 3300 and 7500 USD/kW [31]. Also, installed Stirling engines used in micro-CHP applications have an initial capital cost of around 10,000 USD/kW [31]. The values of $$c_{HE}$$ adopted here range between 2000 and 10,000 USD/kW.
The specific difference of investments $$\Delta i$$ between the PT+Hext and PT technologies, respectively, is given by:
while the investment recovery time y is given in years by Equation (19).
In case the cost $$c_{energy}$$ of thermal energy is lower than 0.15 USD/kWh the investment recovery time y for replacing the PTw, PTac, and PTao technologies by the PTw+Hext, PTac+Hext, and PTao+Hext technologies is very high, generally exceeding 30 years. Figure 10 shows the investment recovery time y for higher values of $$c_{energy}$$. When $$c_{energy} = 0.15\ \mathrm{USD/kWh}$$, the PT+Hext technology may be suitable to replace the PT technology only for low-cost heat engines ($$c_{{HE}} < 2000\ \mathrm{USD/kW}$$) and heat pumps ($$c_{{HP}} = 1800\ \mathrm{USD/kW}$$) (Figure 10a). At higher cost of thermal energy ($$c_{{energy}} = 0.25\ \mathrm{USD/kWh}$$), the PT+Hext technology may replace the PT technology when low-cost heat engines ($$c_{{HE}} < 2000\ \mathrm{USD/kW}$$) are used (Figure 10b). This detailed breakdown demonstrates that the heat extractor configurations only enter a realistic financial amortization zone (under 15 years) when competing against subsidized or artificially high fossil fuel costs, confirming their status as a specialized niche technology.
Generally, the PT+Hext technology may be used to replace the PT technology at present-day costs of solar thermal collectors, heat engines, and heat pumps only in special circumstances characterized by very high cost of thermal energy.
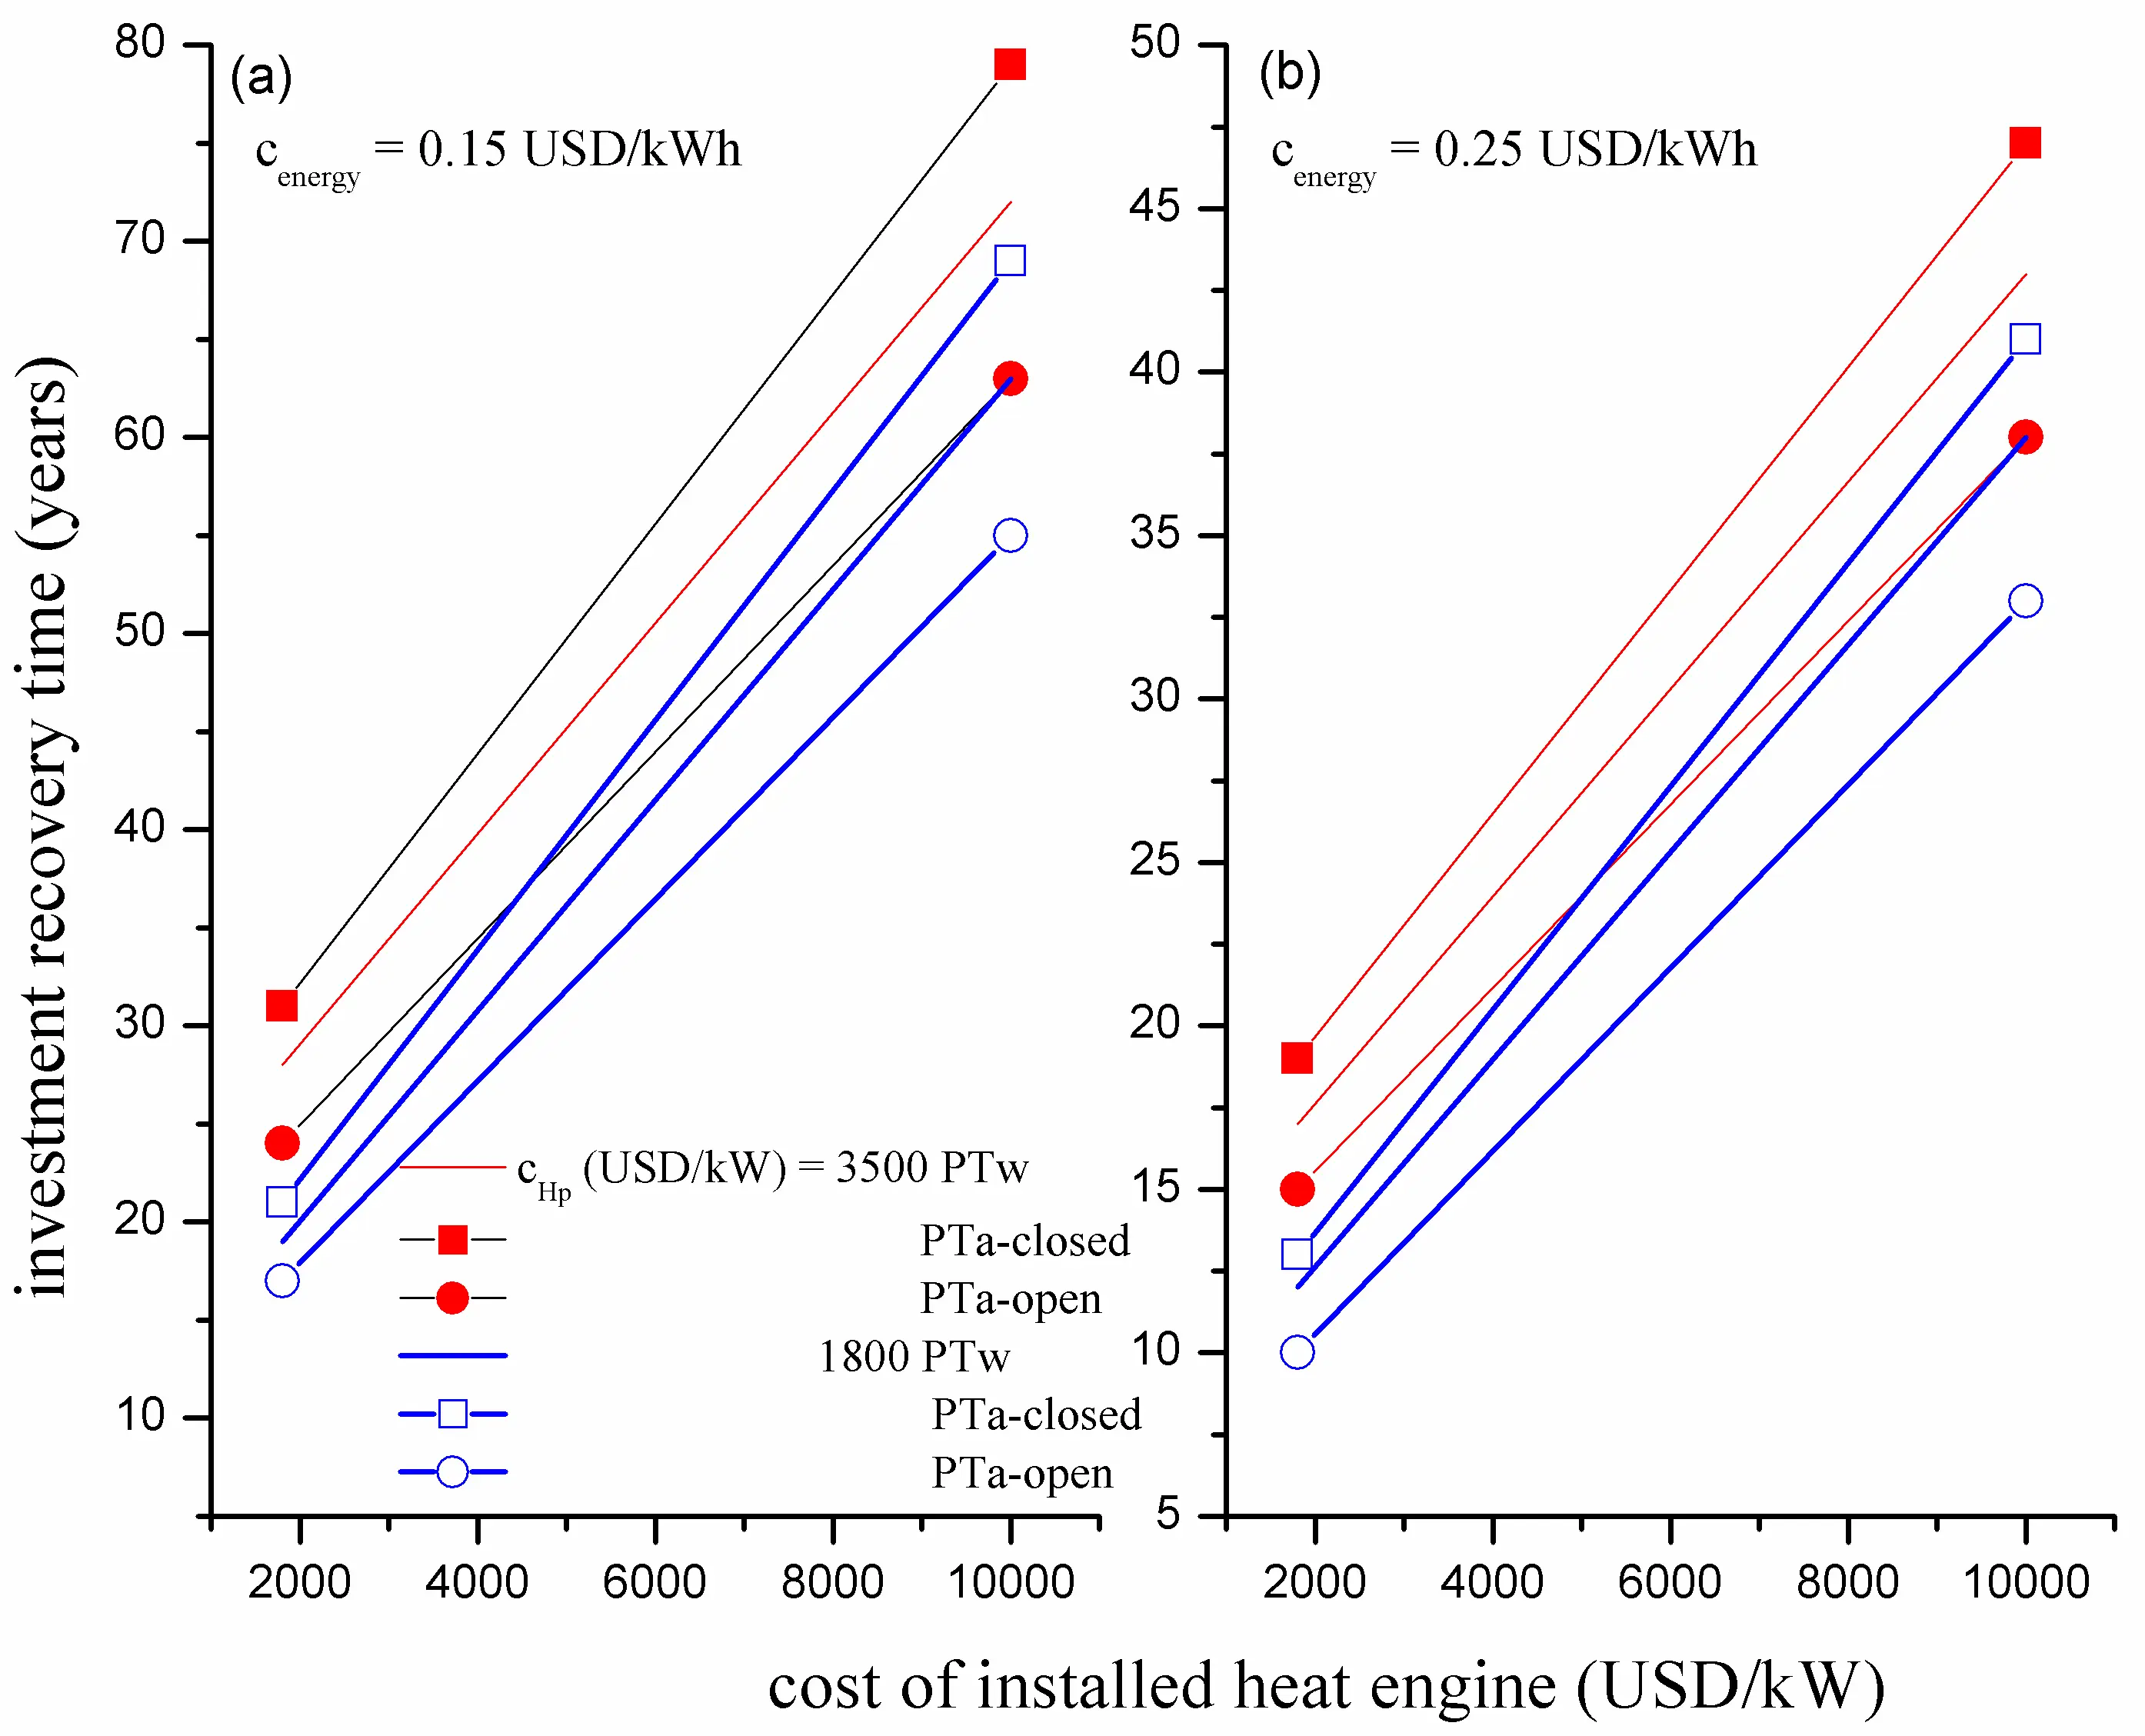
Figure 10. Investment recovery time y for replacing solar water collectors, solar air collectors in closed circuit, and solar air collectors in open circuit (PTw, PTac, and PTao technologies, respectively) by solar heat extractors (PTw+Hext, PTac+Hext, and PTao+Hext technologies, respectively), as a function of the specific cost $$c_{{HE}}$$ of the heat engine of the heat extractor. (a) specific cost $$c_{{energy}}$$ of thermal energy is 0.15 USD/kWh. (b) $$c_{{energy}}$$ is 0.25 USD/kWh. Different values of the specific cost $$c_{{HP}}$$ of the heat pump of the heat extractor are considered.
6. Conclusions
Traditional solar space heating is performed by using solar water and air collectors. Emerging solar space heating technologies are those based on PV-driven heat pumps and solar heat extractors based on photothermal collectors. The energy performance of these traditional and emerging technologies is compared per unit of collection area under idealized operating and storage conditions, thereby explicitly distinguishing this study from a full building-level heating system simulation. To evaluate the technology performance within a defined radiative framework, meteorological and radiometric data at Rock Springs, US, during the years 2001–2022 are used as the primary localized case study.
When traditional solar space heating technologies are intercompared, solar water heaters have the highest energy performance; solar air heaters operating in closed circuit have the lowest performance, while solar air heaters operating in open circuit are in between.
Heat pumps driven by five types of PV cells are considered: crystalline semitransparent cells (PVa), crystalline opaque cells (PVb), amorphous silicon cells (PVc), CdTe cells (PVd), and CIGS cells (PVe). Semitransparent crystalline cells are the most energy effective while amorphous cells are the least energy effective. Cells based on CdTe are between. The difference between the heat flux supplied by heat pumps driven by these cells increases at higher values of the useful heat flux.
Solar space heating technologies based on photothermal solar collectors and heat extractors, which are not treated extensively in literature, are more energy efficient than traditional technologies based on solar water and air heaters, but the heating gain factor is rather reduced, below 1.2. The emerging technologies based on solar air heaters and heat extractors are not likely to be of future interest, while the emerging technology based on solar water coupled with heat extractors might be of interest, especially in climates where the air temperature does not drop too much below the freezing point.
The maximum useful heat flux density supplied by the traditional solar heating technologies, based on thermal collectors, is generally larger than that provided by heat pumps driven by solar cells. Traditional solar space heating technologies are more energy effective than PV-driven heat pumps at higher values of the useful heat flux but are less effective at smaller useful heat flux values. At very small useful heat flux values, the traditional technologies stop operation, but the PV-driven heat pumps are still operating.
During one year of operation the technology based on heat pumps driven by crystalline semitransparent silicon solar cells is more energy effective than the traditional solar water collector technology despite the last technology outperforms the former technology at large values of the heat flux supplied. This is explained by the fact that during most part of the heating season the incident solar global irradiance at Rock Springs is rather low level and at this low level the PV-based technology is more energy effective than the photothermal technology. Therefore, at large values of the useful heat flux the traditional space heating technologies outperform the emerging technologies based on heat pumps driven by solar cells but when the energy performance of traditional and emerging space heating technologies is compared on long term the result it is likely to depend on the radiative climate of the location, or in other words, on the number of hours with larger or small values of the solar global irradiance.
The useful heat provided per unit collection surface area changes from year to year. The yearly values of the useful heat range between about 20–35% of the maximum value for traditional solar space heating technologies and between about 15–20% of the maximum value for the PV-driven heat pump technologies.
A crude economic analysis has been performed to estimate the perspectives of the emerging solar space heating technologies. The originality of the economic analysis is perhaps less obvious. Instead of the conventional approach based on fixed input data—which suffers from the dual disadvantage of covering a limited range of scenarios and losing relevance after a short period due to market dynamics—we adopted the variation intervals method. While this approach has the disadvantage of yielding less specific results, it allows for a multitude of scenarios to be covered and offers the added advantage of providing a clearer perspective within the context of a dynamically evolving technical and economic environment. Operation data during the year 2008 at Rock Springs has been used.
Solar water collectors are not likely to replace solar air collectors in an open circuit for space heating unless the need for thermal energy storage and domestic hot water is a primary requirement. Expensive solar air collectors in closed circuit may be replaced by low-cost solar water collectors but only if the cost of thermal energy is high ($$c_{energy}>0.2\ \mathrm{USD/kWh}$$).
Heat pumps driven by crystalline silicon or CdTe solar cells may replace solar water collectors for space heating, but only if the need for domestic hot water is not of primary interest. Crystalline silicon solar cells coupled with low-cost heat pumps may replace expensive closed circuit air collectors. If CdTe solar cells are considered, replacement is recommended if the cost of thermal energy is higher than 0.15 USD/kWh. PV-driven heat pumps are less suited to replace air collectors in an open circuit than air collectors in a closed circuit. Generally, crystalline silicon solar cells are in the best position when coupled with heat pumps to replace closed circuit or open circuit air collectors for space heating.
When present-day costs of solar thermal collectors, heat engines, and heat pumps are considered, the solar heat extractor technology may replace traditional solar thermal technologies for space heating only in special applications when the cost of available thermal energy is very high ($$c_{energy}\ge0.25\ \mathrm{USD/kWh}$$).
In summary, this 22-year longitudinal assessment yields three fundamental insights for the transition toward high-performance solar space heating. First, the transition from traditional photothermal collectors to emerging PV-driven heat pumps shifts the system’s operational sweet spot from high-irradiance peaks to long-duration, low-ambient solar conditions, making PV-heat pumps more energetically effective over full heating seasons. Second, the operational stability of these systems is highly climate-dependent, with yearly useful heat yields fluctuating within narrow, predictable bands (20–35% for thermal, 15–20% for PV-driven systems). Third, from a macro-economic perspective, crystalline silicon solar cells integrated with low-cost heat pumps represent the most immediate and economically viable replacement for legacy closed-circuit thermal systems, setting a clear technological benchmark for future residential energy retrofits.
The findings of this research carry direct implications for both the renewable energy industry and local communities. For system designers, project developers, and manufacturers, the established feasibility maps provide a reliable tool to de-risk investments by identifying the exact radiative and economic thresholds (e.g., thermal cost boundaries of 0.15 USD/kWh) where emerging technologies become profitable. For the community and policymakers, this work supports the decarbonization of residential heating—one of the largest contributors to urban carbon footprints. By demonstrating that PV-driven heat pumps remain operational and effective at low solar irradiance levels when traditional systems fail, this study provides a clear roadmap for reducing household energy bills and enhancing energy security in regions subject to highly variable climatic conditions.
Appendix A
Two types of PV modules are considered here: opaque and semitransparent [32,33]. Opaque PV modules have a white Tedlar plate on the back (Figure A1), unlike semitransparent PV modules (Figure A2) where a transparent glass plate is used.
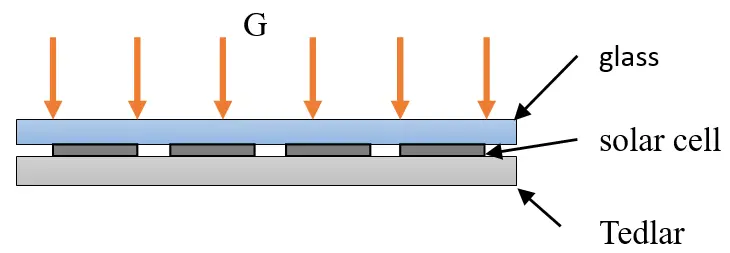
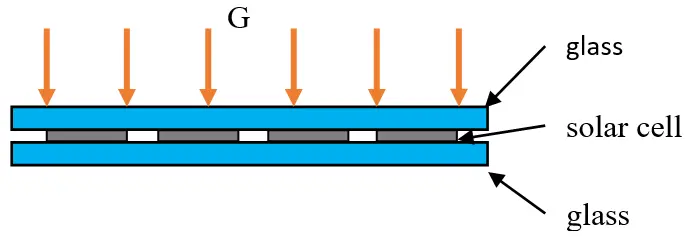
The efficiencies of PV modules are usually estimated based on energy balance equations, taking into consideration the following assumptions: (i) heat transfer through conduction is one dimensional; (ii) the system is in quasi-steady state; (iii) the losses due to the electrical resistance of the circuits in the PV modules are negligible.
Several types of PV cells are considered: crystalline silicon (c-Si) (for both opaque and semitransparent PV modules), amorphous silicon (a-Si), cadmium telluride (CdTe), and copper indium gallium selenide (CIGS) (for semitransparent PV modules). Different combinations are treated next. Simple relationships for the conversion efficiency of solar energy into electrical energy are shown for all cases. These relationships take into account that in operation, the cell temperature is larger than the ambient temperature.
Appendix A.1. Opaque PVa Modules (Glass to Tedlar, with Cells c-Si)
The solar radiation absorbed by these PV modules is converted into useful electrical energy and thermal energy, which is lost in the environment through the glass and Tedlar plates. The efficiency $$\eta_{PV}$$ is calculated with the following relationship [32]:
Here, $$\eta_{0}=0.142$$ is the electrical efficiency of the (c-Si) PV module at the reference temperature $$T_{0}=25\,^{\circ}\text{C}$$, under incident solar irradiance 1000 W/m2, $$\beta_{0}=0.0062\ \mathrm{K}^{-1}$$ is the temperature coefficient of the PV module, $$\tau_{0}=0.95$$ is glass transmittance, $$\alpha_{m}=0.9$$ is PV cell absorptance, $$\beta_{m}=0.95$$ is PV cell packing factor and $$\alpha_{T}=0.5$$ is Tedlar absorptance. The overall heat transfer coefficient from the PV module to the outdoor is $$U_{L}=U_{T}+U_{B}$$, where $$U_{T}=50\,\mathrm{W}/(\mathrm{m}^{2}\mathrm{K})$$ is the heat transfer coefficient from PV cell to outdoor through the top glass cover and $$U_{B}=\left(L_{T}/K_{T}+h_{i}^{-1}\right)^{-1}$$ is the heat transfer coefficient from PV cell to outdoor through the back Tedlar plate. Also, $$L_{T}=0.0005\,\mathrm{m}$$ is the thickness of Tedlar layer and $$K_{T}=0.033\,\mathrm{W}/(\mathrm{m}\mathrm{K})$$ is the thermal conductivity of Tedlar plate. Also, $$h_{i}=2.8+3.0v$$ is the heat transfer coefficient from PV cell to Tedlar plate. For a reference wind speed $$v=0.2\,\mathrm{m/s}$$, one finds $$h_{i}=3.4\,\mathrm{W/(m^{2}\,K)}$$.
Appendix A.2. Semitransparent PVb Modules (Glass to Glass, with Cells c-Si)
According to [33], the efficiency of these PV modules is:
where the meaning and values of most parameters are the same as above. However, $$U_{B}=\left({L_{T}}/{K_{T}}+h_{i}^{-1}\right)^{-1}$$ is the heat transfer coefficient from PV cell to ambient through back glass plate. Usually, the thickness of glass plate is considered, $$L_{T}=0.003\,\mathrm{m}$$ and the thermal conductivity of glass is $$K_{T}=1.1\,\mathrm{W/(m\,K)}$$.
Appendix A.3. Modules with Thin Films Cells PVc (a-Si), PVd (CdTe) and PVe (CIGS)
The equation for calculating the electrical efficiency of PV modules with thin film cells is:
where the values of design parameters are summarized in Table A1.
Table A1. Design parameters of (a-Si), (CdTe) and (CIGS) PV cells.
|
No. |
Parameter |
Units |
a-Si |
CdTe |
CIGS |
|---|---|---|---|---|---|
|
Symbols |
PVc |
PVd |
PVe |
||
|
1 |
$$\eta_{0}$$, electrical efficiency of the PV module at reference conditions |
- |
0.064 |
0.104 |
0.1042 |
|
2 |
$$\beta_{0}$$, temperature coefficient of the PV module |
$$\mathrm{K}^{-1}$$ |
0.001 |
0.002 |
0.0031 |
|
$$T_0$$, reference temperature |
$$^\circ\text{C}$$ |
25 |
25 |
25 |
|
|
3 |
$$\alpha_{m}$$, cell absorptance |
- |
0.85 |
0.8 |
0.8 |
|
4 |
$$R_E$$, cell reflectance |
- |
0.05 |
0.05 |
0.05 |
|
5 |
$$L_T$$, thickness of glass plate |
m |
0.003 |
0.003 |
0.003 |
|
6 |
$$K_T$$, thermal conductivity of glass |
W/(mK) |
1.1 |
1.1 |
1.1 |
The meaning and values of other parameters are the same as above. However, the overall heat transfer coefficient from the PV module to the ambient is $$U_{L}=U_{B}+h_{0}$$, where the heat transfer coefficient $$h_0$$ from PV cell to ambient through top glass cover is evaluated for a wind speed on top of the PV module $$v=0.5\ \mathrm{m/s}$$.
Statement of the Use of Generative AI and AI-Assisted Technologies in the Writing Process
AI tools (Gemini) have been used for grammar checking and styling.
Ethics Statement
Not applicable.
Informed Consent Statement
Not applicable.
Data Availability Statement
The data that support the findings of this study are available from the author upon reasonable request.
Funding
This research received no external funding.
Declaration of Competing Interest
The author declares that there are no conflicts of interest.
References
- Solar Heat Worldwide. Global Market Development and Trends 2024. Detailed Market Figure 2023; IEA Solar Heating & Cooling Programme; AEE—Institute for Sustainable Technologies: Gleisdorf, Austria, 2025. [Google Scholar]
-
Li W-T, Tushar W, Yuen C, Ng BKK, Tai S, Chew KT. Energy efficiency improvement of solar water heating systems—An IoT based commissioning methodology. Energy Build. 2020, 224, 110231. DOI:10.1016/j.enbuild.2020.110231 [Google Scholar]
-
Zohri M, Prabowo, Suwarno, Fudholi A, Suyono T, Priandana EP, et al. Performance review of solar-assisted heat pump systems using solar collectors, PV, and PVT technologies. Int. J. Heat Technol. 2023, 41, 657–665. DOI:10.18280/ijht.410318 [Google Scholar]
-
Badescu V. Maximization of radiation heating efficiency. Appl. Therm. Eng. 2024, 257, 124480. DOI:10.1016/j.applthermaleng.2024.124480 [Google Scholar]
- Badescu V. Note on the maximum photothermal heating efficiency. J. Renew. Sustain. Energy 2025, 17, 012301. DOI:10.1063/5.0243235 [Google Scholar]
- Bava F, Furbo S, Brunger A. Correction of Collector Efficiency Depending on Fluid Type, Flow Rate and Collector Tilt. IEA Task 45—Large Systems, IEA-SHC TECH SHEET 45.A.1. 2014. Available online: http://task45.iea-shc.org/fact-sheets (accessed on 16 December 2025).
- Kalogirou SA. Solar Energy Engineering: Processes and Systems; Academic Press: Cambridge, MA, USA, 2009. [Google Scholar]
- Carvill J. Thermodynamics and heat transfer. In Mechanical Engineer’s Data Handbook; Elsevier: Amsterdam, The Netherlands, 1993; Chapter 3, p. 118. [Google Scholar]
- Staffell I, Brett D, Brandon N, Hawkes A. A review of domestic heat pumps. Energy Environ. Sci. 2012, 5, 9291–9306. DOI:10.1039/c2ee22653g [Google Scholar]
-
Kessel A, Benitez-Rodriguez JF, Nie S, Hameiri Z, Jasieniak JJ. Semi-Opaque Perovskite Solar Cells for Color-Neutral Photovoltaic Windows. ACS Energy Lett. 2025, 10, 5314–5321. DOI:10.1021/acsenergylett.5c02792 [Google Scholar]
-
Hasan K, Yousuf SB, Tushar MS, Das B. Effects of different environmental and operational factors on the PV performance: A comprehensive review. Energy Sci. Eng. 2022, 10, 656–675. DOI:10.1002/ese3.1043 [Google Scholar]
- The POWER Project. NASA Prediction of Worldwide Resources. 2021. Available online: http://power.larc.nasa.gov/ (accessed on 15 May 2021).
- The POWER Project. Power Data Methodology. 2026. Available online: https://power.larc.nasa.gov/docs/methodology/ (accessed on 15 June 2026).
- Narayanan R, Parthkumar P, Pippia R. Solar energy utilisation in Australian homes: A case study. Case Stud. Therm. Eng. 2021, 28, 101603. DOI:10.1016/j.csite.2021.101603 [Google Scholar]
- Biyouki ZA, Zaman A, Marinova D, Minunno R, Shayegan MA. Solar Photovoltaics Value Chain and End-of-Life Management Practices: A Systematic Literature Review. Sustainability 2024, 16, 7038. DOI:10.3390/su16167038 [Google Scholar]
- Weiss W, Spörk-Dur M. Solar Heat Worldwide—Global Market Development and Trends in 2017. IEA SHC, Gleisdorf. 2018. Available online: https://www.iea-shc.org/data/sites/1/publications/Solar-Heat-Worldwide-2017.pdf (accessed on 15 June 2026). [Google Scholar]
- US Energy Information Administration. Monthly Energy Reviews (June 2026). Available online: https://www.eia.gov/totalenergy/data/monthly/pdf/mer.pdf (accessed on 15 June 2026). [Google Scholar]
- Natural Gas Local. Rock Springs, WY Natural Gas Rates. Available online: https://naturalgaslocal.com/states/wyoming/rock-springs/ (accessed on 16 December 2025).
- SOLARGE project. Solar Heat for Large Buildings. Available online: https://www.scribd.com/document/486874535/SOLARGE-Best-Practice-Catalogue-en#google_vignette (accessed on 16 December 2025).
- SolarTech. How Do Solar Water Heaters Work? Complete Guide 2025, SolarTech, 9 July 2025. Available online: https://solartechonline.com/blog/how-solar-water-heaters-work/ (accessed on 16 December 2015).
- ALTENER Program. Sun in Action II—A Solar Thermal Strategy for Europe, Volume 2, The Solar Thermal Sector Country by Country, ALTENER Program, Contract 4.1030/C/00-002/2000. [Google Scholar]
- Hydro Solar. Solar Water Heating Systems Cost in USA and Canada—A Complete Guide by Hydro Solar. 25 November 2025. Available online: https://hydrosolar.ca/blogs/news/solar-water-heating-systems-cost-usa (accessed on 16 December 2025).
- ARDCorp & B.C. Ministry of Agriculture. Assessing the Feasibility of Using Solar-Thermal Systems for Your Agricultural or Agri-Food Operation [Factsheet]. Government of British Columbia/Government of Canada, Growing Forward Initiative. [Google Scholar]
- AIR. Solar Air Heating and Ventilation. Australian Institute of Refrigeration, Air Conditioning and Heating. 2019. Available online: https://airah.org.au/Common/Uploaded%20files/Archive/IndustryLeadership/PUSCH/2019_PUSCH_1.pdf (accessed on 16 December 2025).
- Chopson P. Solar Panel Cost—Residential + Commercial. COVETOOL. Available online: https://help.covetool.com/en/articles/4529706-solar-panel-cost-residential-commercial (accessed on 16 December 2025).
- PVGIS. Residential Solar Panel Installation Costs: Complete Guide 2025. PVGIS, August 2025. Available online: https://pvgis.com/en/blog/residential-solar-panel-installation-costs (accessed on 16 December 2025).
- Riley DM, Fleming JE, Gallegos GR. A Photovoltaic System Payback Calculator; SANDIA Report SAND2016-5624; Sandia National Laboratories (SNL-NM): Albuquerque, NM, USA, 2016. [Google Scholar]
- ASHRAE. Organic Rankine Cycle Power Generation, Pratt & Whitney. Available online: https://aeenewengland.org/images/downloads/AEE_ASHRAE_JointMeeting_March2013/orc_power_generation_pratt_and_whitney.pdf (accessed on 15 June 2026).
- EUREKA. Comparison of Thermoelectric Generators and Organic Rankine Cycle Systems. Eureka. 10 September 2025. Available online: https://eureka.patsnap.com/report-comparison-of- thermoelectric-generators-and-organic-rankine-cycle-systems (accessed on 16 December 2025). [Google Scholar]
- Li K, Garrison G, Zhu Y, Moore M, Liu C, Hepper J, et al. Thermoelectric power generator: Field test at Bottle Rock geothermal power plant. J. Power Sources 2021, 485, 229–266, DOI:10.1016/j.jpowsour.2020.229266 [Google Scholar]
- Padinger R, Algenbauer S, Schmidl C. Best Practise Report on Decentralized Biomass Fired CHP Plants and Status of Biomass Fired Small- and Micro Scale CHP Technologies. IEA Bioenergy, Task 32, February 2019. Available online: https://task32.ieabioenergy.com/publications/best-practise-report-on-decentralized-biomass-fired-chp-plants-and-status-of-biomass-fired-small-and-micro-scale-chp-technologies/ (accessed on 15 June 2026).
- Gaur A, Tiwari GN. Exergoeconomic and enviroeconomic analysis of photovoltaic modules of different solar cells. J. Sol. Energy 2014, 2014, 719424. DOI:10.1155/2014/719424 [Google Scholar]
- Tiwari GN, Mishra RK, Solanki SC. Photovoltaic modules and their applications: A review on thermal modelling. Appl. Energy 2011, 88, 2287–2304. DOI:10.1016/j.apenergy.2011.01.005 [Google Scholar]