
Economic and Environmental Analysis of Photovoltaic-Thermal Systems Integrated with Shea Butter as a Phase Change Material in Nigeria

Economic and Environmental Analysis of Photovoltaic-Thermal Systems Integrated with Shea Butter as a Phase Change Material in Nigeria
Kar R. Awai
1,*
 Peter King
1
Kumar Patchigolla
2
Peter King
1
Kumar Patchigolla
2
Received: 23 June 2026 Revised: 22 July 2026 Accepted: 12 August 2026 Published: 26 August 2026

© 2026 The authors. This is an open access article under the Creative Commons Attribution 4.0 International License (https://creativecommons.org/licenses/by/4.0/).
1. Introduction
Nigeria’s dependence on fossil fuels for energy poses environmental challenges, notably in the form of greenhouse gas (GHG) emissions. Additionally, rural regions experience electricity shortages due to excessive reliance on the national grid. By 2023, the share of the Nigerian population with access to electricity was 61.2% (World Bank Group, 2023) [1]. The adoption of renewable energy sources, such as solar power, has the potential to decentralise Nigeria’s electricity supply, mitigate GHG emissions, and enhance electricity access in underserved rural communities [2,3,4]. Consequently, an economic and environmental evaluation of the photovoltaic-thermal system integrated with a phase change material (PV-T/PCM) utilising shea butter as the PCM will provide valuable insights into the feasibility of deploying this technology in remote Nigerian communities.
The United States Department of Energy targets an unsubsidised levelised cost of energy (LCOE) of USD 0.02 per kilowatt-hour for residential solar photovoltaic (PV) projects by 2030 [5]. The cost of electrical and thermal energy within a specific region influences the economic viability of the PV-T/PCM system [6]. Regions with high solar radiation are more conducive to implementing PV-T/PCM systems; however, local energy tariffs exert a greater influence on system feasibility than abundant solar radiation [3]. Subsidies also constitute a key factor affecting the viability of this technology; heavily subsidised butane gas boilers or energy prices can diminish the economic appeal of PV-T/PCM systems. This issue represents one of the primary obstacles to the widespread adoption of this technology [7].
Sub-Saharan Africa is renowned for its high, sustained solar radiation levels, which can raise the temperatures of photovoltaic (PV) cells. According to the World Sunshine Map, Africa receives more annual hours of sunshine than any other continent. Extended exposure to sunlight on the PV panels increases the surface temperature of the PV cells. This temperature increase reduces the panels’ electrical efficiency: a 10 °C rise results in approximately a 5% reduction in PV system performance [8]. Previous studies have examined the energetic, economic, and environmental performance of PV-T and PV-T/PCM systems under different climatic and operating conditions. In general, the integration of thermal recovery and PCM-based temperature regulation can increase total energy utilisation, reduce PV-cell temperatures, and improve carbon-mitigation performance relative to standalone PV systems. Nevertheless, reported economic outcomes vary substantially with system design, climate, energy prices, discount rates, and the method used to value the recovered thermal energy.
For example, Odeh and Aden [9] estimated a payback period of approximately 6–7 years for a residential PV-T hot-water system in Sydney and found that the combined system performed more favourably than separately installed PV and solar hot-water systems. Maatallah et al. [10] reported an approximately six-year payback period for a water-based PV-T/PCM system, together with an 11.26% reduction in payback time and an approximately 27% improvement in lifecycle conversion efficiency relative to a conventional PV system. Comparable payback periods were reported for the PV-T/PCM configurations investigated by Babu et al. [11] and Zheng and Zhou [12], with the latter study reporting CO2 mitigation of 104.1 kg/m2.
Other investigations have demonstrated that the economic benefit of PCM integration is not uniform. Soliman [13] found that PCM cooling reduced the energy cost of a bifacial PV system under different project lifetimes and interest rates. Emam et al. [14] reported a payback period of 1.58 years and higher annual carbon-emission reductions for a water-based PV-T/PCM system than for a conventional PV system. Hossain et al. [15] similarly concluded that a two-sided serpentine-flow PV-T/PCM configuration was economically more attractive than a standalone PV system. In contrast, Asefi et al. [16] found that although a porous-PCM/PV-T system generated the highest annual power output and had a lower LCOE, its additional output did not fully compensate for its higher investment cost; the reported discounted payback period was 16 years, compared with 5 years for the reference PV system.
The principal characteristics and findings of these systems are compared in Table 1. The comparison demonstrates that the literature is dominated by conventional or unspecified PCMs and by studies conducted outside Sub-Saharan Africa. Moreover, most environmental evaluations quantify avoided operational CO2 emissions but do not examine the cradle-to-gate impacts associated with producing the PCM itself.
Table 1. Comparison of representative solar PV, PV-T, and PV-T/PCM systems.
|
Study |
System Configuration |
PCM/Cooling Medium |
Study Context |
Main Economic Finding |
Environmental Performance Finding |
Gap Relative to the Present Study |
|---|---|---|---|---|---|---|
|
Odeh and Aden [9] |
Residential PV-T hot-water system |
Water-based thermal recovery; no PCM specified |
Sydney, Australia |
Payback period of approximately 6–7 years, shorter than non-hybrid systems. |
Production of electricity and residential hot water |
No PCM comparison, LCA, or Sub-Saharan African application |
|
Maatallah et al. [10] |
Serpentine-flow PV-T/PCM/water system |
Conventional PCM with water circulation |
Exergo-economical study |
Payback period of approximately 6 years, around 11.26% shorter than that of the PV system |
Lifecycle conversion efficiency is approximately 27% higher than conventional PV |
No bio-based PCM or Nigerian economic and climatic assessment |
|
Babu et al. [11] |
PV-T and PV-T/heat-pump systems with PCM |
PCM-assisted thermal management |
Numerical comparative study |
Payback period of approximately 6 years and shorter than the reference PV system |
Greater CO2 mitigation potential than conventional PV |
Bio-based PCM and cradle-to-gate environmental effects were not assessed |
|
Zheng and Zhou [12] |
Aerogel-based PV-T/PCM system |
PCM combined with aerogel insulation |
Three-dimensional transient numerical study |
Payback period of approximately 6 years |
Reported CO2 mitigation of 104.1 kg/m2. |
No locally sourced bio-PCM or Nigerian case study. |
|
Soliman [13] |
Cooled bifacial PV-PCM system |
PCM and heat-sink ribs |
Economic evaluation over 10-, 15-, and 20-year lifetimes |
PCM-cooled system had a lower energy cost than the uncooled bifacial PV system |
PCM cooling was more environmentally sustainable than the non-cooled system |
Did not compare bio-based and fossil-delivered PCMs or conduct an LCA of PCM production |
|
Emam et al. [14] |
Water-based PV-T/PCM hybrid system |
PCM and circulating water |
Year-round experimental 4E assessment |
Payback period of 1.58 years; higher reported economic return per unit area than conventional PV |
Annual carbon reduction of approximately 35.508 kg, compared with 25.833 kg for conventional PV |
No shea-butter PCM, Nigerian tariffs, or PCM production impact assessment |
|
Hossain et al. [15] |
Two-sided serpentine-flow PV-T/PCM system |
PCM with water circulation |
Energy, exergy, and economic analysis |
Reported as more cost-effective than standalone PV |
Potentially longer service life than PV and PV-T systems. |
Environmental assessment did not include a comparative cradle-to-gate LCA of bio-based and paraffin PCMs |
|
Asefi et al. [16] |
PV-T system incorporating porous PCM |
Porous conventional PCM |
Case studies in China |
PV-T/PCM produced the highest annual power output and a lower LCOE, but its higher output did not fully justify the additional investment; discounted payback periods of 16 years for PV-T/PCM and 5 years for PV |
Approximately 30 tons of CO2 mitigation per year |
Results are location-specific in China, and do not address locally sourced bio-based PCMs |
|
Adun et al. [17] |
Residential hybrid PV-T system |
Thermal recovery system |
Sub-Saharan African case study |
LCOE reported in the range of US$0.252–0.384/kWh, with an average of US$0.306/kWh |
Demonstrated the feasibility of residential PV-T deployment in the region |
Did not investigate PCM integration, shea butter, or a comparative PCM lifecycle assessment |
|
Present study |
3.0 kWp residential PV-T/PCM system simulated in TRNSYS |
Shea butter compared with paraffin wax |
Nigeria, with wider relevance to Sub-Saharan Africa |
Shea-butter system LCOE of US$0.131/kWh, compared with US$0.146/kWh for paraffin wax; 8-year discounted payback period |
Cradle-to-gate GWP of 0.615 kg CO2e/kg for shea butter, compared with 3.75 kg CO2e/kg for paraffin wax |
Addresses the regional, material, economic, and environmental gaps identified above |
Despite the high and sustained solar resource available across Sub-Saharan Africa, comparatively few studies have assessed the economic performance of PV-T/PCM systems under the region’s climatic, tariff, and financing conditions. Adun et al. [17] investigated a residential PV-T application in Sub-Saharan Africa and reported an LCOE range of US$0.252–0.384/kWh. However, that study did not evaluate PCM integration or compare locally available bio-based storage materials with fossil-derived PCMs. More broadly, the available literature provides limited evidence on the application of bio-based PCMs in PV-T systems and does not establish whether a locally available material such as shea butter can offer simultaneous economic and environmental advantages over paraffin wax.
Accordingly, this study numerically models a 3.0 kWp residential PV-T/PCM system in TRNSYS under Nigerian climatic conditions and compares shea butter with paraffin wax as the thermal-storage material. The novelty of the work lies in integrating: (i) a locally available bio-based PCM into a PV-T configuration; (ii) a Nigerian economic assessment incorporating local capital costs, electricity tariffs, financing conditions, and sensitivity scenarios; and (iii) a cradle-to-gate environmental comparison covering global warming, acidification, and eutrophication potentials. The results are intended to clarify the technical, economic, and environmental feasibility of adopting shea-butter-based PV-T systems in Nigeria and other Sub-Saharan African settings.
Unlike earlier PV-T/PCM studies, this work evaluates a locally available bio-based PCM under Nigerian climatic and financial conditions and directly compares its system-level economics and cradle-to-gate environmental impacts with those of conventional paraffin wax.
2. Methodology
2.1. Economic Analysis of PV-T/PCM Integrated Shea Butter as PCM
An economic analysis has been conducted regarding the installation of a PV-T/PCM system designed to supply electricity and hot water to households in sub-Saharan Africa. Oyedepo et al. (2019) [18] indicated that the electricity demand for a typical Nigerian household in a rural area is 0.986 kWh/day, whereas an urban household’s demand is 3.77 kWh/day. Elinwa et al. (2021) [19] reported electrical energy consumption for hot water use in Nigeria across a studio, a three-bedroom, and a four-bedroom residence as 2.01 kWh/day and 57.6 L/day, 2.77 kWh/day and 79.2 L/day, and 3.52 kWh/day and 100.8 L/day, respectively. Furthermore, the lighting (LED lamp) power consumption was recorded as 133.33 W, 183.33 W, and 233.33 W for the studio, three-bedroom, and four-bedroom residences, respectively. The unit power consumption of electrical equipment was established at 240 W, 330 W, and 420 W for the studio, three-bedroom, and four-bedroom residences, respectively.
Economic analysis is imperative for evaluating the feasibility, cost-effectiveness, and financial viability of implementing a PV-T/PCM system. When deploying such a system within a rural community in sub-Saharan Africa to provide electricity and hot water to households, it is crucial to undertake a thorough economic assessment. This process encompasses several essential stages, including:
- a.
-
Estimating system size involves calculating the total energy and hot water needs, then scaling the PV-T/PCM system to match these requirements.
- b.
-
Cost estimation entails determining the total capital expenditure (Capex) and operational expenditure (OpEx) by considering the scaled system size. It covers expenses such as the procurement of PV accessories, thermal plate components, shea butter, and local labour costs.
- c.
-
Calculating benefits by assessing total energy savings and hot water value, including potential income from selling excess energy or carbon credits.
- d.
-
Calculate key financial metrics such as Net Present Value (NPV), Internal Rate of Return (IRR), Levelized Cost of Energy (LCOE), Return on Investment (ROI), and payback period for the community-scale project. Also, a sensitivity analysis of key variables, including PV accessories prices, interest rates, and energy prices.
- e.
-
Presenting results to stakeholders by highlighting economic benefits, community impacts, and financial gains.
2.1.1. System Size Estimation
- i.
- To assess the electrical energy consumption and hot water requirements of a household, Table 2 presents household energy demand, on which the present work analysis was formulated.
Table 2. Household energy-demand values adopted in the system analysis.
|
Household Category |
Electrical Demand |
Hot-Water Demand |
Application in This Study |
|---|---|---|---|
|
Rural Nigerian household |
0.986 kWh/day [18] |
Not reported in the cited source |
Lower electricity-demand case |
|
Urban Nigerian household |
3.77 kWh/day [18] |
Not reported in the cited source |
Electrical design load |
|
Simple mean of reported rural and urban values |
2.38 kWh/day |
Not applicable |
Cross-category mean, not a population-weighted national average |
|
Three-bedroom residence |
Not reported in the cited hot-water study |
2.77 kWh/day, corresponding to 79.2 L/day [19] |
Thermal design load |
|
Adopted design case |
3.77 kWh/day |
2.77 kWh/day |
Three-bedroom urban residential case |
- ii.
- Scaling up the PV-T/PCM system
A nominal PV capacity of 3.0 kWp was selected as a representative residential design case consisting of ten 300 Wp modules. The capacity was not derived from a cost-minimising or load-matching optimisation; therefore, it is a fixed capacity evaluated in the TRNSYS model. The system was assessed against an urban household electrical demand of 3.77 kWh/day and a three-bedroom hot-water demand of 2.77 kWh/day. The additional PV capacity provides energy for battery charging, system losses, variations in solar availability, flexible loads, and possible future load growth.
The system produces 12.65 kWh/day of electricity and 34.33 kWh/day of thermal energy. After satisfying the adopted daily demands of 3.77 kWh of electricity and 2.77 kWh of hot-water energy, the nominal surpluses are 8.88 kWh/day of electricity and 31.56 kWh/day of thermal energy. These values represent energy balances at the modelled system boundary and do not necessarily represent saleable energy.
The electrical surplus may be used to charge a battery, supply flexible daytime loads, support neighbouring or community loads, or, where technically and legally permitted, be exported through a grid-compliant inverter and bidirectional meter. If no load, storage, or approved export connection is available, the inverter must curtail PV generation.
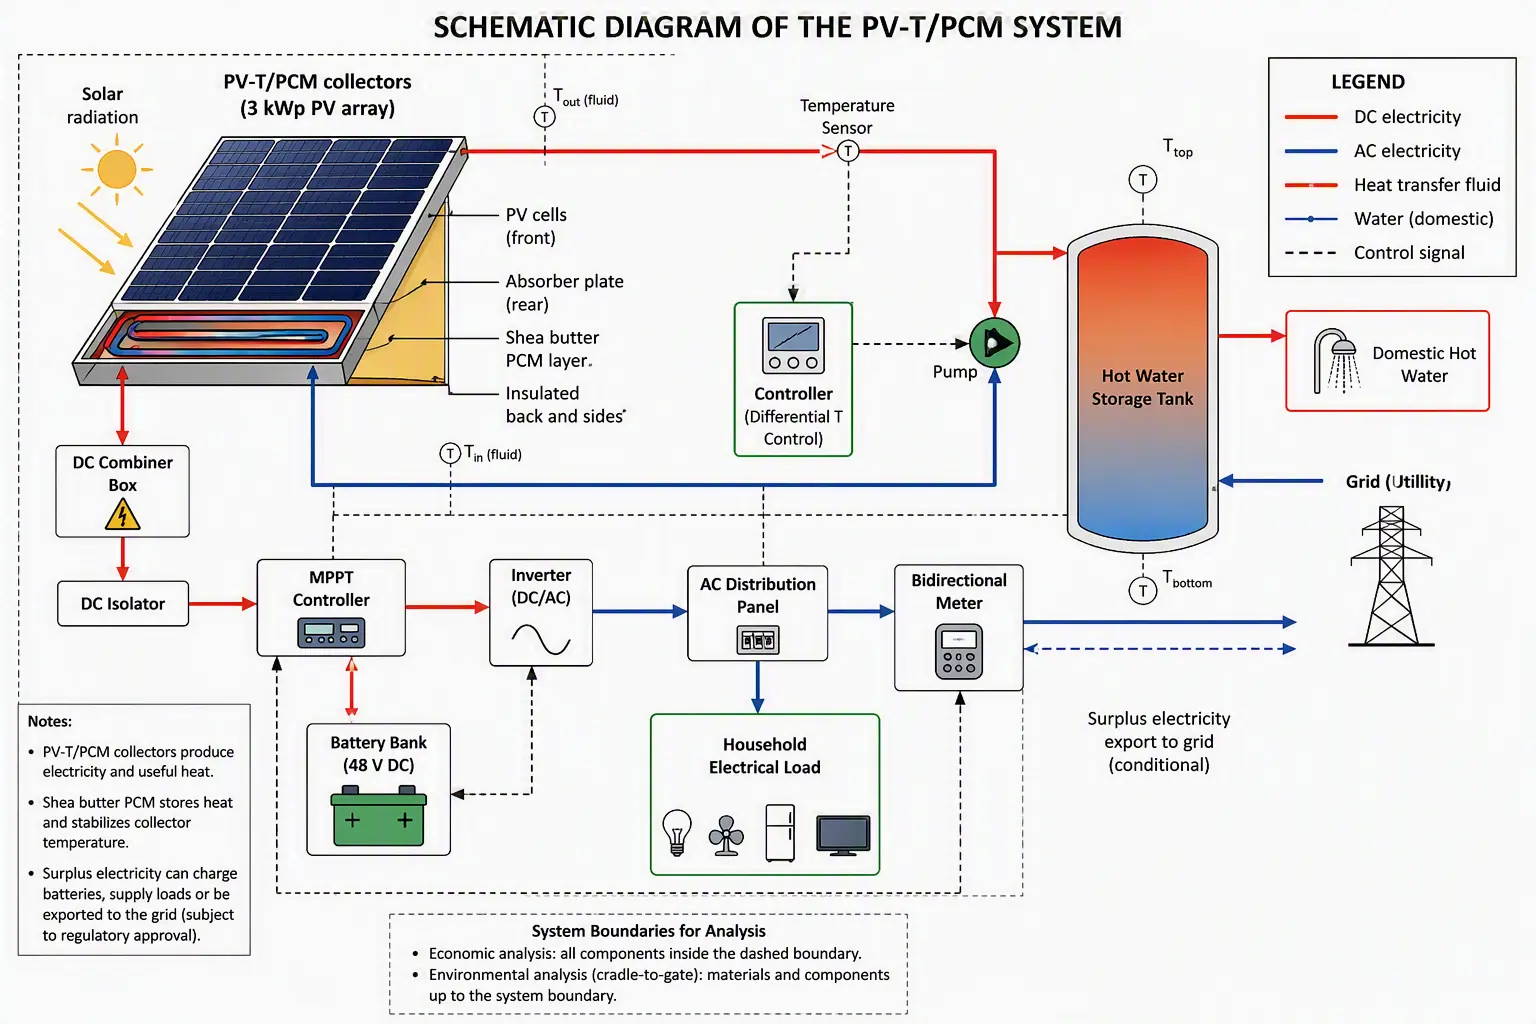
Nigeria’s 2026 net-billing framework permits eligible customers to export surplus renewable electricity to a distribution network in exchange for bill credits. However, the present 3 kWp household installation is below the regulation’s 50 kWp minimum eligibility threshold. Grid-export revenue is therefore excluded from the individual-household base case and is considered only as a conditional scenario involving aggregation or a larger community installation [20,21]. Figure 1 depicts a schematic of the PV-T/PCM system integrated with a household.
2.1.2. Cost Estimation
All component prices were initially estimated in Nigerian Naira (₦) and subsequently converted to US Dollars ($) to conform with international standards. The applicable exchange rate was 1 US$ = ₦1500.999, as reported by the Central Bank of Nigeria (CBN) as of 12 September 2025 [22].
The cost of a solar PV system varies depending on factors such as the manufacturer, capacity, components, and installation procedures. Quotes for PV panels and accessories were obtained from Vexiums Innovations Technology Ltd. (Abuja, Nigeria), a local distributor in Nigeria, in the year 2025. Furthermore, prices for thermal system components were collected from various online marketplaces in Nigeria, including Jumia, Jiji, Frankem, and Me3energy [23,24].
- i.
-
Capital Expenditure (CapEX)
- (a.)
-
The overall expenditure for a 3.0 kW photovoltaic system, encompassing panels, inverters, batteries, and installation for residential property, amounts to ₦3,031,500 (US$2021).
- (b.)
-
The estimated installed cost of the complete thermal subsystem is ₦9,034,500 (US$6023). This amount includes the thermal absorber and heat exchanger, PCM containment, circulation pump, hot-water storage tank, piping, valves, insulation, controller, sensors, fittings, supporting structure, transport, labour, and installation. The cost of PCM (shea butter): 100% unrefined shea butter (white/Ivory) is US$8.5 per kilogram [25]. The PVT system requires 17.76 kg of PCM; consequently, the total expenditure is US$150.96 for shea butter.
Therefore, the total CapEx for the PV-T/PCM system is US$8194.96.
- ii.
- Operating Expenditures (OpEx)
Annual maintenance, encompassing panel cleaning, routine inspections, and minor repairs, accounts for approximately 2% of Capital Expenditures, according to the assumed data.
Therefore, the yearly maintenance (OpEx) costs 2% of US$8194.96, amounting to US$163.89 annually.
2.1.3. Benefits Calculation
- i.
- Electricity savings
The system produced an average of 12.65 kWh per day, totaling 4617.24 kWh annually.
According to the Minister of Power, Adebayo Adelabu (2025), Nigeria’s electricity prices are ₦209 per kilowatt-hour (US$0.139/kWh) for Band A households and businesses. Meanwhile, private generation costs are ₦915 per kilowatt-hour (US$0.61) for diesel engines and ₦750 per kilowatt-hour (US$0.5) for petrol engines [26].
Hence, the yearly savings amount to US$643.33 from grid power and US$2816.52 from diesel generation.
- ii.
- Hot water savings
If a household needs 2.77 kWh of thermal energy daily for hot water and the system generates 34.33 kWh each day, the yearly total reaches 12,531.84 kWh. As a result, the annual savings on grid hot water amount to US$1741.9. In comparison, using a diesel engine yields annual savings of US$7644.42.
The unit price for hot water in Nigeria was not specified; instead, the electricity price served as a proxy.
Therefore, the total annual energy savings for the grid amount to US$2385.23.
- iii.
- Carbon credit or sale of excess energy
The surplus of electrical energy remaining after satisfying the daily load demand was quantified at 8.88 kWh per day, totaling 3241.2 kWh annually. Revenues derived from the sale of this excess energy to the grid are estimated to amount to US$451.61 per annum.
The total annual benefit includes electricity savings and revenue from the sale of excess electricity, excluding thermal energy sales. Consequently, the overall annual benefit attributable to the electrical sector amounts to US$2836.84.
2.1.4. Financial Metrics
The financial analysis was performed assuming a 20-year project duration and a 27.5% discount rate as of March 2025 in Nigeria.
- i.
- Annual net cash flow
The annual benefit is calculated as gross income minus annual operating expenses, amounting to US$2677.
- ii.
- Net present value
The net present value (NPV) is calculated by utilising the present value of an annuity formula as shown in Equation (1) [27].
where $$p$$ is the value of each payment; r represents the interest rate per period expressed as a decimal; and n indicates the number of periods.
In our calculation, we substitute the present value and a 20-year lifetime into Equation (1) to arrive at $$PV=$$ 3.61.
Therefore, the present value (PV) of net annual benefits = 3.61 × US$2677 = US$9663.97 over 20 years. However, the net present value (NPV) is determined by subtracting the total annual costs from the present value of net annual benefits; that is, NPV = PV − (CapEx + OpEx) = US$9663.97 − (US$8194.96 + US$163.89) = US$1305.
- iii.
- Internal rate of return
The Internal Rate of Return (IRR) is presented in Equation (2); however, in this study, it was calculated using an Excel spreadsheet.
Therefore, the internal rate of return (IRR) amounts to 32%.
- iv.
- Levelized cost of energy
The levelised cost of energy (LCOE) represents the average electricity cost per unit over a power plant’s or energy project’s entire operational lifespan. It encompasses all costs, including initial investment, operations, maintenance, fuel, and decommissioning, while considering the time value of money to facilitate a standardised comparison of different energy technologies. The LCOE calculations are provided in Equations (3) to (5) [28].
For this type of project, it is recommended to utilise annualised CapEx, computed using the Capital Recovery Factor (CRF) from Equation (4) [29].
Substituting r = 27.5%, and n = 20-years in Equation (4)
The $$\mathrm{C}\mathrm{R}\mathrm{F}$$ value is 0.278
Therefore, the annualised capital expenditure = US$8194.96 × 0.278 = US$2278.
The total annual expenditure = annualised Capital Expenditure (CapEx) + Operating Expenses (OpEx) = US$2442.
Therefore, a revised LCOE formula for hybrid systems is provided in Equation (5) [29].
According to Equation (5), the Levelized Cost of Energy (LCOE) for the PV-T/PCM system is established at US$0.131 per kilowatt-hour.
The LCOE was calculated separately and did not treat hot-water savings as financial credit; the reported electrical LCOE used only discounted lifecycle costs and discounted electrical output as presented in Equation (5)
- v.
- Return on investment
This financial metric evaluates an investment’s profitability by comparing the net profit or loss to the initial investment cost. The formulas for calculating return on investment (ROI) are presented in Equations (6) to (9) [30].
Net profit is determined by deducting total expenses, including the initial capital outlay, from total revenue. Investment cost pertains to the initial amount invested.
For total return over time:
If the project is financed with debt, interest expenses will reduce net profit.
Therefore,
In the context of solar energy projects, the most pragmatic approach to calculating interest expenses is to use the simple interest method, adjusted for the proportion of debt financing. The formula is as follows:
Interest Expense = Initial Investment × Loan Portion Ratio × Annual Interest.
The total nominal net returns amount to US$53,540, calculated as US$2677 multiplied by 20 years.
Net profit is calculated as US$53,540 minus US$8358, resulting in US$45,181.
Therefore, $$\mathrm{R}\mathrm{O}\mathrm{I}=5.405$$ × 100%
Therefore, the investment yields an annualised return of 9.73%.
- vi.
- Payback time
This financial metric assesses the duration necessary to recuperate an initial investment in a project or asset through the cash flow, savings, or profits generated; it is essential for investment decision-making [6]. The payback period is calculated using the formulas provided in Equation (10) and Equation (11) [31].
The straightforward payback period (ignoring the time value of money) is provided by Equation (10).
Equation (11) defines the dynamic payback period, accounting for interest rates via discounting.
Equation (12) is used to determine the discounted factor.
Initial investment consists of Capital Expenditures (CapEx) and Operating Expenses (OpEx).
The annual net cash inflow, calculated as total cash received (revenue minus operating costs), yielded a discounted payback period of 8 years.
2.2. Results and Discussions
Table 3 summarises the financial metrics for the hybrid system compared with those of the conventional PV system.
Table 3. Comparison of financial metrics for hybrid and conventional PV systems.
|
Financial Metrics |
Hybrid (PV-T/PCM) System |
Conventional PV System |
|---|---|---|
|
NPV |
US$1305 |
US$173.59 |
|
IRR |
32% |
19% |
|
LCOE |
$0.131/kWh |
$0.112/kWh |
|
Annualised ROI |
9.73% |
9.37% |
|
Payback Time |
8 years |
4 years |
According to Table 3, the hybrid system demonstrates a moderate positive Net Present Value (NPV) and Internal Rate of Return (IRR), with a payback period of eight years. This suggests that the project is financially profitable and feasible. However, it also has a high Levelized Cost of Electricity (LCOE), indicating higher energy costs than those of a photovoltaic (PV) system. The conventional PV system presents the lowest NPV and IRR, a four-year payback period, and a moderate LCOE. The PV system’s comparatively lower financial metrics relative to the hybrid PV-T/PCM system are primarily due to the hybrid system’s higher Capital Expenditure (CapEx). However, if the per-unit price of thermal energy in Nigeria is factored into the analysis, along with high hot water demand, the payback time of the PV-T/PCM system will be shorter than that of the PV panel.
Compared with the existing literature, Maatallah et al. [10] reported a payback period of approximately 6 years for the PV-T/PCM system, which aligns more closely with the findings of the present study. However, the payback period for the PV-T/PCM system documented in the literature was shorter than that for the PV system. Additionally, Adun et al. [17] indicated a Levelized Cost of Electricity (LCOE) range of $0.252/kWh to $0.384/kWh for the hybrid PV-T system, with an average value of $0.306/kWh. Conversely, the typical payback period for a photovoltaic system in Nigeria, used by residential households or small businesses, ranges from 3 to 5 years [32].
2.2.1. Sensitivity Analysis
A sensitivity analysis was conducted to evaluate the impact of variations in the price of a 3-kW photovoltaic panel system, discount rates, and energy prices. The analysis covered 20 years in Nigeria, from 2005 to 2025.
- i.
- Price fluctuation of a 3-kW PV panel system
From 2005 to 2025, the cost of solar systems worldwide declined substantially, driven by lower global prices. Nonetheless, regional factors such as import duties, the devaluation of the Naira, and increased demand contributed to pricing fluctuations. The integration of global photovoltaic (PV) price reductions with Nigeria’s foreign exchange rates and import duties was conducted using data from Our World in Data—Solar Photovoltaic Module Prices (1975–2024) [33,34,35,36].
Three price scenarios have been established for the sensitivity analysis based on the current price: a low-price scenario (−30%), a base-price scenario (0%), and a high-price scenario (+20%), all of which are subject to foreign exchange shocks. This range captures potential technological cost reductions, as well as possible increases resulting from exchange-rate depreciation and supply chain disruptions. The primary findings of this photovoltaic (PV) system price sensitivity analysis are summarised in Table 4 and Figure 2.
Table 4. The impact of PV system prices on financial metrics.
|
Financial Metrics |
Low Case (−30%) |
Base Case (0%) |
High Case (+20%) |
|---|---|---|---|
|
NPV |
US$1911.42 |
US$1305 |
US$900.92 |
|
IRR |
34% |
32% |
30% |
|
LCOE |
US$0.114/kWh |
US$0.131/kWh |
US$0.139/kWh |
|
Annualised ROI |
10.14% |
9.73% |
9.47% |
|
Payback Time |
7.8 years |
8 years |
8.3 years |
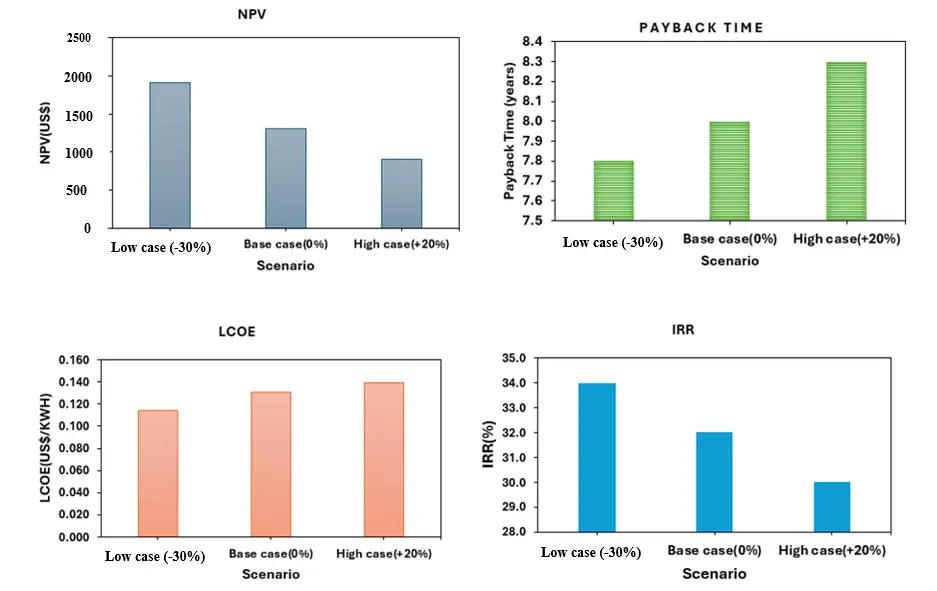
Figure 2. The financial metrics of PV prices across three different scenarios within the Nigerian solar energy system.
Figure 2 presents an analysis of financial performance under various scenarios: low-case (–30%), base-case (0%), and high-case (+20%). As demonstrated, both Net Present Value (NPV) and Internal Rate of Return (IRR) decline, reflecting diminished profitability. The Levelized Cost of Energy (LCOE) shows a marginal increase, indicating elevated energy production costs in the high-CAPEX scenario. Furthermore, the Payback Period is modest but remains within a reasonable range across all scenarios.
- ii.
- Discount rate fluctuations
The instability in Nigeria’s discount rates from 2005 to 2025 is monitored using the Monetary Policy Rate (MPR) [37]. According to the literature, the low, baseline, and high case scenarios are defined as 11.5%, 16.3%, and 27.5%, respectively.
Table 5 summarises the results of the sensitivity analysis on variations in the discount rate and is presented in Figure 3.
Table 5. The impact of discount rates on financial metrics.
|
Financial Metrics |
Low Case (11.5%) |
Base Case (16.3%) |
High Case (27.5%) |
|---|---|---|---|
|
NPV |
US$12,288.95 |
US$7261.44 |
US$1305 |
|
IRR |
32% |
32% |
32% |
|
LCOE |
US$0.061/kWh |
US$0.116/kWh |
US$0.131/kWh |
|
Annualised ROI |
9.73% |
9.73% |
9.73% |
|
Payback Time |
4 years |
4.7 years |
8 years |
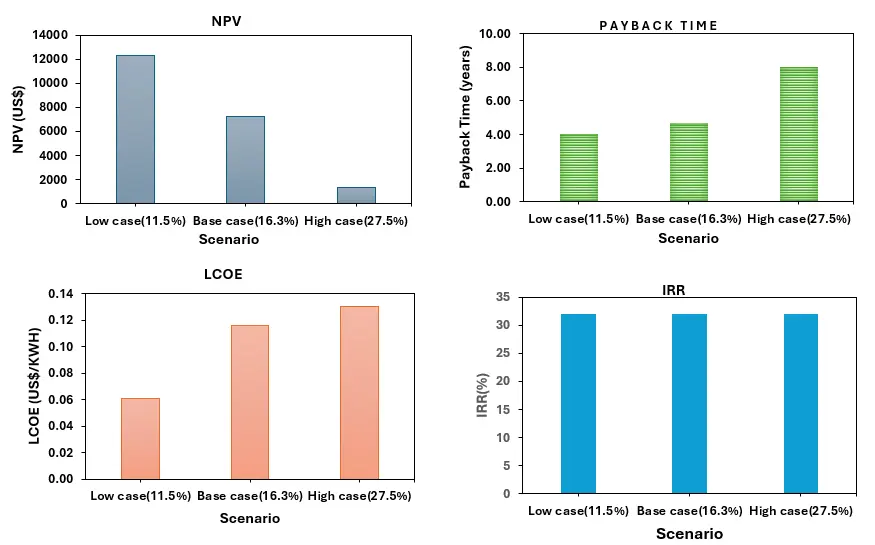
Figure 3. The financial metrics across three discount-rate scenarios for a Nigerian solar energy system.
Figure 3 illustrates the variations in Net Present Value (NPV), Internal Rate of Return (IRR), Levelized Cost of Energy (LCOE), and Payback Time across three discount rate scenarios: 11.5%, 16.3%, and 27.5%. The figure emphasises the pronounced sensitivity of NPV, LCOE, and Payback Time to fluctuations in the discount rate, with profitability diminishing, energy costs escalating, and other cost metrics increasing as the discount rate rises. The IRR remains invariant across all scenarios, indicating a stable internal rate of return, whereas the Payback Time ranges from 4 to 8 years, reflecting a slower recovery of investment at elevated discount rates.
- iii.
- Electricity price fluctuations
Electricity prices in Nigeria have increased substantially from 2005 to 2025, primarily due to cost-reflective tariffs, reductions in government energy subsidies, and currency devaluation. Tariffs have risen from ₦16 per kilowatt-hour in 2015 to as much as ₦225 per kilowatt-hour for band A customers in 2024/2025 [38,39,40]. The percentage fluctuation bands used for the sensitivity analysis were derived from the scholarly literature and represent low, base, and high scenarios of −10%, 0%, and +50%, respectively.
Table 6 summarises electricity price fluctuations in Nigeria from 2005 to 2025 as presented in Figure 4.
Table 6. The effect of electricity prices on financial metrics.
|
Financial Metrics |
Low Case: ₦180 ($0.12) |
Base Case: ₦209 ($0.14) |
High Case: ₦300 ($0.20) |
|---|---|---|---|
|
NPV |
−US$117.54 |
US$1305 |
US$5771.19 |
|
IRR |
27% |
32% |
47% |
|
LCOE |
US$0.131/kWh |
US$0.131/kWh |
US$0.131/kWh |
|
Annualised ROI |
8.86% |
9.73% |
11.83% |
|
Payback Time |
4 years |
3.5 years |
2.4 years |
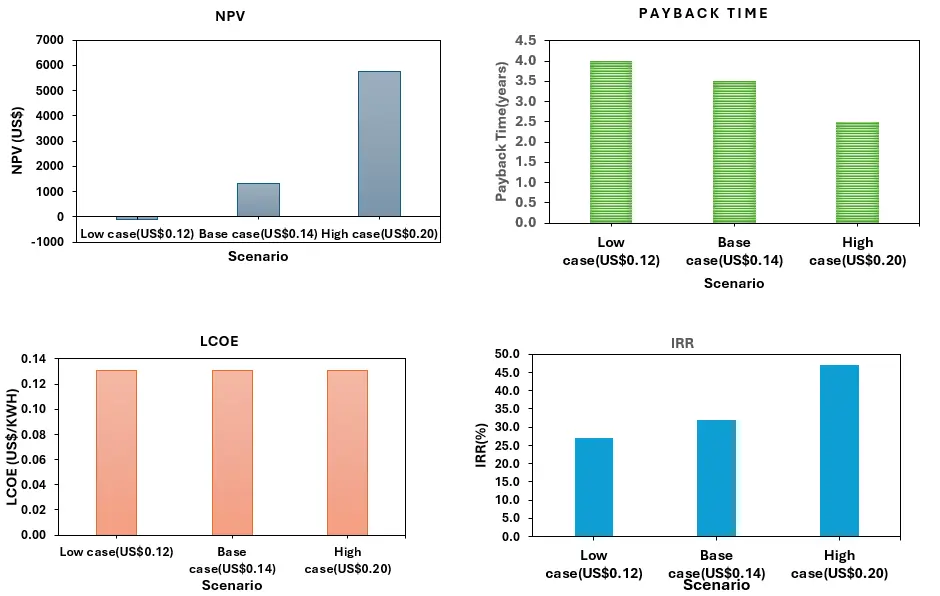
Figure 4. Financial metrics across three electricity price scenarios for a Nigerian solar energy system.
Figure 4 shows that a low electricity price results in a negative Net Present Value (NPV), whereas an elevated electricity price yields a positive NPV for a feasible project. As electricity prices increase, the payback period decreases. Furthermore, the Internal Rate of Return (IRR) escalates with higher prices, while the Levelized Cost of Energy (LCOE) remains unchanged.
2.2.2. Economic Analysis Comparing Shea Butter and Paraffin Wax as Phase Change Materials (PCMs) in Photovoltaic-Thermal Systems
Table 7 presents the computed financial metrics for these phase-change materials.
Table 7. Economic comparison of shea butter and paraffin wax PCMs for PV-T system applications.
|
Financial Metrics |
Hybrid PV-T/PCM-Shea Butter |
Hybrid PV-T/PCM-Paraffin Wax |
|---|---|---|
|
NPV |
US$1305 |
US$1358.23 |
|
IRR |
32% |
32% |
|
LCOE |
US$0.131/kWh |
US$0.146/kWh |
|
Annualised ROI |
9.73% |
9.76% |
|
Payback Time |
8 years |
8.1 years |
The economic comparison between shea butter and paraffin wax phase change materials (PCMs) for PV-T system applications, as detailed in Table 7, emphasises differences in NPV and LCOE. Paraffin wax produces more thermal energy, resulting in higher annual benefits and a larger NPV. However, shea butter has a lower LCOE because it generates more electricity than paraffin wax. The shea butter system outperforms the paraffin wax system in electrical power output, suggesting that shea butter cools the PV panel more effectively during peak sunlight hours.
2.3. System Lifetime and Operational Considerations
Conventional PV modules are generally designed for an operational lifetime of approximately 25–30 years, although gradual output degradation is expected. Dust, partial shading, humidity, corrosion, ultraviolet exposure, thermal cycling, encapsulant discolouration, delamination, and interconnection fatigue can reduce long-term performance. Published reviews identify dust accumulation, shading, and humidity as important factors in outdoor degradation [41,42].
Integrating a thermal absorber and PCM may reduce PV cell operating temperature and thermal stress, thereby improving instantaneous electrical efficiency and potentially reducing temperature-related degradation. However, the hybrid configuration introduces additional components and failure modes. These include leakage from the PCM enclosure or hydraulic circuit, corrosion between dissimilar materials, PCM phase segregation, chemical degradation after repeated thermal cycling, volume-change stresses during melting and solidification, thermal-contact deterioration between the PV backsheet and absorber, pump and sensor failure, blockage of fluid channels, insulation deterioration, and controller malfunction.
Effective mitigation strategies encompass chemically compatible, sealed PCM encapsulation, expansion volume, corrosion-resistant absorber materials, pressure- and temperature-relief devices, leak detection, replaceable pumps and sensors, accessible hydraulic connections, thermal bypass control, over-temperature protection, periodic water-quality assessments, and routine inspections. Additionally, lifecycle costs should account for battery and inverter replacements, as their service lives might be shorter than those of the PV modules.
2.4. Conclusions
The PV-T/PCM system incorporating shea butter achieved an LCOE of US$0.131/kWh, compared with US$0.146/kWh for the paraffin-wax system. This difference was primarily attributable to the higher annual electrical output of the shea-butter configuration. Shea butter’s lower latent heat capacity caused the circulation pump to operate during periods of peak solar irradiance, improving PV-cell cooling and electrical generation. In contrast, paraffin wax continued charging during these periods due to its higher latent heat capacity, resulting in greater thermal output but lower electrical generation. These findings demonstrate a trade-off between the electrical advantage of shea butter and the thermal-storage advantage of paraffin wax.
The LCOE of the shea-butter system was also lower than the Nigerian grid-electricity price of US$0.139/kWh and substantially lower than the diesel-generation cost of US$0.61/kWh. The system achieved a positive NPV, an IRR of 32%, an annualised ROI of 9.73%, and a discounted payback period of 8 years. However, its payback period remained longer than the 4 years estimated for the standalone PV system, mainly because of the higher capital cost of the thermal subsystem and Nigeria’s high discount rate.
The sensitivity analysis showed that PV-system cost, discount rate, and electricity tariff significantly affected economic performance. The discount rate had the greatest influence on NPV, LCOE, and discounted payback time. Higher discount rates reduced NPV, increased LCOE, and extended the payback period, whereas higher electricity tariffs improved NPV and shortened the payback period. Consequently, lower-cost financing, targeted subsidies, local manufacture of thermal components, and effective utilisation of surplus electrical and thermal energy could improve the system’s economic viability.
Overall, shea butter offers a promising, locally available, bio-based alternative to paraffin wax for PV-T applications in Nigeria. Nevertheless, further optimisation of system capacity, thermal subsystem cost, energy storage, and surplus energy utilisation is required before large-scale deployment. Revenue from surplus electricity or useful thermal energy should be included only where technically feasible, supported by actual demand, and permitted under the applicable regulatory framework.
3. Environmental Analysis of Shea Butter Integrated into Photovoltaic-Thermal Systems
Shea butter is extracted from the kernels of Vitellaria paradoxa, a tree that grows naturally across the West African “shea belt”, which extends through more than 20 countries. Approximately 800,000 tonnes of shea kernels are collected annually in West Africa, supporting the food and cosmetics industries and providing income for millions of rural households [43]. Nigeria accounts for an estimated 35–40% of global shea-nut production, making the country an important producer and a potentially significant source of shea butter for bio-based thermal-energy-storage applications [44,45].
Shea butter is commonly produced using traditional processes that include crushing, roasting, milling, kneading or churning, boiling, and separation. These processes are labour- and energy-intensive, with reported human-energy inputs ranging from 2000 to 6100 kJ per kilogram of shea butter [46,47]. Mechanical extraction provides an alternative approach in which oil is recovered by pressing the processed kernels. Most shea kernels are obtained from naturally occurring parkland trees rather than cultivated plantations, reducing the need for dedicated agricultural land but creating challenges related to resource management, seasonal availability, and supply-chain variability.
The environmental performance of shea butter depends strongly on the production method, energy source, processing efficiency, and transportation distance. Reported greenhouse-gas emissions range from 3.14 to 3.31 kg CO2e/kg of shea butter for rural processors and from 2.29 to 2.54 kg CO2e/kg for urban processors [48]. Transportation also contributes to the environmental burden through fuel consumption and associated emissions of CO2, CH4, N2O, SO2, and NOx during the movement of kernels and processed butter between collection points, production facilities, and markets [49]. The global warming potential (GWP) of these gases, as documented by the Intergovernmental Panel on Climate Change, is as follows: CO2 = 1, CO = 1.9, CH4 = 27.75, and N2O = 298 kg CO2-equivalent per kilogram of fossil fuel combusted [50]. These emissions contribute to climate change, acidification, eutrophication, and local air pollution.
Higher emission values have been reported for traditional production systems that rely extensively on fuelwood. The production of 1 kg of cosmetic-grade shea butter is estimated to generate approximately 10.374 kg CO2e, with wood combustion during post-harvest processing and crude-butter extraction accounting for approximately 75% of the total emissions [49]. Differences between published estimates reflect variations in system boundaries, production technologies, fuel types, allocation procedures, and the treatment of biogenic carbon. Consequently, emission values obtained from different studies should not be compared without considering their methodological assumptions.
Fuelwood consumption is one of the principal environmental hotspots in traditional shea-butter production. Approximately 1.7–2.0 kg of fuelwood may be required to produce 1 kg of shea butter, while the total energy requirement for unrefined shea-butter production has been estimated at 103–172 MJ/kg, predominantly supplied by firewood [48,51]. Improved cookstoves can substantially reduce fuel consumption and associated global-warming impacts. Previous research reported reductions of up to 78%, from 18 to 4.1 kg CO2e/kg and from 11 to 2.4 kg CO2e/kg relative to conventional stove configurations [47]. More efficient stoves and mechanical extraction methods have also been estimated to reduce emissions by approximately 28% and 20%, respectively [51]. These findings indicate that the environmental performance of shea butter can be considerably improved through process modernisation and cleaner energy sources.
Material-flow analysis provides a structured basis for quantifying the resources consumed and wastes generated during shea-butter production. Using 1 kg of shea butter as the functional unit, Jasaw et al. [52] examined inputs such as shea kernels, water, fuelwood, electricity, and labour, as well as outputs including shea butter, shea cake, wastewater, and other residues. Such an inventory is necessary to identify environmental hotspots and to compare shea butter consistently with conventional fossil-derived PCMs, including paraffin wax.
In the present study, the environmental assessment follows the life cycle assessment framework established by the ISO 14040 and ISO 14044 standards. The assessment comprises four interconnected phases: goal and scope definition, life cycle inventory analysis, life cycle impact assessment, and interpretation of results. A cradle-to-gate system boundary is applied to quantify the environmental impacts associated with shea-kernel collection, transportation, processing, and production of shea butter before its integration into the PV-T system. This approach enables the global-warming, acidification, and eutrophication impacts of shea butter to be compared with those of paraffin wax on a consistent functional-unit basis.
3.1. Methodology
Although the PV-T/PCM system was modelled for Nigerian climatic and household conditions, the original shea-butter environmental inventory was not developed specifically for Nigeria. Process data and an electricity emission factor of 0.55 kg CO2e/kWh were obtained from a Burkina Faso shea-processing study and used as a West African proxy because a complete and methodologically compatible Nigerian inventory was unavailable at the time of the assessment. The reported shea-butter GWP should therefore not be interpreted as a definitive Nigerian production footprint. Differences in electricity generation, process heat, transport distance, processing technology, water consumption, and waste management may affect the applicability of the Burkina Faso inventory to Nigeria.
To examine geographical sensitivity, the electricity-related contribution was recalculated using a Nigeria-specific grid emission factor. However, changing the electricity factor alone does not convert the Burkina Faso process inventory into a fully Nigerian inventory. The grid-adjusted result remains a proxy unless the entire inventory data is also replaced with Nigerian data.
- i.
-
Goal and Scope
- (a)
-
Goal: The objective of this research is to evaluate and compare the environmental impacts associated with the production of shea butter as a phase change material (PCM). This includes raw material collection (shea nut harvesting) and subsequent processing into shea butter. Traditionally, shea butter processing entails manual harvesting of shea nuts, boiling, sun-drying, de-husking, further sun-drying of the kernels, crushing, roasting, milling into paste, and pressing to extract crude butter [51].
- (b)
-
Scope: This study concentrates on greenhouse gas (GHG) emissions produced during shea butter manufacturing, encompassing harvesting of shea nuts, processing, and transportation to the point of sale as shea butter intended for PV-T system applications as a heat storage medium. The functional unit adopted was 1 kg of shea butter, which corresponds to the GHG emissions (kgCO2eq) associated with 1 kg of unrefined shea butter. This unit facilitates comprehensive assessment and reporting of all environmental impacts, including energy consumption, emissions, and waste generated.
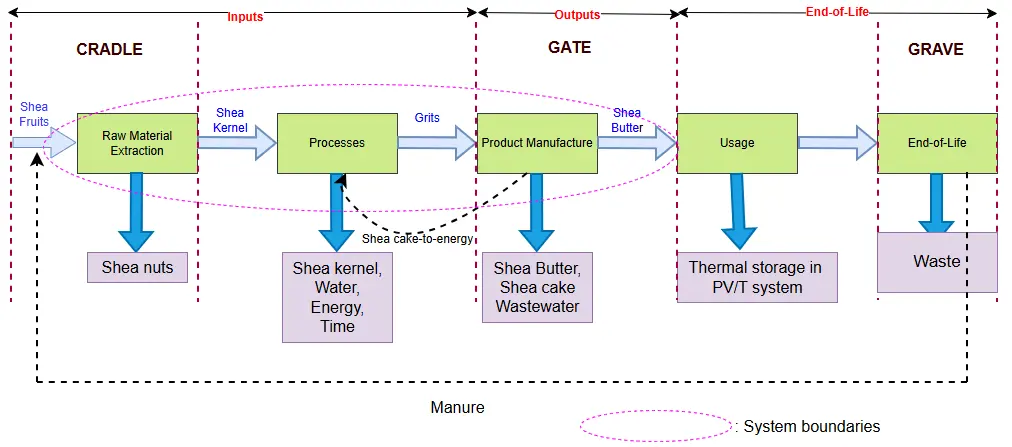
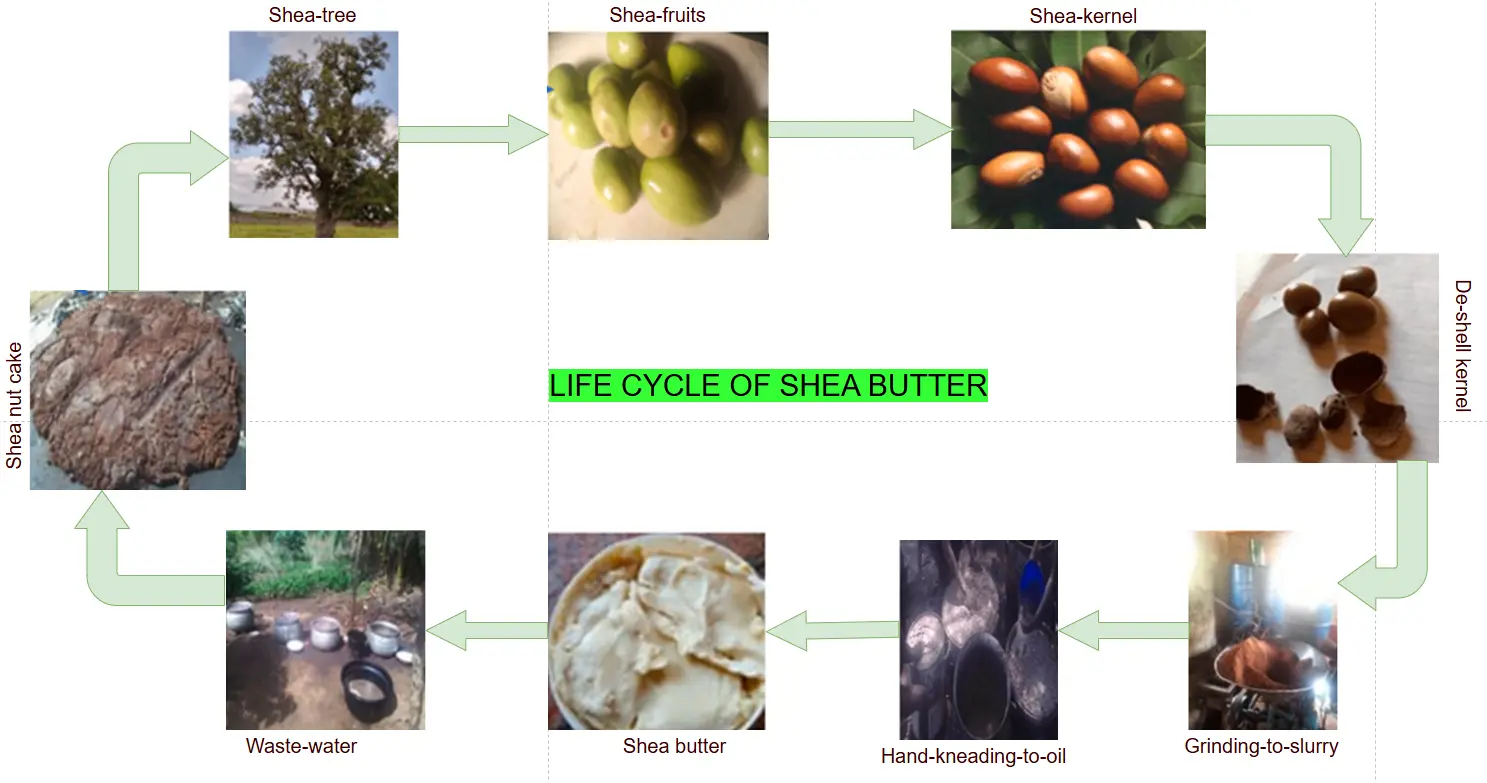
Figure 5 presents the system boundary for producing 1 kg of shea butter from cradle to gate, and Figure 6 presents the life cycle of shea butter.
- ii.
- Life Cycle Assessment of Shea Butter
- a.
- Inventory Analysis
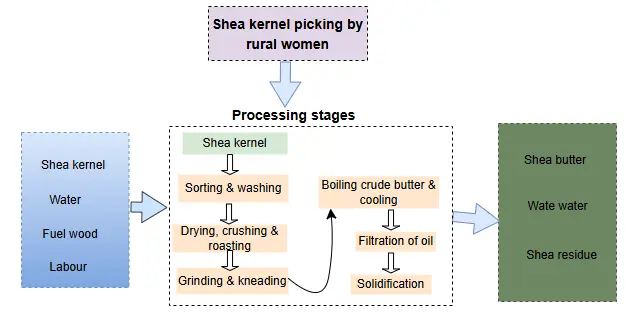
The primary inputs for shea butter production include shea kernels, water, energy, and time. The outputs include shea butter, wastewater (effluent), and shea cake. According to data from [53], processing 86.3 kg of shea kernels requires 305.2 L of water, 49.7 kg of fuelwood, and 15.11 h. This process yields 29.7 kg of shea butter, 46.86 kg of shea cake, and 202.3 L of wastewater, respectively.
The process of grinding or milling the shea kernel into paste, extracting the fat, and clarifying the oil requires electricity, water, and heat. Traditionally, shea butter production predominantly relies on fuelwood, requiring approximately 8–10 kWh of heat per kilogram when using improved cookstoves or roasters [45]. An illustration of the shea butter production process is provided in Figure 7.
- b.
- Data collection
Preliminary inventory data for producing 1 kg of shea butter in Ouagadougou (ASY), Burkina Faso, were obtained from [46], and the final inventory data for producing 1 kg were subsequently formulated and detailed in Table 8.
Table 8. The inventories for producing 1 kg of shea butter.
|
Inventory |
Values |
Unit |
|---|---|---|
|
Inputs |
||
|
Electricity |
0.27 |
kWh |
|
Liquefied Natural Gas |
0.95 |
kWh |
|
Firewood |
6.82 |
kWh |
|
Water |
13.22 |
L |
|
By-products |
||
|
Shea cake |
0.13 |
Kg |
|
Sludge |
2.28 |
Kg |
|
Wastewater |
2.1 |
L |
- iii.
-
Impact assessment
- a.
-
Global warming potential (GWP)
The electrical grid in Burkina Faso exhibits an Emission Factor of approximately 0.55 kg CO2e per kWh of electricity consumed [54,55]. Consequently, the Global Warming Potential (GWP) is computed utilising the data presented in Table 8 as outlined below.
- (i)
- Electricity-related inputs impact: 0.27 kWh multiplied by 0.55 kg CO2e per kWh is 0.148 kg CO2/kg of shea butter
Therefore, electricity contributes approximately 0.15 kg CO2e per kilogram of shea butter.
- (ii)
- Thermal inputs related impact
|
```latex\text{Input LPG energy} = 0.95\ \mathrm{kWh}``` |
|
|
```latex1\ \mathrm{kWh} = 3.6\ \mathrm{MJ}``` |
Therefore, 0.95 kWh of LPG = 3.42 MJ
The LPG impacted 3.42 MJ × 0.063 kg CO2/MJ = 0.216 kg CO2/kg of shea butter
The LPG emissions impact is ≈0.22 kg CO2/kg of shea butter.
The firewood emission factor ranges from 0.093 to 0.095 kg CO2 per megajoule (MJ) for direct biogenic CO2 emissions [56,58].
The input energy from firewood is 6.82 kWh, corresponding to 24.55 MJ.
The emission factor for non-CO2 combustion by-products, such as CH4 and N2O, is 0.010 kg CO2e per megajoule [59].
Therefore, the direct biogenic CO2 emissions from firewood are calculated as 24.55 × 0.093 = 2.28 kg of CO2.
The emissions of methane (CH4) and nitrous oxide (N2O) total 24.55 multiplied by 0.010, yielding 0.245 kg of CO2-equivalent non-CO2 emissions.
Consequently, the total GWP (excluding biogenic CO2) is determined by summing the impact of electricity and thermal sources: 0.15 + 0.22 + 0.245 = 0.615 kg CO2e per kilogram of shea butter.
This GWP (0.615 kg CO2e/kg of shea butter) from this study closely corresponds to the GWP (0.613 kg CO2e/kg of shea butter) documented in Kaiama, scenario 1, by (Ewemoje & Oluwaniyi, 2016) [49].
The potential for eutrophication and acidification from 1 kg of shea butter was assessed as follows:
- i.
- Eutrophication potential (measured in kg PO4e)
The input value for electricity is 0.27 kWh.
|
```latex\text{Water used} = 13.22\ \text{L}``` |
|
The conversion factor for water eutrophication is 0.0002 kg PO4e per litre [60].
Electricity eutrophication = 0.0002 kg PO4e/kWh [60].
Therefore, the total eutrophication is calculated as 0.27 × 0.0002 + 13.22 × 0.0002 = 0.0027 kg PO4e.
- ii.
- Acidification potential (measured in kg SO2e)
The electricity acidification is 0.0025 kg SO2e/kWh, and the firewood acidification is 0.00015 kg SO2e/MJ [60].
Therefore, the total acidification = 0.27 × 0.0025 + 24.55 × 0.00015 = 0.0043 kg SO2e
This study finds that the eutrophication potential associated with producing 1 kg of shea butter is 0.0027 kg of PO4e, and the acidification potential is 0.0043 kg of SO2e.
3.2. Comparison of the Environmental Impacts of Shea Butter and Paraffin Wax
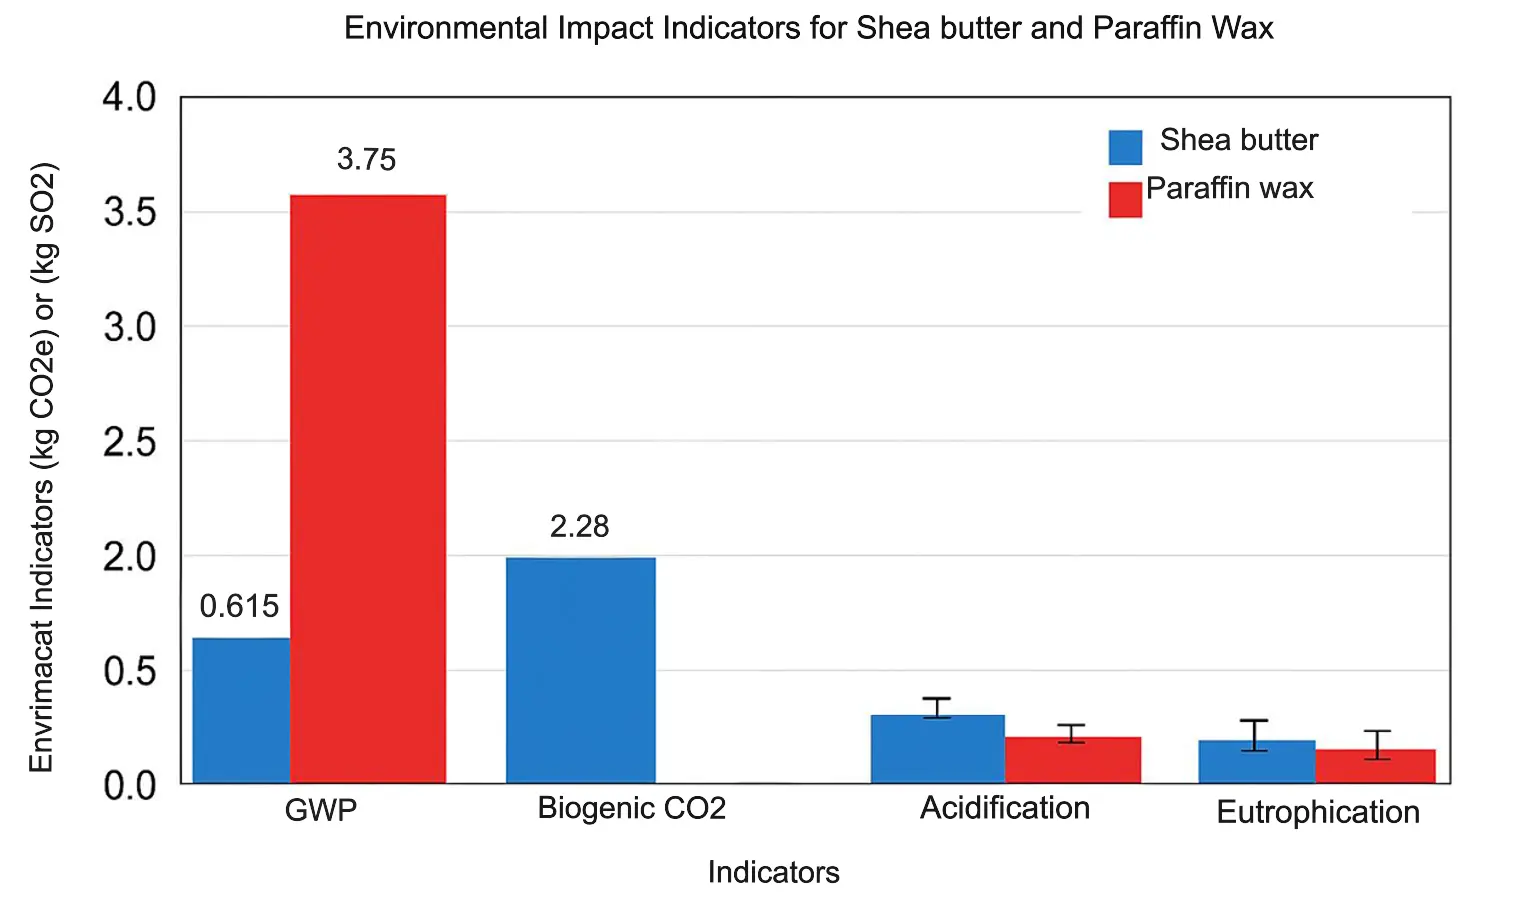
Bio-based phase change materials (PCMs), such as shea butter, generally produce lower greenhouse gas emissions than fossil-fuel-based PCMs and offer superior renewable qualities. However, paraffin provides higher latent heat, increased durability, and reduced variability [49]. From a life cycle assessment (LCA) perspective, shea butter minimises fossil CO2 emissions, whereas paraffin wax depends on fossil sources with a higher cradle-to-gate global warming potential (GWP). Table 9 offers a comprehensive comparison of the environmental impacts of shea butter and paraffin wax.
Table 9. The environmental impact of 1 kg of shea butter compared with 1 kg of paraffin wax.
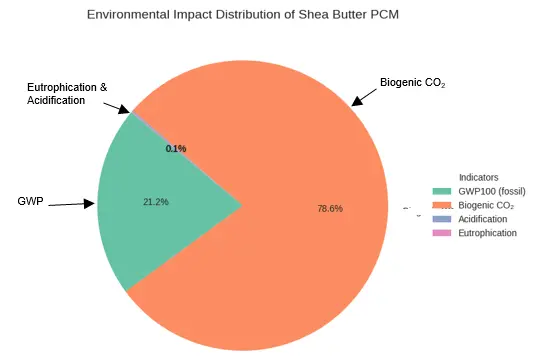
Table 9 demonstrates that paraffin wax has a higher fossil GWP; however, eutrophication is lower than that of shea butter due to the absence of agricultural or wastewater inputs. Figure 8 and Figure 9 depict the environmental impacts of shea butter and a comparison between shea butter and paraffin, as presented in Table 9.
3.3. Discussion
Shea butter demonstrated a substantially lower cradle-to-gate global warming potential of 0.615 kg CO2e/kg, compared with 3.75 kg CO2e/kg for paraffin wax [61]. This represents an approximately 84% reduction in GHG emissions, indicating a clear climate-related advantage for shea butter as a renewable, bio-based PCM. The difference is primarily associated with the fossil origin and energy-intensive production of paraffin wax. However, the comparison depends on consistent functional units, system boundaries, allocation procedures, and treatment of biogenic carbon.
The environmental advantage of shea butter was not consistent across all impact categories. Its acidification potential of 0.0043 kg SO2e/kg exceeded the 0.002–0.003 kg SO2e/kg reported for paraffin wax, while its eutrophication potential of 0.0027 kg PO4e/kg was considerably higher than the paraffin-wax range of 0.0003–0.0005 kg PO4e/kg. The higher acidification impact of shea butter was mainly associated with fuelwood combustion and electricity use during processing, whereas its eutrophication impact was linked primarily to water consumption and wastewater discharge. These findings indicate that replacing paraffin wax with shea butter shifts part of the environmental burden from global warming to more localised impacts on air quality and aquatic ecosystems.
Overall, shea butter offers a significant climate benefit over paraffin wax, but it cannot be considered environmentally superior across all impact categories. Its environmental performance could be improved through efficient cookstoves, cleaner electricity, mechanical extraction, wastewater treatment, sustainable fuelwood management, and shorter transport distances. Furthermore, a system-level comparison based on the quantity of PCM required to provide an equivalent thermal storage service would yield a more complete assessment, particularly because shea butter and paraffin wax have different latent heat capacities, operating temperatures, and service lives.
4. Conclusions
The results demonstrate that shea butter is a promising, locally available, bio-based PCM for PV-T applications in Nigeria. Compared with paraffin wax, the shea-butter system achieved a lower LCOE of US$0.131/kWh and a substantially lower cradle-to-gate GWP of 0.615 kg CO2e/kg, while maintaining a positive NPV of US$1305, an IRR of 32%, and an annualised ROI of 9.73%. However, its eight-year discounted payback period, high thermal-subsystem cost, and greater acidification and eutrophication impacts indicate important economic and environmental trade-offs. Large-scale deployment will therefore require lower-cost financing, system-capacity optimisation, productive use of surplus energy, cleaner processing methods, and sustainable management of the shea supply chain. Subject to these improvements, shea-butter-based PV-T systems could support decentralised energy provision, reduce dependence on fossil-derived PCMs, and create additional economic opportunities for shea-producing communities in Nigeria and other parts of Sub-Saharan Africa.
5. Study Limitations
First, the PV-T/PCM system was evaluated using a TRNSYS numerical model rather than a full-scale experimental installation. Although the model provides a consistent basis for comparing shea butter and paraffin wax, field validation is required to confirm the predicted electrical and thermal performance under actual operating conditions in Nigeria.
Second, the selected 3 kWp capacity represents a fixed residential design case and was not obtained through formal load-matching or cost optimisation. The system generated more electrical and thermal energy than the adopted household demands. Therefore, economic performance depends on the availability of battery storage, flexible household loads, community energy sharing, thermal storage, or an approved grid-export arrangement. Unused or curtailed surplus energy would reduce the economic benefits.
Third, the economic analysis depends on assumptions concerning component prices, electricity tariffs, discount rates, maintenance costs, system lifetime, and the value of useful thermal energy. These variables may change due to inflation, exchange-rate fluctuations, financing conditions, and energy policy reforms. In addition, the estimated thermal-subsystem cost was based on market quotations and requires validation through detailed engineering design and local supplier quotations. Potential replacement costs for batteries, inverters, pumps, sensors, and controllers may also affect lifecycle profitability.
Fourth, grid-export revenue should be interpreted as a conditional scenario rather than a guaranteed income stream. The feasibility of injecting surplus electricity into the Nigerian distribution network depends on system capacity, regulatory eligibility, technical approval, bidirectional metering, grid-compliant protection, and an agreement with the relevant distribution company. Accordingly, economic results that include export revenue may not apply directly to an individual 3 kWp residential installation.
Fifth, the environmental assessment used a cradle-to-gate boundary and therefore excluded impacts associated with PCM integration, transportation to the installation site, operation, maintenance, replacement, leakage, end-of-life treatment, and disposal or recycling. The comparison was also based on 1 kg of PCM rather than an equivalent thermal-storage service. Because shea butter and paraffin wax have different latent heat capacities, operating temperatures, quantities required, and expected service lives, future assessments should compare the materials per unit of useful thermal energy stored over the complete system lifetime.
Finally, the long-term thermal stability, compatibility, and durability of shea butter were not experimentally evaluated. Repeated melting and solidification may affect its thermophysical properties, while leakage, oxidation, phase separation, corrosion, biological degradation, and interaction with containment materials could influence system reliability. Future work should therefore include experimental thermal-cycling tests, field validation, capacity optimisation, full lifecycle assessment, and uncertainty analysis before large-scale deployment is recommended.
Statement of the Use of Generative AI and AI-Assisted Technologies in the Writing Process
During the preparation of this manuscript, the author(s) used Grammarly and Microsoft 365 Copilot for language formatting. After using this tool/service, the author(s) reviewed and edited the content as needed and take(s) full responsibility for the content of the published article.”
Author Contributions
Conceptualisation, K.R.A.; Methodology, K.R.A.; Software, P.K.; Validation, K.R.A.; Formal Analysis, K.R.A.; Investigation, K.R.A.; Resources, K.R.A.; Data Curation, K.R.A.; Writing—Original Draft Preparation, K.R.A.; Writing—Review & Editing, K.R.A., P.K. and K.P.; Visualisation, K.R.A.; Supervision, P.K. and K.P.
Ethics Statement
Not applicable.
Informed Consent Statement
Not applicable.
Data Availability Statement
The raw data supporting the conclusions of this article will be made available by the authors on demand
Funding
The author(s) declared that financial support was not received for this work and/or its publication.
Declaration of Competing Interest
The author(s) declared that this work was conducted in the absence of any commercial or financial relationships that could be construed as a potential conflict of interest.
References
- World Bank. Access to Electricity (% of Population), Nigeria, 2023; World Development Indicators, Indicator EG.ELC.ACCS.ZS. Available online: https://data.worldbank.org/indicator/EG.ELC.ACCS.ZS?locations=NG (accessed on 21 March 2026).
- Nweke-Eze C. Nigeria’s Energy Transition: Approaches for an Efficient and Pragmatic Energy Transition and Climate Protection; Sustainability Monitor No. 04/2024; Konrad-Adenauer-Stiftung: Berlin, Germany, 2024. Available online: https://www.kas.de/documents/d/guest/monitor-sustainability-nigeria (accessed on 20 April 2026).
- International Energy Agency. Clean Energy Innovation Policies in Emerging and Developing Economies; International Energy Agency: Paris, France, 2024. Available online: https://www.iea.org/reports/clean-energy-innovation-policies-in-emerging-and-developing-economies (accessed on 21 April 2026).
- Exploring REA’s Interventions in Promoting Nigeria’s Energy Transition Plan. Available online: https://leadership.ng/exploring-reas-interventions-in-promoting-nigerias-energy-transition-plan/ (accessed on 15 May 2026).
- Sadiq M, Kokchang P, Kittipongvises S. Comparative Techno-Economic Evaluation of a Standalone Solar Power System for Scaled Implementation in Off-Grid Areas. Energies 2023, 16, 6262. DOI:10.3390/en16176262 [Google Scholar]
- Aguilar-Jiménez JA, Hernández-Callejo L, Alonso-Gómez V, Velázquez N, López-Zavala R, Acuña A, et al. Techno-economic analysis of hybrid PV/T systems under different climate scenarios and energy tariffs. Sol. Energy 2020, 212, 191–202. DOI:10.1016/j.solener.2020.10.079 [Google Scholar]
- Ben Seddik Z, Mahdaoui M, Makroum H, Ahachad M. 4E performance evaluation of PV, PV/Thermal, and solar domestic water Heater for building integration in Morocco. Energy Convers. Manag. 2022, 272, 116380. DOI:10.1016/j.enconman.2022.116380 [Google Scholar]
- Sarafraz M, Safaei M, Leon A, Tlili I, Alkanhal T, Tian Z, et al. Experimental Investigation on Thermal Performance of a PV/T-PCM (Photovoltaic/Thermal) System Cooling with a PCM and Nanofluid. Energies 2019, 12, 2572. DOI:10.3390/en12132572 [Google Scholar]
- Odeh S, Aden I. Modelling of a Photovoltaic/Thermal Hybrid Panel for Residential Hot Water System. J. Sol. Energy Eng. 2025, 147, 011003. DOI:10.1115/1.4065552 [Google Scholar]
- Maatallah T, Zachariah R, Al-Amri FG. Exergo-economic analysis of a serpentine flow type water based photovoltaic thermal system with phase change material (PVT-PCM/water). Sol. Energy 2019, 193, 195–204. DOI:10.1016/j.solener.2019.09.063 [Google Scholar]
- Babu PK, Arunachalam A, Chinnasamy S, Manimuthu C. Energy based techno-economic and environmental feasibility study on PV/T and PV/T heat pump system with phase change material—A numerical comparative study. Environ. Sci. Pollut. Res. 2024, 31, 15627–15647. DOI:10.1007/s11356-024-32034-5 [Google Scholar]
- Zheng X, Zhou Y. A three-dimensional unsteady numerical model on a novel aerogel-based PV/T-PCM system with dynamic heat-transfer mechanism and solar energy harvesting analysis. Appl. Energy 2023, 338, 120899. DOI:10.1016/j.apenergy.2023.120899 [Google Scholar]
- Soliman AS. 4E analysis of a new design heat sink for cooling a bifacial photovoltaic system using PCM and ribs. J. Energy Storage 2023, 73, 108907. DOI:10.1016/j.est.2023.108907 [Google Scholar]
- Emam M, Hamada A, Refaey HA, Moawed M, Abdelrahman MA, Rashed MR. Year-round experimental analysis of a water-based PVT-PCM hybrid system: Comprehensive 4E assessments. Renew. Energy 2024, 226, 120354. DOI:10.1016/j.renene.2024.120354 [Google Scholar]
- Hossain MS, Pandey AK, Selvaraj J, Rahim NA, Islam MM, Tyagi VV. Two-sided serpentine flow-based photovoltaic-thermal-phase-change materials (PVT-PCM) system: Energy, exergy and economic analysis. Renew. Energy 2019, 136, 1320–1336. DOI:10.1016/j.renene.2018.10.097 [Google Scholar]
- Asefi G, Ma T, Wang R. Techno-economic evaluation of photovoltaic thermal system integrated with porous phase change materials: Case studies in China. Energy Convers. Manag. 2023, 290, 117227. DOI:10.1016/j.enconman.2023.117227 [Google Scholar]
- Adun H, Ishaku HP, Ayomide Titus O, Shefik A. 3-E feasibility analysis on photovoltaic/thermal application for residential buildings: A case study of Sub-Saharan Africa. Energy Sources Part A Recovery Util. Environ. Eff. 2022, 44, 9901–9919. DOI:10.1080/15567036.2022.2143962 [Google Scholar]
- Oyedepo SO, Uwoghiren T, Babalola PO, Nwanya SC, Kilanko O, Leramo RO, et al. Assessment of Decentralised Electricity Production from Hybrid Renewable Energy Sources for Sustainable Energy Development in Nigeria. Open Eng. 2019, 9, 72–89. DOI:10.1515/eng-2019-0009 [Google Scholar]
- Elinwa UK, Ogbeba JE, Agboola OP. Cleaner energy in Nigeria residential housing. Results Eng. 2021, 9, 100103. DOI:10.1016/j.rineng.2020.100103 [Google Scholar]
- Nigerian Electricity Regulatory Commission. Net Billing Regulations 2026; Regulation No. NERC-R-002-2026; NERC: Abuja, Nigeria, 2026. Available online: https://nerc.gov.ng/wp-content/uploads/2026/06/Net-Billing-Regulation-2026.pdf (accessed on 31 July 2026).
- Ogba D, Olorunmaiye J, Umukoro N. Nigeria’s Net Billing Regulations 2026: Assessing Commercial Opportunity and Economic Viability. TEMPLARS ThoughtLab, 10 June 2026. Available online: https://www.templars-law.com/knowledge-centre/nigerias-net-billing-regulations-2026-assessing-commercial-opportunity-and-economic-viability/ (accessed on 31 July 2026).
- Central Bank of Nigeria. Exchange Rate. 2025. Available online: https://www.cbn.gov.ng/rates/ExchRateByCurrency.html (accessed on 10 December 2025).
- Jiji. Building Materials & Supplies in Mushin. 2025. Available online: https://jiji.ng/mushin/building-materials (accessed on 16 December 2025).
- Me3 Energy Ltd. Aluminium Cladding Sheet, Sheet Thickness: 1 mm [Per Meter]. Available online: https://me3energy.ng/aluminum-cladding-sheet-sheet-thickness-mm (accessed on 20 December 2025).
- Amazon. Unrefined 100% Ivory Shea Butter. 2025. Available online: https://www.amazon.co.uk/African-Premium-Natural-Unrefined-Organics/dp/B0B6DQ3Q1P (accessed on 6 January 2026).
- Adelabu A. Minister of Power: High Fuel Costs Necessitate ₦750 per kWh for Private Electricity Generation. MSME Africa. 2025. Available online: https://msmeafricaonline.com/minister-of-power-high-fuel-costs-necessitate-n750-per-kwh-for-private-electricity-generation/ (accessed on 12 December 2025).
- Investopedia. Net Present Value (NPV): Definition, Formula, and Example. Investopedia. 15 July 2025. Available online: https://www.investopedia.com/terms/n/npv.asp (accessed on 20 December 2025).
- National Renewable Energy Laboratory. Simple Levelized Cost of Energy (LCOE) Calculator Documentation. Available online: https://www.nlr.gov/analysis/tech-lcoe-documentation (accessed on 12 January 2026).
- Corporate Finance Institute. Levelized Cost of Energy (LCOE)-Overview, How to Calculate. Corporate Finance Institute. 2023. Available online: https://corporatefinanceinstitute.com/resources/valuation/levelized-cost-of-energy-lcoe/ (accessed on 15 January 2026).
- Investopedia. Return on Investment (ROI): Definition, Formula, and Example. Investopedia. 10 May 2024. Available online: https://www.investopedia.com/terms/r/returnoninvestment.asp (accessed on 19 December 2025).
- Investopedia. Payback Period: Definition, Formula, and Calculation. Investopedia. 11 June 2025. Available online: https://www.investopedia.com/terms/p/paybackperiod.asp (accessed on 20 December 2025).
- Solar Depot Nigeria. Is Solar Worth It in 2025? Breaking Down Savings and ROI for Nigerian Homes and Businesses. 30 January 2025. Available online: https://www.linkedin.com/pulse/solar-worth-2025-breaking-down-savings-roi-nigerian-u0ace (accessed on 14 December 2025).
- Dadedos Solar & Electrical Services. Cost of Solar + Inverter Systems in Nigeria. 2025. Available online: https://www.dadedospower.ng/how-much-does-a-solar-inverter-systems-cost-in-nigeria-in-2025-prices-and-analysis (accessed on 5 December 2025).
- Our World Data. Solar Photovoltaic Module Prices. 1975–2024. Available online: https://ourworldindata.org/grapher/solar-pv-prices (accessed on 26 January 2026).
- SolarCorpTech. Solar Panel Price in Nigeria. 2025. Available online: https://www.solarcorptech.com/blog/solar-panel-prices-in-nigeria/ (accessed on 20 January 2026).
- TechPoint Africa. Solar Panel Cost in Nigeria. 2025. Available online: https://techpoint.africa/guide/solar-panel-cost-nigeria/ (accessed on 11 December 2025).
- Finance in Africa. Nigeria’s Reserve Requirement Ratio Trend (2005–2025): Data, Drivers & Policy Shifts. 2025. Available online: https://financeinafrica.com/guide/nigeria-reserve-requirement-ratio/ (accessed on 11 December 2025).
- Tosho RI, Ahmed SA. Electricity Bands Epidemic in Nigeria: Tariffs Hikes and Consumer Responses. Lapai J. Humanit. 2024, 15, 263–278. Available online: https://www.researchgate.net/profile/Idris-Tosho/publication/391863363_Electricity_Bands_Epidemic_in_Nigeria_Tariffs_Hikes_and_Consumer_Responses/links/682b1d8a026fee1034f90eac/Electricity-Bands-Epidemic-in-Nigeria-Tariffs-Hikes-and-Consumer-Responses.pdf (accessed on 20 December 2025).
- Punch. Cheap Electricity: Nigeria Ranks 109th Amid 168% Tariff Hike in Eight Years. 2023. Available online: https://punchng.com/cheap-electricity-nigeria-ranks-109-amid-168-tariff-hike-in-eight-years/#:~:text=In%20the%20current%20Multi%2DYear,that%20is%20about%20$0.15%20%E2%80%93%20$0.17 (accessed on 15 January 2026).
- Kolade T, Ifeanyi E. Electricity Rate Hike and the Multi-Dimensional Challenges of the Nigeria Power Sector. Andersen in Nigeria, 14 May 2024. Available online: https://ng.andersen.com/electricity-rate-hike-and-the-multi-dimensional-challenges-of-the-nigeria-power-sector/ (accessed on 26 April 2026).
- Kim J, Rabelo M, Padi SP, Yousuf H, Cho EC, Yi J. A Review of the Degradation of Photovoltaic Modules for Life Expectancy. Energies 2021, 14, 4278. DOI:10.3390/en14144278 [Google Scholar]
- Rajput P, Singh D, Singh KY, Karthick A, Shah MA, Meena RS, et al. A comprehensive review on reliability and degradation of PV modules based on failure modes and effect analysis. Int. J. Low-Carbon Technol. 2024, 19, 922–937. DOI:10.1093/ijlct/ctad106 [Google Scholar]
- FAO, Global Shea Alliance. Shea Value Chain as a Key Pro-Poor Carbon-Fixing Engine in West Africa; FAO: Rome, Italy, 2020. DOI:10.4060/ca7406en [Google Scholar]
- UNDP SDG Investor Platform. Sustainable Shea Butter Production and Value Chain Development in West Africa; UNDP SDG Investor Platform: New York, NY, USA, 2024. [Google Scholar]
- Food and Agriculture Organisation of the United Nations. FAOSTAT: Crops and Livestock Products, Karité Nuts (Sheanuts), Production Data. 2023. Available online: https://www.fao.org/faostat/en/#data/QCL (accessed on 28 November 2025).
- Nounagnon BS, N’Tsoukpoe KE, Kpegba K, Davou L, Soro YM, Yacouba H. Sustainability challenges in conventional shea butter production in Africa: A review of energy consumption and resource efficiency. Environ. Syst. Decis. 2024, 44, 161–176. DOI:10.1007/s10669-023-09925-y [Google Scholar]
- Naughton CC, Zhang Q, Mihelcic JR. Modelling energy and environmental impacts of traditional and improved shea butter production in West Africa for food security. Sci. Total Environ. 2017, 576, 284–291. DOI:10.1016/j.scitotenv.2016.10.059 [Google Scholar]
- Jasaw GS, Saito O, Gasparatos A, Shoyama K, Boafo YA, Takeuchi K. Ecosystem services trade-offs from high fuelwood use for traditional shea butter processing in semi-arid Ghana. Ecosyst. Serv. 2017, 27, 127–138. DOI:10.1016/j.ecoser.2017.09.003 [Google Scholar]
- Ewemoje TA, Oluwaniyi OO. Mechanised Shea Butter Production in South-Western Nigeria Using Life Cycle Assessments (LCA) Approach from Gate-to-Gate. Agric. Eng. Int.: CIGR J. 2016, 18. Available online: https://cigrjournal.org/index.php/Ejounral/article/view/3557 (accessed on 21 May 2026).
- Intergovernmental Panel on Climate Change. Climate Change 2007: Synthesis Report. Contribution of Working Groups I, II and III to the Fourth Assessment Report of the Intergovernmental Panel on Climate Change; Core Writing Team; Pachauri RK, Reisinger A, Eds.; IPCC: Geneva, Switzerland, 2007; 104p. Available online: https://www.ipcc.ch/report/ar4/syr/ (accessed on 21 May 2026).
- Glew D, Lovett PN. Life cycle analysis of shea butter use in cosmetics: From parklands to product, low carbon opportunities. J. Clean. Prod. 2014, 68, 73–80. DOI:10.1016/j.jclepro.2013.12.085 [Google Scholar]
- Jasaw G, Saito O, Takeuchi K. Shea (Vitellaria paradoxa) Butter Production and Resource Use by Urban and Rural Processors in Northern Ghana. Sustainability 2015, 7, 3592–3614. DOI:10.3390/su7043592 [Google Scholar]
- Naangmenyele Z, Banye EZ, Bekoe EMO, Zakaria I, Amuah EEY. Fundamentals of shea butter production; input–output analyses and profit maximisation in Northern Ghana. Res. Glob. 2023, 6, 100113. DOI:10.1016/j.resglo.2023.100113 [Google Scholar]
- Carbon Footprint Ltd. Country-Specific Electricity Grid Greenhouse Gas Emission Factors. Carbon Footprint. 2019. Available online: https://www.carbonfootprint.com/archiveelectricityfactors.html(accessed on 10 January 2026).
- International Energy Agency. Emissions Factors 2025; IEA: Paris, France, 2025. Available online: https://www.iea.org/data-and-statistics/data-product/emissions-factors-2025 (accessed on 10 February 2026).
- Forest Research. Carbon Emissions of Different Fuels; Forestry Commission: Bristol, UK. 2022. Available online: https://www.forestresearch.gov.uk/tools-and-resources/fthr/biomass-energy-resources/reference-biomass/facts-figures/carbon-emissions-of-different-fuels/ (accessed on 13 January 2026).
- United States Environmental Protection Agency. Emission Factors for Greenhouse Gas Inventories (AP-42); U.S. EPA: Washington, DC, USA, 2014. [Google Scholar]
- DEFRA/AEA. UK Government GHG Conversion Factors for Company Reporting: Methodology Paper for Emission Factors; Department for Environment, Food and Rural Affairs: London, UK, 2009. [Google Scholar]
- IPCC. 2006 IPCC Guidelines for National Greenhouse Gas Inventories; Intergovernmental Panel on Climate Change: Geneva, Switzerland, 2006. [Google Scholar]
- University of Leiden, Institute of Environmental Sciences (CML). CML Baseline Method: Characterisation Factors for Acidification and Eutrophication; Leiden University: Leiden, The Netherlands, 2001. [Google Scholar]
- CarbonCloud. Paraffin Wax—Climate Footprint at Factory (3.75 kg CO2e/kg). Available online: https://apps.carboncloud.com/climatehub/product-reports/id/453411129460 (accessed on 14 February 2026).
- European Commission Joint Research Centre (JRC). ILCD Handbook: Recommendations for Life Cycle Impact Assessment in the European Context; Publications Office of the European Union: Luxembourg, 2011. [Google Scholar]