
Optimization of Anaerobic Digestion Systems for Biomethane Recovery from Septic Tank Sludge
Optimization of Anaerobic Digestion Systems for Biomethane Recovery from Septic Tank Sludge
Ahmed Mohammed Inuwa
1,*
Mohammed Alhassan Adam
2
Umar Salim Ibrahim
2
Atiku Yakubu Musa
3
Maryam Ibrahim
2
Usman Mohammed Aliyu
1
Victor Oluwafemi Fatokun
1
Emmanuel Kweinor Tetteh
1,*
 Sudesh Rathilal
1
Sudesh Rathilal
1
Received: 31 January 2026 Revised: 24 April 2026 Accepted: 04 June 2026 Published: 25 June 2026

© 2026 The authors. This is an open access article under the Creative Commons Attribution 4.0 International License (https://creativecommons.org/licenses/by/4.0/).
1. Introduction
The increasing global energy demand, combined with the depletion of fossil fuel reserves and the urgency to mitigate climate change, has intensified the search for renewable and sustainable energy alternatives. Currently, fossil fuels account for over 75% of global energy consumption, leading to rising greenhouse gas (GHG) emissions and environmental degradation [1]. As a result, there is a growing need to transition toward clean, circular, and decentraized energy systems that promote both economic and ecological sustainability [2]. Among the promising technologies, anaerobic digestion (AD) has emerged as an efficient biological process that converts organic waste into biomethane, a renewable substitute for natural gas, while simultaneously reducing waste volumes and nutrient pollution [3]. Biomethane is a form of methane derived from biomass. Its qualities make it similar to natural gas in that it can be delivered and stored using the current infrastructure, while having a less negative impact on the environment [4]. By preventing the substantial release of methane and other dangerous gases into the atmosphere, the technique of producing biomethane lowers the quantity of organic matter that breaks down in fields. Furthermore, using biomethane reduces the amount of fossil fuel required, thereby reducing the amount of greenhouse gas emitted into the atmosphere [5].
Despite the global advancement of AD, septic tank sludge remains an underutilized substrate for biomethane production, particularly in developing countries. Septic systems are widely used for domestic wastewater management, yet the periodic desludging and disposal of septic tank sludge present significant environmental and public health challenges [6]. The sludge is rich in biodegradable organic matter, including proteins, carbohydrates, and lipids, making it a potential feedstock for energy recovery [7]. However, its complex composition, variable moisture content, and potential presence of inhibitors such as ammonia and heavy metals hinder optimal digestion efficiency [8]. Maintaining a sound and efficient waste management system requires an understanding of the composition, nature, and effects of septic tank sludge on the overall performance of a septic system [9]. Sludge management done right protects the environment and public health, while averting costly repairs and system failures [10].
AD is a biological process that produces biogas via microbial fermentation in reactors; the gaseous products are carbon dioxide, hydrogen, and methane. The key volatile fatty acid (VFA) that plays an important role in the AD process is acetic acid, which can be used as an intermediate for methanogenic activity [11]. According to [12], AD, which generates biogas, a renewable energy source, is one of the most unique methods in the world for processing organic waste streams (such as manure, sludge, and industrial wastes). Hydrolysis, acidogenesis, acetogenesis, and methanogenesis are the four primary stages of AD [13]. AD is a biological process that is integrated. While a mixed-culture bacterial community fosters hydrolysis, acidogenesis, and acetogenesis, archaea convert the metabolic products of the previous processes into ammonia and methane [14]. Current studies have explored the use of co-digestion, thermal pretreatment, and catalytic enhancement to improve the biogas yield from wastewater [15]. However, research focusing specifically on the techno-economic optimization of AD systems for septic tank sludge remains limited. Most available works have concentrated on municipal or industrial wastewater sludge, neglecting the decentralized and heterogeneous nature of septic sludge systems in urban and peri-urban regions of Africa. Furthermore, the comprehensive integration of feedstock characterization, process modelling, optimization, and techno-economic assessment remains lacking, leading to uncertainties in system design, scalability, and sustainability.
This study addresses these gaps by developing and optimizing an integrated anaerobic digestion system to improve the biomethane yield from septic tank sludge. The research employs Aspen Plus® for process simulation and Response Surface Methodology (RSM) Central Composite Design (CCD) for parameter optimization, focusing on key factors such as hydraulic retention time, temperature, and organic loading rate. Techno-economic analysis is conducted using Aspen Process Economic Analyzer (APEA). The study demonstrates that the optimized system achieves high biomethane yield (58.227 vol.%), reduced environmental impact, and strong economic viability under developing-region conditions.
In summary, this work contributes to the field of waste-to-energy conversion and sustainable sanitation by presenting a validated, scalable, and economically feasible biomethane production pathway from septic sludge. The findings support the global transition toward clean energy, circular economy principles, and the attainment of Sustainable Development Goals (SDGs 7, 11, 12, and 13), thereby providing both scientific and policy relevance for developing nations.
2. Materials and Method
2.1. Materials/Equipment
Septic Tank Sludge
Septic tank sludge was used as the primary feedstock for this study. The sludge sample was collected from a household septic tank located in Yelwa, Bauchi Local Government Area, Bauchi State, Nigeria. Following collection, the sample was characterized to evaluate its suitability as a substrate for anaerobic digestion and biomethane production. The sampling location and collected septic tank sludge are presented in Yelwa (Figure 1). In addition, solvents and laboratory-grade chemicals, including methanol, acetone, and nitrogen, were procured from local suppliers for the experimental analyses. The equipment, tools, and materials employed during the anaerobic digestion process are summarized in Table 1 and Table 2.
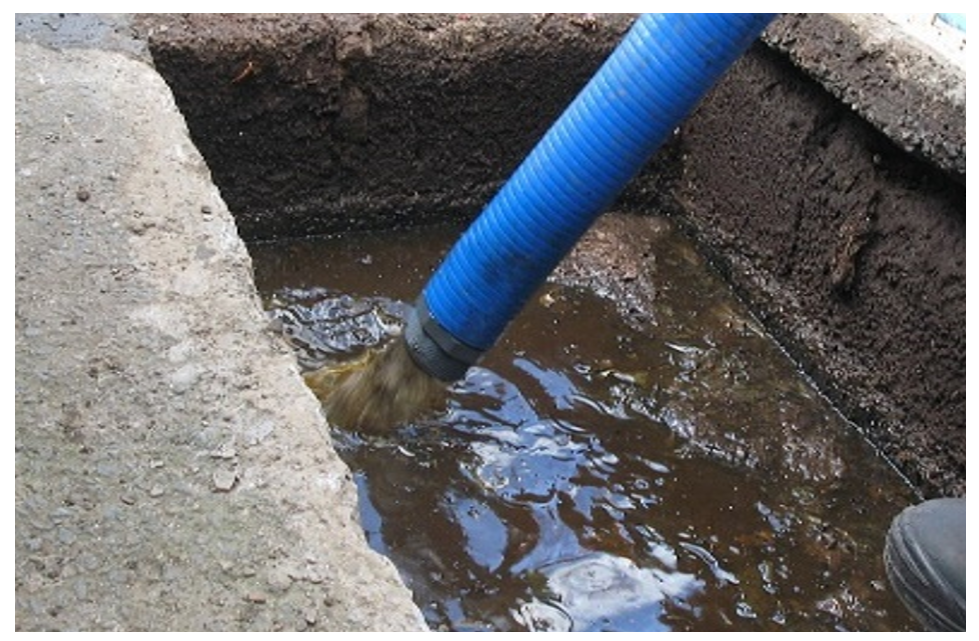
Table 1. Equipment and its purpose used in the septic tank sludge AD process simulation and optimization.
|
SNO |
Equipment |
Model/Specification |
Purpose |
|---|---|---|---|
|
1. |
CHN analyser |
ULTRA CHS-580 |
Ultimate analysis |
|
2. |
Bomb Calorimeter |
TX-300 |
To determine calorific value |
|
3. |
Magnetics stirrer |
WT-500 |
For mixing the sludge |
|
4. |
Thermocouple PH-Meter |
Gs 405a-01 |
For measuring temperature for the acidity test |
|
5. |
Furnace |
HTF-14200-5 |
Drying of feedstock |
|
6. |
Oven |
C367ekh |
Synthesis and drying |
Table 2. Materials/Tools used in the septic tank sludge AD process simulation and optimization.
|
SNO |
Materials/Tools |
Description |
Purpose |
|---|---|---|---|
|
1. |
Computer |
HP Computer 1 TRB, 5GB RAM |
Installation of the Aspen Plus software |
|
2. |
Aspen Plus Software |
Version 14.0 |
Process modelling and simulation of the anaerobic digestion process. |
|
3. |
Data from a reliable database and literature |
Input and operating parameters for simulation (Temperature, pressure, OLR, HRT, etc.) |
Model validation of the experimental |
|
4. |
Design Expert |
Version 13.0 |
Carry out optimization |
|
5. |
Aspen Process Economic Analyzer |
Version 14.1 |
Techno-economic analysis |
2.2. Method
This section describes the overall research methodology adopted in this study (Figure 2), including septic tank sludge characterization, AD modeling and simulation, model validation, techno-economic analysis, and process optimization for sustainable biomethane production. Septic tank sludge was collected from a residential area in Yelwan, Bauchi, Nigeria, and characterized using proximate and ultimate analyses to evaluate its physicochemical properties and suitability for anaerobic digestion. The anaerobic digestion process was modeled and simulated using Aspen Plus version 14.0 under steady-state operating conditions. The simulation framework incorporated both kinetic and non-kinetic reactor approaches to represent the biochemical conversion pathways during anaerobic digestion. Stoichiometric reactor (RSTOIC) blocks were used to simulate substrate decomposition and hydrolysis processes, while a continuously stirred tank reactor (CSTR) was employed to represent methanogenic conversion and biogas formation.
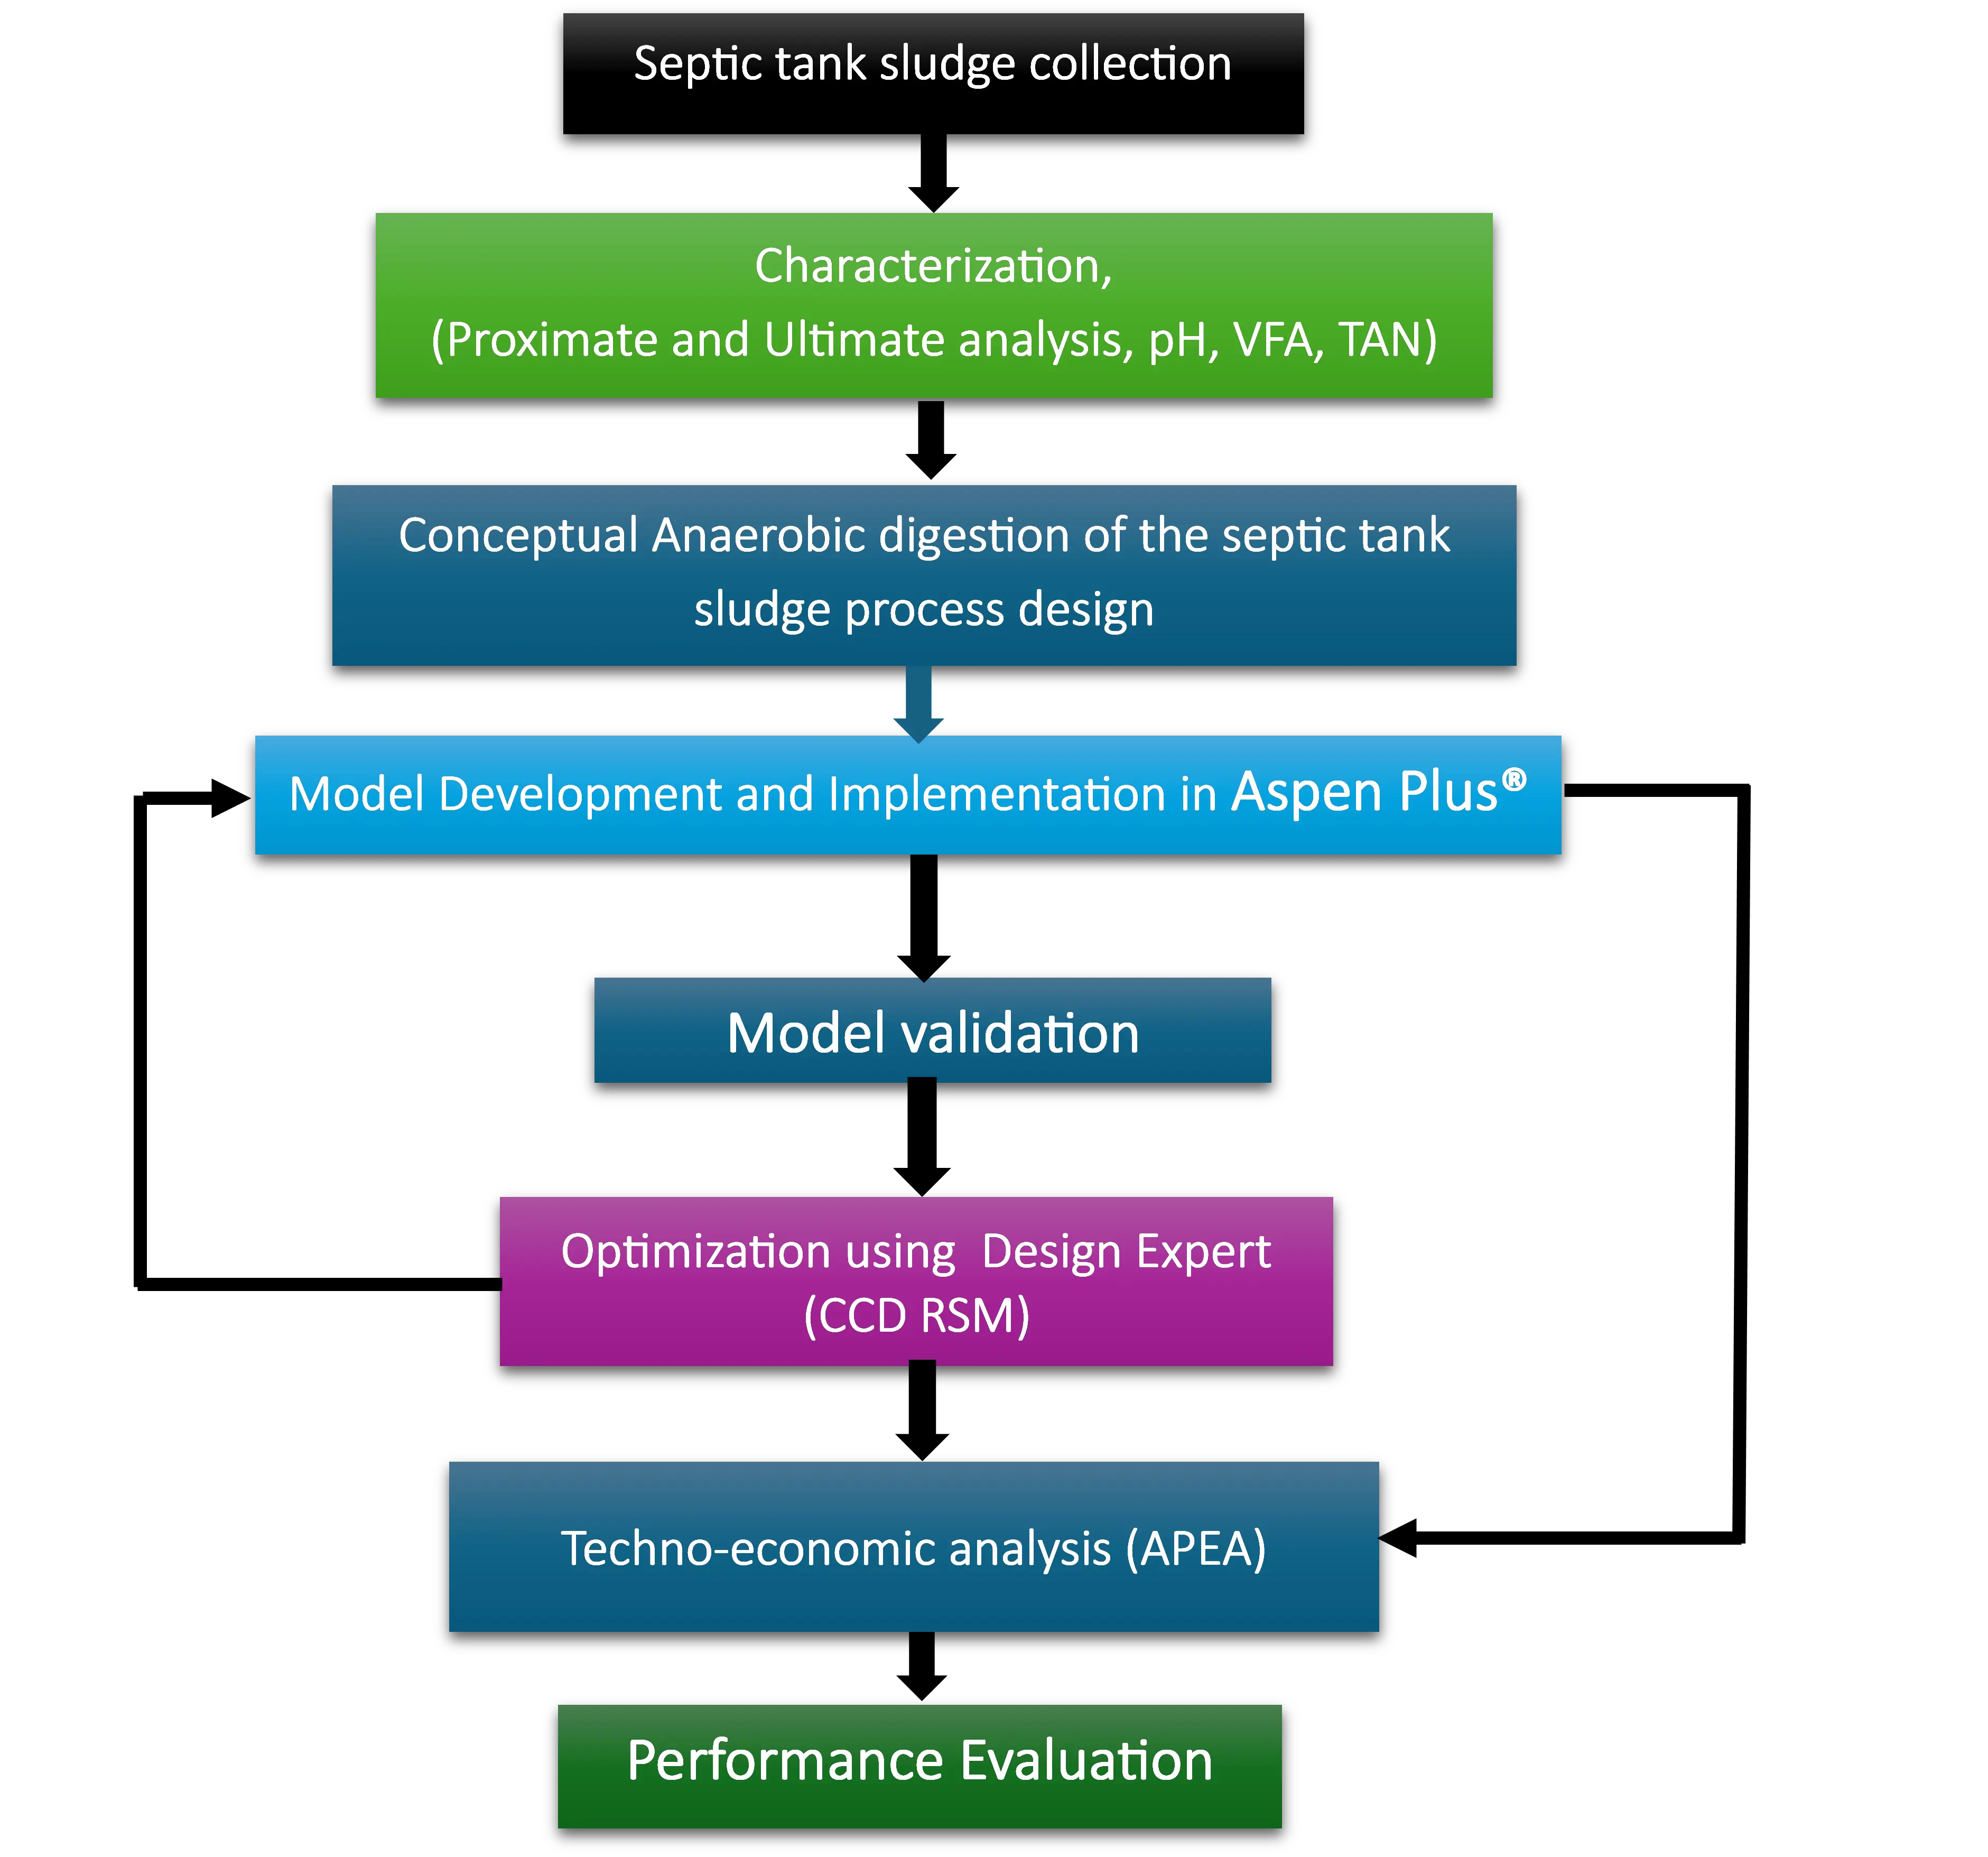
Figure 2. Block flow diagram of the techno-optimization approach for biomethane recovery from septic tank sludge.
The simulation model was developed using substrate characterization results, Aspen Plus thermodynamic databases, and operating parameters obtained from experimentally validated literature related to anaerobic digestion and biomethane production. Biomass and ash were defined as non-conventional components, whereas gaseous and liquid compounds were treated as conventional components within the Aspen Plus environment. Key operating parameters investigated in the study included hydrolysis temperature, digester temperature, hydraulic retention time (HRT), and organic loading rate (OLR).
The accuracy of the developed Aspen Plus AD model for biomethane recovery from septic tank sludge was evaluated through validation against previously published experimental studies. Furthermore, the developed simulation model was integrated with the Aspen Plus Economic Analyzer to perform techno-economic assessment, including estimation of capital and operating costs associated with biomethane production. Process optimization was carried out using Design-Expert version 13.0 through RSM based on the CCD approach to evaluate the effects of selected operating parameters and determine the optimum process conditions for enhanced biomethane yield.
2.2.1. Feedstock Characterization
Proximate Analysis
The moisture content of the septic tank sludge was determined using the oven-dry method according to ASTM D2216-19 [16]. Pre-weighed porcelain dishes were dried at 105 °C for 1 h, cooled in a desiccator, and weighed (W1). About 2 g of sludge was added to each dish, and the total weight was recorded (W2). Samples were then dried at 105 °C for 12 h, cooled in a desiccator, and reweighed (W3). Moisture content (MC) was calculated using Equation (1):
|
```latex\mathrm{MC}\left(\%\right)=\frac{W_2-W_3}{W_2-W_1}\times100``` |
(1) |
where W1 is the weight of the empty dish (g), W2 is the weight of the dish with the wet sample (g), and W3 is the weight of the dish with the dry sample (g).
The dry matter content (DM) will be determined by subtracting the moisture content from the total fraction (100%) as expressed in Equation (2):
|
```latex\mathrm{DM}\left(\%\right)=100-\mathrm{MC}``` |
(2) |
This method provides a reliable estimation of the sludge’s moisture and solids content, which are essential parameters in evaluating its biodegradability and suitability for anaerobic digestion [16,17].
The ash, volatile solids, and fixed carbon contents of the septic tank sludge were determined using the muffle furnace method, following ASTM standards adopted by [18]. Pre-weighed porcelain crucibles were first heated in a muffle furnace for a few minutes, cooled in a desiccator, and weighed. Approximately 2 g of each sample was placed into the crucibles and ashes in a muffle furnace at 600 °C for 3 h, with temperature maintained using an automatic pyrometer. The crucibles were then cooled in a desiccator and weighed.
The ash content (AC) was calculated as Equation (3):
|
```latex\mathrm{AC}\left(\%\right)=\frac{W_{\mathrm{ash}}}{W_{\mathrm{sample}}}\times100``` |
(3) |
where $${W}_{\text{ash}}$$ is the weight of the residue after ashing, and $${W}_{\text{sample}}$$ is the initial sample weight.
The volatile solids (VS) were calculated using Equation (4):
|
```latex\mathrm{VS~}(\%)=\frac{W_{\mathrm{sample}}-W_{\mathrm{ash}}}{W_{\mathrm{sample}}}\times100``` |
(4) |
Finally, the fixed carbon (FC) content was determined using Equation (5):
|
```latex\text{FC}(\%) = 100 - \text{AC}(\%) - \text{VS}(\%)``` |
(5) |
This method provides accurate quantification of sludge composition, which is essential for subsequent thermochemical and energy analyses [19].
Ultimate Analysis
The ultimate analysis of the septic tank sludge was conducted to determine its elemental composition, including carbon (C), hydrogen (H), nitrogen (N), sulfur (S), and oxygen (O). Total nitrogen was determined using the calorimetric block digestion method, as reported from the work of [20]. Sludge samples were digested with hydrogen peroxide (H2O2), concentrated sulfuric acid (H2SO4), selenium, and salicylic acid to convert nitrates into measurable compounds. The digest was diluted (1:9 v/v) with distilled water, reacted with reagents N1 and N2, allowed to stand for 2 h, and the absorbance was measured at 650 nm using a spectrophotometer. Nitrogen content was obtained directly from a calibration curve prepared with standard solutions.
Carbon, hydrogen, and sulfur contents were analyzed using a ULTRA CHS-580 Elemental Analyzer (ELTRA GmbH, Haan, Germany) [21]. The analyzer’s resistance furnace, with a horizontal orientation, used 99.5% pure oxygen to heat samples to 1550 °C in 1 °C increments. Homogenized samples (250–500 mg) were weighed on an electronic balance, manually entered into the connected PC system, and loaded into ceramic boats before being introduced into the furnace using tongs. The analyzer employed solid-state infrared absorption detection with three independent infrared cells. Analysis times ranged from 74 to 115 s, during which detector signals were automatically plotted on the PC screen. All experiments were performed in triplicate for the sludge samples, and the resulting data and graphs were exported to MS Word for interpretation.
Oxygen content was calculated by difference after determining the other elements and ash content via muffle furnace ashing [22]. This approach provides a comprehensive characterization of the sludge’s elemental composition for subsequent thermochemical and energy analyses.
The Dulong formula (Equation (6)) was employed in this study to determine the high heating values of biomass, biochar, and biocrude.
|
```latexHHV\left(\frac{\mathrm{M}\mathrm{J}}{\mathrm{K}\mathrm{g}}\right)= 0.3383C+1.422\left(H-\frac{O}{8}\right)+0.0942S``` |
(6) |
Characterizations of Septic Tank Sludge
The characterization of septic tank sludge is critical for determining feedstock stability and treatment potential. Key indicators such as pH, VFA, and total ammonia-nitrogen (TAN) provide insight into microbial activity, organic breakdown, and possible process inhibition. These parameters form the basis for evaluating sludge waste condition and determining proper treatment procedures as follows:
pH Measurement
The pH of the sludge samples was determined immediately following collection using a benchtop pH meter Mettler Toledo Seven Compact S220 (Mettler Toledo AG, Greifensee, Switzerland) with a combination glass electrode. The instrument was calibrated daily using standard buffer solutions of pH 4.01, 7.00, and 10.00 (Merck, Germany) at 25 ± 1 °C before measuring. To guarantee homogeneity, each sample was gently agitated. The pH reading was taken when it stabilised to within ±0.02 units. Measurements were performed in triplicate using Standard Methods 4500-H+ B [23].
Volatile Fatty Acid
The concentration and profile of VFAs were measured using gas chromatography (Agilent 7890B GC, Agilent Technologies, Santa Clara, CA, USA) with a flame ionisation detector (FID, Agilent Technologies, Santa Clara, CA, USA) and a fused silica capillary column (Agilent DB-FFAP, 30 m × 0.25 mm × 0.25 μm). Before analysis, samples were centrifuged at 10,000× g for 10 min and filtered using 0.45 µm PTFE syringe filters (Merck Millipore, Burlington, MA, USA). To avoid microbial activity, the supernatant was acidified to pH < 2 with 1 M H2SO4 and kept at 4 °C. The injector and detector temperatures were kept at 200 °C and 250 °C, respectively, with nitrogen as the carrier gas at a flow rate of 1 mL·min−1. External calibration with approved standards was used to determine the concentrations of acetic, propionic, butyric, isobutyric, valeric, and isovaleric acids. VFAs were expressed as mg·L−1 of acetic acid equivalents [23,24].
Total Ammonia-Nitrogen
TAN concentration was analysed using the phenate spectrophotometric method, as defined in Standard Methods 4500-NH3F [25]. To meet the calibration curve’s linear range, liquid samples were filtered through 0.45 µm filters and diluted as appropriate. In this process, ammonia interacts with hypochlorite and phenol in an alkaline medium to produce indophenol blue.
The absorbance of the resultant complex was measured at 640 nm with a UV-Vis spectrophotometer (UV-1900, Shimadzu Corporation, Kyoto, Japan). Calibration was carried out using analytical-grade ammonium chloride (NH4Cl) standards (0–5 mg·L−1 NH3-N). All measurements were taken in triplicate and reported as mg·NH3-N·L−1.
Strict quality assurance and control (QA/QC) protocols were used throughout the studies, including reagent blanks, duplicate samples, and verified standards. These tests offered valid markers of digestion stability and process performance in the anaerobic environment.
2.2.2. Process Simulation
Feedstock
Septic tank sludge was selected as the feedstock for this study because of its high generation rate and significant environmental impact. The rapid urbanization has prompted the implementation of modern sanitation and building systems, increasing the annual volume of septic tank sludge waste [26]. The physicochemical properties of the sludge, as determined by laboratory analysis including proximate, ultimate, and sulphur analyses, as well as additional data from the literature, were used as input parameters for the Aspen Plus simulation. Furthermore, critical process parameters such as organic loading rate, operating temperature, and hydraulic retention time were obtained from previously published studies [27] and applied as feed and operational conditions to simulate the anaerobic digestion system for biomethane recovery from septic tank sludge.
Aspen PLUS® Modelling and Simulation Procedure
The septic tank sludge was modelled as a non-conventional feedstock owing to its heterogeneous physicochemical composition and variable organic content [27]. The thermophysical properties, including enthalpy and density, were estimated to be using the DCOALIGT and HCOALGEN property models embedded in Aspen Plus. These models are specifically designed for non-conventional solid materials and have been widely applied to simulate biomass and waste conversion processes [28]. The stream class was defined as MXNC, representing a mixture of conventional (MIXED) and non-conventional (NC) sub-streams to capture both compositional and thermal interactions accurately. For the conventional components, the Non-Random Two-Liquid (NRTL) equation of state with the STEAM-TA alpha function was employed to evaluate thermophysical properties. This property method was selected to ensure robust prediction of vapor–liquid equilibria and phase behaviour across a wide range of process conditions [29].
The simulation was performed using process conditions and design parameters obtained from relevant literature sources, as summarized in Table 3. These parameters were selected to ensure a realistic representation of the AD process for septic tank sludge under typical operational conditions [30]. In this study, the OLR was expressed in kg·VS·m−3·day−1, to represent the volumetric substrate feeding rate applied within the Aspen Plus simulation framework under steady-state conditions. The reported values, therefore, correspond to simulation-based flow loading parameters used for process evaluation and optimization rather than conventional volatile solids (VS)-based experimental loading rates. The developed process flow diagram (PFD) of the AD system, illustrating the sequential unit operations and mass-energy interactions involved in biomethane production, is presented in Figure 3. The modeling and simulation were performed in the Aspen Plus environment using established thermodynamic and kinetic principles to represent the biochemical conversion of sludge into biogas. The Aspen Plus unit operation blocks and input components employed in the simulation are summarized in Table 4 and Table 5. The detailed stepwise simulation procedure adopted in this study is described in the subsequent sections [31]:
- i.
-
Component selection.
- ii.
-
Thermodynamic options selection.
- iii.
-
Computing feeds composition and thermodynamics.
- iv.
-
Creating a flow sheet.
- v.
-
Feed and product stream naming.
- vi.
-
Equipment parameters computation.
- vii.
-
Result collection from the simulated environment.
Table 3. Input parameters used for the simulation of anaerobic digestion of septic tank sludge for biomethane production.
|
Unit Operation |
Aspen Plus Block |
Uses |
Parameters |
Reference |
|
|---|---|---|---|---|---|
|
Hydrolysis Reactor |
Rstioc |
Hydrolysis Reaction |
Temperature |
35 °C |
[32] |
|
Pressure |
1 atm |
||||
|
AD Digestion |
RCSTR |
Acidogenic, acetogenic, and methanogenic reactions |
Temperature Pressure HRT OLR |
55 °C 2 atm 15 days 5.0 kg·VS·m−3·day−1 |
|
|
Hydrolysis Reactor |
Rstioc |
Hydrolysis Reaction |
Temperature |
35 °C |
Curren study |
|
Pressure |
1 atm |
||||
|
AD Digestion |
RCSTR |
Acidogenic, acetogenic, and methanogenic reactions |
Temperature Pressure HRT OLR |
55 °C 2 atm 25 days 37.5 kg·VS·m−3·day−1 |
|
Table 4. Description of unit operations used for anaerobic digestion in Aspen Plus.
|
Block Specification |
Aspen Plus Block Name |
Description |
|---|---|---|
|
MX-100 |
Mixer |
Mixing process |
|
E-100 |
Heater |
Purification of sludge |
|
R-100 |
Rstioc |
Hydrolysis rector |
|
R-100 |
CSTR |
Digester |
|
SC-100 |
Flash sep |
Separation of biogas from other liquids |
|
SEP-100 |
SEP |
Separation of biomethane from other gases |
Table 5. List of simulation components.
|
Component ID |
Type |
Component Name |
Alias |
|---|---|---|---|
|
ACETI-01 |
Conventional |
ACETIC-ACID |
C2H4O2 |
|
ALANI-01 |
Conventional |
ALANINE |
C3H7NO2 |
|
ARGIN-01 |
Conventional |
ARGININE |
C6H14N4O2-N2 |
|
ASPAR-01 |
Conventional |
ASPARTIC-ACID |
C4H7NO4 |
|
ETHYL-01 |
Conventional |
ETHYL-CYANOACETATE |
C5H7NO2 |
|
CELLU-01 |
Conventional |
CELLULOSE |
CELLULOSE |
|
METHA-01 |
Conventional |
METHANE |
CH4 |
|
CYSTE-01 |
Conventional |
CYSTEINE-E-2 |
C3H6NO2S |
|
CO2 |
Conventional |
CARBON-DIOXIDE |
CO2 |
|
ETHANOL |
Conventional |
ETHANOL |
C2H6O2 |
|
DEXTROSE |
Conventional |
DEXTROSE |
C6H12O6 |
|
GLUTAMIC |
Conventional |
L-GLUTAMIC-ACID |
C5H9NO4 |
|
GLYCEROL |
Conventional |
GLYCEROL |
C3H8O3 |
|
GYLCINE |
Conventional |
GLYCINE |
C2H5NO2 |
|
FURFURAL |
Conventional |
FURFURAL |
C5H4O2 |
|
H2 |
Conventional |
HYDROGEN |
H2 |
|
H2S |
Conventional |
HYDROGEN-SULFIDE |
H2S |
|
GLUTA-01 |
Conventional |
GLUTARIC-ACID |
C5H8O4 |
|
INERT |
Pseudocomponent |
- |
|
|
ISOLEICI |
Conventional |
ISOLEUCINE |
C6H13NO2 |
|
IPROTEIN |
Pseudocomponent |
- |
|
|
LEUCINE |
Conventional |
LEUCINE |
C6H13NO2 |
|
LINOLEIC |
Conventional |
LINOLEIC-ACID |
C18H32O2 |
|
NH3 |
Conventional |
AMMONIA |
H3N |
|
OLEIC-01 |
Conventional |
OLEIC-ACID |
C18H34O2 |
|
1-HEX-01 |
Conventional |
1-HEXADECANOL |
C16H34O |
|
L-PHE-01 |
Conventional |
L-PHENYLALANINE |
C9H11NO2 |
|
PROLI-01 |
Conventional |
PROLINE |
C5H9NO2-N8 |
|
PROPI-01 |
Conventional |
PROPIONIC-ACID-AMIDE |
C3H7NO-N1 |
|
PROTEIN |
Pseudocomponent |
||
|
SERINE |
Conventional |
SERINE |
C3H7NO3 |
|
SN-1—01 |
Conventional |
SN-1-PALMITO-2-LINOLEIN |
C37H68O5 |
|
THREO-01 |
Conventional |
THREONINE |
C4H9NO3 |
|
TRIOL-01 |
Conventional |
TRIOLEIN |
C57H104O6 |
|
TRIPA-01 |
Conventional |
TRIPALMITIN |
C51H98O6 |
|
VALINE |
Conventional |
VALINE |
C5H11NO2 |
|
H2O |
Conventional |
WATER |
H2O |
|
XYLOSE |
Conventional |
D-XYLOSE |
C5H10O5 |
|
ISOBU-01 |
Conventional |
ISOBUTYRIC-ACID |
C4H8O2 |
|
BIOMASS |
Nonconventional |
- |
|
|
HYDCHAR |
Nonconventional |
- |
|
|
ASH |
Nonconventional |
- |
|
|
DIGESTAT |
Nonconventional |
- |
|
|
C |
Solid |
CARBON-GRAPHITE |
C |
|
O2 |
Conventional |
OXYGEN |
O2 |
|
N2 |
Conventional |
NITROGEN |
N2 |
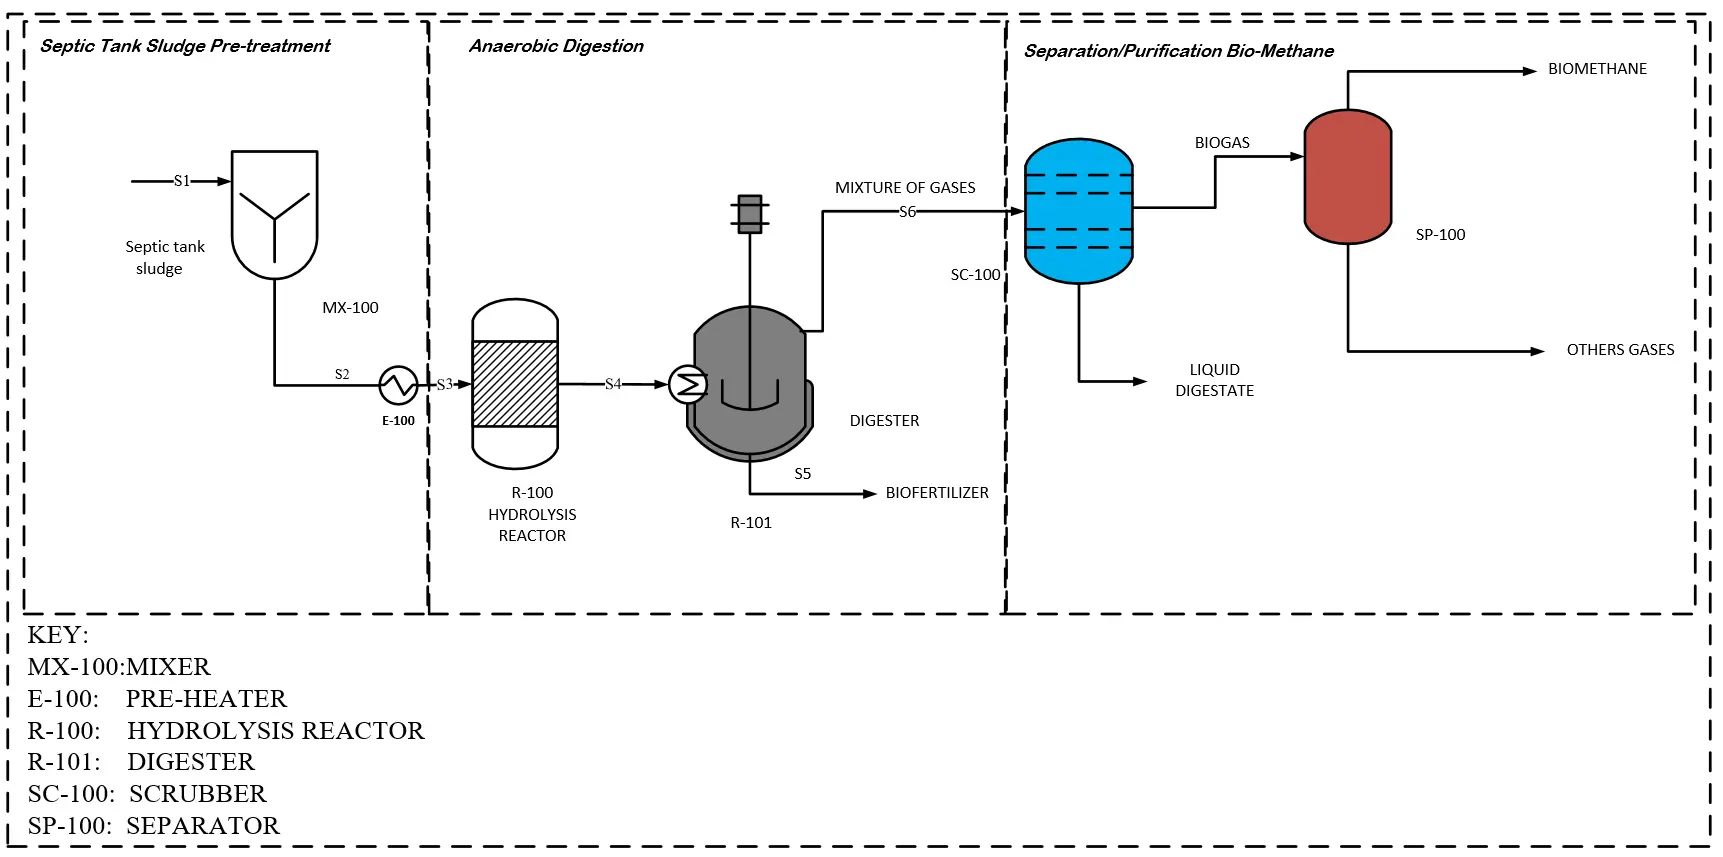
Figure 3. Process flow diagram for anaerobic digestion of septic tank sludge for bio-methane production.
Assumptions for Aspen PLUS® Modelling and Simulation
The model incorporates both kinetic and non-kinetic approaches using CSTRs and RSTOIC reactors under steady-state conditions. However, it does not explicitly account for detailed microbial kinetics, inhibition effects, or VFA accumulation. Consequently, this model serves as a simplified framework for preliminary process evaluation and optimization, rather than as a comprehensive biochemical kinetic model. The following summarizes the assumptions made during the development and simulation of septic tank sludge anaerobic digestion for sustainable biomethane production [29].
-
The simulation was run at steady state
-
Biomass and Ash are modelled as non-conventional
-
Both kinetic and non-kinetic reactor formulations were incorporated in the simulation
-
Simulation is conducted at a constant temperature
-
Char is modelled as solid carbon
-
Tar-free process formation
Model Development of Anaerobic Digestion of Septic Tank Sludge
The AD process was modelled using a two-stage digester configuration operating under thermophilic conditions, following the approach adopted by [29] for the anaerobic digestion of food waste at varying fat concentrations, organic loading rates, and hydraulic retention times. Several researchers have successfully employed Aspen Plus to simulate the AD process under different substrate compositions and operating conditions. For instance, Ajala and Odejobi [28] developed an Aspen Modelling, simulation, and optimization of home and agricultural waste-based anaerobic digestion with Aspen Plus, Their model comprised two reactors: a stoichiometric reactor representing the hydrolysis stage, where hydrolysis reactions occurred at a mesophilic temperature of 35 °C (comprising 13 reactions, as shown in Table 6), and a CSTR incorporating 25 reactions (Table 7) to describe the subsequent stages of acidogenesis, acetogenesis, and methanogenesis. The latter operated at a thermophilic temperature of 55 °C and a hydraulic retention time (HRT) of 20 days.
Ref. [33] developed a process simulation of an anaerobic co-digestion for biogas production from various organic substrates under different process conditions. The simulation utilized the NRTL property method to describe phase behaviour and thermodynamic interactions within the system. A stoichiometric reactor was employed to represent the hydrolysis phase, while a CSTR was used to model the subsequent stages of acidogenesis, acetogenesis, and methanogenesis. The model was validated against experimental datasets, demonstrating strong agreement between the simulated and observed biogas yields.
Table 6. Degradation reaction for hydrolysis [29].
|
No. |
Components |
Stoichiometry |
|---|---|---|
|
1 |
Acetic acid |
$${\mathrm{C}}_{2}{\mathrm{H}}_{4}{\mathrm{O}}_{2}\to \mathrm{ }{\mathrm{C}\mathrm{H}}_{4}+{\mathrm{C}\mathrm{O}}_{2}$$ |
|
2 |
Arabinose |
$${\mathrm{C}}_{5}{\mathrm{H}}_{10}{\mathrm{O}}_{5}\mathrm{ }\to 2.5{\mathrm{C}\mathrm{H}}_{4}+2.5{\mathrm{C}\mathrm{O}}_{2}$$ |
|
3 |
Cellulose, Peptin |
$${\mathrm{C}}_{6}{\mathrm{H}}_{10}{\mathrm{O}}_{5}+{\mathrm{H}}_{2}\mathrm{O}\mathrm{ }\to 3{\mathrm{C}\mathrm{H}}_{4}+3{\mathrm{C}\mathrm{O}}_{2}$$ |
|
4 |
Glucose |
$${\mathrm{C}}_{6}{\mathrm{H}}_{12}{\mathrm{O}}_{6}\mathrm{ }\to 3{\mathrm{C}\mathrm{O}}_{2}$$ |
|
5 |
Galactose |
$${\mathrm{C}}_{6}{\mathrm{H}}_{12}{\mathrm{O}}_{6}\mathrm{ }\to 3{\mathrm{C}\mathrm{O}}_{2}$$ |
|
6 |
Hemicellulose, Arabina, Xylan |
$${\mathrm{C}}_{5}{\mathrm{H}}_{8}{\mathrm{O}}_{4}+{\mathrm{H}}_{2}\mathrm{O}\mathrm{ }\to 2.5{\mathrm{C}\mathrm{H}}_{4}+2.5{\mathrm{C}\mathrm{O}}_{2}$$ |
|
7 |
Protein |
$${\mathrm{C}}_{13}{\mathrm{H}}_{25}{\mathrm{O}}_{7}{\mathrm{N}}_{3}\mathrm{S}+{\mathrm{H}}_{2}\mathrm{O}\mathrm{ }\to \mathrm{ }{6.5\mathrm{C}\mathrm{O}}_{2}+{6.5\mathrm{C}\mathrm{H}}_{4}+{3\mathrm{H}}_{3}\mathrm{N}+{3\mathrm{H}}_{2}\mathrm{S}$$ |
|
8 |
Sucrose |
$${\mathrm{C}}_{12}{\mathrm{H}}_{22}{\mathrm{O}}_{11}+{\mathrm{H}}_{2}\mathrm{O}\mathrm{ }\to {6\mathrm{C}\mathrm{H}}_{4}+{6\mathrm{C}\mathrm{O}}_{2}$$ |
|
9 |
Xylose |
$${\mathrm{C}}_{5}{\mathrm{H}}_{10}{\mathrm{O}}_{5}\mathrm{ }\to {2.5\mathrm{C}\mathrm{H}}_{4}+{2.5\mathrm{C}\mathrm{O}}_{2}$$ |
Table 7. List of amino acids, acidogenic, acetogenic, and methanogenic reactions with kinetic constants [34].
|
No. |
Compound |
Chemical Reactions |
Kinetic Constants (s−1) |
|---|---|---|---|
|
Amino acids degradation |
|||
|
1 |
Glycine |
C2H5NO2 + H2 → C2H4O2 + H3N |
1.28 × 10⁻² |
|
2 |
Threonine |
C4H9NO3 + H2 → C2H4O2 + 0.5C4H8O2 +H3N |
1.28 × 10⁻² |
|
3 |
Histidine |
C6H8N3O2 + 4H2O + 0.5H2 → CH3NO +C2H4O2 + 0.5C4H8O2 + 2H3N + CO2 |
1.28 × 10⁻² |
|
4 |
Arginine |
C6H14N4O + 3H2O + H2 → 0.5C2H4O2 + 0.5C3H6O2 + 0.5C5H10O2 + 4H3N + CO2 |
1.28 × 10⁻² |
|
5 |
Proline |
C5H9NO2 + H2O + H2 → 0.5C2H4O + 0.5C3H6O2 + 0.5C5H10O2 + H3N |
1.28 × 10⁻² |
|
6 |
Methionine |
C5H11NO2S + 2H2O → C3H6O2 + CO2 + H3N + H2 |
1.28 × 10⁻² |
|
7 |
Serine |
C3H7NO3 + H2O → C2H4O2 + H3N +CO2 + H2 |
1.28 × 10⁻² |
|
8 |
Threonine |
C4H9NO3 + H2O → C3H6O2 + H3N + H2 + CO2 |
1.28 × 10⁻² |
|
9 |
Aspartic acid |
C4H7NO4 + 2H2O → C2H4O2 + H3N + 2CO2 + 2H2 |
1.28 × 10⁻² |
|
10 |
Glutamic acid |
C5H9NO4 + H2O → C2H4O2 + 0.5C4H8O2 +H3N + CO2 |
1.28 × 10⁻² |
|
11 |
Glutamic acid |
C5H9NO4 + 2H2O → 2C2H4O2 + H3N + CO2+ H2 |
1.28 × 10⁻² |
|
12 |
Histidine |
C6H8N3O2 + 5H2O → CH3NO + 2C2H4O2 + 2H3N + CO2 + 0.5H3N |
1.28 × 10⁻² |
|
13 |
Arginine |
C6H14N4O2 + 6H2O → 2C2H4O2 +4H3N + 2CO2 + 3H2 |
1.28 × 10⁻² |
|
14 |
Lysine |
C2H13N2O2 + 2H2O → C2H4O2 + C4H8O2 + 2H3N |
1.28 × 10⁻² |
|
15 |
Leusine |
C6H13NO2 + 2H2O → C5H10O2 + H3N + CO2 + 2H2 |
1.28 × 10⁻² |
|
16 |
Isoleusine |
C6H13NO2 + 2H2O → C5H10O2 + H3N + CO2 + 2H2 |
1.28 × 10⁻² |
|
17 |
Valine |
C5H11NO2 + 2H2O → C4H8O2 + H3N + CO2 + 2H2 |
1.28 × 10⁻² |
|
18 |
Phenyalanine |
C9H11NO2 + 2H2O → C6H6 + C2H4O2 + H3N + CO2 + H2 |
1.28 × 10⁻² |
|
19 |
Tyrosine |
C9H11NO3 + 2H2O → C6H6O + C2H4O2+ H3N + CO2 + H2 |
1.28 × 10⁻² |
|
20 |
Typtophan |
C11H12N2O2 + 2H2O → C8H7N + C2H4O2 + H3N + CO2 + H2 |
1.28 × 10⁻² |
|
21 |
Glysine |
C2H5NO2 + 0.5H2O → 0.75C2H4O2 + H3N + 0.5CO2 |
1.28 × 10⁻² |
|
22 |
Alanine |
C3H7NO2 + 2H2O → C2H4O2 + H3N + CO2 + 2H2 |
1.28 × 10⁻² |
|
23 |
Cycteine |
C3H6NO2S + 2H2O → C2H4O2 + H3N + CO2 + 0.5H2+ H2S |
1.28 × 10⁻² |
|
Acidogenic Reaction |
|||
|
24 |
Dextrose |
C6H12O6 + 0.1115H3N → 0.115C5H7NO2 + 0.744C2H4O2 + 0.5C3H6O2 + 0.4409C4H8O2 + 0.6909CO2 + 1.0254H2O |
9.54 × 10⁻³ |
|
25 |
Glycerol |
C3H8O3 + 0.4071H3N + 0.0291CO2 + 0.0005H2 → 0.04071C5H7NO2 + 0.94185C3H6O2 + 1.09308H2O |
1.01 × 10⁻² |
|
Acetogenic Reactions |
|||
|
26 |
Oleic acid |
C18H34O2 + 15.2396H2O + 0.2501CO2 + 0.1701H3N → 0.1701C5H7NO2 + 8.6998C2H4O2 + 14.4978H2 |
3.64 × 10⁻¹² |
|
27 |
Propanoic acid |
C3H6O2 + 0.06198H3N + 0.314336H2O → 0.06198C5H7NO2 + 0.9345C2H4O2 + 0.660412CH4 + 0.160688CO2 + 0.00055H2 |
1.95 × 10⁻⁷ |
|
28 |
Isobutyric acid |
C4H8O2 + 0.0653H3N + 0.8038H2O + 0.0006H2+ 0.5543CO2 → 0.0653C5H7NO2 + 1.8909C2H4O2 + 0.446CH4 |
5.88 × 10⁻⁶ |
|
29 |
Isovaleric acid |
C5H10O2 + 0.0653H3N + 0.5543CO2 + 0.8044H2O → 0.0653C5H7NO2 + 0.8912C2H4O2 + C3H6O2 + 0.4454CH4 + 0.0006H2 |
3.01 × 10⁻⁸ |
|
30 |
Linoleic acid |
C18H32O2 + 15.356H2O + 0.482CO2 + 0.1701H3N → 0.1701C5H7NO2 + 9.02C2H4O2 + 10.0723H2 |
3.64 × 10⁻¹² |
|
31 |
Palmitic acid |
C16H34O + 15.253H2O + 0.482CO2 + 0.1701H3N → 0.1701C5H7NO2 + 8.4402C2H4O2 + 14.9748H2 |
3.64 × 10⁻¹² |
|
Methanogenic Reaction |
|||
|
32 |
Acetic Acid |
C2H4O2 + 0.022H3N → 0.022C5H7NO2 + 0.945CH4 + 0.066H2O + 0.945CO2 |
2.39 × 10⁻¹² |
|
33 |
Hydrogen |
14.4976H2 + 3.8334CO2 + 0.0836H3N → 0.0836C5H7NO2 + 3.4155CH4 + 7.4996H2O |
1.5 × 10⁻³ |
2.2.3. Mathematical Model and Optimization
The experimental matrix was developed using Design-Expert software version 13.0, while optimization was performed through the CCD approach of RSM. A similar methodology was previously reported by Ugwu and Enweremadu [35]. The ranges of the coded factors used in the experimental design are presented in Table 8.
Table 8. Factors and factor levels used to run the RSM of the CCD matrix.
|
Variable |
Code |
Range and Low Level (−1) |
Range and High Level (+1) |
|---|---|---|---|
|
HTemperature (°C) |
A |
25 |
35 |
|
DTemperature (°C) |
B |
40 |
60 |
|
HRT (Days) |
C |
5 |
35 |
|
ORL (kg·VS·m−3·day−1) |
D |
15 |
35 |
2.2.4. Techno-Economic Analysis
The overall technique used in this study included the basic process design of anaerobic digestion systems for biomethane recovery from septic tank sludge, model development and execution with Aspen Plus®, and economic evaluation utilizing the discounted cash flow (DCF) method. The model-based estimation approach was used to generate capital and operational costs, as well as execute investment assessments, utilizing APEA and price data from the first quarter of 2024 (Figure 4). The economic input parameters (Table 9 and Table 10) were carefully chosen to determine the feasibility of carrying out the project at the grassroots level, particularly in developing nations. The assumed biomethane selling price in this study is based on literature-reported and market-aligned values for upgraded, fuel-grade biomethane (renewable natural gas, RNG). This price reflects pipeline-quality biomethane suitable for direct substitution of conventional natural gas, with its value strongly influenced by upgrading efficiency, gas purity (typically ≥95% CH4), and regional energy market conditions [36,37].
Recent techno-economic and market analyses indicate that biomethane prices generally range from approximately 0.6 to 1.2 USD/kg CH4 equivalent, depending on policy incentives, carbon credits, and production pathway [38,39]. In comparison, fossil natural gas prices remain more volatile but are often lower in the absence of carbon pricing mechanisms, while RNG values tend to be higher in regions with strong decarbonization policies and renewable energy incentives [40,41]. The adopted value in this study (0.89 USD/kg), therefore, represents a realistic mid-range market condition consistent with current biomethane feasibility assessments reported in recent literature. This assumption ensures that the economic analysis reflects practical and contemporary market conditions for upgraded biomethane while maintaining consistency with established techno-economic evaluation frameworks for waste-to-energy systems. To analyse the system’s economic performance, key economic metrics such as Net Present Value (NPV), Payback Period (PP), Profitability Index (PI), and Internal Rate of Return (IRR) (Equation (7), Equation (8) and Equation (9)) [42] were used to calculate the revenues, capital, and operating expenses.
In addition, revenue estimation was primarily based on biomethane sales, while digestate was considered as a secondary by-product with potential market value as a soil amendment. Other gaseous fractions were assumed to be internally utilised for process energy requirements rather than treated as separate revenue streams. These assumptions were based on literature-reported and market-aligned values and may vary depending on regional economic conditions and policy frameworks.
|
$$NPV=\sum _{t=0}^{n}\frac{{C}_{t}}{{\left(1+r\right)}^{t}}$$ |
(7) |
where: Ct is the net cash flow at a time t; r is the discount rate, n is the project lifetime
|
```latexpayback\, Period=\frac{Initaila\, Investment}{Annual \,Net \,Cash\, Flow}``` |
(8) |
|
```latexIRR={R}_{1}+\frac{{NPV}_{1}}{{NPV}_{1}-{NPV}_{2}}\left({R}_{2}-{R}_{1}\right)``` |
(9) |
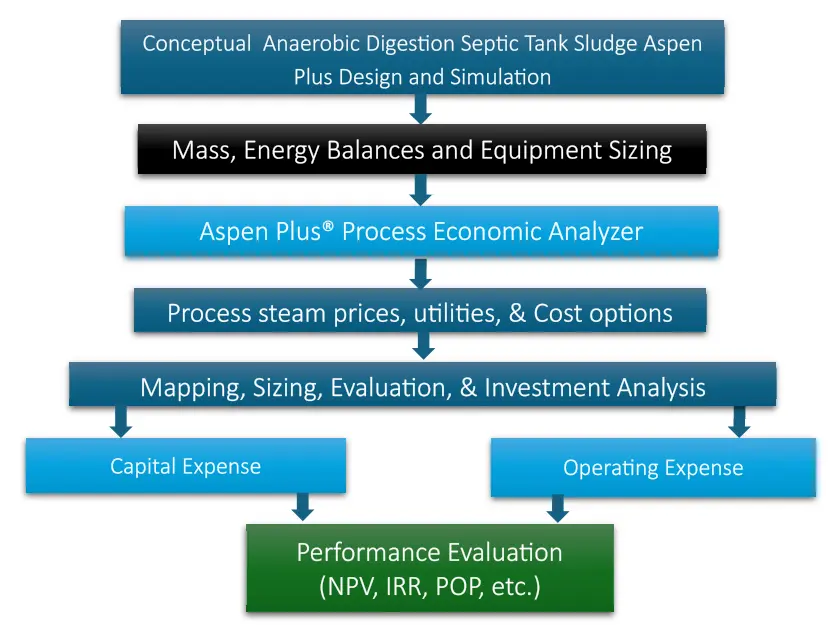
Table 9. Investment Analysis Input parameters [43].
|
Name |
Units |
Items |
|---|---|---|
|
Period Description |
Year |
|
|
Number of weeks per hour |
Weeks/Period |
52.0 |
|
Number of Periods of Analysis Tax |
Percent/Period |
25.0 |
|
Interest Rate/Desired Rate of Return |
Percent/Period |
2.0 |
|
Economic life of the Project |
Percent/Period |
25 |
|
Salvage Value (Percent of Initial Capital Cost) |
Percent/Period |
|
|
Depreciation Method |
Straight line |
|
|
Escalation parameters |
||
|
Project Capital Escalation |
Percent/Period |
1.5 |
|
Products Escalation |
Percent/Period |
2.5 |
|
Raw Material Escalation |
Percent/Period |
1.5 |
|
Operational and Maintenance Labour Escalation |
Percent/Period |
1.5 |
|
Utilities Escalation |
Percent/Period |
1.5 |
|
Project Capital Parameters |
||
|
Working Capital Percentage |
Percent/Period |
5.0 |
|
Operating Cost Parameters |
||
|
Operating Charges |
Percent/Period |
1.0 |
|
Plant Overhead |
Percent/Period |
1.0 |
|
General And Administrative Expense |
Percent/Period |
1.0 |
|
Facilities Operation Parameters |
||
|
Facility Type |
Septic sludge processing facility |
|
|
Operation Mode |
Continues Process |
|
|
Operating Hours Per Period |
Hours/Period |
8400 |
|
Process Fluid |
Liquids, gases and Solids |
3. Results and Discussion
3.1. Characterizations
To examine the stability of the feedstock and product, septic tank sludge was characterized using physicochemical studies (proximate and ultimate). Also, pH, VFA, and TAN tests were conducted on the septic tank sludge to determine the quantity of biogas present.
3.1.1. Ultimate and Proximate Analysis
The ultimate analysis (Table 11) shows that the septic tank sludge (STS) contains 55.80 wt.% carbon, 5.86 wt.% hydrogen, 2.89 wt.% nitrogen, 0.0136 wt.% sulfur, and 35.51 wt.% oxygen, with a higher heating value of 14.34 MJ·kg−1. The high carbon and oxygen contents indicate the presence of abundant biodegradable organics, such as proteins and carbohydrates [46]. The C/N ratio (19.30:1) suggests nitrogen enrichment, which may lead to ammonia inhibition during methanogenesis [47]. The low sulfur content minimizes H2S-related corrosion [48]. Overall, the HHV and composition demonstrate the sludge’s suitability for bioenergy recovery via anaerobic digestion or thermochemical conversion [49].
The proximate analysis results presented in Table 12 indicate that the septic tank sludge (STS) consisted of 47.55 wt.% moisture, 44.55 wt.% volatile matter, 34.86 wt.% fixed carbon, and 20.59 wt.% ash. In addition, the total solids, dissolved solids, and suspended solids contents were determined to be 52.45 wt.%, 15.73 wt.%, and 36.72 wt.%, respectively. The high moisture content (≈48%) indicates low energy density and the need for pre-treatment or dewatering before conversion [50]. The volatile matter (≈45%) reflects high organic matter content and potential for biogas production [51]. Fixed carbon (≈35%) suggests stable organics resistant to degradation [52], while ash (≈21%) represents inorganic minerals like silica and calcium that may affect reactor performance. The total solids align with typical thickened sludge values (40–60 wt.%), indicating suitability for mesophilic or thermophilic digestion [53]. Moreover, the suspended-to-dissolved solids ratio (≈2.3) confirms the predominance of particulate organic matter typical of septic tank effluents [54,55,56].
Overall, the ultimate and proximate studies reveal that septic tank sludge is a nitrogen-rich, moderately organic, and energy-dense substrate with promising properties for biomethane recovery by anaerobic digestion. However, the value of the C/N ratio may require co-digestion with carbon-rich feedstocks such as food waste or agricultural residues to improve process stability and methane yield [57].
Table 11. Ultimate analysis of septic tank sludge.
|
Ultimate Analysis |
|
|---|---|
|
Parameter |
Wt.% |
|
Carbon |
55.80 ± 0.00 |
|
Hydrogen |
5.86 ± 0.34 |
|
Nitrogen |
2.89 ± 0.00 |
|
Sulphur |
0.0136 ± 2.80 |
|
Oxygen |
35.51 ± 1.80 |
|
High heating value |
14.3421 |
Table 12. Proximate analysis of septic tank sludge.
|
Proximate Analysis |
|
|---|---|
|
Parameter |
Wt.% |
|
Moisture |
47.55 ± 0.64 |
|
Volatile matter |
44.55 ± 5.60 |
|
Fixed carbon |
34.86 ± 6.99 |
|
Ash Total Total Solid Dissolved Solid Suspended Solid |
20.59 ± 1.39 100 52.45 15.73 36.7 |
3.1.2. Septic Tank Sludge (pH, VFA, and TAN)
The pH, VFA, and TAN are important factors to determine the stability of AD. Continuous monitoring of these parameters helps to better understand the process as described in past studies [58]. The present study was based on batch experiments, and the reactors were sealed for the whole experimental period, so only the initial and final values of pH, VFA, and TAN were determined following previous studies [59]. It is difficult to explain the changes in these parameters over the digestion period, as the pH, VFA, and TAN were determined only at the beginning and end of the experiment. The pH, VFA, and TAN of STS during experiments are shown in Table 12. The initial pH of the substrates increased with total solids (TS) content, ranging from 6.56 at 5% TS to 6.95 at 15% TS. These values fall within the favourable pH range for methanogenic activity (6.3–7.8) reported in the literature [60], indicating suitable conditions for biogas production. After digestion, the pH varied between 6.34 and 7.42 depending on the TS content. Volatile fatty acid (VFA) concentrations initially ranged from 0.16 to 0.21 g/L and increased slightly after digestion to 0.27–0.90 g/L. Since VFA concentrations above 3 g/L may inhibit anaerobic digestion, while values below 2 g/L are considered stable for AD operation [61], The observed low VFA levels indicate favourable process stability and efficient biogas production. The lowest final VFA concentration (0.27 g/L) was observed at 15% TS, suggesting effective conversion of VFAs into biogas during methanogenesis. Methanogenesis in anaerobic digestion is primarily carried out by archaea, which are sensitive to ammonia and heavy metal inhibition. TAN concentrations below 1.5 g/L are generally considered acceptable for stable AD operation. In this study, TAN concentrations ranged from 0.65 to 0.75 g/L across all test groups, indicating stable digestion conditions without significant ammonia inhibition.
3.2. Anaerobic Digestion of the System for Biomethane Recovery Model Validation
The developed Aspen Plus AD model is a simulation-based framework. Model consistency was assessed by benchmarking simulated biogas CH4 content against published experimental studies (Table 13) involving related organic substrates, including waste-activated sludge, co-digested manure, and municipal biowaste. The septic tank sludge characterization results presented in Section 2 were used as the primary input data for the simulation. This comparative evaluation was conducted to examine the consistency of the Aspen Plus model behavior relative to previously reported anaerobic digestion studies, rather than to provide direct experimental validation for septic tank sludge specifically.
Table 13. Anaerobic digestion of the system model validation.
The simulated biomethane yields showed close agreement with the reported literature values, with deviations ranging from 0.04% to 0.15%. However, these results are presented as benchmarking outcomes rather than direct experimental validation of predictive accuracy for a specific feedstock. Shen et al. [62] reported waste-activated sludge digestion with an experimental biomethane yield of 85.05%, while the Aspen Plus simulation yielded 84.97%, corresponding to a 0.04% difference. Similarly, de la Cruz-Azuara et al. [63] observed a biomethane yield of 78.36% for cow dung and waste-activated sludge, compared with a simulated value of 78.21% (0.15% deviation). In addition, Nauman et al. [64] reported an experimental biomethane value of 83.58% for biowaste digestion, while the model predicted 83.48%, giving a 0.10% difference.
These benchmarking results indicate that the Aspen Plus simulation framework can reproduce trends reported in anaerobic digestion studies across different organic substrates under comparable operating conditions. The agreement with literature data is attributed to the structured representation of key biochemical stages: hydrolysis, acidogenesis, acetogenesis, and methanogenesis within the modelling framework [33]. The use of a stoichiometric reactor for hydrolysis and a CSTR for downstream reactions supports a consistent representation of digestion pathways [65]. Furthermore, the observed low deviations (<0.2%) reflect consistency between the selected thermodynamic property package (NRTL) and reaction assumptions used in the simulation environment [66]. Overall, the results demonstrate good agreement with published studies and support the internal consistency of the Aspen Plus model within a comparative simulation context, rather than constituting direct experimental validation or predictive confirmation for septic tank sludge systems.
3.3. Numerical Optimization
3.3.1. Response Surface Methodology Central Composite Design
Table 14 shows the different factors used to run the experiment and their corresponding changes in response.
Table 14. Results of the design matrix range factors with their response.
|
Runs |
Htemperature (°C) |
Dtemperature (°C) |
HRT (Days) |
ORL (kg·VS·m−3·day−1) |
Bio-Methane Yield (Volume %) |
|---|---|---|---|---|---|
|
1 |
30 |
50 |
20 |
25 |
77.92 |
|
2 |
25 |
50 |
20 |
25 |
77.92 |
|
3 |
30 |
50 |
5 |
25 |
77.92 |
|
4 |
25 |
40 |
5 |
15 |
80.27 |
|
5 |
30 |
50 |
20 |
25 |
99.98 |
|
6 |
35 |
60 |
5 |
35 |
92.54 |
|
7 |
35 |
40 |
5 |
35 |
92.54 |
|
8 |
25 |
40 |
5 |
35 |
85.68 |
|
9 |
35 |
60 |
35 |
35 |
97.69 |
|
10 |
35 |
60 |
5 |
15 |
64.73 |
|
11 |
35 |
60 |
35 |
15 |
64.73 |
|
12 |
30 |
60 |
20 |
25 |
79.64 |
|
13 |
30 |
50 |
20 |
25 |
77.92 |
|
14 |
30 |
40 |
20 |
25 |
75.92 |
|
15 |
25 |
40 |
35 |
35 |
92.21 |
|
16 |
35 |
40 |
5 |
15 |
60.27 |
|
17 |
35 |
50 |
20 |
25 |
77.92 |
|
18 |
25 |
40 |
35 |
15 |
62.37 |
|
19 |
35 |
40 |
35 |
15 |
62.37 |
|
20 |
25 |
60 |
5 |
35 |
92.54 |
|
21 |
25 |
60 |
35 |
35 |
97.69 |
|
22 |
30 |
50 |
20 |
15 |
62.75 |
|
23 |
25 |
60 |
35 |
15 |
64.72 |
|
24 |
30 |
50 |
35 |
25 |
79.35 |
|
25 |
30 |
50 |
20 |
35 |
93.09 |
|
26 |
25 |
60 |
5 |
15 |
62.51 |
|
27 |
30 |
50 |
20 |
25 |
77.92 |
|
28 |
35 |
40 |
35 |
35 |
92.21 |
The results obtained from using different ranges of factors (hydrolysis reactor temperature, digester temperature, hydraulic retention time, and organic loading rate) under different experimental conditions are indicated in Table 14. According to the results of the RSM CCD experimental design, the independent variables indicate that the selected factors affect the yield of biomethane. Using the design matrix data given in Table 14, a mathematical model for the coded factors was developed from the Design Expert environment related to the independent variables (hydrolysis reactor temperature, digester temperature, hydraulic retention time, and organic loading rate) and the dependent variable, biomethane yield, as given in Equation (10).
|
$$\begin{aligned}\textit{Bio}-\textit{Methane yield}(\textit{Vol}.\%) &= +37.90 + 1.83B + 0.7150C + 15.08D - 0.2894AB - 0.5669AC + 0.2894AD \\&+ 0.4006BD + 0.6306CD + 0.2906ABC - 0.5681AB - 0.2906ACD \\&+ 0.3806BCD + 0.7169A^2C + 0.5681AB^2\end{aligned}$$ |
(10) |
The ANOVA findings for biomethane yield (Table 15) demonstrate that the quadratic model is highly significant, with a Model F-value of 506.37 and a corresponding p < 0.0001, indicating that the model explains a substantial portion of the variability in biomethane output. A very small probability (0.01%) of obtaining such a high F-value due to noise further supports the statistical significance of the model [67]. The model terms D (Organic Loading Rate), B (Digester Temperature), AC, CD, and ABD have statistically significant effects (p < 0.05), indicating that both individual factors and their interactions strongly influence biomethane yield. This is consistent with previous studies highlighting the critical roles of temperature and loading rate in anaerobic digestion performance [67]. The reported F-value of 822.85 (p < 0.0001), therefore, indicates strong model significance rather than full explanatory completeness. The model’s goodness-of-fit metrics are strong, with R2 = 0.9984, adjusted R2 = 0.9965, and predicted R2 = 0.9510. It also has a high Adequate Precision value of 68.47, indicating a strong signal-to-noise ratio. The low coefficient of variation (CV = 1.97%) and minimal standard deviation indicate good repeatability and reliability [68]. Overall, these findings demonstrate that the model accurately describes biomethane yield, with OLR and digester temperature emerging as important factors of system performance; however, the results obtained from this work were observed to be in line with the work of Pratap, et al. [69].
Table 15. Results of Analysis of Variance Bio-Methane Yield.
|
Source |
Sum of Squares |
Df |
Mean Square |
F-Value |
p-Value |
|
|---|---|---|---|---|---|---|
|
Model |
4220.47 |
15 |
281.36 |
506.37 |
<0.0001 |
Significant |
|
A-Htemp |
0.0000 |
1 |
0.0000 |
0.0000 |
1.0000 |
|
|
B-DTemp |
60.32 |
1 |
60.32 |
108.55 |
<0.0001 |
|
|
C-HRT |
1.02 |
1 |
1.02 |
1.84 |
0.1999 |
|
|
D-ORL |
4094.22 |
1 |
4094.22 |
7368.33 |
<0.0001 |
|
|
AB |
1.34 |
1 |
1.34 |
2.41 |
0.1464 |
|
|
AC |
5.14 |
1 |
5.14 |
9.25 |
0.0102 |
|
|
AD |
1.34 |
1 |
1.34 |
2.41 |
0.1464 |
|
|
BD |
2.57 |
1 |
2.57 |
4.62 |
0.0527 |
|
|
CD |
6.36 |
1 |
6.36 |
11.45 |
0.0054 |
|
|
ABC |
1.35 |
1 |
1.35 |
2.43 |
0.1448 |
|
|
ABD |
5.16 |
1 |
5.16 |
9.29 |
0.0101 |
|
|
ACD |
1.35 |
1 |
1.35 |
2.43 |
0.1448 |
|
|
BCD |
2.32 |
1 |
2.32 |
4.17 |
0.0637 |
|
|
A2C |
0.9136 |
1 |
0.9136 |
1.64 |
0.2240 |
|
|
AB2 |
0.5738 |
1 |
0.5738 |
1.03 |
0.3296 |
|
|
Residual |
6.67 |
12 |
0.5557 |
|||
|
Lack of Fit |
6.67 |
9 |
0.7406 |
822.85 |
<0.0001 |
Significant |
|
Pure Error |
0.0027 |
3 |
0.0009 |
|||
|
Cor Total |
4227.13 |
27 |
R2 = 0.9984; adjust R2 = 0.9965; Predicted R2 = 0.9510; Adequate precision = 68.4725; Std. Dev. = 0.7454; Mean = 37.90; C.V. % = 1.97.
3.3.2. Effect of Parameter Interaction on Bio-Methane Yield
The influence of the important operating parameters is critical for maximizing biomethane output in anaerobic digestion systems. While temperature, HRT, and OLR separately have an impact on microbial activity and substrate degradation, their combined impacts can provide synergistic results that greatly shape overall biomethane yield. Evaluating these interactions offers a better understanding of system behaviour, improves process stability, and aids in the establishment of optimal operational conditions for optimum methane recovery.
Figure 5 illustrates the individual effects of the independent variables on biomethane yield. As shown in Figure 5a, the hydrolysis reactor temperature (Htemp) shows minimal variation in biomethane production across 25–35 °C, with a maximum yield of 35.64 vol.%. This trend indicates that hydrolysis temperature has a relatively low influence on biomethane yield compared to other process variables [70].
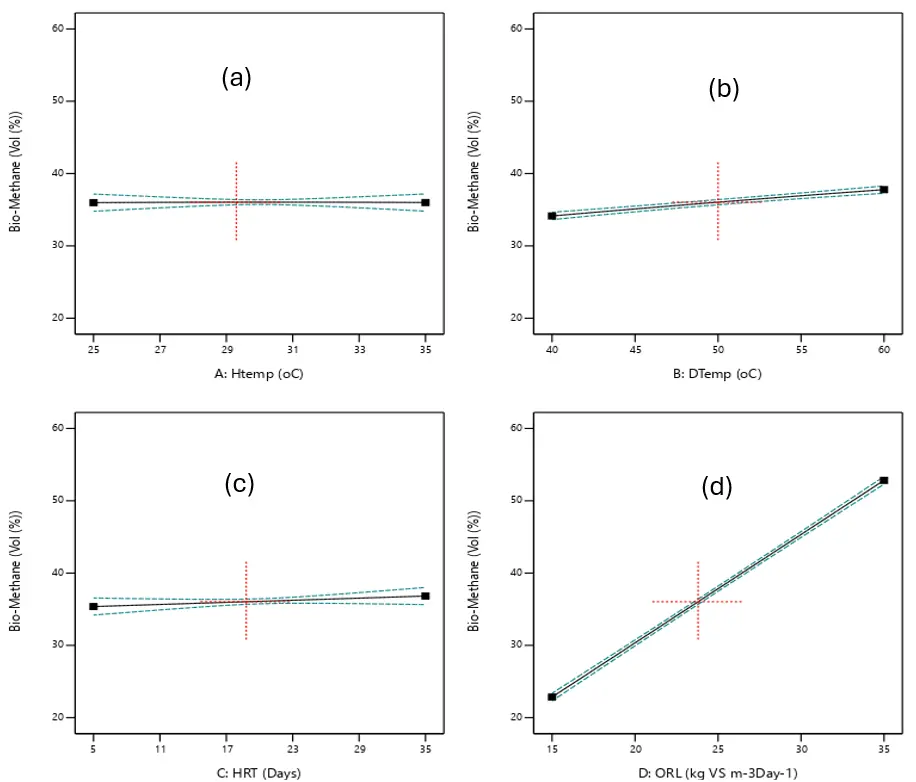
Figure 5. Biomethane yield on the Effect of parameter interactions. (a) Htemp, (b) Dtemp, (c) HRT and (d) OLR.
Figure 5b shows the effect of digester temperature on biomethane yield. The results indicate that biomethane production increases steadily as the digester temperature rises from 40 °C to 60 °C, reaching a maximum yield of 37.900 vol.%. This trend shows that digester temperatures have a greater influence on biomethane yield than hydrolysis temperature. Furthermore, the observed pattern aligns with previous studies by Khan et al. [71], which reported similar temperature-dependent enhancements in microbial activity and methane production efficiency. Similarly, Figure 5c illustrates the influence of HRT on biomethane yield. As HRT increases from 5 to 35 days, biomethane production rises gradually from 35.356 to 36.850 vol.%, indicating a modest but steady improvement. This behaviour is expected, as longer retention times allow for more complete substrate degradation and enhanced microbial conversion efficiency, thereby increasing methane generation [72]. However, the relatively slow rate of increase suggests that beyond a certain threshold, the benefits of extended HRT diminish as the system approaches its optimal digestion capacity.
Figure 5d illustrates the influence of the OLR on biomethane yield. The results show that OLR exerts a significant effect on biomethane production compared to the other operating parameters. As the OLR increases, the biomethane yield rises sharply, indicating enhanced substrate availability and microbial activity. The highest loading rate evaluated (35 kg·VS·m−3·day−1) produced the maximum biomethane yield of 52.796 vol.%, demonstrating that higher OLRs can substantially improve methane generation until the optimal threshold is reached. This trend is consistent with previous studies, which reported that increasing OLR enhances biogas productivity by supplying more biodegradable organic matter, up to the point where system overloading may occur [73].
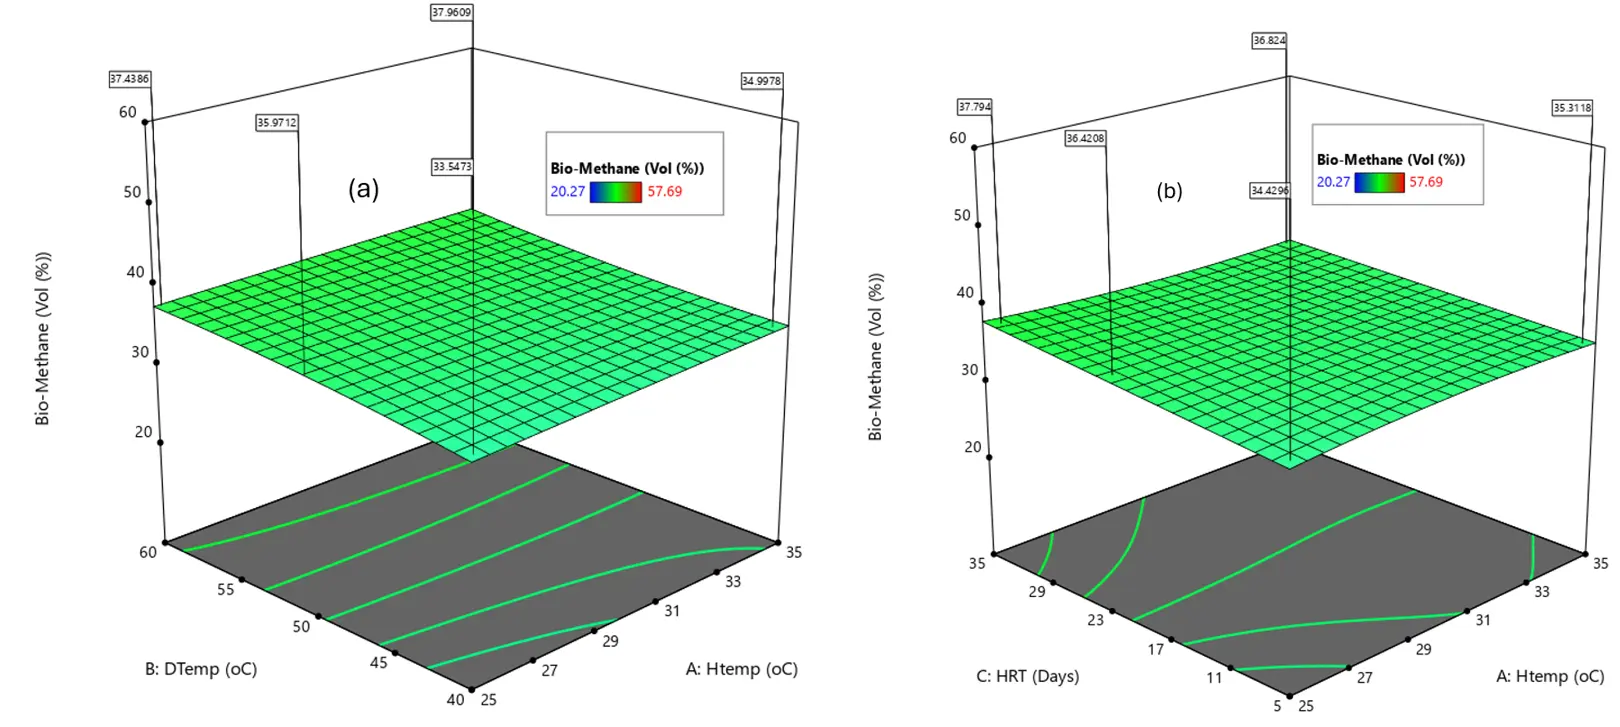
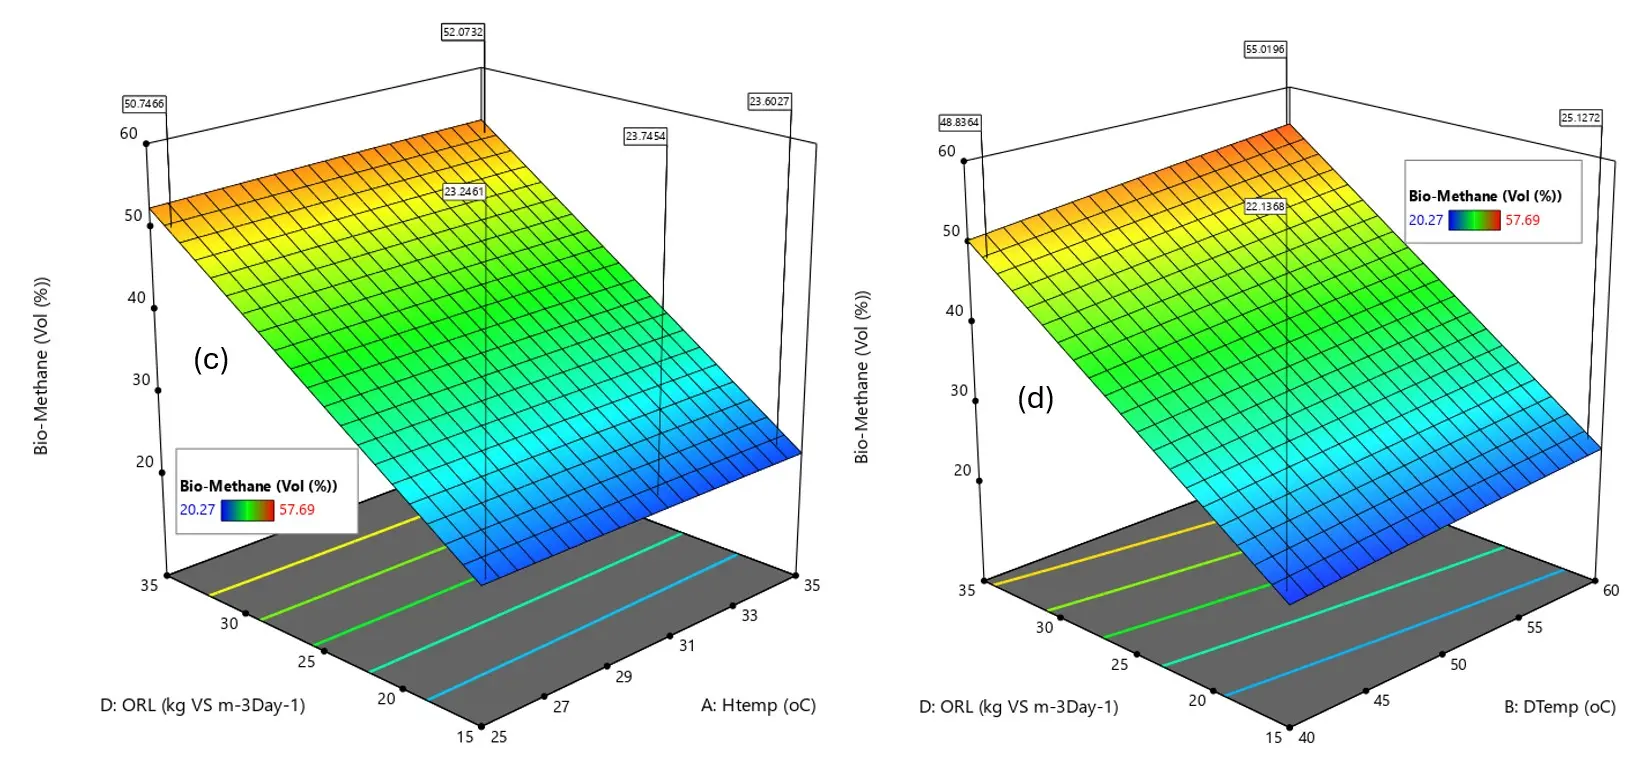
Figure 6 shows a 3D surface plot of the interactions between the hydrolysis reactor temperature and the digester reactor temperature (HRT and OLR) against biomethane yield.
Figure 6a illustrates the 3D surface response of biomethane yield as a function of hydrolysis reactor temperature (Htemp) and digester reactor temperature (Dtemp). As shown in the plot, increasing Htemp results in a marginal decline in biomethane yield, from 37.43 to 36.54 vol.%, suggesting that elevated hydrolysis temperatures may exert a slight inhibitory effect on upstream microbial hydrolysis. Conversely, increasing Dtemp yields a pronounced enhancement in methane production, with biomethane output rising from 36.96 to 39.59 vol.%. The optimal condition of 25 °C Htemp and 60 °C Dtemp produced the maximum biomethane yield (39.59 vol.%). These findings are consistent with the work of Casallas-Ojeda, et al. [74], who reported that a digester temperature of 60 °C produced the optimum biogas yield under similar operating conditions, demonstrating that methanogenic temperature rather than hydrolytic temperature is the dominant thermal parameter governing methane formation. This observation aligns with established thermophilic digestion studies that emphasize the sensitivity of methanogens to digester operational temperature [75].
Figure 6b further demonstrates the influence of HRT and hydrolysis reactor temperature on biomethane production. As depicted, increasing HRT results in a steady rise in methane yield from 37.17 to 39.67 vol.%. This may be due to the extended microbial contact time and the enhanced biodegradation efficiency associated with longer retention periods. A similar positive trend is observed with Htemp, which modestly increases biomethane yield from 37.16 to 38.64 vol.%. These parallel responses confirm that both parameters independently support improved hydrolysis and methanogenesis, consistent with anaerobic digestion kinetic theory, which associates prolonged retention and moderate thermal enhancement with improved substrate solubilization and methane conversion efficiency [76].
The interaction between OLR and hydrolysis temperature is presented in Figure 6c. A substantial rise in OLR from 15 to 35 kg·VS·m−3·day−1, leads to a sharp increase in biomethane yield from 26.69 to 51.61 vol.%, demonstrating the strong influence of substrate availability on methane productivity. Also, Yang et al., [77] reported the increase in ORL with the increase in biogas yield in the AD process. In contrast, Htemp exerts only a marginal effect within the same operating range, producing comparatively minor changes in methane output. This disparity indicates that, under the examined conditions, OLR is the primary determinant of methane yield, supporting the literature, which identifies feedstock loading as a critical performance driver in anaerobic digestion systems [78].
Figure 6d reinforces this conclusion by showing a steep increase in biomethane yield with rising OLR, achieving a maximum of 53.67 vol.% at 35 L−1·day−1. Meanwhile, an increase in Htemp results in a slight decrease in yield from 23.69 to 22.99 vol.%, suggesting that higher hydrolysis temperatures may negatively affect microbial stability. This behaviour is frequently reported in studies where excessive thermal input disrupts hydrolytic bacteria or shifts metabolic balance unfavourably [79].
Finally, Figure 6e presents the combined effects of OLR and HRT on biomethane production. OLR once again dominates the response, with biomethane yield rising sharply to a maximum of 56.65 vol.% at 35 kg·VS·m−3·day−1. Conversely, HRT exhibits a more gradual positive influence, with the maximum biomethane yield of 24.56 vol.% achieved at approximately 35 days. These results collectively show that although both parameters enhance methane production, OLR exerts a substantially stronger influence than HRT within the evaluated operational window [77]. Taken together, the results across all plots highlight that substrate loading, more than temperature or retention time, is the most influential parameter driving biomethane productivity across the evaluated process space.
 |
 |
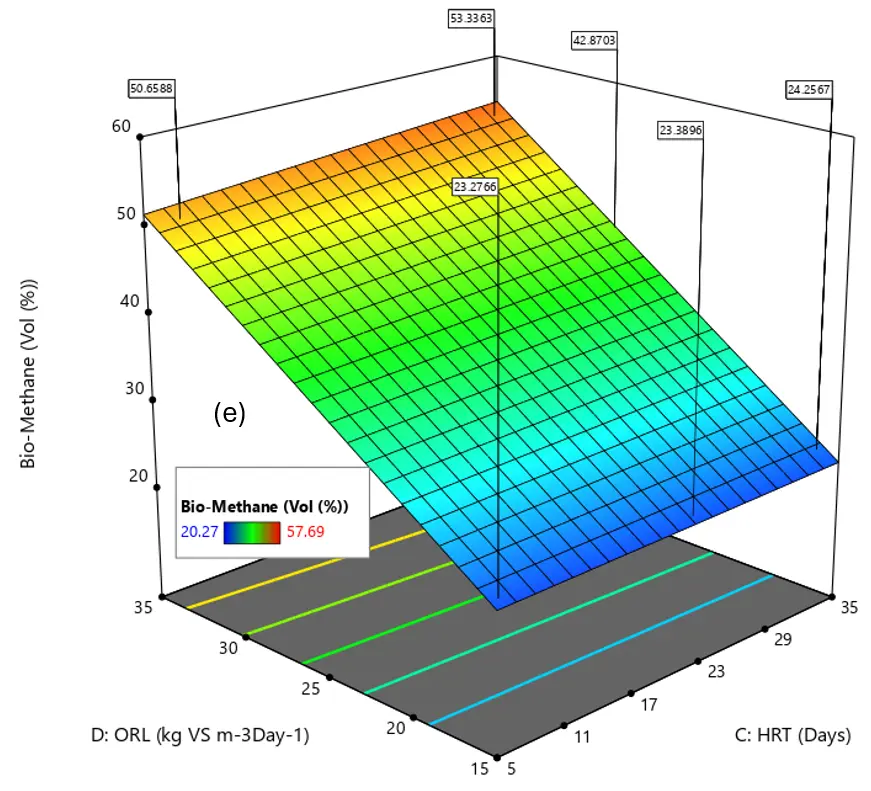 |
Figure 6. Effect of Biomethane yield on 3D surface plot on parameters interaction on (a) Dtemp and Htemp, (b) HRT and Dtemp, (c) ORL and Htemp, (d) ORL and Dtemp, and (e) ORL and HRT.
3.3.3. Performance Optimization Analysis
This section contains a detailed explanation and discussion of the optimization analysis results. Figure 7 presents the desirability of all the variables in the optimization process. Table 16 displays the optimization criteria for all aspects considered in connection with the responses. The CCD levels were used to calculate the lower and upper limit values for each independent variable.
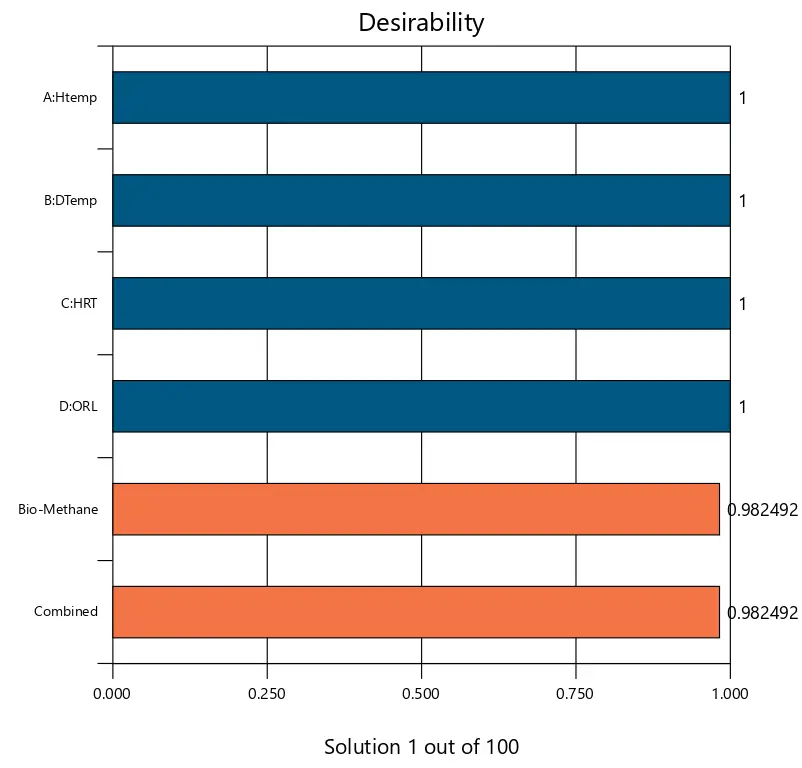
Figure 7. The bar graph depicts the individual desirability of all responses (R), which corresponds to the combined desirability (D).
Figure 7 presents the individual desirability function (di) for each response, along with the calculated combined desirability (D = 0.982492), which represents the overall desirability. The desirability function for the independent variables (Htemp, Dtemp, HRT, and ORL) was set to be unity (1) because they were within the specified ranges during the optimization. The obtained desirability function for the bio-methane yield is 0.982492.
Table 16 outlines the optimization criteria used for the bio-methane optimization, specifically the maximization goal of maximizing the optimal bio-methane yield. The hydrolysis reactor temperature (Htemp), the Digester reactor temperature (Dtemp), HRT, and OLR were set “ in range”, allowing the optimization algorithm to explore the full experimental domain defined by RSM-CCD. The approach is consistent with objective optimization practices. Where the independent variables are not fixed allowed to vary freely within the boundaries [68].
Table 16. Optimization of individual responses with lower and upper limits, with corresponding desirability.
|
Name |
Goal |
Lower Limit |
Upper Limit |
|---|---|---|---|
|
A: Htemp |
is in range |
25 |
35 |
|
B: DTemp |
is in range |
40 |
60 |
|
C: HRT |
is in range |
5 |
35 |
|
D: ORL |
is in range |
15 |
35 |
|
Bio-Methane |
Maximize |
20.27 |
57.69 |
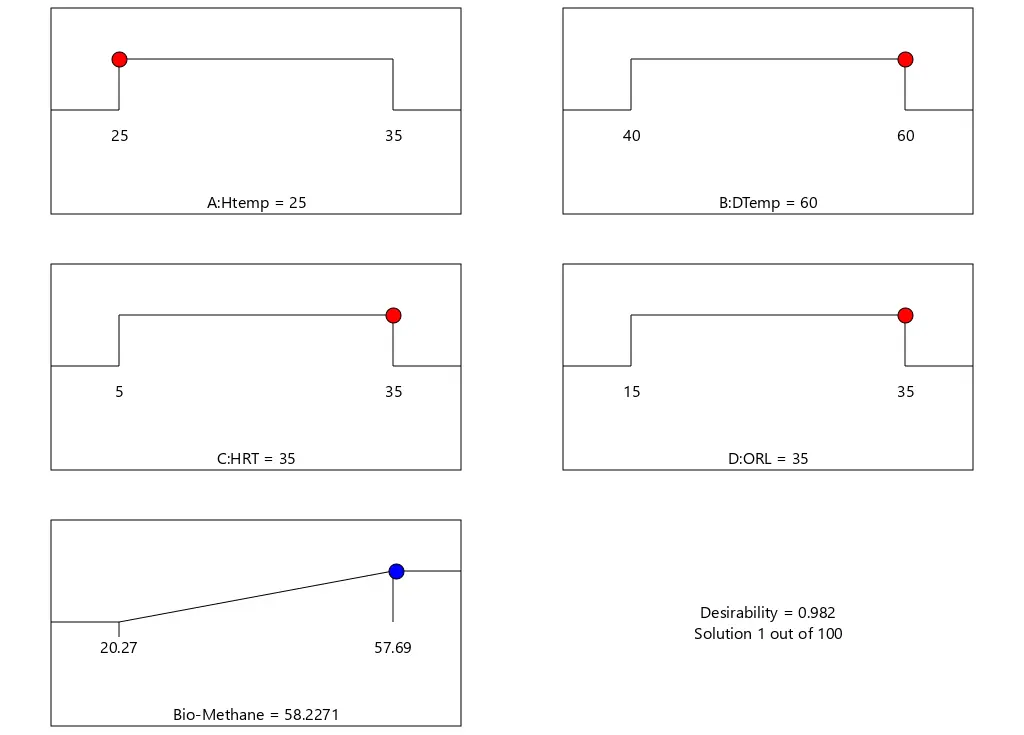
The RSM-CCD optimization results presented in Table 17 show a clustering of ten near-optimal solutions, all with desirability scores of 1.00. This indicates a stable and well-defined optimum region, suggesting that minor variations in the input factors do not significantly affect system performance. This stability supports the robustness of the RSM optimization model and is consistent with previous research indicating that elevated digester temperatures, combined with moderate hydrolysis conditions, improve microbial activity, substrate degradation, and methane formation efficiency [80]. The continuously high desirability values across trials further suggest that the selected multi-response optimization requirements were effectively met. This reinforces the RSM-based desirability method as a trustworthy technique for balancing methane productivity with operational characteristics according to Ahmad et al., [81]. Figure 8 confirms that the ideal biomethane production of 58.227 vol.% is attained at a hydrolysis temperature of 25 °C, digester temperature of 60 °C, HRT of 35 days, and an OLR of 35 kg·VS·m−3·day−1, with a maximum desirability value of 1.000. Overall, Table 17 and Figure 8 validate the optimized process conditions, highlighting the strong influence of digester temperature and OLR on biomethane yield and confirming the predictive accuracy of the developed model.
Table 17. Response surface methodology CCD optimization of biomethane.
|
SNo |
Htemp (°C) |
Dtemp (°C) |
HRT (Days) |
ORL (kg·VS·m−3·day−1) |
Bio-Methane Yield (Vol.%) |
Desirability |
|
|---|---|---|---|---|---|---|---|
|
1 |
25.000 |
60.000 |
35.000 |
35.000 |
58.227 |
1.000 |
Selected |
|
2 |
25.000 |
59.901 |
35.000 |
35.000 |
58.206 |
1.000 |
|
|
3 |
25.113 |
60.000 |
35.000 |
34.980 |
58.148 |
1.000 |
|
|
4 |
25.001 |
59.568 |
35.000 |
35.000 |
58.137 |
1.000 |
|
|
5 |
25.212 |
60.000 |
35.000 |
34.991 |
58.128 |
1.000 |
|
|
6 |
25.000 |
59.683 |
34.842 |
35.000 |
58.130 |
1.000 |
|
|
7 |
25.000 |
59.999 |
34.376 |
35.000 |
58.102 |
1.000 |
|
|
8 |
25.000 |
59.163 |
35.000 |
34.995 |
58.044 |
1.000 |
|
|
9 |
25.035 |
58.911 |
34.974 |
35.000 |
57.979 |
1.000 |
|
|
10 |
25.000 |
59.878 |
33.801 |
35.000 |
57.962 |
1.000 |
3.4. Techno-Economic Analysis
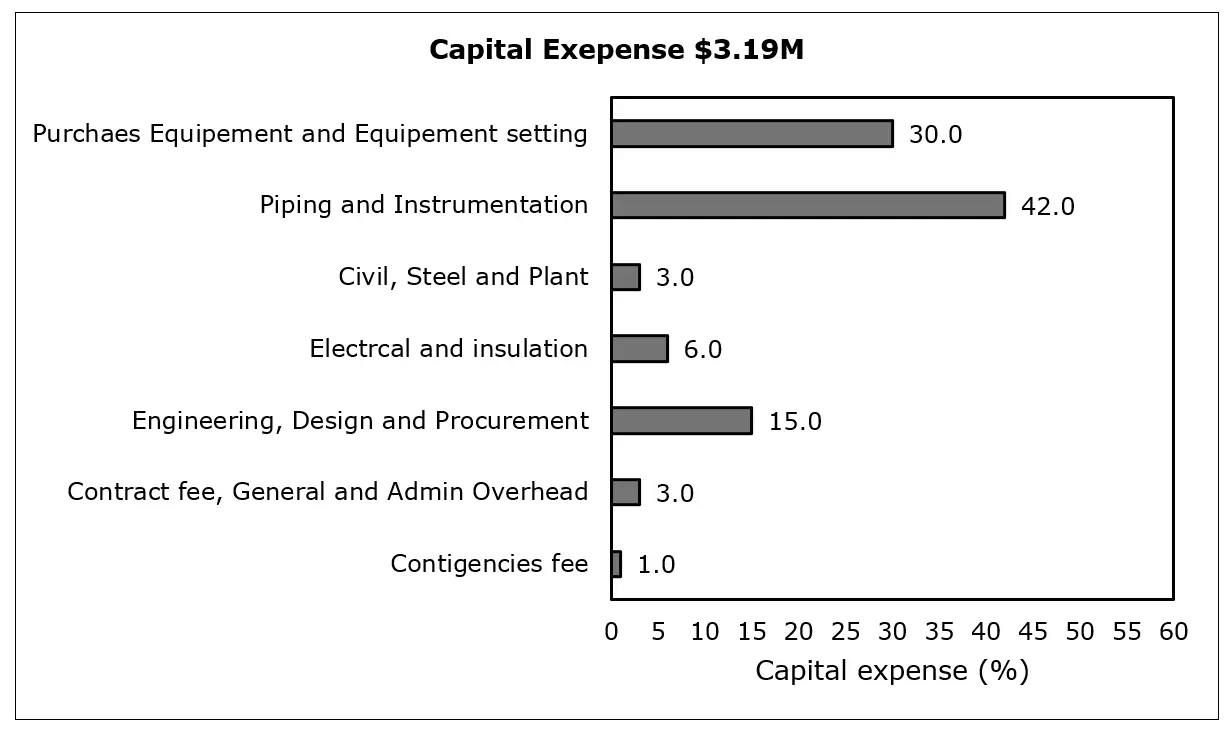
The capital operating expense (CAPEX) distribution for the anaerobic digestion system (Figure 9) demonstrated that piping and instrumentation (42%) and equipment procurement and installation (30%) were the most expensive components, accounting for more than 70% of the total investment. These figures are consistent with the findings of Mahmod et al., [82], who discovered that mechanical and process integration expenses dominate bioenergy plant expenditures. Engineering, design, and procurement each contributed 15%, with electrical and insulation, civil and structural works, and administrative overheads accounting for 6%, 3%, and 3%, respectively. A contingency cost of no more than 1% demonstrates sound design planning and project management [83]. Overall, the cost structure shows that capital-intensive components, particularly mechanical systems and process control, drive total investment, emphasizing the importance of efficient design, automation, and integration for improving operational reliability and economic sustainability Ghafoori et al., [84].
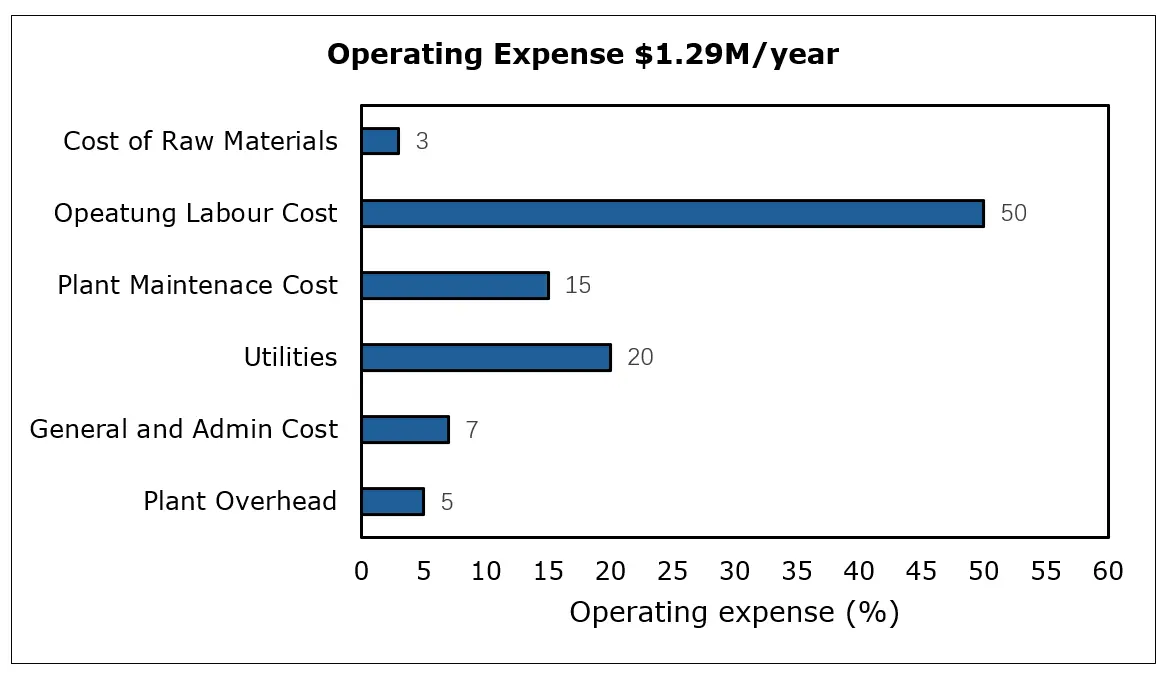
The annual operating expense (OPEX) distribution (Figure 10) shows that operating labour cost (50%) is the highest expenditure, representing the manpower necessary for constant monitoring, feed handling, and system management. This observation is consistent with Khan et al., [85], who identified labour as a major cost element in medium-scale AD operations. Utilities (20%) are the second-highest cost component, owing to energy consumption for heating and mixing during thermophilic digestion [86]. Plant maintenance accounted for 15%, guaranteeing operational reliability through routine inspections and equipment servicing. Meanwhile, administrative costs (7%), plant overheads (5%), and raw material costs (3%) all remain very cheap because septic waste is a readily available feedstock. With three operators and one supervisor per shift earning average wages of USD 1.5/h and USD 2.2/h, respectively, the total annual operating cost is estimated at USD $1.29 million. Overall, labour and energy optimization via automation and process integration has the potential to significantly improve the system’s economic performance and long-term sustainability [87].
The economic analysis was carried out using APEA® version 14.1, with data received from the simulation outputs. The prices of important process streams, such as septic tank sludge, digestate, biomethane, light gas products, potable water, cooling water, and power, were determined using vendor quotations. To guarantee consistency, the overall cost estimate was compared to the results of the system’s mass and energy balances. Utility demands were calculated from the energy study, and costs were estimated using first-quarter 2024 market prices. The proposed biomethane production plant’s total capital investment (TCI) was estimated at USD $3.19 million, including expenses for equipment purchase and installation, piping and instrumentation, engineering and procurement, electrical and insulation works, civil and steel structures, and contingencies. As shown in Figure 6, piping and instrumentation accounted for much of the total investment (42%), followed by equipment purchase and installation (30%) and engineering, design, and procurement (15%), indicating that infrastructure and system integration are the most expensive aspects of the project.
The revenue generation primarily stems from the sale of biomethane, clean fuel gas, and digested material, accounting for approximately 88% of total income. This highlights the economic importance of maximizing methane recovery and energy conversion efficiency. Comparable trends reported by Teghammar et al., [88] confirm that labour and utility costs are dominant operating expenses in biogas systems, while biomethane and power sales are the key profitability drivers. Overall, the cost structure demonstrates a financially viable and labour-intensive process with strong potential for sustainable energy recovery and economic return.
In addition, the economic performance is influenced by regional conditions such as energy pricing, labour costs, sludge collection logistics, and financing structures. These factors may vary significantly across different locations, thereby affecting both operating costs and revenue stability. Consequently, while the present results indicate strong economic feasibility under the base-case scenario, regional adaptation of key economic parameters is necessary to accurately assess the scalability and transferability of the proposed system to other cities or countries
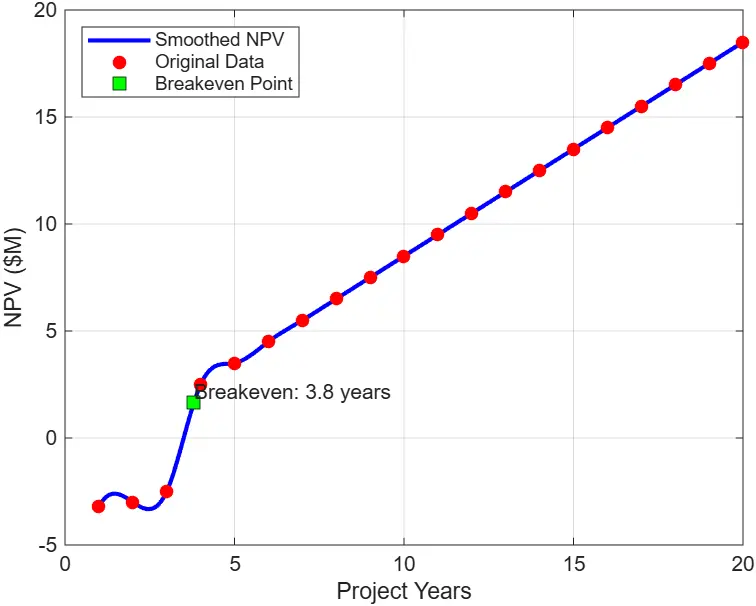
The NPV analysis over a 20-year project horizon (Figure 11) shows an initial decline in the first two years, primarily due to capital investments and start-up costs [89]. The project attains its breakeven point (NPV = 0) at approximately 3.8 years, corresponding to the DPP, after which the positive cash flows indicate sustained profitability [90]. The PI, calculated as the ratio of the present value of cumulative cash inflows to cumulative cash outflows, was determined to be 4.36, reflecting robust financial performance. Furthermore, the IRR was estimated at 16.6%, exceeding the assumed discount rate and confirming the project’s economic viability and attractiveness for investment [90]. Recent literature on anaerobic digestion and biomethane production systems has reported payback periods ranging from approximately 3 to 10 years and IRR values typically between 10% and 30%, depending on feedstock type, scale, and market conditions [82,91]. Within this context, the results obtained in this study (DPP = 3.8 years; IRR = 16.6%; NPV $4.64 M) fall within the lower-to-mid range of reported values, indicating competitive economic performance for waste-to-energy biomethane systems and reinforcing the viability of the proposed process.
Economic Sensitivity Analysis
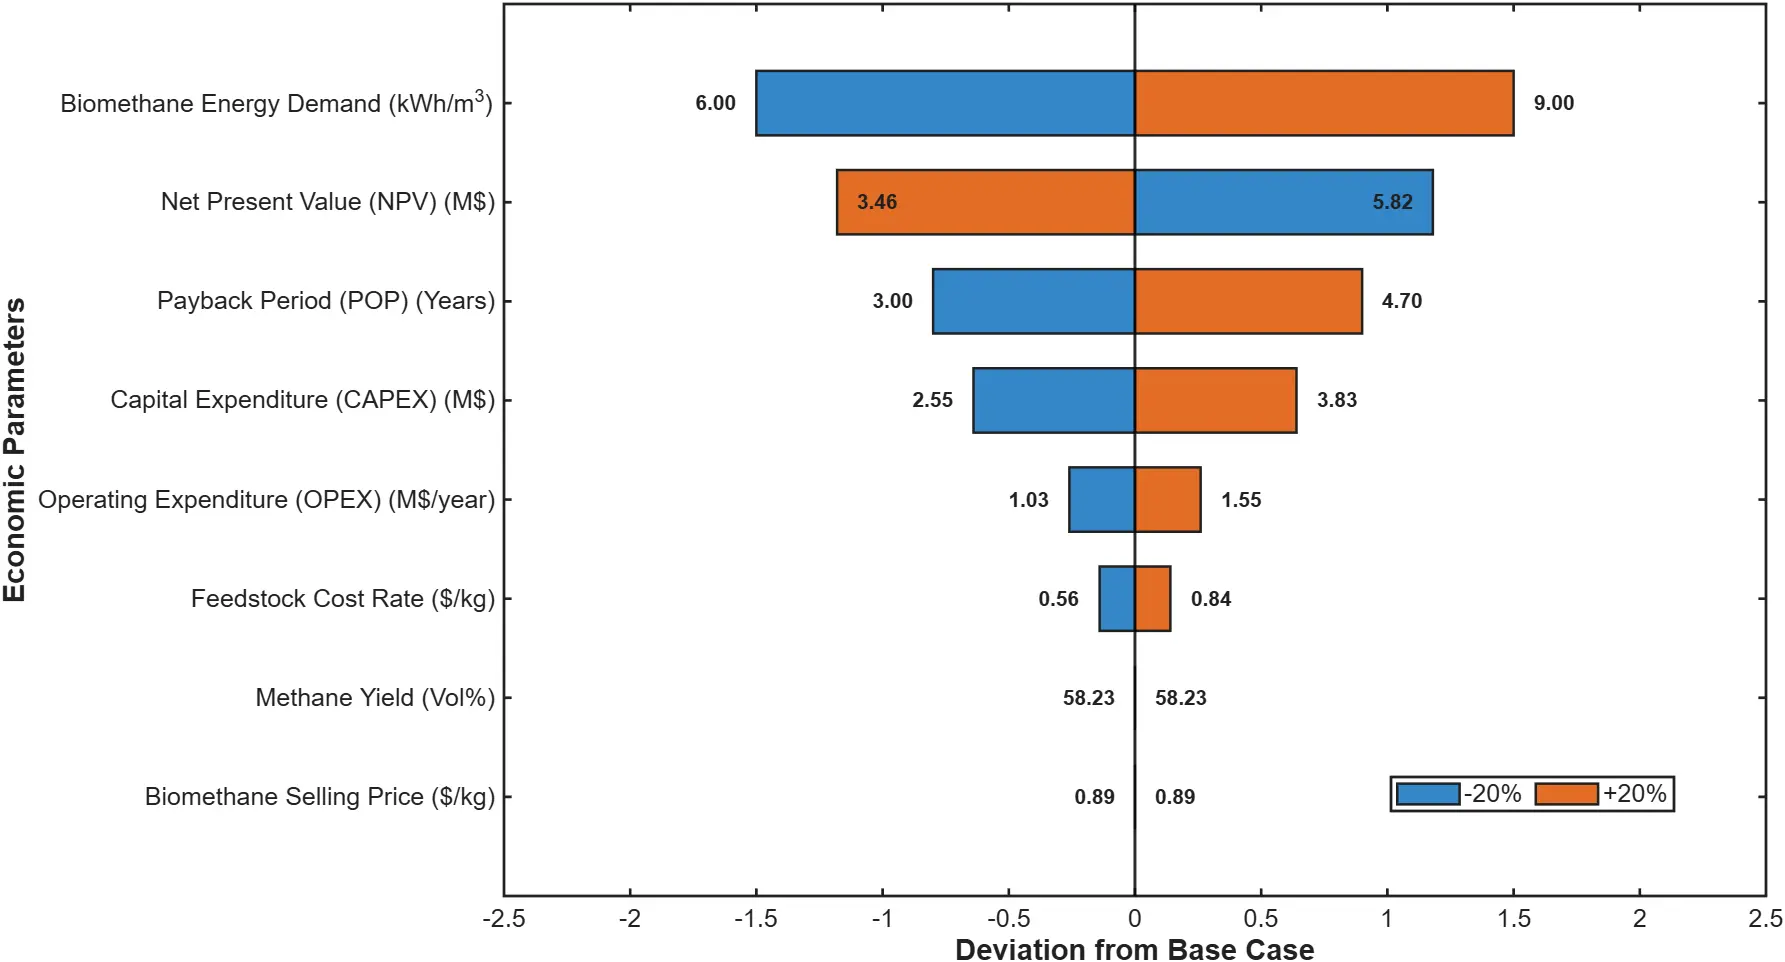
The sensitivity analysis in Figure 12 presents the impact of key economic parameters on the financial performance of the proposed biomethane production system. The findings demonstrate that changes in CAPEX, OPEX, feedstock cost rate, and biomethane upgrading energy demand substantially influence the economic viability of the process. Comparable results have been documented in recent techno-economic assessments of anaerobic digestion and renewable natural gas systems, which identified investment and operational costs as primary determinants of project feasibility [92,93]. A 20% reduction in CAPEX and OPEX enhanced the system’s economic performance, raising the NPV from 4.64 to 5.82 million USD and shortening the POP from 3.8 to 3.0 years. Conversely, a 20% increase in these costs lowered the NPV to 3.46 million USD and extended the payback period to 4.7 years. These results underscore the project’s strong sensitivity to capital-intensive infrastructure and operational expenses, aligning with findings from previous biomethane feasibility studies [94]. The feedstock cost rate further affected overall economic performance, emphasizing the necessity of reliable sludge collection and transportation systems for sustainable plant operation. Additionally, biomethane upgrading energy demand ranged from 6.0 to 9.0 kWh/m3 across 20% scenarios, indicating that increased upgrading energy requirements reduce profitability due to higher utility costs. Comparable findings have been reported for upgrading technologies such as membrane separation and pressure swing adsorption, where energy consumption constitutes a significant portion of total operating expenditure [95,96]. Despite these variations, methane yield and the selling price of biomethane remained constant, indicating that the observed economic fluctuations were primarily attributable to process and energy-related costs rather than product quality or market value. Overall, the sensitivity analysis confirms that the proposed anaerobic digestion system remains economically feasible within the evaluated uncertainty range and highlights the importance of cost optimization and energy-efficient upgrading strategies to enhance financial performance.
3.5. Environmental Implications
The environmental performance indicators in Figure 13 highlight the sustainability potential of the proposed anaerobic digestion system for biomethane recovery from septic tank sludge. Under optimized operating conditions, biomethane production increased from 46.37 to 58.227 vol.%, indicating greater methane-generation efficiency and improved substrate conversion. Comparable enhancements in methane yield under optimized digestion conditions have been documented in recent studies [97,98]. Methane recovery efficiency increased from 90% in the base-case scenario to 98.7% under optimized conditions, demonstrating more effective utilization of biodegradable organic matter and reduced methane losses. Improved methane recovery plays a critical role in minimizing uncontrolled greenhouse gas emissions from sludge management systems and in enhancing the efficiency of renewable energy recovery [99]. The optimized system achieved a CO2 emission reduction potential of 0.49 kg CO2-eq per kg CH4, underscoring the environmental benefits of renewable biomethane production and the displacement of fossil-derived natural gas. Recent studies have also shown that biomethane systems can substantially contribute to greenhouse gas mitigation and the decarbonization of the energy sector through waste-to-energy conversion pathways [100,101]. The fossil natural gas displacement factor remained constant at unity, indicating that the upgraded biomethane can directly replace conventional natural gas on an equivalent energy basis. Overall, the net greenhouse gas (GHG) reduction potential increased from moderate to high under optimized conditions, confirming the environmental sustainability and carbon reduction capacity of the proposed biomethane production system.
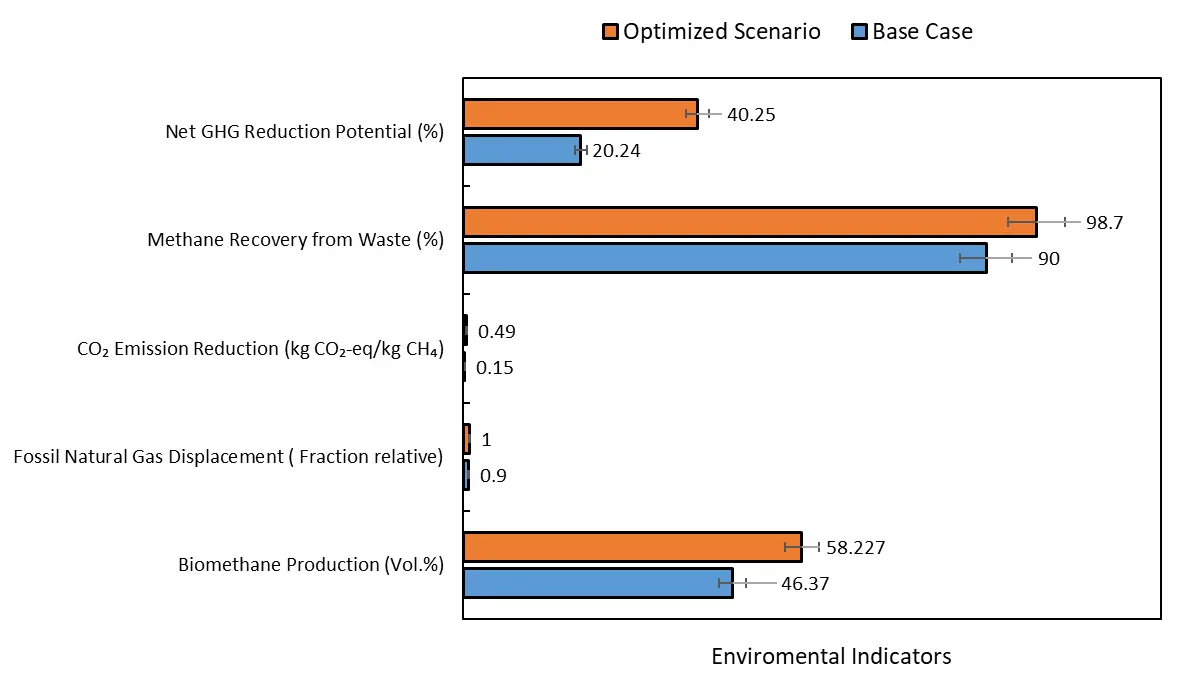
4. Conclusions
This study shows that anaerobic digestion of septic tank sludge is a technically and economically viable method for producing sustainable biomethane. The Aspen Plus®-based process design and simulation effectively modelled the conversion of septic sludge characterized by 33.80 wt.% carbon, 5.86 wt.% hydrogen, and 34.86 wt.% volatile matter into high-quality biomethane. Model validation against three separate experimental datasets revealed excellent agreement, with percentage variations less than 1%, demonstrating the accuracy of the constructed process model. Using RSM-CCD, the optimal operating conditions were found to be 35 °C for hydrolysis, 60 °C for the digester, 35 days for hydraulic retention, and 37.91 kg·VS·m−3·day−1, for organic loading, resulting in a maximum biomethane yield of 58.227 vol.%. The techno-economic study utilizing the APEA® confirmed the process’s financial viability, with a total capital investment of USD 3.19 million, an annual operating cost of USD 1.29 million, and a payback period of roughly 3.8 years. The optimized system had a net energy gain of 82.6%, an NPV of $4.64 M with an IRR of 16.6%, indicating its outstanding economic performance. Sensitivity analysis further showed that CAPEX, OPEX, feedstock cost, and upgrading energy demand significantly influence economic performance, highlighting the importance of cost optimization and energy-efficient upgrading strategies. In addition, the optimized system achieved improved methane recovery efficiency (98.7%), enhanced biomethane production, and a CO2 emission reduction potential of 0.49 kg CO2-eq/kg CH4, demonstrating substantial greenhouse gas mitigation and fossil natural gas displacement potential. Overall, the results confirm that septic tank sludge valorisation through anaerobic digestion is not only a sustainable and efficient waste-to-energy solution, but also a key enabler for decentralised wastewater management, renewable energy generation, and the advancement of circular economy goals in developing countries.
Statement of the Use of Generative AI and AI-Assisted Technologies in the Writing Process
The authors acknowledge the use of digital tools, Aspen Plus and Design Expert Software as well as ChatGPT (OpenAI) and Grammarly, to enhance the clarity, grammar, and readability of this manuscript. All contents generated with these tools were critically reviewed, verified, and edited by the authors to ensure accuracy, originality and compliance with the journal standard. The authors take full responsibility for the final version of the manuscript.
Acknowledgments
The authors gratefully acknowledge the Green Engineering Research Group for providing the essential simulation tools and technical support required for this study.
Author Contributions
A.M.I. and E.K.T.: Conceptualization, methodology, formal analysis, writing original draft. E.K.T., U.M.A. and S.R.: supervision, resources. M.A.A., U.S.I., M.I and A.Y.M.: writing—review and editing, project administration. A.M.I., E.K.T., V.O.F., M.I. and S.R.: writing—review and editing, validation. All authors have read and agreed to the published version of the manuscript.
Ethics Statement
Not applicable.
Informed Consent Statement
Not applicable.
Data Availability Statement
Data will be available on request.
Funding
This research received no external funding.
Declaration of Competing Interest
The authors declare that they have no known competing financial interests or personal relationships that could have appeared to influence the work reported in this paper.
References
- Olabi AG, Abdelkareem MA. Renewable energy and climate change. Renew. Sustain. Energy Rev. 2022, 158, 112111. DOI:10.1016/j.rser.2022.112111 [Google Scholar]
- Kandpal V, Jaswal A, Santibanez Gonzalez EDR, Agarwal N. Challenges and Opportunities for Sustainable Energy Transition and Circular Economy. In Sustainable Energy Transition: Circular Economy and Sustainable Financing for Environmental, Social and Governance (ESG) Practices; Springer: Cham, Switzerland, 2024; pp. 307–324. DOI:10.1007/978-3-031-52943-6_11 [Google Scholar]
- Li X, Wang Z, He Y, Wang Y, Wang S, Zheng Z, et al. A Comprehensive Review of the Strategies to Improve Anaerobic Digestion: Their Mechanism and Digestion Performance. Methane 2024, 3, 227–256. DOI:10.3390/methane3020014 [Google Scholar]
- Marconi P, Rosa L. Role of biomethane to offset natural gas. Renew. Sustain. Energy Rev. 2023, 187, 113697. DOI:10.1016/j.rser.2023.113697 [Google Scholar]
- Magro AD, Lovarelli D, Bacenetti J, Guarino M. The potential of insect frass for sustainable biogas and biomethane production: A review. Bioresour. Technol. 2024, 412, 131384. DOI:10.1016/j.biortech.2024.131384 [Google Scholar]
- Shekhar Bose R, Zakaria BS, Kumar Tiwari M, Ranjan Dhar B. High-rate blackwater anaerobic digestion under septic tank conditions with the amendment of biosolids-derived biochar synthesized at different temperatures. Bioresour. Technol. 2021, 331, 125052. DOI:10.1016/j.biortech.2021.125052 [Google Scholar]
- Capodaglio AG. Biorefinery of Sewage Sludge: Overview of Possible Value-Added Products and Applicable Process Technologies. Water 2023, 15, 1195. DOI:10.3390/w15061195 [Google Scholar]
- Pratap V, Kumar S, Yadav BR. Sewage sludge management and enhanced energy recovery using anaerobic digestion: An insight. Water Sci. Technol. 2024, 90, 696–720. DOI:10.2166/wst.2024.269 [Google Scholar]
- Zhou Y, Liu Y, Qiao Y, Li B, Chen H, Lv W. Unlocking the potential: Sustainable land use of urban septic tank slurry as granules with emphasis on soil improvement and safety consideration. J. Environ. Chem. Eng. 2024, 12, 113227. DOI:10.1016/j.jece.2024.113227 [Google Scholar]
- Chandana N, Rao B. A critical review on sludge management from onsite sanitation systems: A knowledge to be revised in the current situation. Environ. Res. 2022, 203, 111812. DOI:10.1016/j.envres.2021.111812 [Google Scholar]
- Mo R, Guo W, Batstone D, Makinia J, Li Y. Modifications to the anaerobic digestion model no. 1 (ADM1) for enhanced understanding and application of the anaerobic treatment processes—A comprehensive review. Water Res. 2023, 244, 120504. DOI:10.1016/j.watres.2023.120504 [Google Scholar]
- Piadeh F, Offie I, Behzadian K, Rizzuto JP, Bywater A, Córdoba-Pachón JR, et al. A critical review for the impact of anaerobic digestion on the sustainable development goals. J. Environ. Manag. 2024, 349, 119458. DOI:10.1016/j.jenvman.2023.119458 [Google Scholar]
- Long S, Yang J, Hao Z, Shi Z, Liu X, Xu Q, et al. Multiple roles of humic substances in anaerobic digestion systems: A review. J. Clean. Prod. 2023, 418, 138066. DOI:10.1016/j.jclepro.2023.138066 [Google Scholar]
- Paranjpe A, Saxena S, Jain P. A Review on Performance Improvement of Anaerobic Digestion Using Co-Digestion of Food Waste and Sewage Sludge. J. Environ. Manag. 2023, 338, 117733. DOI:10.1016/j.jenvman.2023.117733 [Google Scholar]
- Ojo OM. Anaerobic Digestion for Wastewater Treatment: A Review of Principles, Processes and Performance. NIPES-J. Energy Technol. Environ. 2025, 7, 52–60. DOI:10.5281/zenodo.15015847 [Google Scholar]
- ASTM D2216-19; Standard Test Methods for Laboratory Determination of Water (Moisture) Content of Soil and Rock by Mass. Annual Book of ASTM Standards; ASTM International: West Conshohocken, PA, USA, 2010. [Google Scholar]
- Zhang W, Xu Y, Dong B, Dai X. Characterizing the sludge moisture distribution during anaerobic digestion process through various approaches. Sci. Total Environ. 2019, 675, 184–191. DOI:10.1016/j.scitotenv.2019.04.095 [Google Scholar]
- Raveendravarrier B, Palatel A, Chandrasekharan M. Physico-chemical Characterization of sewage sludge for thermochemical conversion processes. Energy Sources Part A Recovery Util. Environ. Eff. 2025, 47, 2641–2665. DOI:10.1080/15567036.2020.1841858 [Google Scholar]
- Septiariva IY, Suryawan IWK, Zahra NL, Putri YNK, Sarwono A, Qonitan FD, et al. Characterization Sludge from Drying Area and Sludge Drying Bed in Sludge Treatment Plant Surabaya City for Waste to Energy Approach. J. Ecol. Eng. 2022, 23, 268–275. DOI:10.12911/22998993/150061 [Google Scholar]
- Kunh SS, Tavares MHF, da Silva EA, de Oliveira RS, Bittencourt PRS, Damaceno FM, et al. Briquette production from a mixture of biomass: Poultry slaughterhouse sludge and sawdust. Environ. Sci. Pollut. Res. 2022, 29, 64192–64204. DOI:10.1007/s11356-022-20218-w [Google Scholar]
- Gajewska T, Malinowski M, Szkoda M. The Use of Biodrying to Prevent Self-Heating of Alternative Fuel. Materials 2019, 12, 3039. DOI:10.3390/ma12183039 [Google Scholar]
- Liu K. Effects of sample size, dry ashing temperature and duration on determination of ash content in algae and other biomass. Algal Res. 2019, 40, 101486. DOI:10.1016/j.algal.2019.101486 [Google Scholar]
- Baffoe EE, Otoo SL, Kareem S, Dankwah JR. Evaluation of initial pH and urea hydrogen peroxide (UHP) co-pretreatment on waste-activated sludge. Environ. Res. 2024, 246, 118155. DOI:10.1016/j.envres.2024.118155 [Google Scholar]
- Wu R, Shen R, Liang Z, Zheng S, Yang Y, Lu Q, et al. Improve Niche Colonization and Microbial Interactions for Organohalide-Respiring-Bacteria-Mediated Remediation of Chloroethene-Contaminated Sites. Environ. Sci. Technol. 2023, 57, 17338–17352. DOI:10.1021/acs.est.3c05932 [Google Scholar]
- Miao H, Wang S, Zhao M, Huang Z, Ren H, Yan Q, et al. Codigestion of Taihu blue algae with swine manure for biogas production. Energy Convers. Manag. 2014, 77, 643–649. DOI:10.1016/j.enconman.2013.10.025 [Google Scholar]
- Vale GB, Scalize PS, Tonetti AL, Ruggeri Junior HC. Cost-effectiveness study of septic tank management in rural communities. Int. J. Environ. Sci. Technol. 2024, 21, 4599–4610. DOI:10.1007/s13762-023-05299-5 [Google Scholar]
- Maqbool W, Biller P, Anastasakis K. A kinetic process model for sewage sludge hydrothermal liquefaction in Aspen Plus: Model validation with pilot-plant data and scale up. Energy Convers. Manag. 2024, 302, 118136. DOI:10.1016/j.enconman.2024.118136 [Google Scholar]
- Ajala OO, Odejobi OJ. Modelling, simulation and optimization of domestic and agricultural wastes-based anaerobic digestion using Aspen Plus. Biomass Conv. Bioref. 2025, 15, 2817–2833. DOI:10.1007/s13399-023-05128-2 [Google Scholar]
- Inuwa AM, Oluwafemi Fatokun V, Kweinor Tetteh E, Rathilal S, Aliyu UM. Energy Recovery and Techno-Economic Analysis of Hydrothermal Carbonization and Anaerobic Digestion of Food Waste. Clean Technol. 2026, 8, 57 DOI:10.3390/cleantechnol8020057 [Google Scholar]
- Ochieng R, Gebremedhin A, Sarker S. A comparative assessment of sewage sludge valorization via anaerobic digestion and supercritical water gasification: A techno-economic case study in Norway. J. Water Process Eng. 2024, 66, 106016. DOI:10.1016/j.jwpe.2024.106016 [Google Scholar]
- Jana AK. Process Simulation and Control Using ASPEN; PHI Learning Pvt. Ltd.: New Delhi, India, 2012. [Google Scholar]
- Ras M, Lardon L, Bruno S, Bernet N, Steyer JP. Experimental study on a coupled process of production and anaerobic digestion of Chlorella vulgaris. Bioresour. Technol. 2011, 102, 200–206. DOI:10.1016/j.biortech.2010.06.146 [Google Scholar]
- Inayat A, Raza M, Ghenai C, Shanableh A, Said Z, Samman S, et al. Simulation of Anaerobic Co-Digestion Process for the Biogas Production using ASPEN PLUS. In Proceedings of the 2019 Advances in Science and Engineering Technology International Conferences (ASET), Dubai, United Arab Emirates, 26 March–10 April 2019; pp. 1–5. DOI:10.1109/ICASET.2019.8714403 [Google Scholar]
- Anaya Menacho W, Mazid AM, Das N. Modelling and analysis for biogas production process simulation of food waste using Aspen Plus. Fuel 2022, 309, 122058. DOI:10.1016/j.fuel.2021.122058 [Google Scholar]
- Ugwu SN, Enweremadu CC. Optimization of iron-enhanced anaerobic digestion of agro-wastes for biomethane production and phosphate release. Environ. Technol. 2023, 44, 721–738. DOI:10.1080/09593330.2022.2061379 [Google Scholar]
- Melas GA, Habtu NG, Worku AK, Getahun E. Recent Progresses and Future Perspective of Biogas-Upgrading Techniques. Bioenerg. Res. 2025, 18, 80. DOI:10.1007/s12155-025-10875-3 [Google Scholar]
- Karimi M, Siqueira RM, Shirzad M, Ferreira AFP, Rodrigues AE, Silva JAC. Integrated experimental, process simulation, and techno-economic assessment of biogas upgrading via pressure/vacuum swing adsorption. Sep. Purif. Technol. 2026, 386, 136571. DOI:10.1016/j.seppur.2025.136571 [Google Scholar]
- Hurtig O, Buffi M, Besseau R, Scarlat N, Carbone C, Agostini A. Mitigating biomethane losses in European biogas plants: A techno-economic assessment. Renew. Sustain. Energy Rev. 2025, 210, 115187. DOI:10.1016/j.rser.2024.115187 [Google Scholar]
- Díaz-Herrera PR, Vega E, Villanueva-Estrada RE, Rocha-Miller R. Techno-economic analysis of solvent-based biogas upgrading technologies for vehicular biomethane production: A case study in Prados de la Montaña landfill, Mexico City. Sustain. Energy Technol. Assess. 2023, 60, 103542. DOI:10.1016/j.seta.2023.103542 [Google Scholar]
- Sun X, Liu T, Zhai Y, Zhang Y, Shi H. The Impact of Fossil Energy Prices on Carbon Emissions: The Dual Mediation of Energy Efficiency and Renewable Energy. Energies 2025, 18, 6186. DOI:10.3390/en18236186 [Google Scholar]
- Fikru MG, Belaïd F, Ma H. Carbon capture and renewable energy policies: Could policy harmonization be a puzzle piece to solve the electricity crisis? Energy Econ. 2024, 136, 107753. DOI:10.1016/j.eneco.2024.107753 [Google Scholar]
- Chowdhury TH. Technical-economical analysis of anaerobic digestion process to produce clean energy. Energy Rep. 2021, 7, 247–253. DOI:10.1016/j.egyr.2020.12.024 [Google Scholar]
- Richardson JF. Coulson and Richardson’s Chemical Engineering; Elsevier: Gurgaon, India, 2002. [Google Scholar]
- Panda S, Jain MS. Assessment of the biomethane potential of commingled farm residues with sewage sludge and its techno-economic viability for rural application. Biomass Conv. Bioref. 2025, 15, 5141–5154. DOI:10.1007/s13399-024-05457-w [Google Scholar]
- Vinardell S, Feickert Fenske C, Heimann A, Cortina JL, Valderrama C, Koch K. Exploring the potential of biological methanation for future defossilization scenarios: Techno-economic and environmental evaluation. Energy Convers. Manag. 2024, 307, 118339. DOI:10.1016/j.enconman.2024.118339 [Google Scholar]
- Zheng Q, Ni L. Analysis of the effect of intrinsic sludge properties on sludge drying characteristics from both sludge composition and type scales. Waste Manag. 2024, 183, 278–289. DOI:10.1016/j.wasman.2024.05.020 [Google Scholar]
- Zheng Y, Wang P, Yang X, Lin P, Wang Y, Cheng M, et al. Process Performance and Microbial Communities in Anaerobic Co-digestion of Sewage Sludge and Food Waste with a Lower Range of Carbon/Nitrogen Ratio. Bioenerg. Res. 2022, 15, 1664–1674. DOI:10.1007/s12155-021-10357-2 [Google Scholar]
- Dhabu FI, Shukla V, Agarwal Y. Cadmium Sulfide Nanoparticles as Corrosion Inhibitors for Sulfate-Reducing Bacteria. BioNanoScience 2025, 15, 580. DOI:10.1007/s12668-025-02215-8 [Google Scholar]
- Kiran S, Ghaffar A, Iqbal S, Javed S, Aslam N, Rafique MA, et al. Characterization and Valorization of Sludge from Textile Wastewater Plant for Positive Environmental Applications. In Handbook of Biomass Valorization for Industrial Applications; Wiley: Hoboken, NJ, USA, 2022; pp. 465–489. DOI:10.1002/9781119818816.ch20 [Google Scholar]
- Appels L, Baeyens J, Degrève J, Dewil R. Principles and potential of the anaerobic digestion of waste-activated sludge. Prog. Energy Combust. Sci. 2008, 34, 755–781. DOI:10.1016/j.pecs.2008.06.002 [Google Scholar]
- Cazaudehore G, Guyoneaud R, Lallement A, Gassie C, Monlau F. Biochemical methane potential and active microbial communities during anaerobic digestion of biodegradable plastics at different inoculum-substrate ratios. J. Environ. Manag. 2022, 324, 116369. DOI:10.1016/j.jenvman.2022.116369 [Google Scholar]
- Wang M, Wang Y, Peng J, Wang L, Yang J, Kou X, et al. A comparative study on Mesophilic and thermophilic anaerobic digestion of different total solid content sludges produced in a long sludge-retention-time system. Results Eng. 2023, 19, 101228. DOI:10.1016/j.rineng.2023.101228 [Google Scholar]
- Basinas P, Rusín J, Chamrádová K. Assessment of high-solid mesophilic and thermophilic anaerobic digestion of mechanically-separated municipal solid waste. Environ. Res. 2021, 192, 110202. DOI:10.1016/j.envres.2020.110202 [Google Scholar]
- Yenigün O, Demirel B. Ammonia inhibition in anaerobic digestion: A review. Process Biochem. 2013, 48, 901–911. DOI:10.1016/j.procbio.2013.04.012 [Google Scholar]
- Lanko I, Hejnic J, Říhová-Ambrožová J, Ferrer I, Jenicek P. Digested Sludge Quality in Mesophilic, Thermophilic and Temperature-Phased Anaerobic Digestion Systems. Water 2021, 13, 2839. DOI:10.3390/w13202839 [Google Scholar]
- Wang T, Chen J, Shen H, An D. Effects of total solids content on waste activated sludge thermophilic anaerobic digestion and its sludge dewaterability. Bioresour. Technol. 2016, 217, 265–270. DOI:10.1016/j.biortech.2016.01.130 [Google Scholar]
- Mächtig T, Moschner CR, Hartung E. Monitoring the efficiency of biogas plants—Correlation between gross calorific value and anaerobically non-degradable organic matter of digestates. Biomass Bioenergy 2019, 130, 105389. DOI:10.1016/j.biombioe.2019.105389 [Google Scholar]
- Cheng S, Yang S, Huang J, Liu F, Shen F. Investigation of the Mechanism for Removal of Typical Pathogenic Bacteria from Three-Compartment Septic Tanks under Low Temperature Conditions. Processes 2023, 12, 87. DOI:10.3390/pr12010087 [Google Scholar]
- Wardhani WK, Soedjono ES, Titah HS, Mardyanto MA. Pharmaceutical emerging micropollutants potential in septic tanks: Its fate and transport study in Indonesia—A literature review. Environ. Qual. Mgmt 2024, 34, e22176. DOI:10.1002/tqem.22176 [Google Scholar]
- Yusuf HH, Pan X, Ye ZL, Cai G, Appels L, Cai J, et al. Revolutionizing sanitation: Valorizing fecal slags through co-digesting food waste at high-solid content and dosing metallic nanomaterials for anaerobic digestion stability. J. Environ. Manag. 2024, 353, 120177. DOI:10.1016/j.jenvman.2024.120177 [Google Scholar]
- Sayin A. Implementation of Acid/Gas Digestion Approach to Maximize Volatile Fatty Acids Production from Municipal Sludge and a Techno-Economic Feasibility Study. Ph.D. Dissertation, The City College of New York, New York, NY, USA, 2024. [Google Scholar]
- Shen D, Zhang P, Wu SL, Long Y, Wei W, Ni BJ. Enhanced biomethane production from waste activated sludge anaerobic digestion by ceramsite and amended Fe2O3 ceramsite. J. Environ. Manag. 2024, 351, 119973. DOI:10.1016/j.jenvman.2023.119973 [Google Scholar]
- de la Cruz-Azuara JE, Ruiz-Marin A, Canedo-Lopez Y, Aguilar-Ucan CA, Ceron-Breton RM, Ceron-Breton JG, et al. Biomethane Production from the Two-Stage Anaerobic Co-Digestion of Cow Manure: Residual Edible Oil with Two Qualities of Waste-Activated Sludge. Energies 2024, 17, 2848. DOI:10.3390/en17122848 [Google Scholar]
- Nauman M, Tayyab M, Faheem M, Ikram K, Akram MW, Asif M, et al. Designing and performance evaluation of continuously stirring anaerobic batch reactor for biomethane production from biowaste. Biomass Conv. Bioref. 2024, 14, 18065–18078. DOI:10.1007/s13399-023-04203-y [Google Scholar]
- Al-Rubaye H, Karambelkar S, Shivashankaraiah MM, Smith JD. Process Simulation of Two-Stage Anaerobic Digestion for Methane Production. Biofuels 2019, 10, 181–191. DOI:10.1080/17597269.2017.1309854 [Google Scholar]
- Bijos JCBF, Pessoa RWS, Queiroz LM, Oliveira-Esquerre KPS. Methane liquid-gas phase distribution during anaerobic sludge digestion: A thermodynamic approach. Chemosphere 2022, 298, 134325. DOI:10.1016/j.chemosphere.2022.134325 [Google Scholar]
- Djimtoingar SS, Derkyi NSA, Kuranchie FA, Yankyera JK. A review of response surface methodology for biogas process optimization. Cogent Eng. 2022, 9, 2115283. DOI:10.1080/23311916.2022.2115283 [Google Scholar]
- Rasouli M, Ataeiyan B. Investigation and Optimization of Operational Conditions of Anaerobic Digestion Process for Enhanced Biogas Production Yield in a CSTR Using RSM. Int. J. Energy Res. 2024, 2024, 9158477. DOI:10.1155/2024/9158477 [Google Scholar]
- Pratap V, Kumar S, Yadav BR. Optimization of biogas production from thermal-alkali pre-treated sludge using response surface methodology and random forest regressor model. J. Taiwan Inst. Chem. Eng. 2025, 177, 105571. DOI:10.1016/j.jtice.2024.105571 [Google Scholar]
- Islam Siddique MN, Khalid ZB, Ibrahim MZB. Effect of additional nutrients on bio-methane production from anaerobic digestion of farming waste: Feasibility & Fertilizer recovery. J. Environ. Chem. Eng. 2020, 8, 103569. DOI:10.1016/j.jece.2019.103569 [Google Scholar]
- Khan N, Khan MD, Sabir S, Nizami AS, Anwer AH, Rehan M, et al. Deciphering the effects of temperature on bio-methane generation through anaerobic digestion. Environ. Sci. Pollut. Res. 2020, 27, 29766–29777. DOI:10.1007/s11356-019-07245-w [Google Scholar]
- Parajuli A, Khadka A, Sapkota L, Ghimire A. Effect of Hydraulic Retention Time and Organic-Loading Rate on Two-Staged, Semi-Continuous Mesophilic Anaerobic Digestion of Food Waste during Start-Up. Fermentation 2022, 8, 620. DOI:10.3390/fermentation8110620 [Google Scholar]
- Nkuna R, Roopnarain A, Rashama C, Adeleke R. Insights into organic loading rates of anaerobic digestion for biogas production: A review. Crit. Rev. Biotechnol. 2022, 42, 487–507. DOI:10.1080/07388551.2021.1942778 [Google Scholar]
- Casallas-Ojeda M, Soto-Paz J, Alfonso-Morales W, Oviedo-Ocaña ER, Komilis D. Optimization of Operational Parameters during Anaerobic Co-digestion of Food and Garden Waste. Environ. Process. 2021, 8, 769–791. DOI:10.1007/s40710-021-00506-2 [Google Scholar]
- Steiniger B, Hupfauf S, Insam H, Schaum C. Exploring Anaerobic Digestion from Mesophilic to Thermophilic Temperatures—Operational and Microbial Aspects. Fermentation 2023, 9, 798. DOI:10.3390/fermentation9090798 [Google Scholar]
- He H, Chen X, Peng Z, Zhang Z, Ren X, Ma S, et al. A review of temperature and key parameters influencing the hydrolysis-methanogenesis balance in anaerobic digestion. Fuel 2025, 394, 134927. DOI:10.1016/j.fuel.2025.134927 [Google Scholar]
- Yang Z, Yang D, Hua Y, Chen X, Wang X, Gong H, et al. Dual optimization in anaerobic digestion of rice straw: Effects HRT and OLR coupling on methane production in one-stage and two-stage systems. J. Environ. Manag. 2024, 370, 123041. DOI:10.1016/j.jenvman.2024.123041 [Google Scholar]
- Hassan GK, Hemdan BA, El-Gohary FA. Utilization of food waste for bio-hydrogen and bio-methane production: Influences of temperature, OLR, and in situ aeration. J. Mater. Cycles Waste Manag. 2020, 22, 1218–1226. DOI:10.1007/s10163-020-01014-5 [Google Scholar]
- Hosseini Koupaie E, Lin L, Bazyar Lakeh AA, Azizi A, Dhar BR, Hafez H, et al. Performance evaluation and microbial community analysis of mesophilic and thermophilic sludge fermentation processes coupled with thermal hydrolysis. Renew. Sustain. Energy Rev. 2021, 141, 110832. DOI:10.1016/j.rser.2021.110832 [Google Scholar]
- Hangri S, Derbal K, Benalia A, Policastro G, Panico A, Pizzi A. Enhancing Biomethane Yield from Microalgal Biomass via Enzymatic Hydrolysis: Optimization and Predictive Modeling Using RSM Approach. Processes 2025, 13, 2086. DOI:10.3390/pr13072086 [Google Scholar]
- Ahmad RM, Javied S, Aslam A, Alamri S, Zaman QU, Hassan A, et al. Optimizing Biogas Production and Digestive Stability through Waste Co-Digestion. Sustainability 2024, 16, 3045. DOI:10.3390/su16073045 [Google Scholar]
- Mahmod SS, Jahim JM, Abdul PM, Luthfi AAI, Takriff MS. Techno-economic analysis of two-stage anaerobic system for biohydrogen and biomethane production from palm oil mill effluent. J. Environ. Chem. Eng. 2021, 9, 105679. DOI:10.1016/j.jece.2021.105679 [Google Scholar]
- Swinbourn R, Li C, Wang F. A Comprehensive Review on Biomethane Production from Biogas Separation and its Techno‐Economic Assessments. ChemSusChem 2024, 17, e202400779. DOI:10.1002/cssc.202400779 [Google Scholar]
- Ghafoori MS, Loubar K, Marin-Gallego M, Tazerout M. Techno-economic and sensitivity analysis of biomethane production via landfill biogas upgrading and power-to-gas technology. Energy 2022, 239, 122086. DOI:10.1016/j.energy.2021.122086 [Google Scholar]
- Khan EU, Mainali B, Martin A, Silveira S. Techno-economic analysis of small scale biogas based polygeneration systems: Bangladesh case study. Sustain. Energy Technol. Assess. 2014, 7, 68–78. DOI:10.1016/j.seta.2014.03.004 [Google Scholar]
- Wu N, Moreira CM, Zhang Y, Doan N, Yang S, Phlips EJ, et al. Techno-economic analysis of biogas production from microalgae through anaerobic digestion. In Anaerobic Digestion; IntechOpen: London, UK, 2019. [Google Scholar]
- Scholz M, Frank B, Stockmeier F, Falß S, Wessling M. Techno-economic Analysis of Hybrid Processes for Biogas Upgrading. Ind. Eng. Chem. Res. 2013, 52, 16929–16938. DOI:10.1021/ie402660s [Google Scholar]
- Teghammar A, Forgács G, Sárvári Horváth I, Taherzadeh MJ. Techno-economic study of NMMO pretreatment and biogas production from forest residues. Appl. Energy 2014, 116, 125–133. DOI:10.1016/j.apenergy.2013.11.053 [Google Scholar]
- Götze U, Northcott D, Schuster P. Discounted Cash Flow Methods. In Investment Appraisal: Methods and Models; Springer: Berlin/Heidelberg, Germany, 2015; pp. 47–83. DOI:10.1007/978-3-662-45851-8_3 [Google Scholar]
- Obileke K, Mukumba P. Techno‐Economic Evaluation of Wind and Bio‐Energy Systems for Sustainable Development: A Systematic Review. Energy Sci. Eng. 2025, 13, 2179–2202. DOI:10.1002/ese3.70025 [Google Scholar]
- Sganzerla WG, da Rosa RG, Barroso TLCT, Castro LEN, Forster-Carneiro T. Techno-Economic Assessment of On-Site Production of Biomethane, Bioenergy, and Fertilizer from Small-Scale Anaerobic Digestion of Jabuticaba By-Product. Methane 2023, 2, 113–128. DOI:10.3390/methane2020009 [Google Scholar]
- Tolessa A, Louw TM, Goosen NJ. Probabilistic techno-economic assessment of anaerobic digestion predicts economic benefits to smallholder farmers with quantifiable certainty. Waste Manag. 2022, 138, 8–18. DOI:10.1016/j.wasman.2021.11.004 [Google Scholar]
- Elhaus N, Volkmann M, Kolb S, Schindhelm L, Herkendell K, Karl J. Techno-economic evaluation of anaerobic digestion and biological methanation in Power-to-Methane-Systems. Energy Convers. Manag. 2024, 315, 118787. DOI:10.1016/j.enconman.2024.118787 [Google Scholar]
- Bruno M, Marchi M, Ermini N, Niccolucci V, Pulselli FM. Life Cycle Assessment and Cost–Benefit Analysis as Combined Economic–Environmental Assessment Tools: Application to an Anaerobic Digestion Plant. Energies 2023, 16, 3686. DOI:10.3390/en16093686 [Google Scholar]
- Gbadeyan OJ, Muthivhi J, Linganiso LZ, Deenadayalu N, Alabi OO. Biogas production and techno‐economic feasibility studies of setting up household biogas technology in Africa: A critical review. Energy Sci. Eng. 2024, 12, 4788–4806. DOI:10.1002/ese3.1887 [Google Scholar]
- Taramasso MA, Motaghi M, Casasso A. A techno-economic feasibility analysis of solutions to cover the thermal and electrical demands of anaerobic digesters. Renew. Energy 2024, 236, 121485. DOI:10.1016/j.renene.2024.121485 [Google Scholar]
- Arias A, Feijoo G, Moreira MT. Benchmarking environmental and economic indicators of sludge management alternatives aimed at enhanced energy efficiency and nutrient recovery. J. Environ. Manag. 2021, 279, 111594. DOI:10.1016/j.jenvman.2020.111594 [Google Scholar]
- Anh LTL, Le Luu T. Greenhouse gas emissions from municipal wastewater treatment: Global insights and Vietnam’s approach. Curr. Opin. Environ. Sci. Health 2025, 47, 100655. DOI:10.1016/j.coesh.2025.100655 [Google Scholar]
- Chen S, Liu H. Achieving low-carbon and sustainable wastewater treatment by controlling the flow of pollutants: A pilot scale investigation on reducing greenhouse gas emissions and enhancing resource recovery. J. Water Process Eng. 2024, 64, 105665. DOI:10.1016/j.jwpe.2024.105665 [Google Scholar]
- Carmona-Martínez AA, Bartolomé C, Jarauta-Córdoba CA. The Role of Biogas and Biomethane as Renewable Gases in the Decarbonization Pathway to Zero Emissions. Energies 2023, 16, 6164. DOI:10.3390/en16176164 [Google Scholar]
- Farghali M, Osman AI, Umetsu K, Rooney DW. Integration of biogas systems into a carbon zero and hydrogen economy: A review. Environ. Chem. Lett. 2022, 20, 2853–2927. DOI:10.1007/s10311-022-01468-z [Google Scholar]