
Assessment of Grid-Connected, Hybrid-Energy Systems with Conventional and Emerging Energy Storage in Meeting Energy Target 2050
Assessment of Grid-Connected, Hybrid-Energy Systems with Conventional and Emerging Energy Storage in Meeting Energy Target 2050
Sultan Khaled Dwier
1,2
Yun Ii Go
1,*

Received: 14 March 2026 Revised: 21 April 2026 Accepted: 05 June 2026 Published: 23 June 2026

© 2026 The authors. This is an open access article under the Creative Commons Attribution 4.0 International License (https://creativecommons.org/licenses/by/4.0/).
1. Introduction
In 2023, the global energy system experienced a strong rebound, with production and consumption returning to pre-pandemic levels [1]. Total primary energy demand increased by approximately 2 percent, with oil consumption exceeding 100 million barrels per day for the first time and coal production reaching record levels. Despite rapid renewable expansion, fossil fuels remained dominant, accounting for roughly 81.5 percent of primary energy, while renewables contributed 14.6 percent [2]. Electricity demand grew faster than total primary energy consumption, and renewable sources reached nearly 30 percent of global power generation, driven primarily by wind and solar deployment. Grid-scale battery storage capacity also expanded significantly. However, global greenhouse gas emissions rose by 2.1 percent, surpassing 40 GtCO2e, highlighting the continued reliance on fossil fuels despite renewable growth [2]. This dual trend of accelerating renewable deployment alongside persistent fossil fuel dependence underscores the need for scalable energy storage and hybrid systems to support decarbonization and grid stability.
Renewable energy experienced accelerated growth in 2023, driven primarily by solar and wind expansion. Solar photovoltaic accounted for approximately 75 percent of newly added renewable capacity, equivalent to about 346 GW, while wind installations reached 115 GW globally [2]. As a result, renewables increased their share of global electricity generation to nearly 30 percent, reflecting continued progress in power sector decarbonization. Despite this expansion, renewable deployment must accelerate further to meet long-term climate targets. Projections indicate that renewables could supply approximately 63 percent of total primary energy by 2050, compared with 14 percent in 2015, requiring sustained annual growth. Renewable energy is expected to contribute between 41 and 54 percent of the total emissions reductions necessary to achieve 2050 climate objectives and support global energy access and efficiency targets [1]. While renewable capacity additions are substantial, their intermittency and variability create operational challenges for modern power systems. Achieving high renewable penetration, therefore, depends not only on generation expansion but also on scalable and efficient energy storage integration [1].
Energy storage plays a central role in integrating intermittent renewable energy sources into modern power systems by balancing supply and demand and maintaining grid stability. Storage technologies provide frequency regulation, peak shaving, and backup power, reducing blackout risk and improving system reliability [3]. As electricity demand continues to grow, particularly with industrial and technological expansion, scalable storage solutions become increasingly necessary, especially for remote and high-renewable penetration regions. Rising global energy consumption and the environmental limitations of fossil fuels have accelerated the transition toward renewable generation, but variability in solar and wind output requires complementary storage infrastructure. Advances across electrochemical, chemical, thermal, and mechanical storage technologies have improved system efficiency and flexibility, supporting higher renewable integration levels [4]. This growing importance is reflected in the rapid expansion of the battery energy storage market, which has experienced strong growth in recent years, signaling increasing investment and deployment of storage solutions worldwide [4].
1.1. Problem Statement
A hybrid energy system (HES) is defined as an integrated combination of two or more energy generation sources and storage technologies, often utilizing renewables such as solar PV and hydropower, designed to enhance energy security, reliability, and renewable penetration [5]. Energy storage technologies (ESTs) are critical for the sustainability of renewable energy systems. However, the widespread use of ESTs is constrained by numerous challenges. These challenges include the cost of research and development associated with the technology, which is estimated to reach a capital cost of 220 USD/kWh for lithium-ion batteries by 2030 [6]. Another challenge is the insufficient production from renewable energy resources compared to the global demand. The current production is at 800 GWh, which is nowhere near the required 10,000 GWh of electricity [6]. Other challenges include operational constraints, integration with renewable energy sources, technological limitations, safety concerns, and manufacturing and disposal issues.
Energy storage systems require substantial capital investment, and costs vary widely across technologies, affecting large scale feasibility. Lithium-ion battery capital costs are projected to decline toward about 216 to 222 USD per kWh by 2030, depending on chemistry, while pumped hydro storage remains capital intensive at more than 2000 USD per kW, depending on duration [7,8]. Performance limitations also remain significant. Mechanical and thermal storage systems are bounded by efficiency constraints, with CAES operating near 52 percent efficiency and pumped hydro around 80 percent, while thermal systems are limited by thermodynamic bounds [7]. Electrochemical systems face degradation, limited lifetime, and design complexity. Some technologies, such as SMES, require cryogenic operation. Renewable integration adds further constraints because solar and wind are intermittent, and current installed storage typically provides only about four hours of coverage, which is insufficient for deep balancing needs [9]. Material and technology gaps persist, including low energy density in devices such as supercapacitors at roughly 5 to 10 Wh per kg and the need for improved battery materials [7]. Safety and reliability risks remain for high temperature batteries and compressed air systems due to fire, explosion, and site-specific requirements [8]. In addition, manufacturing and disposal impacts are nontrivial, especially for lithium-ion batteries, where lithium extraction is water intensive, production is energy intensive, and end of life waste is projected to reach millions of tons by 2030, highlighting the need for effective recycling infrastructure [6].
1.2. Aim and Objectives
The main objectives of this work are to develop hybrid energy storage systems considering different types of renewable energy resources and energy storage materials based on IRENA and SEDA Malaysia energy target and roadmap, to evaluate the performance metrics of different hybrid energy storage scenarios and optimize the systems using sensitivity analysis, to conduct economic assessment including ROI, IRR, and payback period for financial viability, and to assess the carbon footprint reduction of the proposed models in meeting net zero target 2050.
2. Literature Review
2.1. Existing Energy Storage Technology
Existing energy storage technologies can be broadly classified into mechanical, electrical, chemical, thermal, and electrochemical systems, each suited to different grid roles and operating conditions [10]. Mechanical storage systems, including pumped hydro storage, compressed air energy storage, and flywheels, store energy in physical form through gravitational potential or kinetic motion. Pumped hydro dominates global installed capacity due to its maturity and large-scale capability, although it requires a favorable geography and high infrastructure investment. CAES enables bulk and long duration storage but depends on suitable underground formations and effective thermal management. Flywheels provide very fast response and high cycle life, making them suitable for short duration frequency regulation rather than bulk storage. These technologies are generally robust and long lived but constrained by location or energy capacity limitations [11]. Electrical storage systems, represented by supercapacitors and superconducting magnetic energy storage, store energy directly in electric or magnetic fields. They are characterized by extremely fast response times and high-power density, making them suitable for power quality control and short duration grid stabilization. However, their relatively low energy density and high capital costs limit their use in large scale energy shifting applications [12].
Chemical storage systems convert electricity into molecular energy carriers such as hydrogen or synthetic natural gas through electrolysis and methanation processes. Synthetic natural gas enables long term storage and compatibility with existing gas infrastructure, particularly when produced from biomass. Nevertheless, high conversion losses and production costs remain barriers to widespread deployment [13]. Thermal energy storage systems store energy in the form of heat using molten salt, sensible heat, or latent heat mechanisms. These systems are commonly integrated with solar thermal plants and industrial heat management. Molten salt storage offers high temperature operation and extended discharge duration, but faces corrosion and material constraints. Sensible heat systems are simple and cost effective but have lower energy density, while latent heat systems provide higher density through phase change materials but depend on material stability. Thermal storage is effective for heat integration but less flexible for direct grid electricity balancing [14]. Electrochemical storage systems, primarily batteries such as lithium ion, lead acid, and sodium sulfur, store energy through reversible chemical reactions. Lithium-ion batteries dominate modern applications due to high energy density, scalability, and efficiency, although safety and lifecycle impacts remain concerns. Lead acid batteries offer low cost and high recyclability, but suffer from limited lifespan and energy density. Sodium sulfur batteries are suitable for grid scale applications due to high energy density and efficiency but require elevated operating temperatures. Electrochemical systems provide flexible deployment but involve trade-offs among cost, safety, and durability [15]. Existing energy storage technologies differ widely in performance metrics such as power and energy density, discharge duration, response time, efficiency, operating temperature, environmental impact, safety, and maintenance needs. Because reported values vary across sources, relative comparison is more meaningful than absolute figures. The technologies reviewed include mechanical, electrical, thermal, chemical, and electrochemical systems such as pumped hydro, CAES, flywheels, supercapacitors, SMES, thermal storage, and multiple battery types.
2.2. Emerging Energy Storage Technology
Emerging energy storage technologies aim to overcome the limitations of mature systems by improving safety, scalability, duration, or cost structure. Flow batteries store energy in external liquid electrolytes, allowing independent scaling of power and energy capacity. Vanadium redox flow batteries are the most developed type and offer long cycle life, operational safety, and suitability for grid scale storage. However, they remain constrained by relatively low energy density and high capital cost compared with lithium-based batteries [16]. Solid state batteries replace liquid electrolytes with solid materials, enhancing safety and reducing thermal runaway risks while targeting higher energy density and longer lifespan. Despite their promise as next generation electrochemical systems, large scale deployment remains limited by manufacturing complexity, cost, and temperature sensitivity [17]. Liquified air energy storage provides long duration storage by compressing and liquefying air at cryogenic temperatures before expansion through turbines. These systems can integrate waste heat recovery and offer low environmental impact, but efficiency losses and specialized infrastructure requirements remain key barriers [18]. Solid gravity energy storage systems store energy through the elevation of heavy masses and controlled descent. They offer mechanical simplicity and long duration capability but require substantial structural investment and remain at early commercialization stages [19]. Hybrid technologies such as Zinc ion hybrid supercapacitors seek to combine high energy and high-power density with improved safety and material sustainability, although long term stability remains under development [20]. Hydrogen based systems use electrolysis to produce hydrogen as an energy carrier for long duration or seasonal storage. When paired with fuel cells, they provide flexible power generation, but challenges in storage efficiency, leakage, and infrastructure persist [21].
Performance metrics across emerging technologies vary widely in terms of energy density, discharge duration, efficiency, safety, and cost. Because reported values differ across studies, comparative positioning rather than absolute figures is more meaningful. The technologies reviewed include flow batteries, solid state batteries, liquified air systems, gravity storage, zinc ion hybrid devices, hydrogen storage, and fuel cell integration. Energy storage systems are essential for increasing renewable energy penetration, yet their large-scale deployment remains constrained by technical, economic, environmental, and integration challenges. Round-trip efficiency losses, typically ranging from 10 to 30 percent depending on technology and operating conditions, reduce overall system effectiveness and increase energy wastage [22]. High capital costs, operational expenses, and replacement requirements further limit economic feasibility, particularly for lithium-ion systems in large-scale applications [23]. Environmental impacts represent another major constraint. Battery manufacturing and disposal involve hazardous materials and lifecycle emissions that may offset some sustainability benefits if not properly managed. Degradation over repeated charge–discharge cycles lead to capacity fade and increased internal resistance, shortening service life and requiring periodic replacement [23]. Technology-specific limitations also persist. Lead-acid batteries exhibit low energy density and limited cycle life, while lithium-ion batteries offer higher performance at greater cost and with safety concerns. Supercapacitors and flywheels provide rapid response but limited energy capacity. Pumped hydro storage, despite representing most of the global installed capacity, requires favorable geography and significant infrastructure investment. Similarly, integration challenges further complicated deployment. Grid-connected storage systems must meet stringent technical requirements to ensure stable and reliable operation. Renewable intermittency requires storage systems to operate with high responsiveness and advanced control strategies to maintain grid stability. In addition, inconsistent regulatory frameworks and limited environmental assessment standards hinder standardized evaluation and sustainable implementation of energy storage technologies [24].
A critical quantitative comparison between the conventional and emerging storage technologies evaluated in this study reveals important performance distinctions that informed their selection across the simulated scenarios. Lithium-ion batteries, representing the most mature electrochemical storage option, offer a round-trip efficiency of 90 to 94%, an energy density of up to 200 Wh/kg, and a cycle life of 1000 to 10,000 cycles at a depth of discharge of 90 to 95%, making them a reliable and high-performance baseline storage technology [25,26]. Lead-acid batteries, while offering a lower round-trip efficiency of 75 to 85% and a significantly reduced energy density of up to 50 Wh/kg, remain relevant due to their low capital cost of 300 to 600 USD/kWh and high recyclability, though their limited cycle life of 500 to 1200 cycles and restricted depth of discharge of 50% represent notable operational constraints [25,26]. Supercapacitors offer round-trip efficiencies of up to 95% and near-immediate response times but are fundamentally limited by their low energy density of 5 to 10 Wh/kg and discharge durations measured in seconds, restricting their role to short-term power quality management rather than bulk energy shifting applications [7]. Among emerging technologies, zinc bromide flow batteries offer a distinct advantage through their ability to operate at a depth of discharge of 100%, an energy density of 30 to 60 Wh/kg, and a cycle life of 2000 to 10,000 cycles at a capital cost of 110 to 750 USD/kWh, making them particularly suitable for grid-scale hybrid applications despite their moderate round-trip efficiency of approximately 75% [25,26]. Vanadium redox flow batteries similarly benefit from a 100% depth of discharge and an exceptional cycle life of 12,000 to 18,000 cycles, offering long-term durability at a capital cost of 600 to 1500 USD/kWh, though their relatively low energy density and higher upfront cost compared with lithium-ion systems remain barriers to widespread deployment [25,26]. These quantitative distinctions directly justify the technology selections made across the five scenarios and sensitivity analyses conducted in this study, where lithium-ion and supercapacitors represent mature baseline options and zinc bromide and vanadium redox represent emerging alternatives with superior long-duration performance potential.
Several studies were reviewed in this research. Balachander et al. (2020) explored the optimization of a hybrid electric power network incorporating photovoltaic (PV) panels, wind turbines, battery storage, and diesel generators. The study achieved a renewable fraction ranging from 34% to 64% and reported a levelized cost of energy (LCOE) between 0.61 USD/kWh and 0.63 USD/kWh. Emissions for the optimal configurations were recorded at 4732–4960 kg/year for CO2, 6.03–9.96 kg/year for SO2, and 66.1–109 kg/year for NOx [27]. Yasin et al. (2020) examined the optimization of a hybrid system comprising PV, energy storage, and diesel generation with a specific focus on managing excess electricity. The renewable fraction varied significantly from 57% to 100%, depending on the system configuration, with LCOE values ranging from 0.438 USD/kWh to 0.666 USD/kWh. Emissions were particularly high in this study, with CO2 emissions ranging from 21,404 kg/year to 130,794 kg/year, SO2 from 43 kg/year to 263 kg/year, and NOx from 471 kg/year to 2545 kg/year, reflecting the environmental trade-offs of such systems [28]. Khalil et al. (2021) conducted a similar investigation focusing on a hybrid system designed for a coastal area in Balochistan, incorporating PV arrays, wind turbines, and converters. The renewable fraction for this configuration varied between 45.6% and 74.2%, with a LCOE range of 0.118 USD/kWh to 0.3 USD/kWh. The study also recorded emissions of 16,382 kg/year for CO2, 71 kg/year for SO2, and 34.7 kg/year for NOx. The net present cost (NPC) for the proposed systems ranged from $180,026 to $234,192, highlighting the economic feasibility of such hybrid configurations [29]. Suriadi et al. (2021) provided a techno-economic analysis of hybrid renewable energy systems for isolated regions, focusing on a combination of solar PV, battery storage, and a diesel generator. The study found a renewable fraction between 58.4% and 75.3%, with a LCOE ranging between 0.481 USD/kWh and 0.485 USD/kWh. The NPC was determined to be between $371,049 and $374,163, underscoring the financial commitment required for such systems in isolated locations [30]. Finally, Zhang et al. (2022) investigated the operational strategies for a hybrid PV/wind system, focusing on the balance between energy production and storage. The renewable fraction was reported at 62.4%, with LCOE values between 0.462 USD/kWh and 0.471 USD/kWh. The study also calculated a 12.8% ROI and a 12.7% IRR, indicating the potential financial returns of the system. CO2 emissions for the optimal configuration were reported at 37,579 kg/year [31].
2.3. Research Gap and Novelty
Current studies on hybrid energy storage systems have predominantly focused on techno-economic performance metrics such as renewable fraction and LCOE, without conducting comprehensive environmental impact assessments that simultaneously evaluate CO2, SO2, and NOx emissions alongside economic indicators such as ROI, IRR, and payback period [27,28,29,30,31]. Furthermore, existing literature has not adequately addressed the comparative performance of emerging storage technologies such as zinc bromide and vanadium redox flow batteries [25,26] against conventional systems within a grid-connected hybrid framework in Malaysian energy-transition context. This study addresses these gaps by systematically evaluating five hybrid energy system scenarios that incorporate both conventional and emerging storage technologies, examining the renewable fraction, net energy production, levelized cost of energy, economic feasibility, and carbon footprint. By assessing these systems against Malaysia’s Energy Target 2050, this work contributes to reducing greenhouse gas emissions, facilitating the integration of renewable energyd advancing the deployment of hybrid energy storage solutions aligned with the goals of the Paris Agreement and SEDA Malaysia’s renewable energy roadmap [32,33].
3. Methodology
This project is divided into five work packages in a sequential order. The first work package (WP1) will focus on the development of several hybrid energy storage systems based on the most common renewable energy sources and energy storage materials used in Malaysia in alliance with IRENA and Malaysia’s SEDA energy target and roadmap. Next, the second work package (WP2) will evaluate the performance metrics of the developed hybrid energy systems, which include the renewable fraction, annual energy production and consumption, and the levelized cost of energy (LCOE). After that, the third work package (WP3) will analyze the results of WP2 and choose the optimal hybrid energy storage system using thorough sensitivity analyses. Following that, an economic analysis will be conducted on the optimal hybrid energy storage in the fourth work package (WP4). This economic analysis includes the return on investment (ROI), the internal rate of return (IRR), and the payback period. Finally, the fifth work package (WP5) will assess the carbon footprint of the optimal system in the form of tracking the reduction of carbon dioxide (CO2) emissions, sulfur dioxide (SO2) emissions, and nitrogen oxides (NOx) in comparison to the other developed systems. Figure 1 shows a flowchart illustrating the work packages of this project. Table 1 describes the details of this project’s work packages.
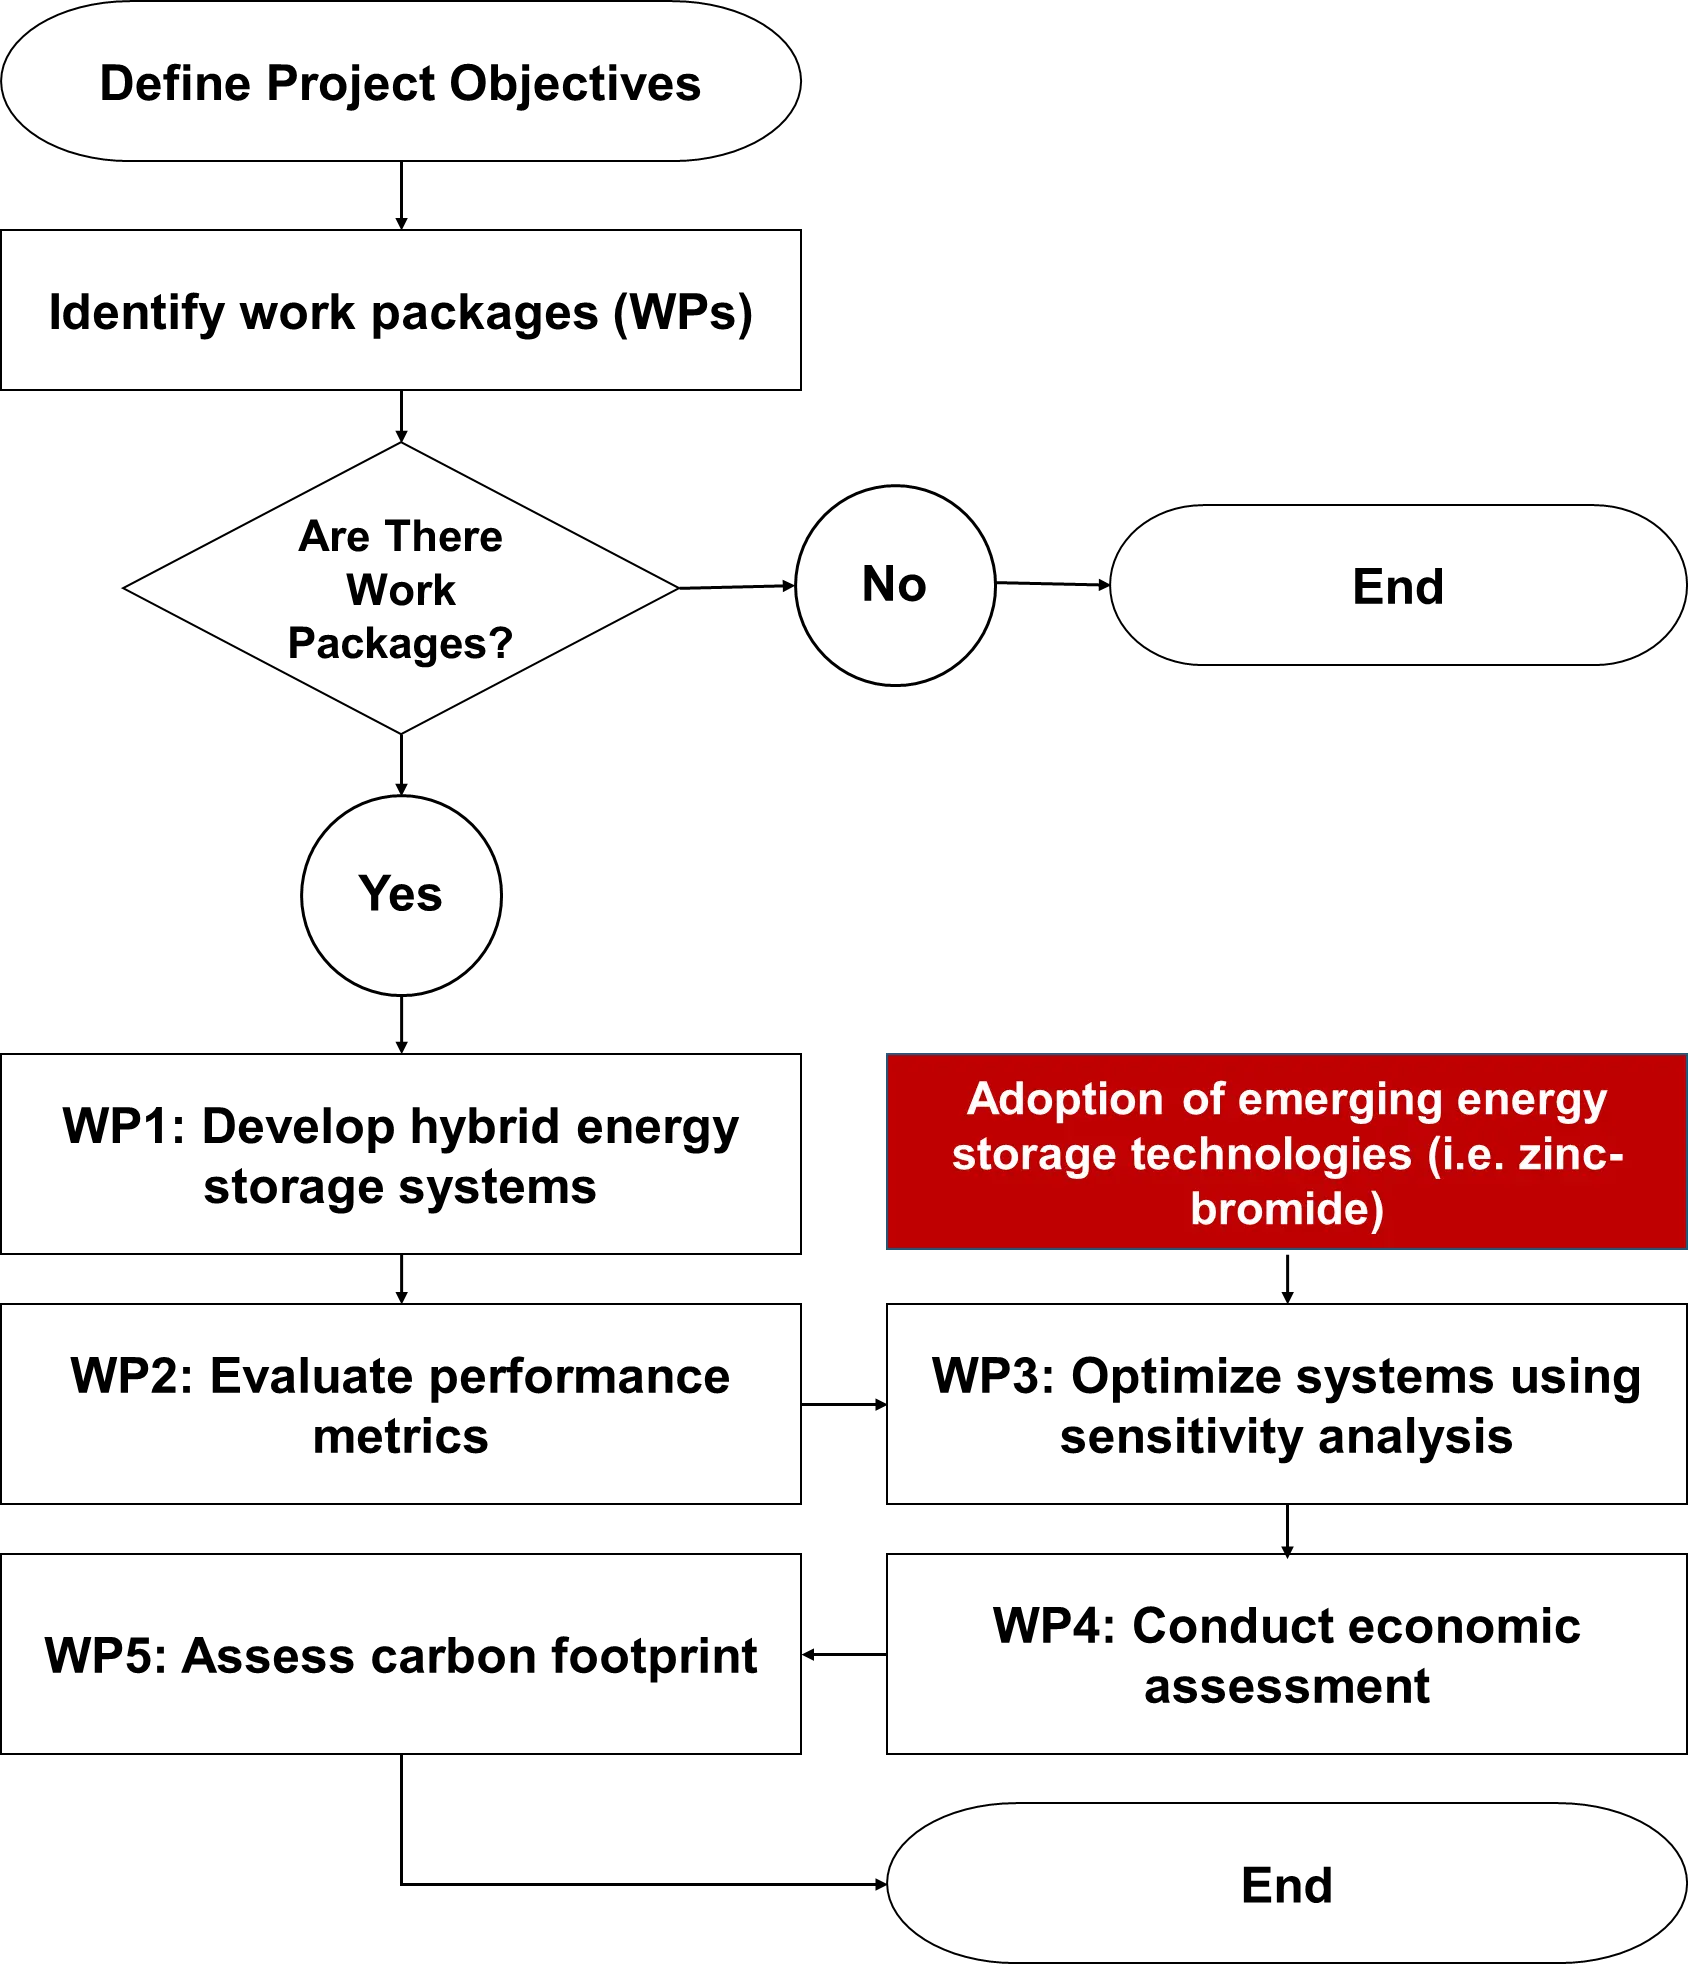
Figure 1. Flowchart illustrating the sequential methodology of the five work packages, from system development (WP1) through performance evaluation (WP2), optimization (WP3), economic assessment (WP4), and carbon footprint analysis (WP5).
Table 1. Description of this project’s work packages.
|
Work Package |
Research Activities |
Design Parameters |
Performance Parameters |
Research Boundary |
|---|---|---|---|---|
|
WP1 |
Choice of project’s location, renewable energy sources, systems configurations, and energy storage technology. |
Electricity load profile, stream flow data, solar irradiance data, and the life of the project. |
Fully developed energy systems (ready to simulate). |
Only selected storage technologies were considered. |
|
WP2 |
Evaluating the performance metrics of the developed systems. |
The cost of producing 1 kWh of energy. |
Renewable fraction, annual energy production and consumption, and the Levelized cost of energy (LCOE) |
The cost of producing 1 kWh of energy is assumed to be constant throughout the life of the project. |
|
WP3 |
Simulating the five selected scenario and choosing the optimal scenario based on sensitivity analysis. |
Renewable fraction, annual energy production and consumption, and the Levelized cost of energy (LCOE) |
Choosing the optimal scenario based on the highest renewable fraction, highest net annual energy production, and lowest LCOE. |
There is no threshold to the amount of annual energy produced. |
|
WP4 |
Conduct economic analysis on the optimal scenario. |
Discount rate and inflation rate. |
Return on investment (ROI), Internal rate of return (IRR), and Payback period. |
Discount rate and inflation rate are assumed to be constant throughout the life of the project. |
|
WP5 |
Conduct a carbon footprint analysis on the optimal scenario |
Emission factor for each pollutant. |
CO2, SO2, and NOx emissions. |
Only emissions from major components (such as the grid) are considered. |
3.1. Project Description
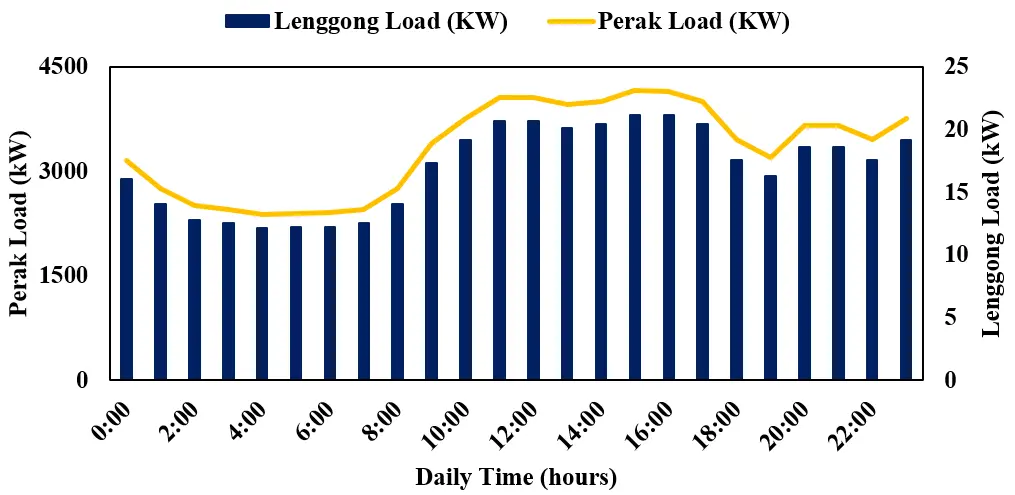
The selected location of this project is the Kenering Hydroelectric power plant, in Lenggong, Perak, with coordinates of (5.2157, 101.0982). According to the latest census of Malaysia, the population of Perak state and Lenggong town are 2,496,041 people and 12,722 people, respectively [34]. The population percentage of Lenggong to the overall Perak population is 0.51%. This percentage will be applied to the hourly load profile of Perak to obtain an approximate load profile for Lenggong.
Figure 2 shows the hourly electricity load profile of Perak and Lenggong [26]. The lifetime of this project was assumed to be 25 years, which is a typical lifespan for renewable facilities [35]. The streamflow data are also essential for the selected hydroelectric power plant. The estimated streamflow proxy is calculated using Equation (1):
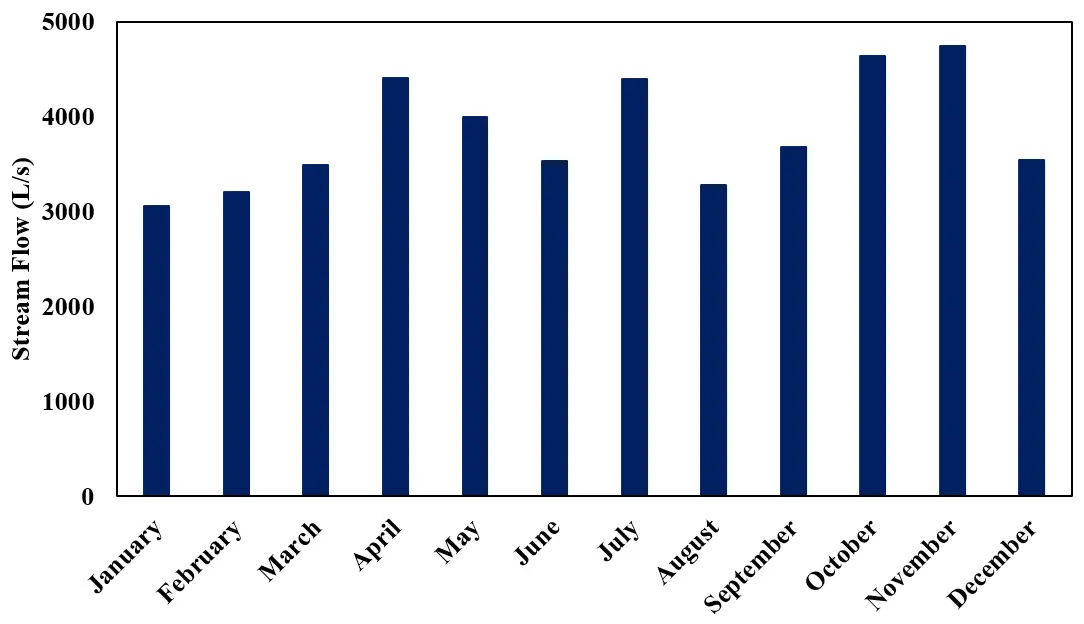
The average precipitation data available for the selected location are in millimeters, which need to be converted to liters by using the surface area of the Kenering Hydroelectric power plant, which is 40.2 km2 [36]. Figure 3 shows the average monthly stream flow data of the selected location throughout 2023, converted from average monthly precipitation data using Equation (1) [37].
3.2. Evaluation of Analytical Tools
HOMER Pro was selected for this project due to its strong capability to simulate hybrid energy systems and integrate diverse energy sources and storage technologies. It supports solar, wind, diesel, hydro, biomass, and grid power, enabling the design and analysis of complex hybrid configurations. The software also includes multiple storage options, such as batteries, hydrogen, pumped hydro, and flywheels, allowing comparative evaluation of storage strategies. A key strength of HOMER Pro is its optimization engine, which evaluates thousands of system configurations to identify cost-effective and technically feasible solutions. It incorporates economic metrics such as net present cost and levelized cost of energy, as well as financial indicators including return on investment, internal rate of return, payback period, and cash flow analysis. These outputs support a comprehensive techno-economic assessment by accounting for capital, operating, and replacement costs. HOMER Pro also allows customization of load profiles and incorporation of real weather data and grid interactions. Its structured interface and visualization tools facilitate scenario comparison and sensitivity analysis. The software is widely adopted in academic, consulting, and commercial applications for renewable and hybrid system design [38]. Several other software packages were considered in a screening process, as shown in Table 2.
Table 2. Screening process for this project’s software selection.
|
Software |
Outcomes |
Advantages |
Disadvantages |
|---|---|---|---|
|
Homer Pro [38] |
Optimal sizing of an energy storage system Economic analysis Integration of renewables Simulation of various scenarios |
User-friendly interface Detailed analysis Integration with renewables |
Relatively expensive Steep learning curve |
|
PVSyst [39] |
PV system simulation Energy production estimation Shading analysis Economic analysis |
Established in the solar industry. Detailed shading analysis Comprehensive energy production estimation |
Limited to PV system analysis Can be complex for beginners |
|
PSCAD [40] |
Power system simulation Modelling of energy storage systems Analysis of transient phenomena |
High-fidelity simulation Detailed transient analysis. Integration with other power system tools |
Steep learning curve Expensive licensing |
|
TRNSYS [41] |
Dynamic simulation of renewable energy systems Performance analysis Economic assessment |
Wide range of renewable energy models Detailed performance analysis Modular structure |
Complex interface Requires advanced knowledge |
|
Synergi Electric [42] |
Grid simulation. Energy storage optimization Integration with existing grid infrastructure |
Advanced grid analysis Comprehensive simulation capabilities |
Complex interface High cost |
|
Energy Toolbase Developer [43] |
Financial analysis Solar + storage modelling Utility rate analysis |
Easy-to-use interface Detailed financial modelling |
Limited to solar + storage modelling Subscription-based pricing |
|
GridUnity [44] |
Grid planning and optimization. Integration of DERs Energy storage planning |
Scalable platform Integration with existing grid data |
Requires integration with existing systems |
|
Battery AI [45] |
Optimizes battery performance for renewables and grids. Maximizes lifespan and efficiency. |
Cloud-based, AI-powered platform. Real-time data analysis and insights. |
Limited customization options. Pricing may be high for smaller projects. |
|
Energsoft [46] |
Analyses energy storage data in real-time. Identifies trends and optimizes storage use. |
Machine learning-based analytics. Improves understanding of energy use patterns. |
Still under development, there is a limited user base. May require data science expertise for full utilization. |
3.3. Development of the Energy System
The energy systems chosen for this study consist of one or more renewable energy sources, an electric load, a converter, a connection to the grid, and an energy storage technology. The renewable energy sources in this work were the grid-connected solar photovoltaic (PV) and hydropower. According to the international renewable energy agency (IRENA), out of Malaysia’s total installed renewable energy capacity in 2021, 69.8% were hydropower (6.211 GW), followed by 20% solar PV (1.780 GW) [32]. This indicates that 90% of the total installed renewable energy in Malaysia is hydropower and solar PV. As for Malaysia’s renewable energy target for 2035, the sustainable energy development authority (SEDA Malaysia) set a target of 40% renewable energy shares of the total energy mix (17.996 GW). Out of this capacity, 51.6% is expected to be hydropower (9.281 GW), and 40.5% is predicted to be solar PV (7.280 GW) [33]. These predictions align with what IRENA stated, which emphasizes on the dominance of hydropower and solar PV on the renewable energy field in Malaysia.
Several assumptions and boundary conditions were applied to ensure consistency across all simulated scenarios. The discount rate and inflation rate were assumed to be constant throughout the 25-year project lifetime, and the cost of producing one kWh of energy was held fixed across all scenarios. Only emissions from major grid-connected components were considered in the environmental analysis, and the simulation was bounded geographically to the Kenering Hydroelectric power plant site in Lenggong, Perak, with stream flow and solar irradiance data sourced from 2023 records specific to this location. Battery management system (BMS) functions, including state of charge monitoring, charge and discharge current regulation, and minimum state of charge protection, are implicitly assumed through HOMER Pro’s built-in battery modeling parameters rather than explicitly modeled as a standalone component [47]. These include state of charge monitoring within a defined range of 20% minimum and 100% maximum, charge current limiting at 167 A, discharge current limiting at 500 A, and minimum state of charge protection to prevent deep cycling and extend battery lifetime. Regarding model validation, this study follows the widely adopted approach in hybrid renewable energy system research of using HOMER Pro’s internal optimization engine as the basis for result validity, consistent with peer-reviewed studies employing the same platform in similar contexts, including Balachander et al. [27], Yasin et al. [28], Khalil et al. [29], Suriadi et al. [30], and Zhang et al. [31]. Table 3 shows the five different scenarios developed in this study.
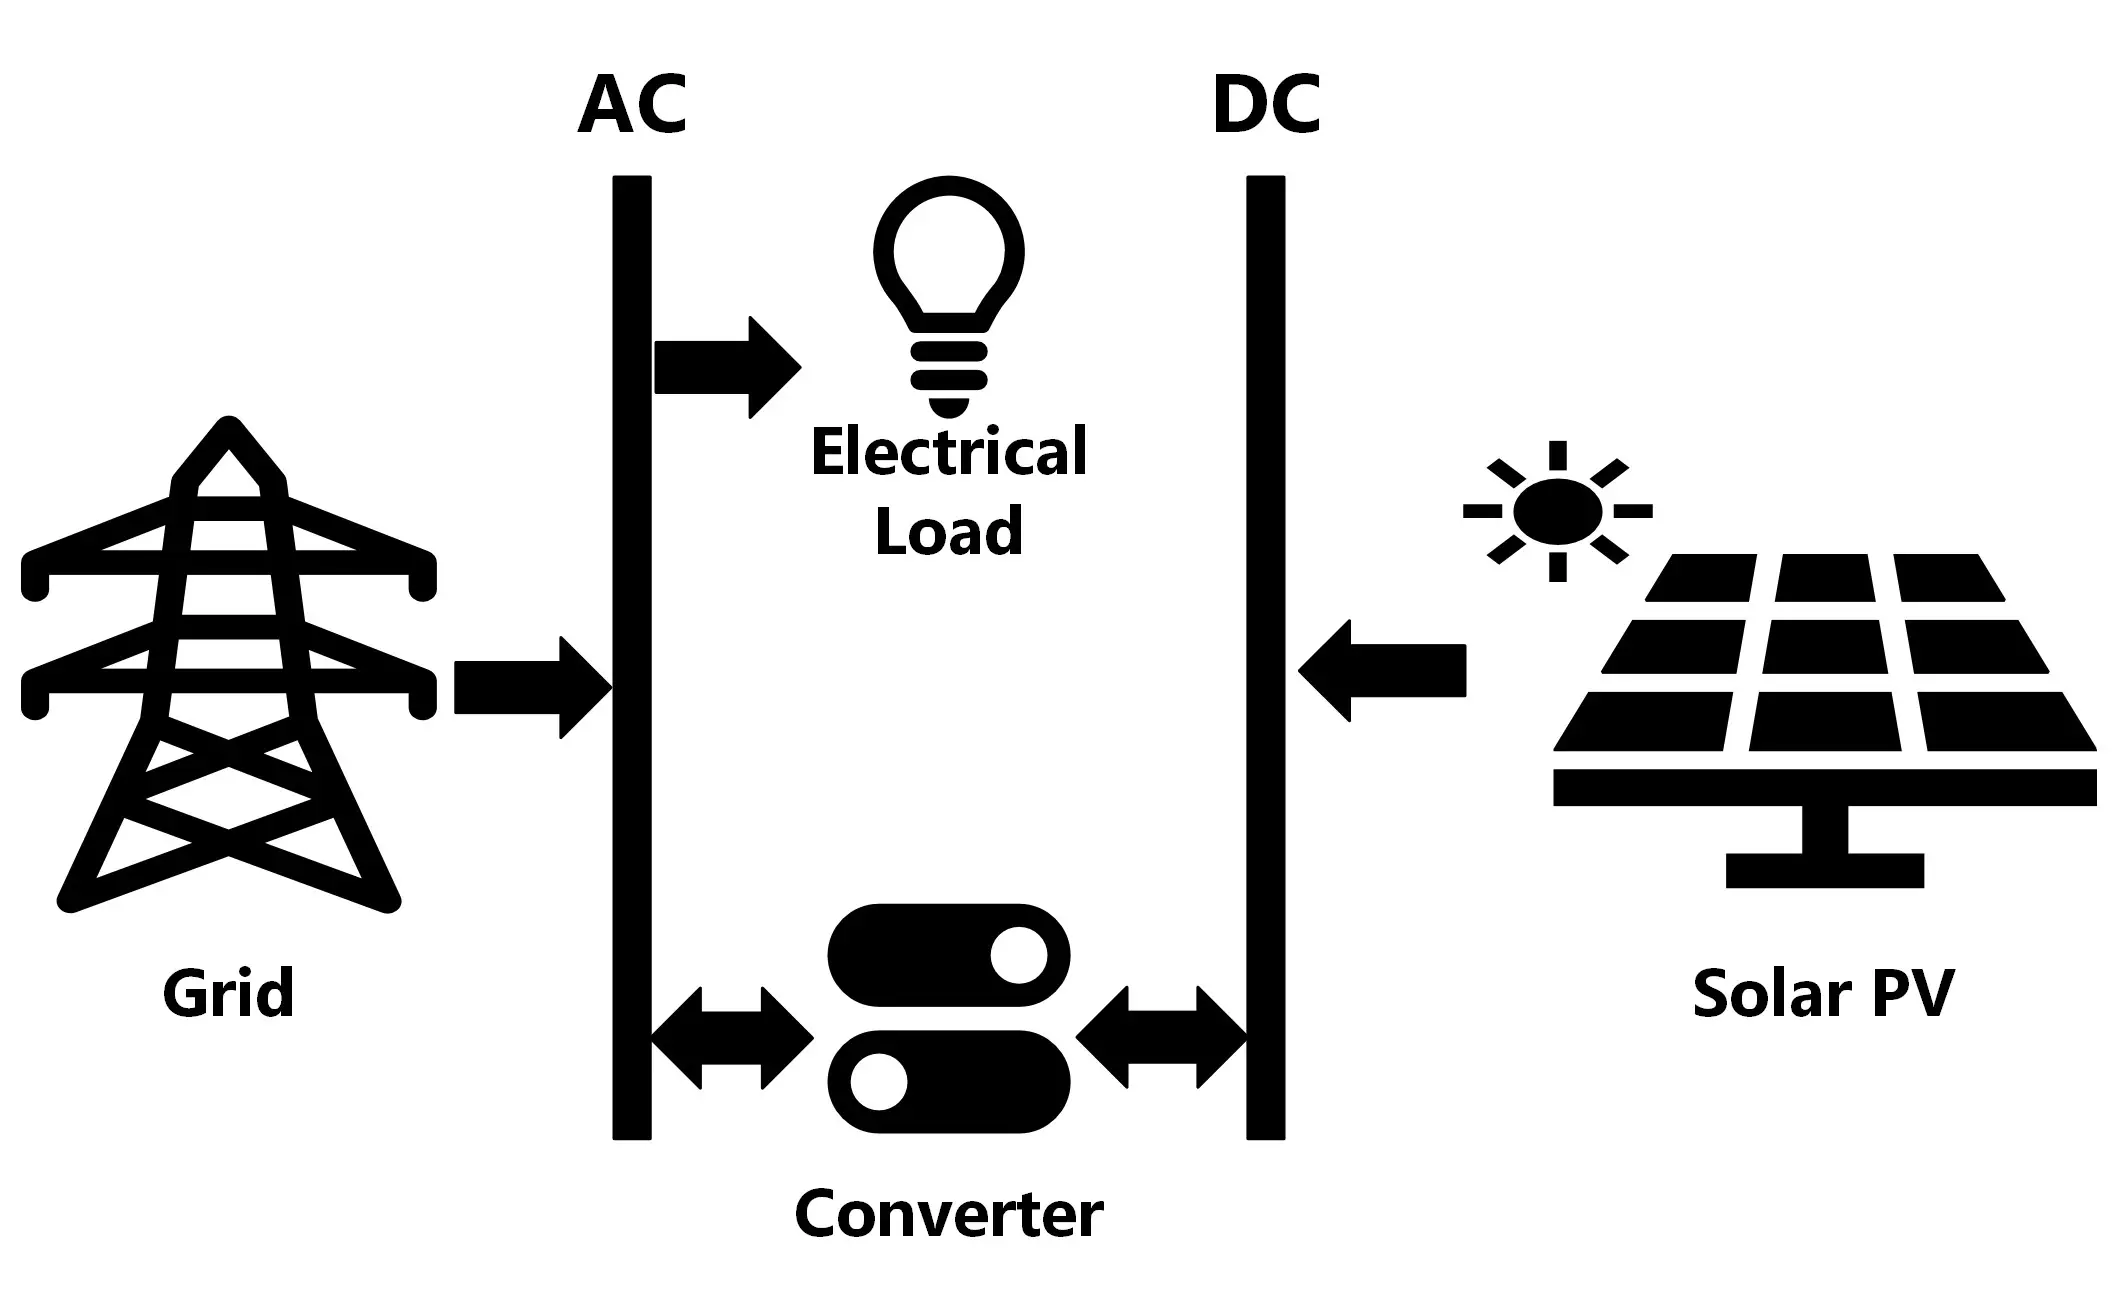
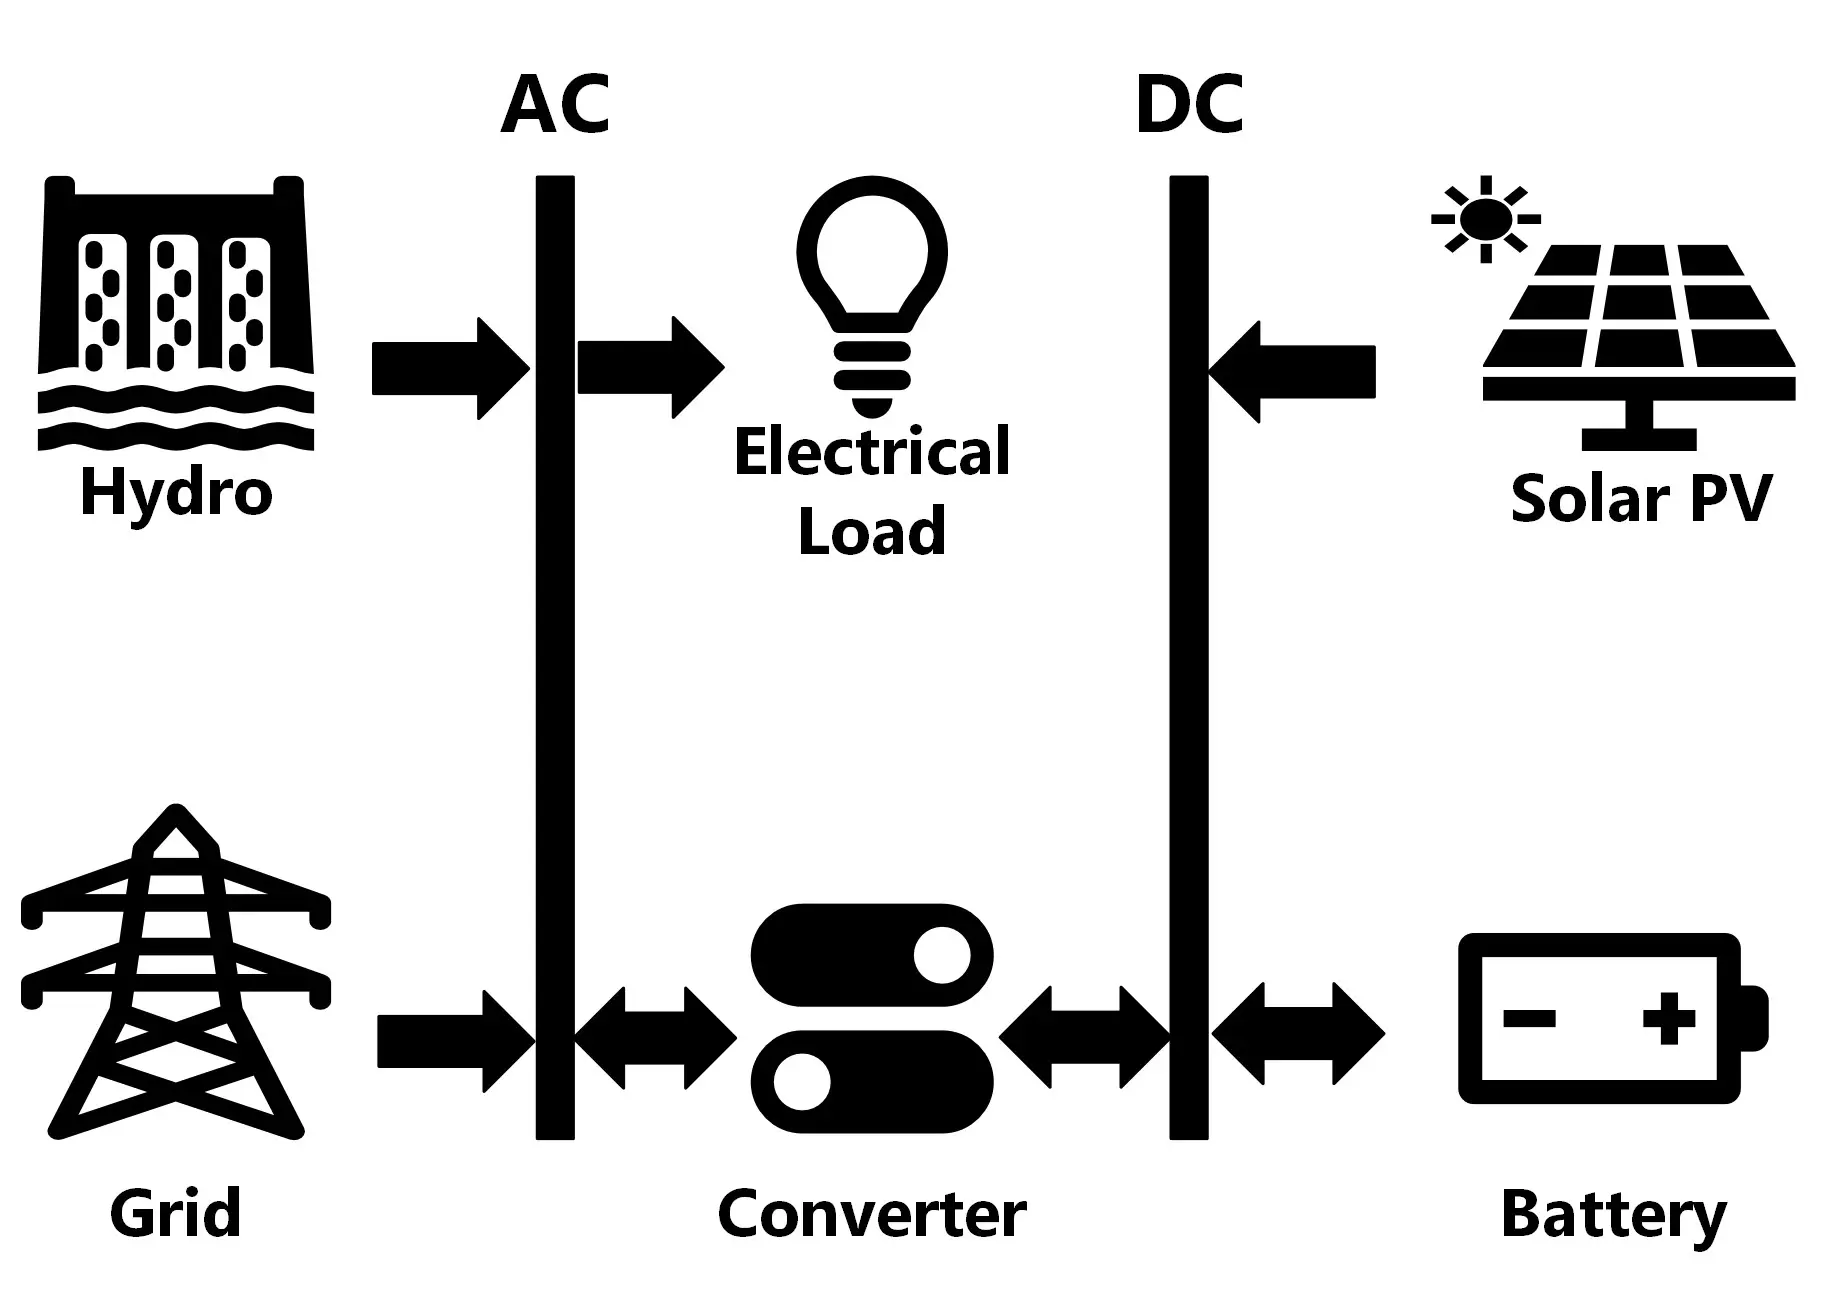
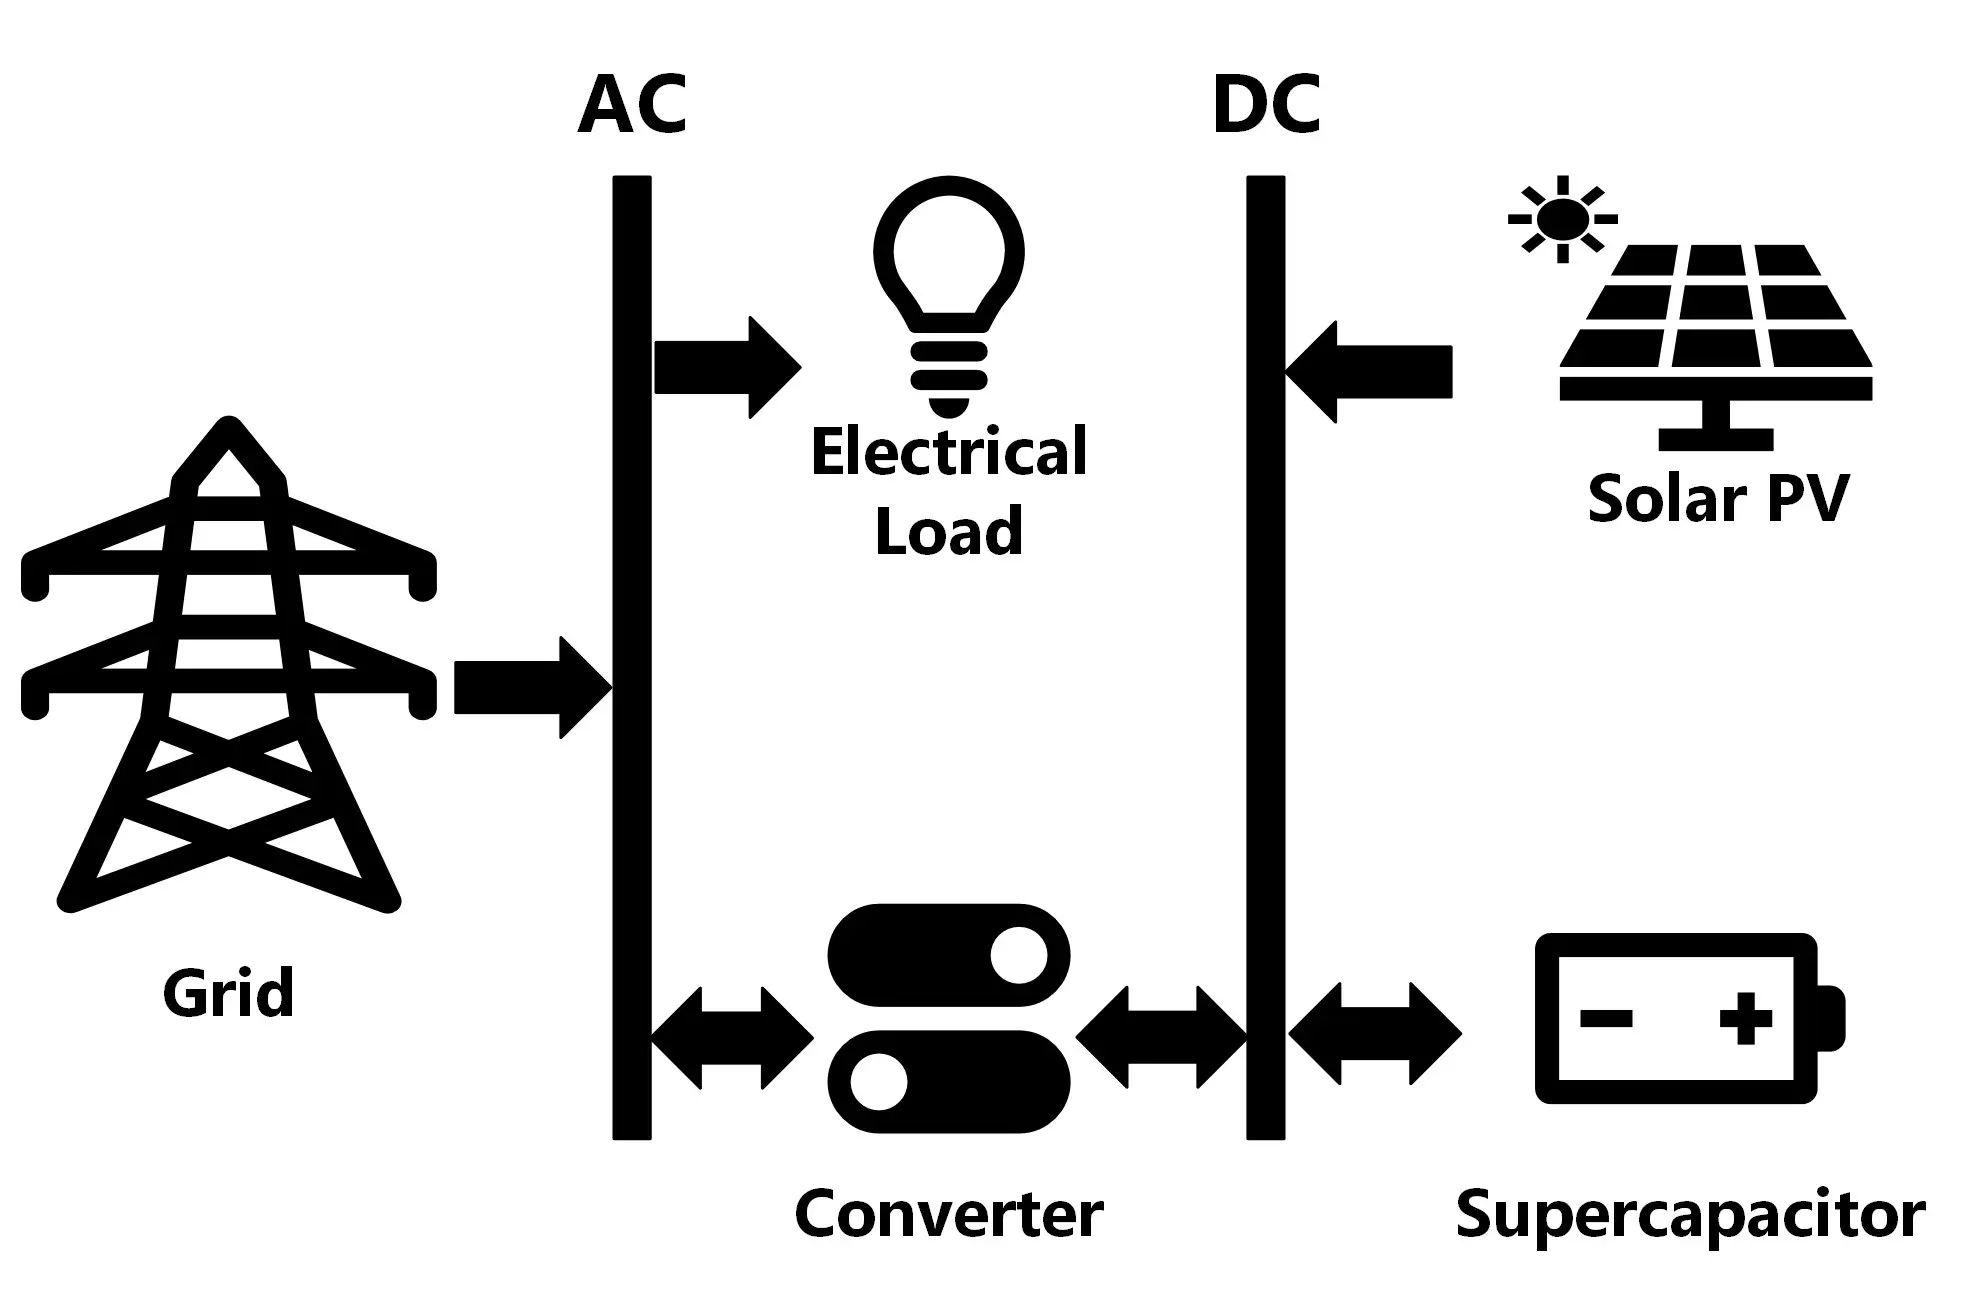
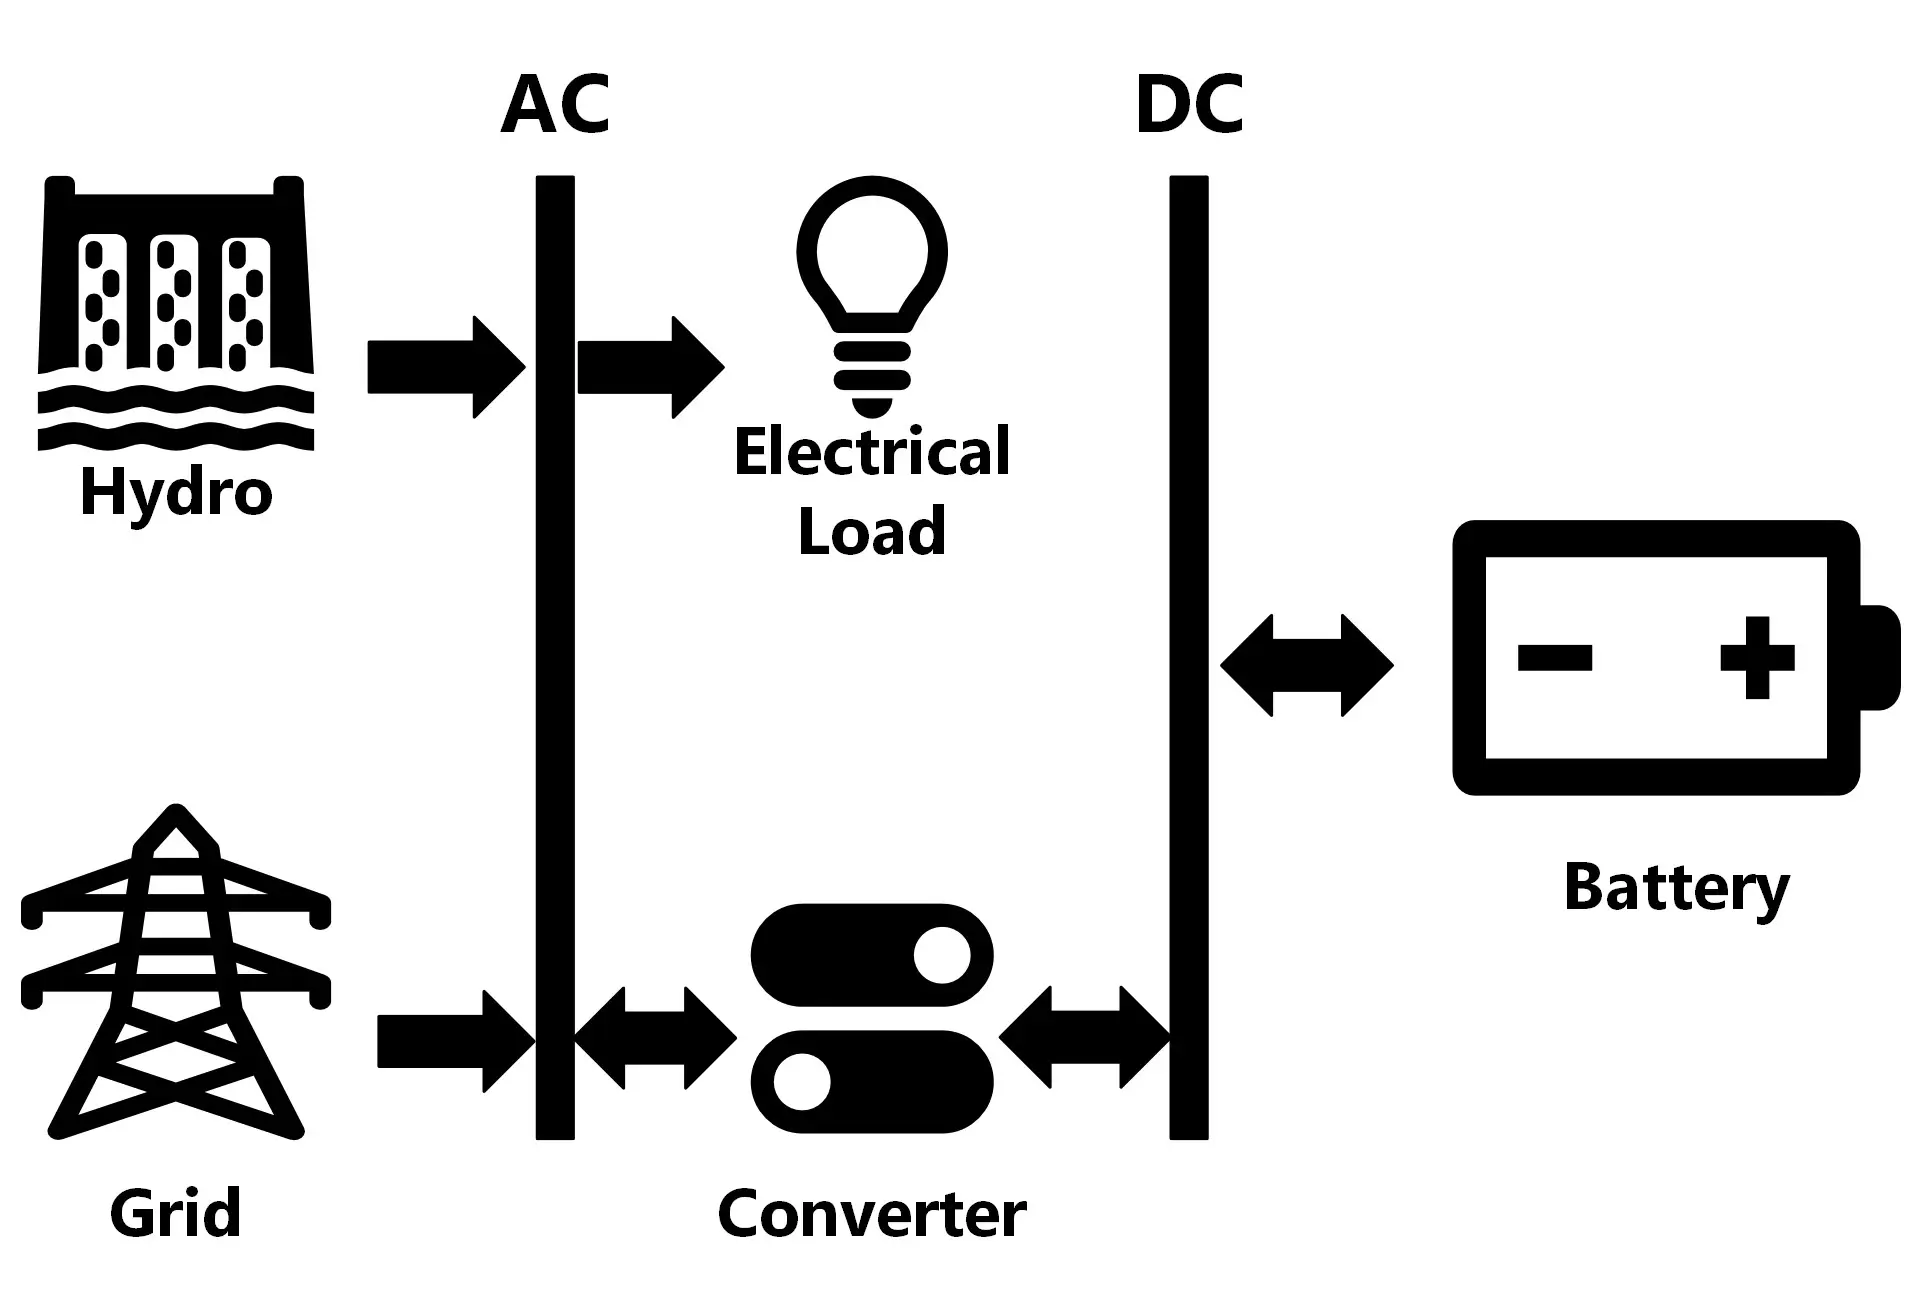
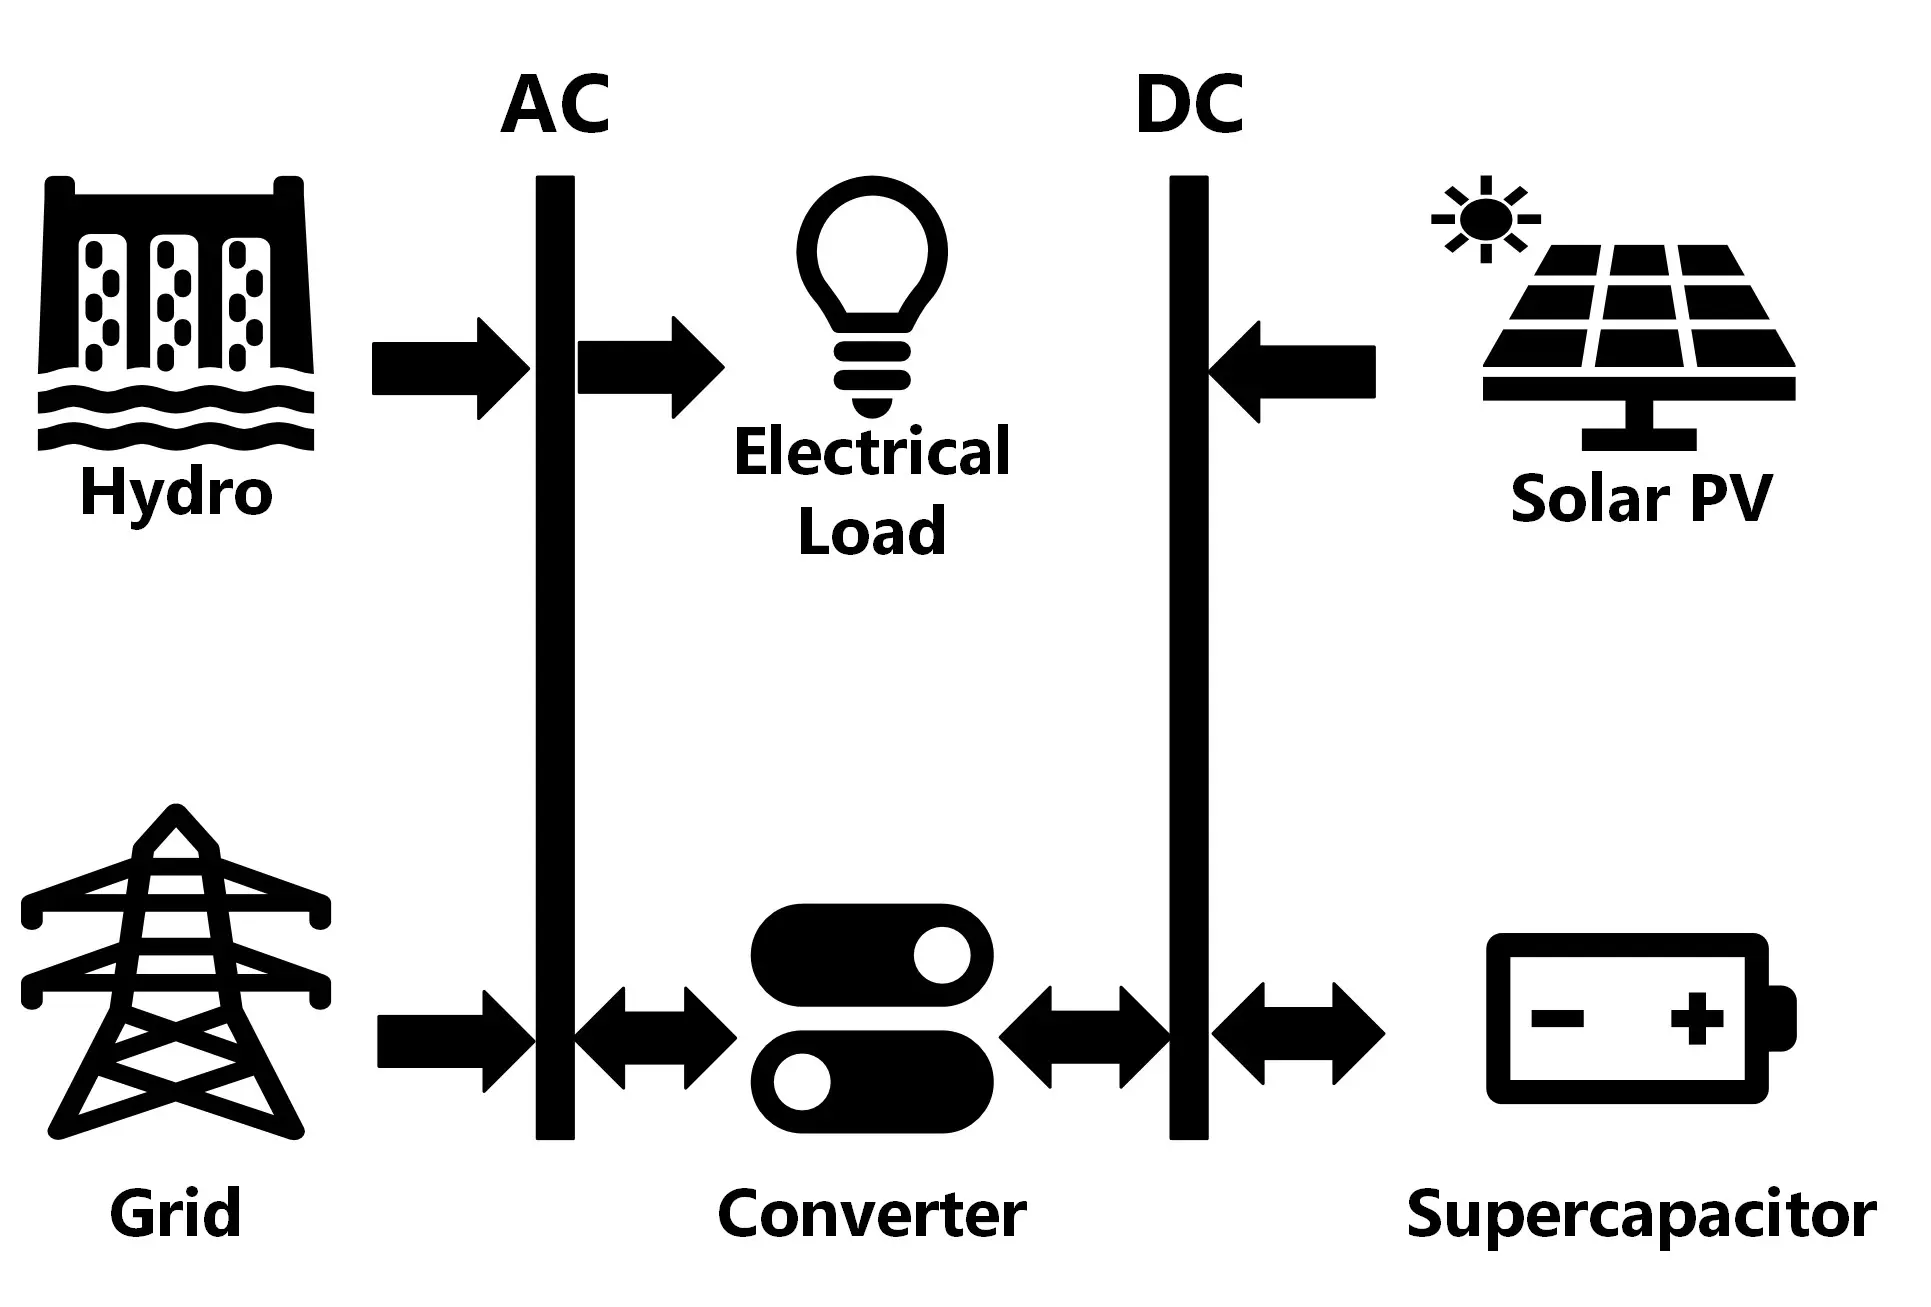
Scenario 1 (Figure 4) is the baseline of this study. It consists of a solar PV system connected to the grid, which is the most common energy system configuration in Malaysia due to the abundance of solar power in the country. Scenario 2 (Figure 5) combines the solar PV and hydropower energy sources along with an energy storage source (a battery) and a connection to the grid. This combination enables hydropower to complement solar PV by generating energy when the sun is not rising, and the use of batteries is crucial for storing excess energy for later use. Scenario 3 (Figure 6) studies the effect of adding a supercapacitor to a grid-connected solar PV system. The addition of a supercapacitor helps with rapid energy storage and discharge, making it ideal for balancing short-term fluctuations in solar energy output. Scenario 4 (Figure 7) tests the combination of grid-connected hydropower system with an energy storage system (a battery). This system was developed to see if the use of batteries is justifiable with hydropower systems. Finally, scenario 5 (Figure 8) combines a grid-connected solar PV and hydropower system with a supercapacitor to monitor the impact of adding a supercapacitor to the system, compared with adding a battery (scenario 2). In all configurations, the generic flat plate PV was used for initial architecture screening to ensure a consistent basis for evaluating system performance across all five configurations. Component-level optimization, including the evaluation of specific commercial PV panels, was conducted subsequently through sensitivity analysis in Section 4.2.1. The properties of the generic flat plate PV are tabulated in Table 4. These properties are presented by average values from different sources [47]. In addition, a converter comprising of an inverter and a rectifier is used in all scenarios. The inverter is used to convert the direct current from the solar panels and batteries into an alternating current, and the rectifier converts the alternating current into direct current to recharge the battery [48]. The properties of the converter used in this work are shown in Table 5 [47]. The energy storage technology used for scenario 2 and scenario 4 is the lithium-ion battery, which is one of the most common and mature batteries technology. Table 6 shows the properties of the lithium-ion battery used in this study [47]. The properties of the supercapacitor used in scenario 3 and scenario 5 are shown in Table 7 [47].
Table 3. The five scenarios developed in this study.
|
Scenario |
Configuration |
Description |
|---|---|---|
|
Scenario 1 (baseline) |
Grid-connection + Solar PV |
The baseline of this study. It consists of a solar PV system connected to the grid. The most common energy system configuration in Malaysia (IRENA). |
|
Scenario 2 |
Grid-connection + Solar PV + Hydropower + Battery |
combines the solar PV and hydropower energy sources along with an energy storage source (a battery) and a connection to the grid. |
|
Scenario 3 |
Grid-connection + Solar PV + Supercapacitor |
Adding a supercapacitor to a grid-connected solar PV system. |
|
Scenario 4 |
Grid-connection + Hydropower + Battery |
combination of grid-connected hydropower system with an energy storage system (a battery). |
|
Scenario 5 |
Grid-connection + Solar PV + Hydropower + Supercapacitor |
combines the grid-connected solar PV and hydropower system with a supercapacitor |
Table 4. The properties of the generic flat plate PV used in this study.
|
Parameters and Properties |
Values |
|---|---|
|
Type of PV Panel |
Flat Plate |
|
Rated capacity (kW) |
1 |
|
Capital cost (USD/kW) |
2500 |
|
Replacement cost (USD/kW) |
2500 |
|
Operations and maintenance (USD/kW/year) |
10 |
|
Lifetime (years) |
25 |
|
Derating factor (%) |
80 |
Table 5. The properties of the converter used in this study.
|
Parameters and Properties |
Values |
|---|---|
|
Type of Converter |
System Converter |
|
Capital cost (USD/kW) |
300 |
|
Replacement cost (USD/kW) |
300 |
|
Inverter’s lifetime (years) |
15 |
|
Inverter’s efficiency (%) |
95 |
|
Rectifier’s relative capacity (%) |
100 |
|
Rectifier’s efficiency (%) |
95 |
Table 6. The properties of the lithium-ion battery used in this study.
|
Parameters and Properties |
Values |
|---|---|
|
Nominal voltage (V) |
6 |
|
Nominal capacity (kWh) |
1 |
|
Nominal capacity (Ah) |
167 |
|
Roundtrip efficiency (%) |
90 |
|
Maximum charge current (A) |
167 |
|
Maximum discharge current (A) |
500 |
|
Capital cost (USD) |
550 |
|
Replacement cost (USD) |
550 |
|
Operations and maintenance (USD/year) |
10 |
|
Lifetime (years) |
15 |
|
Throughput (kWh) |
3000 |
|
Initial state of charge (%) |
100 |
|
Minimum state of charge (%) |
20 |
Table 7. The properties of the supercapacitor used in this study.
|
Parameters and Properties |
Values |
|---|---|
|
Nominal Voltage (V) |
3 |
|
Maximum charge current (A) |
2200 |
|
Maximum discharge current (A) |
2200 |
|
Rated capacitance (F) |
3000 |
|
Energy stored (Wh) |
3.75 |
|
Capital cost (USD/kW) |
100 |
|
Replacement cost (USD/kW) |
100 |
|
Lifetime (years) |
25 |
|
Initial state of charge (%) |
100 |
|
Minimum state of charge (%) |
0 |
3.4. Batteries Technical Specifications and Parameters
Battery performance is defined by a set of technical parameters that determine storage capacity, operational behavior, durability, and integration capability, which can be grouped into three categories: capacity-related metrics, charging and discharging characteristics, and operational specifications. In terms of capacity-related metrics, battery capacity defines the total charge available, while energy density influences system size and suitability for space-constrained or distributed applications. Lithium-ion batteries typically provide high energy density compared with mechanical storage systems, which offer lower density but much larger total capacity. Power density reflects how quickly energy can be delivered and is critical for fast-response services such as frequency regulation and peak shaving, while energy efficiency represents the fraction of stored energy recovered during discharge and directly affects cost effectiveness and environmental performance [12,24,26].
Regarding charging and discharging characteristics, response time determines how quickly the output can adjust to grid variations, with batteries generally providing faster control than bulk storage systems. Discharge duration depends on stored energy and operating rate, influencing suitability for short- or long-duration applications, while depth of discharge affects degradation and lifetime since deeper cycling accelerates wear. State of charge indicates remaining capacity and serves as a primary control variable in battery management systems, and cycle life measures the number of charge-discharge cycles before capacity declines to a defined threshold, strongly influenced by chemistry, temperature, and operating conditions. Finally, in terms of operational specifications, open-circuit voltage and operating temperature range further affect performance and reliability. The voltage-state of charge relationship is nonlinear and requires calibrated estimation models, and operating temperature significantly impacts efficiency, safety, and degradation rate, making thermal management essential for long-term system stability [12,24,26].
3.5. Key Performance Parameters
The key performance parameters for this work can be categorized into three main categories, namely, technical parameters, economic parameters, and environmental parameters. The technical parameters include renewable fraction, net energy production, and levelized cost of energy (LCOE). The economic parameters include the return on investment (ROI), the internal rate of return (IRR), and the payback period. The environmental parameters include carbon dioxide emissions, sulfur dioxide emissions, and nitrogen oxides emissions. The analysis of these main parameters is key to obtaining the optimal system for this study.
3.5.1. Technical Parameters
Renewable Fraction
The renewable fraction (fren) is defined as the ratio of the amount of energy delivered to the load from renewable sources to the total amount of energy delivered to the load. Renewable fraction can be calculated using Equation (2) [47]:
In the above notation,
fren: Renewable fraction, %.
Enonren: Non-renewable electrical production, kWh/year.
Eserved: Total electrical load served, kWh/year.
Hnonren: Non-renewable thermal production, kWh/year.
Hserved: Total thermal load served, kWh/year.
Net Energy Production
Net energy production (Enet) is defined as the difference between annual energy produced and annual energy consumed, and it is reported in kWh/year [47]. Equation (3) is used to calculate net energy production.
where, Eprod is the annual energy produced in kWh/year, Econs is the annual energy consumed in kWh/year, and Enet is the net energy produced throughout the year in kWh/year.
Levelized Cost of Energy
The levelized cost of energy (LCOE) is defined as the average cost per kWh of useful energy produced by the system throughout the life of the project, measured in USD/kWh. The LCOE serves as a comprehensive economic indicator that consolidates all system costs including capital expenditure, operational and maintenance costs, and component replacement costs over the project lifetime, providing a unified measure of economic feasibility that negates the need for separate CAPEX and OPEX analysis [47]. Equation (4) shows the formula used in this project to calculate the LCOE.
where, Cann_tot is the total annualized cost of the system in USD/year, and Eserved is the total electrical load served in a year in kWh/year.
3.5.2. Economic Parameters
Return on Investment
The return on investment (ROI) is defined as the yearly cost savings relative to the initial investment, reported in % per year [47]. Equation (5) is used in this project to calculate the ROI.
In the above notation,
ROI: Return on investment, %/year.
Ci,ref: Nominal annual cash flow for base (reference) system, USD.
Ci: Nominal annual cash flow for current system, USD.
Rproj: Life of the project, years.
Ccap: Capital cost of the current system, USD.
Ccap,ref: Capital cost of the base (reference) system, USD.
Internal Rate of Return
The internal rate of return (IRR) is defined as the discount rate at which the current system and the base system share the same net present cost [47]. IRR is reported in % and is calculated using Equation (6).
In the above notation,
IRR: Internal rate of return, %.
FV: Future value of the current project, USD.
PV: Present value of the current project, USD.
Period: Each time step, years.
Payback Period
Payback period is defined as the number of years required for the project to recover its initial investment. In other words, the payback period of any project is the year at which the net present value of this project is zero, and the project will start to make a profit after this point [47].
3.5.3. Environmental Parameters
The main environmental parameters in this study are the carbon dioxide emissions (CO2e), sulfur dioxide emissions (SO2e), and nitrogen oxides emissions (NOxe). The emission of each pollutant is calculated by multiplying the net grid sales by the emission factor of that pollutant. Equation (7) shows the formula to estimate the harmful emissions for the different pollutants. Table 8 shows the emission factor for CO2, SO2, and NOx [47].
where total grid electricity sales and total grid electricity purchases are in kWh/year, and the emission factor is in kg/kWh. This will result in the total emissions being in kg/year.
Table 8. Emission factor of the pollutants used in this study.
|
Pollutant |
Emission Factor (kg/kWh) |
|---|---|
|
Carbon Dioxide (CO2) |
0.632 |
|
Sulfur Dioxide (SO2) |
0.00274 |
|
Nitrogen Oxides (NOX) |
0.00134 |
4. Results and Discussion
The results are presented in two parts: primary and secondary analyses. The primary analysis evaluates system performance through techno-economic and environmental metrics, including renewable fraction, net energy production, levelized cost of energy, return on investment, internal rate of return, payback period, and emissions reductions for carbon dioxide, sulfur dioxide, and nitrogen oxides. The secondary analysis examines the robustness of the optimal configuration through sensitivity testing and qualitative assessment. Sensitivity analysis evaluates the impact of project lifetime, solar PV technology, storage technology, and battery initial state of charge, while a PESTEL framework is used to discuss political, economic, social, technological, environmental, and legal considerations.
4.1. Primary Analysis
4.1.1. Techno-Economic Analysis
Renewable Fraction
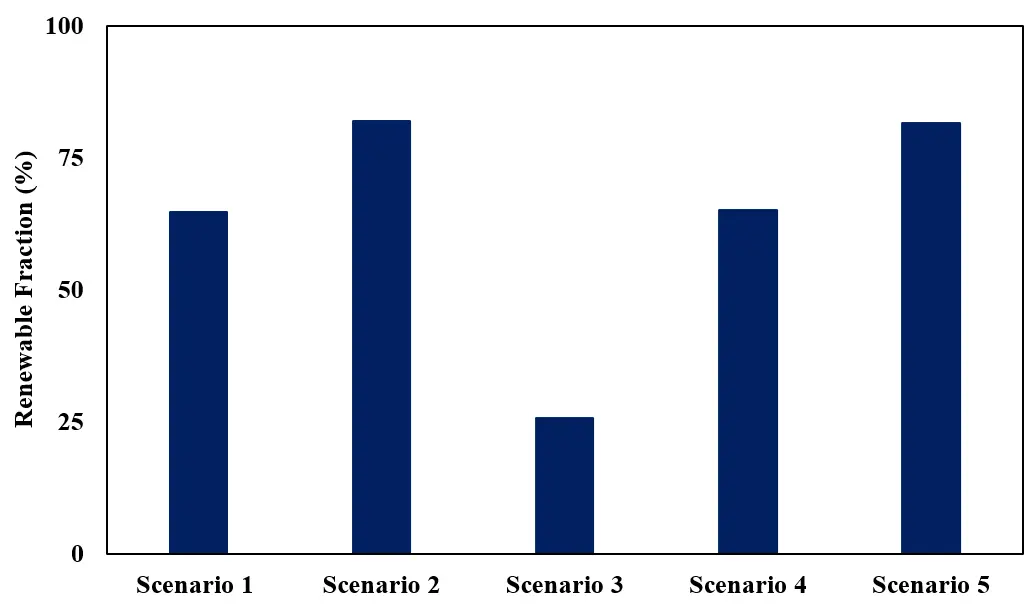
The renewable fraction was first evaluated across all scenarios. The baseline case (Scenario 1), consisting of a grid connected solar PV system without storage, achieved a renewable fraction of 64.8%. Adding both hydropower and energy storage (Scenario 2) significantly improved performance to 81.9%. Replacing the battery with a supercapacitor and removing hydropower (Scenario 3) produced the lowest value at 25.6%. A hydropower system with storage but without solar PV (Scenario 4) resulted in a renewable fraction of 65%. Finally, a hybrid solar–hydro configuration using a supercapacitor instead of a battery (Scenario 5) yielded 81.6%. The comparative results for all scenarios are shown in Figure 9.
Net Energy Production
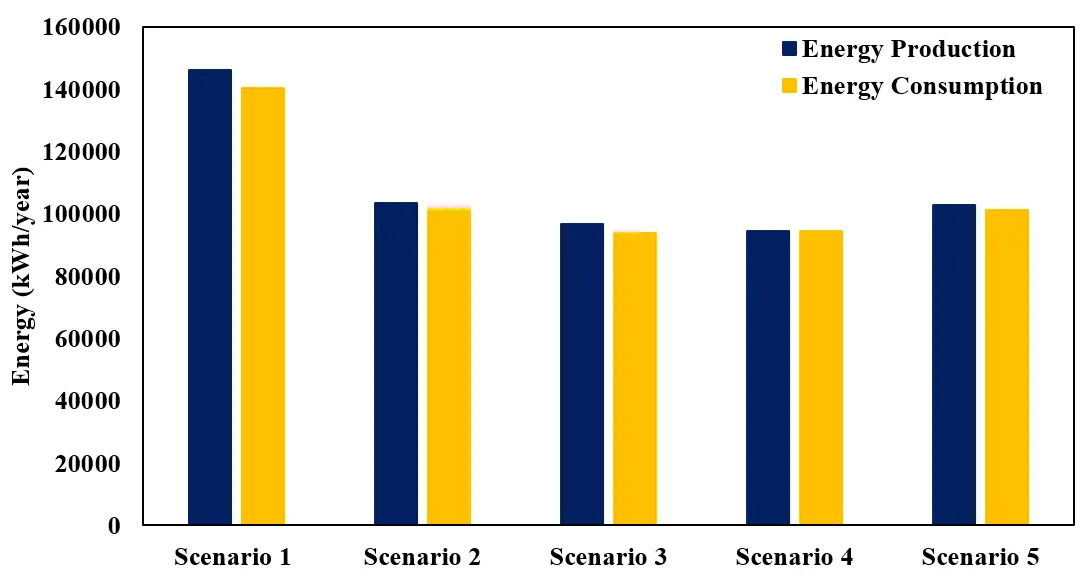
The second parameter evaluated was the annual net energy production. The baseline configuration (Scenario 1), consisting of a grid connected solar PV system without storage, produced 5743 kWh per year, the highest value due to the absence of hybrid integration and storage losses. Adding hydropower and battery storage (Scenario 2) reduced net production to 1936 kWh per year. Replacing the battery with a supercapacitor and removing hydropower (Scenario 3) increased the value to 3001 kWh per year. A hydropower system with storage but without solar PV (Scenario 4) produced no net energy and was therefore excluded from comparison. The hybrid solar–hydro system using a supercapacitor (Scenario 5) generated 1611 kWh per year. Net energy production comparison is shown in Figure 10.
Levelized Cost of Energy
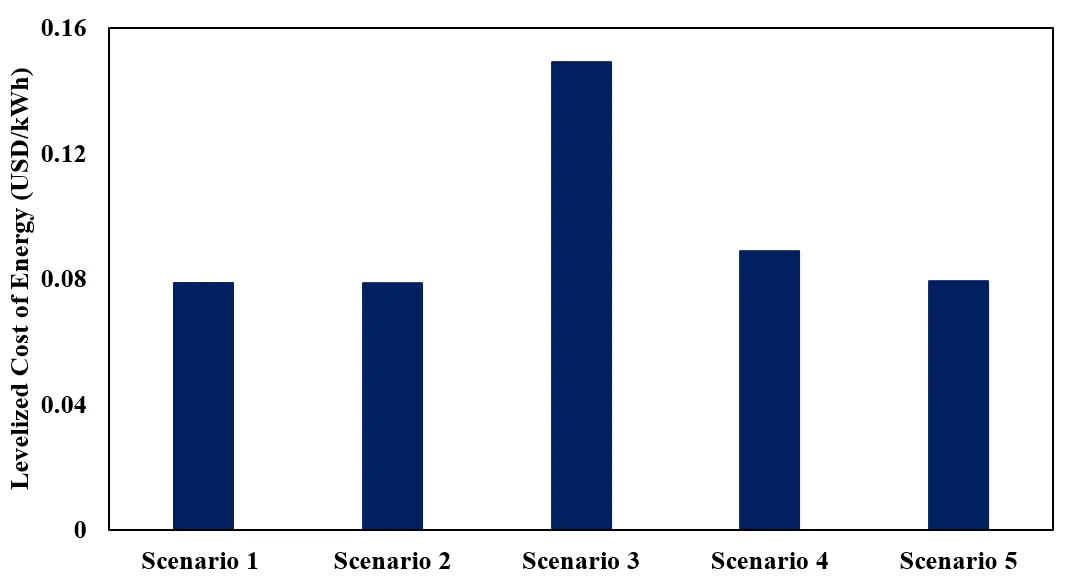
The third parameter evaluated was the levelized cost of energy (LCOE). The baseline solar PV system without storage (Scenario 1) produced an LCOE of 0.0785 USD per kWh. Adding hydropower and battery storage (Scenario 2) slightly increased the value to 0.0787 USD per kWh. Replacing the battery with a supercapacitor and removing hydropower (Scenario 3) significantly increased the LCOE to 0.149 USD per kWh due to the high cost of supercapacitors. A hydropower system with storage but without solar PV (Scenario 4) resulted in an LCOE of 0.0887 USD per kWh. The hybrid solar–hydro system using a supercapacitor (Scenario 5) yielded 0.0792 USD per kWh. Figure 11 presents the LCOE comparison across all scenarios.
Return on Investment
The fourth parameter evaluated was return on investment (ROI). The baseline solar PV system without storage (Scenario 1) achieved the highest ROI at 3.6% due to the absence of hybrid components and storage costs. Adding hydropower and battery storage (Scenario 2) reduced ROI to 2.5%. Replacing the battery with a supercapacitor and removing hydropower (Scenario 3) yielded the lowest ROI of 1.9% due to the higher supercapacitor cost. A hydropower system with storage but without solar PV (Scenario 4) resulted in a negative ROI and was therefore excluded. The hybrid solar–hydro system using a supercapacitor (Scenario 5) again yielded an ROI of 2.5%.
Internal Rate of Return
The fifth parameter evaluated was the internal rate of return (IRR). The baseline solar PV system without storage (Scenario 1) achieved the highest IRR at 5.8% due to the absence of hybrid components and storage costs. Adding hydropower and battery storage (Scenario 2) reduced the IRR to 4.2%. Replacing the battery with a supercapacitor and removing hydropower (Scenario 3) yielded the lowest IRR of 3.2% due to the higher supercapacitor cost. A hydropower system with storage but without solar PV (Scenario 4) resulted in a negative IRR and was therefore excluded. The hybrid solar–hydro system using a supercapacitor (Scenario 5) yielded an IRR of 4.1%. Figure 12 presents the IRR and ROI comparison across all scenarios.
Payback Period
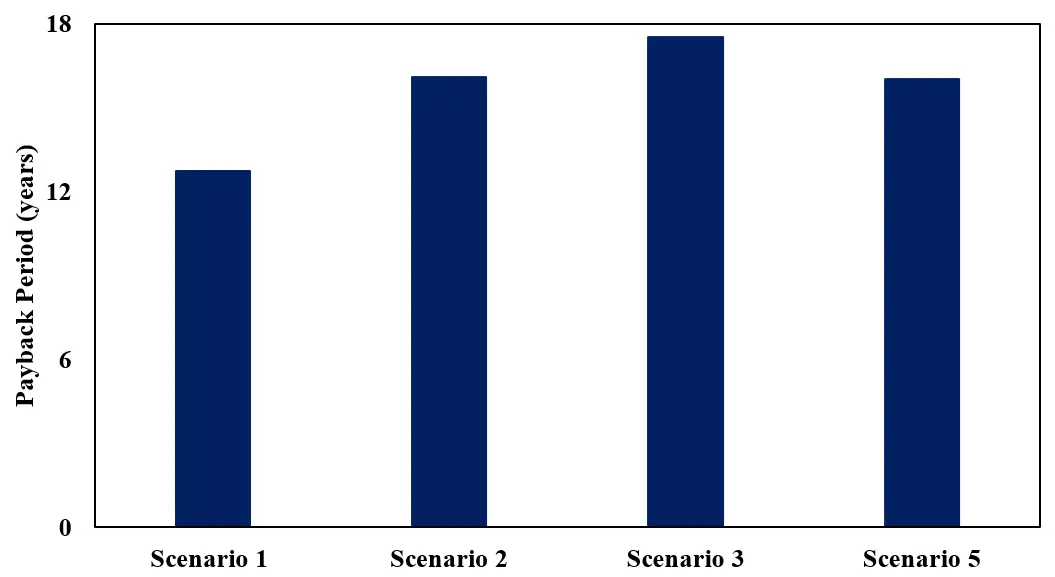
The sixth parameter evaluated was the payback period. The baseline solar PV system without storage (Scenario 1) had the shortest payback period at 12.7 years due to the absence of hybrid components and storage costs. Adding hydropower and battery storage (Scenario 2) increased the payback period to 16 years. Replacing the battery with a supercapacitor and removing hydropower (Scenario 3) produced the longest payback period at 17.5 years because of the higher supercapacitor cost. A hydropower system with storage but without solar PV (Scenario 4) was found to be infeasible. It was excluded from the comparison in Figure 12 and Figure 13. The hybrid solar-hydro system using a supercapacitor (Scenario 5) resulted in a payback period of 16 years. Figure 12 and Figure 13 present the results only for the feasible scenarios, excluding Scenario 4.
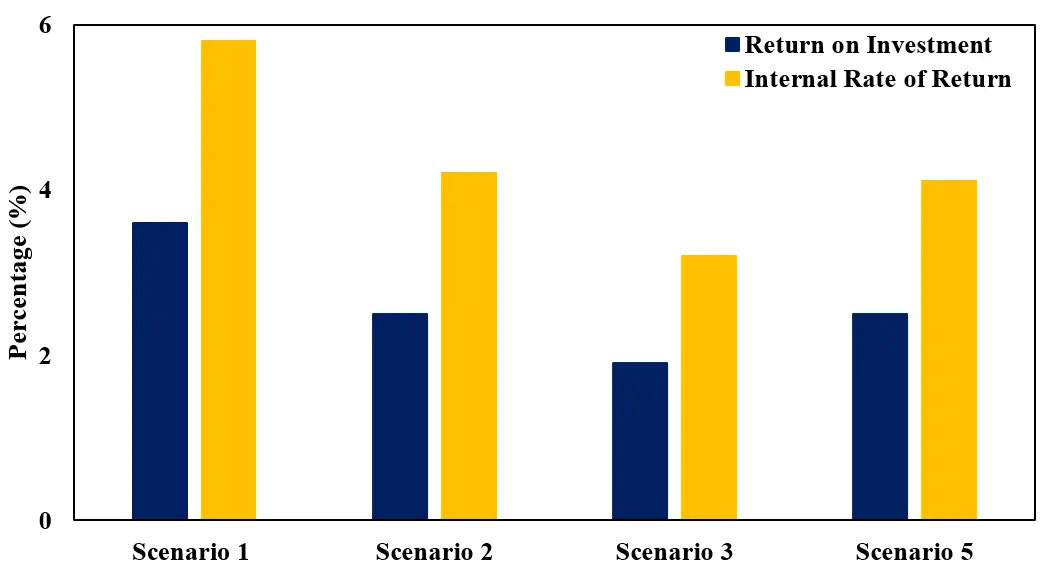
Figure 12. Comparison of all feasible scenarios in terms of return on investment and internal rate of return.
4.1.2. Environmental Analysis
Carbon Dioxide Emissions
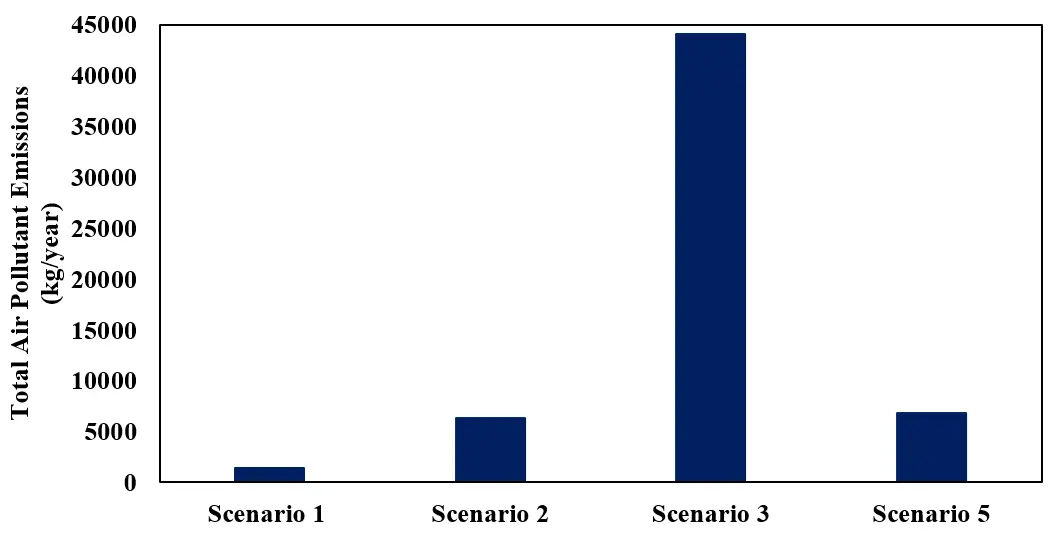
The seventh parameter evaluated was carbon dioxide (CO2) emissions. The baseline solar PV system without storage (Scenario 1) produced the lowest emissions at 1454 kg per year. Adding hydropower and battery storage (Scenario 2) increased emissions to 6341 kg per year. Replacing the battery with a supercapacitor and removing hydropower (Scenario 3) resulted in the highest emissions at 43,813 kg per year. A hydropower system with storage but without solar PV (Scenario 4) generated 20,174 kg per year. The hybrid solar–hydro system using a supercapacitor (Scenario 5) produced 6792 kg per year. The apparent contradiction between Scenario 2’s higher renewable fraction (81.9%) and its higher CO2 emissions compared to the baseline Scenario 1 requires careful interpretation. As defined in Equation (7), the emission calculation is based on net grid interaction, specifically the difference between total grid sales and total grid purchases, multiplied by Malaysia’s grid emission factor of 0.632 kg CO2/kWh, which reflects the carbon intensity of the national grid mix that remains partially fossil fuel driven. Scenario 1, a simple solar-only configuration, engages modestly with the grid, resulting in a net grid sales volume of approximately 2301 kWh/year and consequently low attributed emissions. Scenario 2, by incorporating both solar PV and hydropower, generates significantly more total electricity, with a substantial portion exported to the grid, yielding a net grid sales volume of approximately 10,033 kWh/year. Since the emission factor is applied to this larger transaction volume, the attributed emissions are higher despite the greater renewable penetration. This reflects a metric boundary condition inherent to grid-connected systems: higher renewable generation increases grid exports, and those exports are attributed with emissions based on the prevailing grid carbon intensity rather than the clean origin of the exported electricity. Accordingly, Scenario 2 should not be interpreted as environmentally inferior to Scenario 1, but rather as the lowest-emission configuration among all hybrid multi-source scenarios evaluated.
Sulfur Dioxide Emissions
The eighth parameter evaluated was sulfur dioxide (SO2) emissions. The baseline solar PV system without storage (Scenario 1) produced the lowest emissions at 6.3 kg per year. Adding hydropower and battery storage (Scenario 2) increased emissions to 27.5 kg per year. Replacing the battery with a supercapacitor and removing hydropower (Scenario 3) resulted in the highest emissions at 190 kg per year. A hydropower system with storage but without solar PV (Scenario 4) generated 87.5 kg per year. The hybrid solar–hydro system using a supercapacitor (Scenario 5) produced 29.4 kg per year.
Nitrogen Oxides Emissions
The ninth and final parameter evaluated was nitrogen oxides (NOx) emissions. The baseline solar PV system without storage (Scenario 1) produced the lowest emissions at 3.1 kg per year. Adding hydropower and battery storage (Scenario 2) increased emissions to 13.4 kg per year. Replacing the battery with a supercapacitor and removing hydropower (Scenario 3) resulted in the highest emissions at 92.9 kg per year. A hydropower system with storage but without solar PV (Scenario 4) generated 42.8 kg per year. The hybrid solar–hydro system using a supercapacitor (Scenario 5) produced 14.4 kg per year. Figure 14 presents the sum of CO2, SO2, and NOx emissions across all feasible scenarios excluding scenario 4.
4.1.3. Optimal Energy System
After evaluating all performance metrics, including technical, economic, and environmental indicators, Scenario 2, a hybrid grid connected solar PV and hydropower system with battery storage, was identified as the optimal configuration. This scenario achieved the highest renewable fraction (81.9%), low LCOE (0.0787 USD per kWh), favorable financial performance (ROI 2.5%, IRR 4.2%, and a 16-year payback period), and the lowest emissions among the hybrid configurations (6341 kg per year CO2, 28 kg per year SO2, and 13 kg per year NOx). The baseline solar PV only system (Scenario 1) was used solely for comparison and was not considered in the selection process. The selected configuration was subsequently subjected to sensitivity analysis to evaluate the impact of key input parameters on system performance. Table 9 summarizes the primary analysis results. Scenario 4, a grid-connected hydropower system with battery storage and no solar PV, was found to be technically infeasible under the simulated conditions, as it produced zero net energy and yielded negative economic indicators. It is retained in Table 9 for completeness but excluded from economic and environmental comparisons.
Table 9. Summary of the primary analysis results.
|
Scenario |
1 |
2 |
3 |
4 |
5 |
|---|---|---|---|---|---|
|
fren (%) |
64.8 |
81.9 |
25.6 |
65.0 |
81.6 |
|
Enet (kWh/year) |
5743 |
1936 |
3001 |
0 |
1611 |
|
LCOE (USD/kWh) |
0.0785 |
0.0787 |
0.1490 |
0.0887 |
0.0792 |
|
ROI (%) |
3.6 |
2.5 |
1.9 |
n.a. |
2.5 |
|
IRR (%) |
5.8 |
4.2 |
3.2 |
n.a. |
4.1 |
|
Payback Period (years) |
13 |
16 |
18 |
n.a. |
16 |
|
CO2e (kg/year) |
1454 |
6341 |
43,813 |
20,174 |
6792 |
|
SO2e (kg/year) |
6 |
28 |
190 |
88 |
29 |
|
NOxe (kg/year) |
3 |
13 |
93 |
43 |
14 |
n.a (not available).
4.2. Secondary Analysis
4.2.1. Sensitivity Analysis
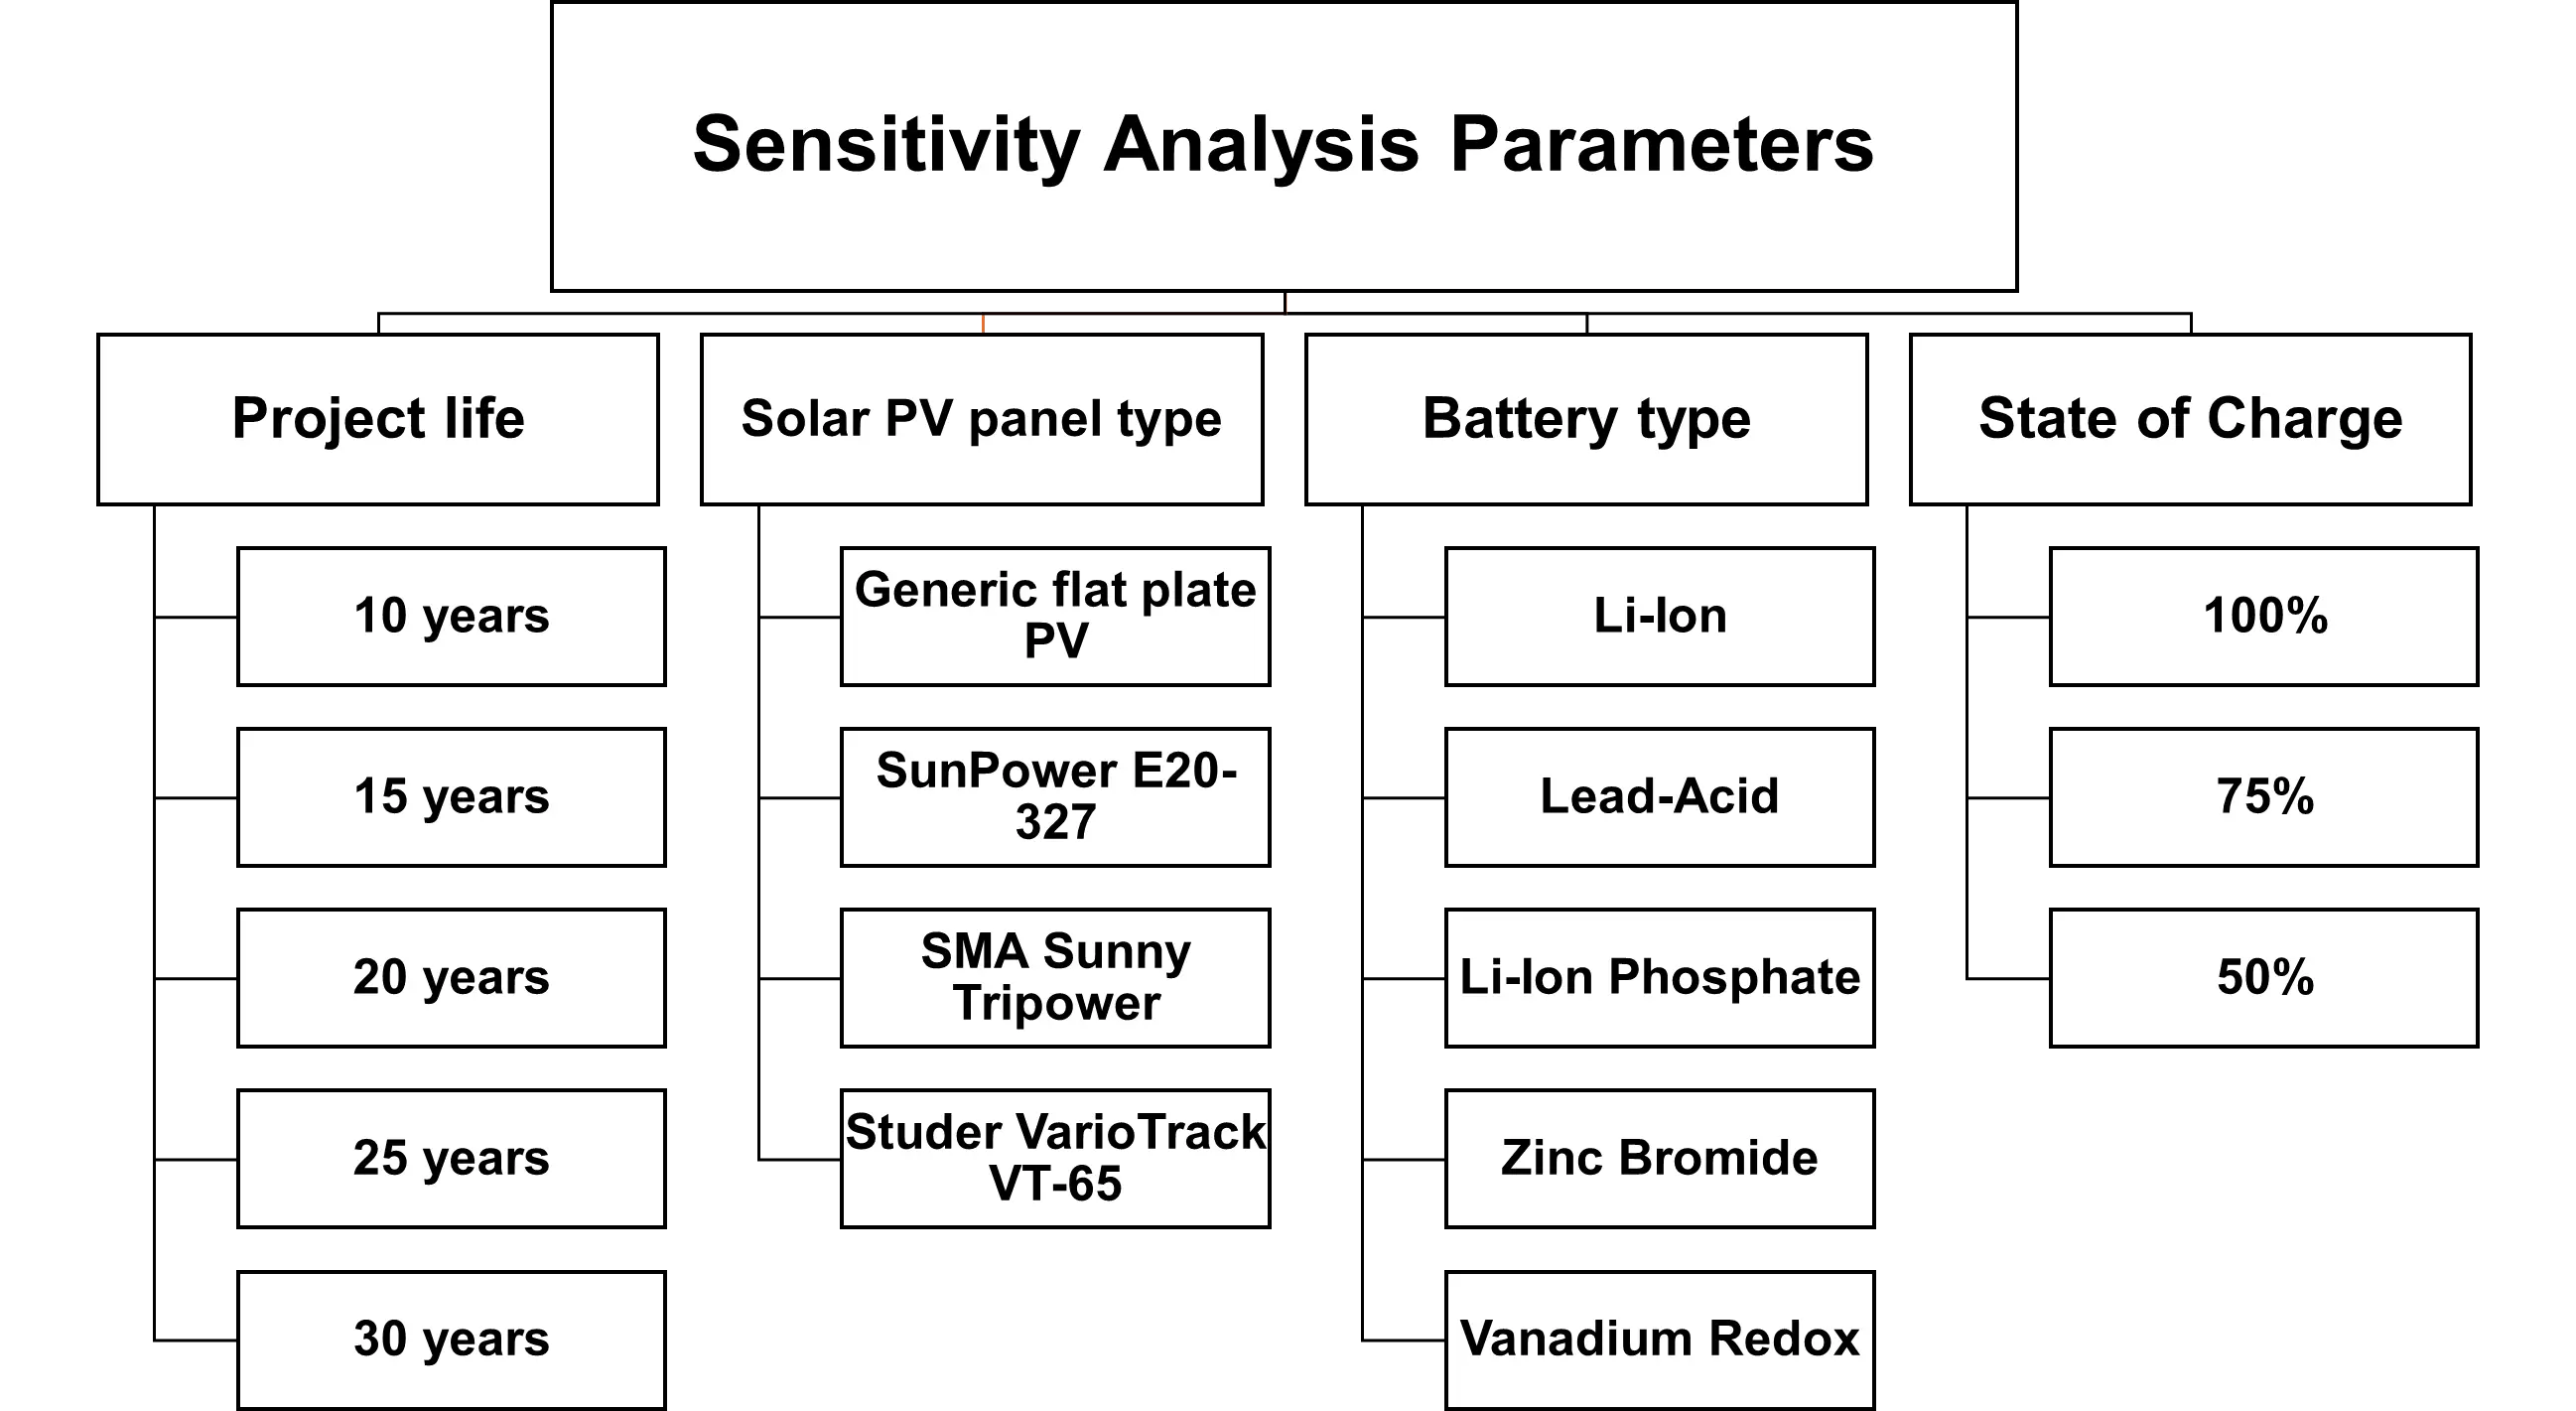
Sensitivity analysis is a systematic technique used to quantify the relative influence of input variables on model outputs by isolating the effect of each variable while holding others constant. Dwier et al. (2024) demonstrated such a technique by examining how the exclusion or modification of specific input variables influenced the precision of empirical model predictions [49]. In the context of hybrid energy storage systems, Citalingam and Go (2022) applied sensitivity analysis to evaluate the influence of battery initial state of charge on key techno-economic parameters. These include annual throughput, renewable fraction and levelized cost of energy, which confirmed that the initial state of charge is a critical variable in energy storage performance assessment [50]. For this study, sensitivity analysis will only be applied to Scenario 2, the identified optimal system, across four parameters: project lifetime, solar PV panel type, battery type, and battery’s initial state of charge. Figure 15 shows all the sensitivity analysis parameters used in this study.
Effect of Varying the Life of the Project on the Optimal System
The base case assumed a project lifetime of 25 years. Additional cases of 10, 15, 20, and 30 years were evaluated using the same performance metrics, including renewable fraction, net energy production, LCOE, ROI, IRR, payback period, and emissions (CO2, SO2, and NOx). The results are summarized in Table 10. The 25-year lifetime provided the best overall performance, yielding the highest renewable fraction (81.9%), highest net energy production (1936 kWh per year), highest IRR (4.2%), and the lowest emissions (6341 kg per year CO2, 27.5 kg per year SO2, and 13.4 kg per year NOx). Although a 30-year lifetime slightly improved economic indicators, including a marginally lower LCOE (0.078 USD per kWh), slightly higher ROI (2.6%), and a slightly shorter payback period (16.01 years), the improvement was minimal and unlikely to justify the additional operating period once maintenance and replacement costs are considered. Shorter project lifetimes of 10, 15, and 20 years were economically unattractive.
Table 10. Sensitivity of the optimal energy system parameters to change in its life.
|
Project Life (Years) |
10 |
15 |
20 |
25 |
30 |
|---|---|---|---|---|---|
|
fren (%) |
67.1 |
66.9 |
66.9 |
81.9 |
81.6 |
|
Enet (kWh/year) |
171 |
100 |
100 |
1936 |
1620 |
|
LCOE (USD/kWh) |
0.103 |
0.095 |
0.091 |
0.079 |
0.078 |
|
ROI (%) |
1.4 |
1.3 |
1.3 |
2.5 |
2.6 |
|
IRR (%) |
1.7 |
1.9 |
2.0 |
4.2 |
4.1 |
|
Payback Period (years) |
9.77 |
14.48 |
19.27 |
16.08 |
16.01 |
|
CO2e (kg/year) |
18,869 |
18,993 |
18,993 |
6341 |
6775 |
|
SO2e (kg/year) |
81.8 |
82.3 |
82.3 |
27.5 |
29.4 |
|
NOxe (kg/year) |
40.0 |
40.3 |
40.3 |
13.4 |
14.4 |
Effect of Changing the Solar PV Panel Type on the Optimal System
The base case used a generic flat plate PV module. Three additional panel types were evaluated: SunPower E20-327, SMA Sunny Tripower, and Studer VarioTrack VT-65. The same performance metrics were assessed, including renewable fraction, net energy production, LCOE, ROI, IRR, payback period, and emissions (CO2, SO2, and NOx). Results are summarized in Table 11. Among the tested options, the SunPower E20-327 panel provided the best overall performance, achieving the highest renewable fraction (82.3%), lowest LCOE (0.077 USD per kWh), highest ROI (2.8%), shortest payback period (15.4 years), and lowest emissions (5918 kg per year CO2, 25.7 kg per year SO2, and 12.5 kg per year NOx). Although the generic flat plate PV produced slightly higher net energy (1936 kWh per year versus 1875 kWh per year), the SunPower panel was selected due to superior economic and environmental performance across the remaining metrics.
Table 11. Sensitivity analysis of optimal energy system designs and parameters.
|
PV Type |
Generic Flat Plate PV |
SunPower E20-327 |
SMA Sunny Tripower |
Studer VarioTrack VT-65 |
|---|---|---|---|---|
|
fren (%) |
81.90 |
82.30 |
67.10 |
67.10 |
|
Enet (kWh/year) |
1936 |
1875 |
144 |
117 |
|
LCOE (USD/kWh) |
0.079 |
0.077 |
0.088 |
0.088 |
|
ROI (%) |
2.5 |
2.8 |
1.1 |
1.2 |
|
IRR (%) |
4.2 |
4.6 |
2 |
2.1 |
|
Payback Period (years) |
16.08 |
15.35 |
21.05 |
20.73 |
|
CO2e (kg/year) |
6341 |
5918 |
18,876 |
18,857 |
|
SO2e (kg/year) |
27.5 |
25.7 |
81.8 |
81.8 |
|
NOxe (kg/year) |
13.4 |
12.5 |
40 |
40 |
Effect of Changing the Battery Type on the Optimal System
The base case used a generic 1 kWh lithium-ion battery. Additional storage options evaluated included a generic 1 kWh lead acid battery, a lithium iron phosphate battery (TROES), a 1 kWh zinc bromide flow battery, and the UET Reflex Product V7 system. These technologies represent both mature batteries (lithium ion, lead acid, and lithium iron phosphate) and emerging storage options (zinc bromide and vanadium redox flow batteries). Performance metrics included renewable fraction, net energy production, LCOE, ROI, IRR, payback period, and emissions (CO2, SO2, and NOx). Results are summarized in Table 12, while Figure 16 and Figure 17 present the sensitivity of net energy production and LCOE to battery type, respectively. The zinc bromide flow battery demonstrated the best overall performance, achieving the highest renewable fraction (82.8%), highest net energy production (2596 kWh per year), lowest LCOE (0.057 USD per kWh), highest ROI (4.4%), highest IRR (7%), and shortest payback period (12.1 years). Although its emissions were slightly higher than other battery options, the increase was minor relative to the substantial technical and economic improvements, leading to its selection as the preferred storage technology.
Table 12. Sensitivity of the optimal energy system parameters to a change in the type of battery used.
|
Battery Type |
Generic 1 kWh Li-Ion |
Generic 1 kWh Lead Acid |
TROES Li-Ion Phosphate |
UET Reflex Product V7 |
Generic 1 kWh Zinc Bromide Flow Battery |
|---|---|---|---|---|---|
|
Battery Material |
Li-Ion |
Lead-Acid |
Li-Ion Phosphate |
Vanadium Redox |
Zinc Bromide |
|
Technical Maturity |
Mature |
Mature |
Mature |
Emerging |
Emerging |
|
fren (%) |
81.90 |
81.90 |
81.90 |
82.00 |
82.80 |
|
Enet (kWh/year) |
1936 |
1936 |
1829 |
1393 |
2596 |
|
LCOE (USD/kWh) |
0.079 |
0.079 |
0.083 |
0.083 |
0.057 |
|
ROI (%) |
2.5 |
2.5 |
1.7 |
1.7 |
4.4 |
|
IRR (%) |
4.2 |
4.2 |
2.9 |
2.9 |
7 |
|
Payback Period (years) |
16.08 |
15.91 |
18.08 |
17.75 |
12.06 |
|
CO2e (kg/year) |
6341 |
6341 |
6423 |
6148 |
6797 |
|
SO2e (kg/year) |
27.5 |
27.5 |
27.8 |
26.7 |
29.5 |
|
NOxe (kg/year) |
13.4 |
13.4 |
13.6 |
13.0 |
14.4 |
Effect of Varying the Battery’s Initial State of Charge on the Optimal System
The base case assumed an initial state of charge (SOC) of 100%. Additional cases of 75% and 50% initial SOC were evaluated to reflect realistic conditions such as aging, temperature effects, manufacturing tolerances, and operational losses. This analysis was conducted using the zinc bromide flow battery, previously identified as the optimal storage technology. The same performance metrics were assessed, and the results are summarized in Table 13. All performance indicators were optimal at 100% initial SOC. Reducing the initial SOC to 75% led to a 15.22% decrease in renewable fraction, an 84.24% decrease in net energy production, a 17.54% increase in LCOE, and a 151% increase in emissions. At 50% initial SOC, the renewable fraction declined by 15.70%, net energy production decreased by 99.85%, LCOE increased by 17.54%, and emissions rose by 155%. These results highlight the strong sensitivity of system performance to initial battery charge conditions.
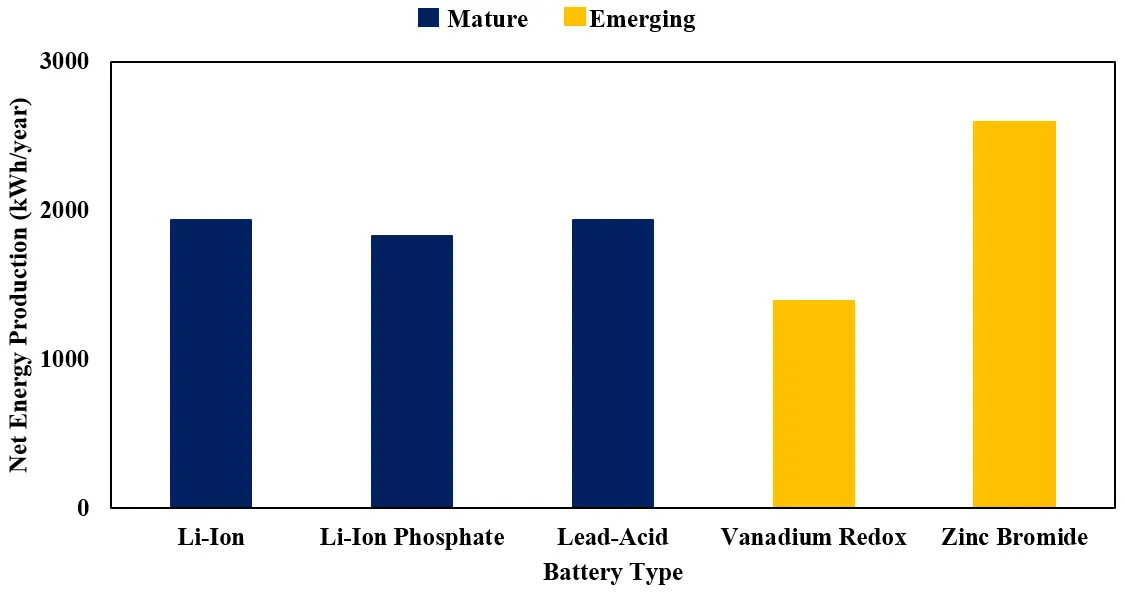
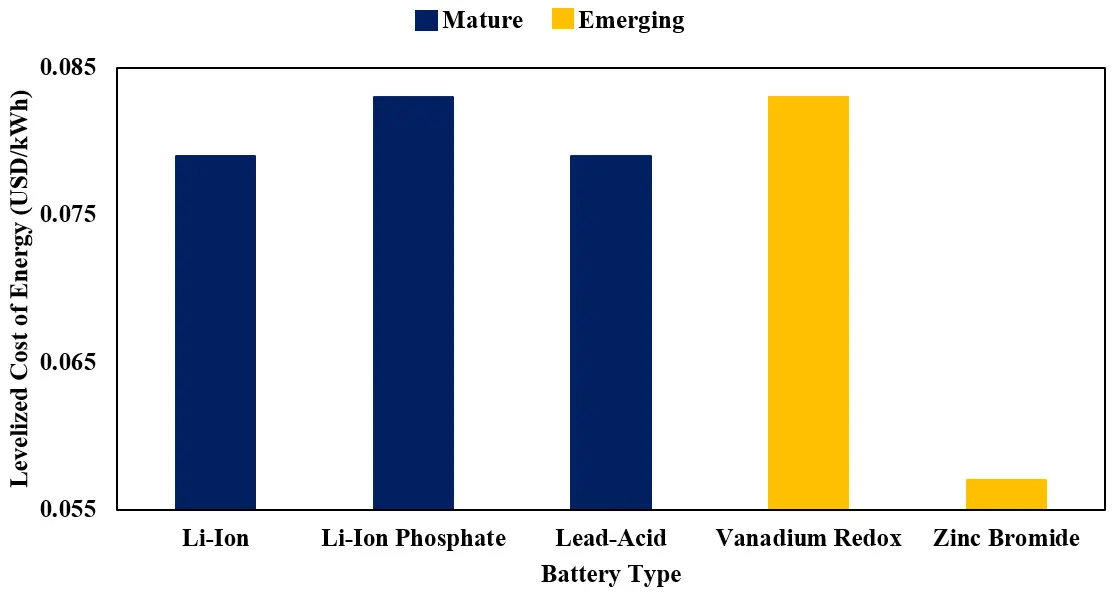
Table 13. Sensitivity of the optimal energy system parameters to change in the battery’s initial state of charge.
|
Parameters and Properties |
Values |
||
|---|---|---|---|
|
State of Charge (%) |
100 |
75 |
50 |
|
fren (%) |
82.80 |
70.20 |
69.80 |
|
Change in fren (%) |
- |
−15.22 |
−15.70 |
|
Enet (kWh/year) |
2596 |
409 |
4 |
|
Change in Enet (%) |
- |
−84.24 |
−99.85 |
|
LCOE (USD/kWh) |
0.057 |
0.067 |
0.067 |
|
Change in LCOE (%) |
- |
17.54 |
17.54 |
|
CO2e (kg/year) |
6797 |
17,081 |
17,342 |
|
Change in CO2e (%) |
- |
151.30 |
155.14 |
|
SO2e (kg/year) |
29.5 |
74.1 |
75.2 |
|
Change in SO2e (%) |
- |
151.19 |
154.92 |
|
NOxe (kg/year) |
14.4 |
36.2 |
36.8 |
|
Change in NOxe (%) |
- |
151.39 |
155.56 |
4.2.2. Qualitative Analysis: PESTEL Framework
A qualitative assessment was conducted using the PESTEL framework to examine the political, economic, social, technological, environmental, and legal factors affecting the implementation of hybrid energy storage systems in Malaysia. The PESTEL [51] approach was selected because it evaluates external macro-environmental conditions, which are critical for large scale energy infrastructure projects. For example, large scale solar system [52] which involved renewable integration and emerging technologies. It provides a structured assessment of external risks and opportunities that may influence project feasibility and long-term sustainability. Table 14 summarizes the PESTEL analysis for this study.
Table 14. PESTEL framework of this study.
|
PESTEL Factor |
Description |
Impact on Project |
|---|---|---|
|
Political |
Government Policies and Support |
Malaysia’s MyRER and National Energy Transition Roadmap (NETR) provide strategic direction for renewable energy deployment. SEDA Malaysia oversees feed-in tariff mechanisms and renewable energy certification, directly supporting grid-connected hybrid projects [32,33,51] |
|
International Agreements |
Malaysia’s commitments under the Paris Agreement and its Nationally Determined Contributions encourage reduction of fossil fuel dependence and expansion of clean electricity generation [32] |
|
|
Economic |
Economic Growth and Energy Demand |
Hybrid storage systems can improve electricity reliability and support Malaysia’s industrial growth. TNB’s grid infrastructure and tariff structure directly influence the economics of grid-connected systems [33,51] |
|
Funding and Investment |
Fiscal incentives like GITA, GITE under Malaysia’s green technology financing scheme reduce capital barriers for large-scale renewable projects [33,51] |
|
|
Social |
Public Awareness and Acceptance |
Increasing public interest in sustainability supports renewable adoption, but community engagement remains necessary particularly for projects near populated areas such as Lenggong, Perak [51] |
|
Impact on Local Communities |
The project supports local economic development through job creation while minimizing environmental disruption to communities surrounding the Kenering hydroelectric facility [32]. |
|
|
Technological |
Advancements in Energy Storage |
Emerging storage technologies such as zinc bromide and vanadium redox flow batteries offer improved cycle life and scalability for grid-connected applications in Malaysia [33]. |
|
Grid Integration and Smart Technologies |
Integration with TNB’s national grid requires compliance with Grid Code requirements, smart metering standards under Malaysia’s NEM policy framework [33,51], solar PV tracking [53] to support site-adaptive optimisation. |
|
|
Environmental |
Renewable Energy Potential |
Malaysia’s rich solar irradiance and existing hydropower infrastructure at Kenering provide strong renewable potential. IRENA confirms Malaysia’s favorable conditions for hybrid renewable deployment [32,33] |
|
Environmental Regulations |
Projects must comply with Malaysia’s EIA requirements under the Environmental Quality Act 1974, ensuring proper management of emissions, waste, and ecological impact [33,51] |
|
|
Legal |
Regulatory Compliance |
The project must comply with the Electricity Supply Act 1990, Renewable Energy Act 2011, and SEDA’s licensing requirements for grid-connected renewable systems [33,51] |
|
Intellectual Property Rights |
Protection of innovations in emerging storage technologies such as zinc bromide and vanadium redox systems is important for securing competitive advantage and encouraging further R&D investment in Malaysia [51] |
5. Conclusions and Recommendations
This research focused on developing and optimizing hybrid energy storage systems integrated with renewable energy sources, specifically for grid-connected scenarios. The study investigated several configurations, assessing key performance parameters such as the renewable fraction, net energy production, levelized cost of energy (LCOE), return on investment (ROI), internal rate of return (IRR), payback period, and environmental impact, including carbon dioxide (CO2), sulfur dioxide (SO2), and nitrogen oxides (NOx) emissions. The key results indicated that the most optimal system configuration included a combination of grid-connected solar PV and hydropower with SunPower E20-327 solar PV panels, and a Zinc Bromide flow battery. This configuration achieved the highest renewable fraction of 82.8%, the highest net energy production of 2596 kWh/year, the lowest LCOE of 0.057 USD/kWh, the highest return on investment of 4.4%, the highest internal rate of return of 7%, and the shortest payback period of 12.1 years. The SunPower PV-only case achieved a CO2 reduction of 5918 kg/year. When the zinc bromide battery was included, the optimized PV-battery case achieved reductions of 6797 kg/year CO2, 29.5 kg/year SO2, and 14.4 kg/year NOx.
The significance of this work lies in its potential to contribute to the broader goals of decarbonizing energy systems and supporting the transition to renewable energy. The findings provide a viable pathway to enhance energy security and reduce greenhouse gas emissions, which are critical to meeting global sustainability targets, including those outlined in the Paris Agreement. Given the location of this project in Malaysia, the Malaysian government and regional policymakers will benefit from this project’s alignment with national energy goals, such as those outlined in the Malaysia Renewable Energy Roadmap (MyRER), which aims to increase the share of renewable energy in the national grid. Utility companies and independent power producers in Malaysia will also gain from the increased efficiency and cost-effectiveness of hybrid energy storage systems, which can stabilize the grid and reduce the country’s reliance on fossil fuels. Additionally, businesses within the renewable energy and biomass sectors, as well as investors focused on sustainable technologies, will find new opportunities for growth and innovation.
To further incentivize the adoption of renewable energy and storage systems, a carbon tax should be considered. This would help in internalizing the environmental costs associated with conventional energy sources. Governments and policymakers should provide subsidies or financial incentives for emerging energy storage technologies, such as Zinc Bromide flow batteries, to accelerate their deployment and reduce overall costs. It is also recommended to establish long-term policies that support the integration of hybrid energy storage systems into the grid, ensuring that these systems are financially viable and widely adopted.
Future research should focus on the integration of biomass as an additional renewable energy source into the hybrid system, given Malaysia’s abundant biomass resources from palm oil, timber, and other agricultural industries. Investigating the performance of biomass systems and optimizing their integration with hybrid energy storage systems could enhance both economic and environmental benefits. Furthermore, future studies should explore the potential of other battery technologies, such as solid-state batteries or advanced flow batteries, to improve energy storage efficiency and sustainability.
Author Contributions
Methodology, S.K.D.; Software, S.K.D.; Formal Analysis, S.K.D.; Data Curation, S.K.D.; Writing—Original Draft Preparation, S.K.D.; Writing—Review & Editing, Y.I.G.; Visualization, S.K.D.; Supervision, Y.I.G.
Ethics Statement
Not applicable.
Informed Consent Statement
Not applicable.
Data Availability Statement
All data are included in this manuscript.
Funding
This research received no external funding.
Declaration of Competing Interest
The authors declare that they have no known competing financial interests or personal relationships that could have appeared to influence the work reported in this paper.
References
- Gielen D, Boshell F, Saygin D, Bazilian MD, Wagner N, Gorini R. The role of renewable energy in the global energy transformation. Energy Strategy Rev. 2019, 24, 38–50. DOI:10.1016/j.esr.2019.01.006 [Google Scholar]
- Energy Institute. Statistical Review of World Energy; The Energy Institute: London, UK, 2024. [Google Scholar]
- Ahmed AA, Alsharif A, Yasser N. Recent Advances in Energy Storage Technologies. Int. J. Electr. Eng. Sustain. 2023, 1, 9–17. DOI:10.65998/ijees.v1i1.11 [Google Scholar]
- Amir M, Deshmukh RG, Khalid HM, Said Z, Raza A, Muyeen SM, et al. Energy storage technologies: An integrated survey of developments, global economical/environmental effects, optimal scheduling model, and sustainable adaption policies. J. Energy Storage 2023, 72, 108694. DOI:10.1016/j.est.2023.108694 [Google Scholar]
- Dincer I, Abu-Rayash A. Chapter 5—Community energy systems. In Energy Sustainability; Academic Press: Cambridge, MA, USA, 2020; pp. 101–118. [Google Scholar]
- Worku AK, Ayele DW, Habtu NG, Admasu BT, Alemayehu G, Taye BZ, et al. Chapter 7: Energy Storage Technologies; Recent Advances, Challenges, and Prospectives. In Planning of Hybrid Renewable Energy Systems, Electric Vehicles and Microgrid; Springer: Singapore, 2022; pp. 125–150. [Google Scholar]
- Gür TM. Materials and technologies for energy storage: Status, challenges, and opportunities. MRS Bull. 2021, 46, 1153–1163. DOI:10.1557/s43577-021-00242-w [Google Scholar]
- Dowling JA, Rinaldi KZ, Ruggles TH, Davis SJ, Yuan M, Tong F, et al. Role of Long-Duration Energy Storage in Variable Renewable Electricity Systems. Joule 2020, 4, 1907–1928. DOI:10.1016/j.joule.2020.07.007 [Google Scholar]
- Zhao H, Guo W. Coordinated control method of multiple hybrid energy storage systems based on distributed event-triggered mechanism. Int. J. Electr. Power Energy Syst. 2021, 127, 106637. DOI:10.1016/j.ijepes.2020.106637 [Google Scholar]
- Rahman MM, Oni AO, Gemechu E, Kumar A. Assessment of energy storage technologies: A review. Energy Convers. Manag. 2020, 223, 113295. DOI:10.1016/j.enconman.2020.113295 [Google Scholar]
- Mahmoud M, Ramadan M, Olabi AG, Pullen K, Naher S. A review of mechanical energy storage systems combined with wind and solar applications. Energy Convers. Manag. 2020, 210, 112670. DOI:10.1016/j.enconman.2020.112670 [Google Scholar]
- Mitali J, Dhinakaran S, Mohamad AA. Energy storage systems: A review. Energy Storage Sav. 2022, 1, 166–216. DOI:10.1016/j.enss.2022.07.002 [Google Scholar]
- Kumar N, Prabhansu. (Eds.). 1—Artificial intelligence and machine learning applications in energy storage system: Technology overview and perspectives. In Emerging Trends in Energy Storage Systems and Industrial Applications; Academic Press: Cambridge, MA, USA, 2023; pp. 1–26. [Google Scholar]
- Ali HM, Rehman TU, Arıcı M, Said Z, Duraković B, Mohammed HI, et al. Advances in thermal energy storage: Fundamentals and applications. Prog. Energy Combust. Sci. 2024, 100, 101109. DOI:10.1016/j.pecs.2023.101109 [Google Scholar]
- Liu A, Liang X, Ma T. Chapter 9—MXenes and their composites for lithium- and sodium-ion battery applications. In Mxenes and their Composites; Sadasivuni KK, Deshmukh K, Pasha S, Kovářík T, Eds.; Elsevier: Amsterdam, The Netherlands, 2022; pp. 307–341 [Google Scholar]
- Bogdanov S, Pugach M, Parsegov S, Vlasov V, Ibanez FM, Stevenson KJ, et al. Dynamic modeling of vanadium redox flow batteries: Practical approaches, their applications and limitations. J. Energy Storage 2023, 57, 106191. DOI:10.1016/j.est.2022.106191 [Google Scholar]
- Li C, Wang ZY, He ZJ, Li YJ, Mao J, Dai KH, et al. An advance review of solid-state battery: Challenges, progress and prospects. Sustain. Mater. Technol. 2021, 29, e00297. DOI:10.1016/j.susmat.2021.e00297 [Google Scholar]
- Borri E, Tafone A, Romagnoli A, Comodi G. A review on liquid air energy storage: History, state of the art and recent developments. Renew. Sustain. Energy Rev. 2021, 137, 110572. DOI:10.1016/j.rser.2020.110572 [Google Scholar]
- Tong W, Lu Z, Chen W, Han M, Zhao G, Wang X, et al. Solid gravity energy storage: A review. J. Energy Storage 2022, 53, 105226. DOI:10.1016/j.est.2022.105226 [Google Scholar]
- Liu Q, Zhang H, Xie J, Liu X, Lu X. Recent progress and challenges of carbon materials for Zn‐ion hybrid supercapacitors. Carbon Energy 2020, 2, 521–539. DOI:10.1002/cey2.69 [Google Scholar]
- Muthukumar P, Kumar A, Afzal M, Bhogilla S, Sharma P, Parida A, et al. Review on large-scale hydrogen storage systems for better sustainability. Int. J. Hydrog. Energy 2023, 48, 33223–33259. DOI:10.1016/j.ijhydene.2023.04.304 [Google Scholar]
- de Fazio R, Cafagna D, Marcuccio G, Visconti P. Limitations and Characterization of Energy Storage Devices for Harvesting Applications. Energies 2020, 13, 783. DOI:10.3390/en13040783 [Google Scholar]
- AL Shaqsi AZ, Sopian K, Al-Hinai A. Review of energy storage services, applications, limitations, and benefits. Energy Rep. 2020, 6, 288–306. DOI:10.1016/j.egyr.2020.07.028 [Google Scholar]
- Hannan MA, Wali SB, Ker PJ, Rahman MSA, Mansor M, Ramachandaramurthy VK, et al. Battery energy-storage system: A review of technologies, optimization objectives, constraints, approaches, and outstanding issues. J. Energy Storage 2021, 42, 103023. DOI:10.1016/j.est.2021.103023 [Google Scholar]
- Laajimi M, Go YI. Energy storage system design for large-scale solar PV in Malaysia: Technical and environmental assessments. J. Energy Storage 2019, 26, 100984. DOI:10.1016/j.est.2019.100984 [Google Scholar]
- Faruhaan A, Go YI. Energy storage sizing and enhanced dispatch strategy with temperature and safety considerations: A techno‐economic analysis. Energy Storage 2021, 3, e260. DOI:10.1002/est2.260 [Google Scholar]
- Balachander K, Suresh Kumaar G, Mathankumar M, Manjunathan A, Chinnapparaj S. Optimization in design of hybrid electric power network using HOMER. Mater. Today: Proc. 2021, 45, 1563–1567. DOI:10.1016/j.matpr.2020.08.318 [Google Scholar]
- Yasin A, Alsayed M. Optimization with excess electricity management of a PV, energy storage and diesel generator hybrid system using HOMER Pro software. Int. J. Appl. Power Eng. 2020, 9, 267. DOI:10.11591/ijape.v9.i3.pp267-283 [Google Scholar]
- Khalil L, Liaquat Bhatti K, Arslan Iqbal Awan M, Riaz M, Khalil K, Alwaz N. Optimization and designing of hybrid power system using HOMER pro. Mater. Today: Proc. 2021, 47, S110–S115. DOI:10.1016/j.matpr.2020.06.054 [Google Scholar]
- Suriadi S, Daru WI, Halid SR, Syukri M, Gapy M. The optimization of hybrid power generator system (PV-Wind turbine) using Homer software. IOP Conf. Ser. Mater. Sci. Eng. 2021, 1087, 012080. DOI:10.1088/1757-899X/1087/1/012080 [Google Scholar]
- Zhang G, Xiao C, Razmjooy N. Optimal operational strategy of hybrid PV/wind renewable energy system using homer: A case study. Int. J. Ambient Energy 2022, 43, 3953–3966. DOI:10.1080/01430750.2020.1861087 [Google Scholar]
- IRENA. Malaysia Energy Transition Outlook; International Renewable Energy Agency: Abu Dhabi, United Arab Emirates, 2023. [Google Scholar]
- SEDA. Malaysia Renewable Energy Roadmap-Pathway Towards Low Carbon Energy Systems; Sustainable Energy Development Authority (SEDA) Malaysia: Putrajaya, Malaysia, 2021. [Google Scholar]
- Department of Statistics Malaysia. MyCensus2020. Department of Statistics Malaysia. 7 July 2020. Available online: https://www.mycensus.gov.my/ (accessed on 28 August 2025).
- Riayatsyah TMI, Geumpana TA, Fattah IMR, Rizal S, Mahlia TMI. Techno-Economic Analysis and Optimisation of Campus Grid-Connected Hybrid Renewable Energy System Using HOMER Grid. Sustainability 2022, 14, 7735. DOI:10.3390/su14137735 [Google Scholar]
- Perbadanan Bekalan Air Pulau Pinang. Sungai Perak. Perbadanan Bekalan Air Pulau Pinang Sdn Bhd. 2019. Available online: https://sprwts.pba.com.my/index.php/sungai-perak/ (accessed on 28 August 2025).
- Weather and Climate. Kenering, Perak, Malaysia Climate. Weather and Climate. 2023. Available online: https://weatherandclimate.com/malaysia/perak/kenering#t2 (accessed on 28 August 2025).
- UL Solutions. Homer Pro. UL Solutions. 2024. Available online: https://homerenergy.com/products/pro/index.html (accessed on 28 August 2025).
- PVSYST. PVSyst Features. PVSyst. 2024. Available online: https://www.pvsyst.com/help/ (accessed on 28 August 2025).
- PSCAD. PSCAD V5 Features. PSCAD. 2024. Available online: https://www.pscad.com/software/pscad/v5-features (accessed on 28 August 2025).
- TRNSYS. TRNSYS Features. TRNSYS. 2024. Available online: https://www.trnsys.com/features/index.html (accessed on 28 August 2025).
- DNV. Power Distribution System and Electrical Simulation Software-Synergi Electric. DNV. 2024. Available online: https://www.dnv.com/services/power-distribution-system-and-electrical-simulation-software-synergi-electric-5005/ (accessed on 28 August 2025).
- Energy Toolbase. Energy Toolbase Developer. Energy Toolbase. 2024. Available online: https://www.energytoolbase.com/solutions/etb-developer/ (accessed on 28 August 2025).
- GridUnity. GridUnity Platform. GridUnity. 2024. Available online: https://gridunity.com/platform/ (accessed on 28 August 2025).
- DNV. Battery AI. DNV. 2024. Available online: https://batteryai.dnv.com/ (accessed on 28 August 2025).
- Energsoft. Energsoft Software. Energsoft. 2024. Available online: https://energsoft.com/ (accessed on 28 August 2025).
- Homer Pro. Homer Pro 3.15 Documentation. UL Solutions. 2024. Available online: https://homerenergy.com/products/pro/docs/3.15/index.html (accessed on 28 August 2025).
- Louwen A, Moser D, van Sark WGJHM. 1.30—Design and Components of Photovoltaic Systems. In Comprehensive Renewable Energy, 2nd ed.; Elsevier: Amsterdam, The Netherlands, 2022; pp. 644–661. [Google Scholar]
- Dwier S, Garrouch A, Lababidi H. Delineation of the effective viscosity controls of diluted polymer solutions at various flow regimes. Fluid Phase Equilibria 2024, 584, 114143. DOI:10.1016/j.fluid.2024.114143 [Google Scholar]
- Citalingam K, Go YI. Hybrid energy storage design and dispatch strategy evaluation with sensitivity analysis: Techno‐economic‐environmentalassessment. Energy Storage 2022, 4, e353. DOI:10.1002/est2.353 [Google Scholar]
- Mohd Mokhtar MA, Wan Mohamed Zuri WN, Mohd Rasid NI, Ahmad Asmadi A, Abdul Manaf N. Decision Making on the Renewable Energy Penetration in Malaysia via SWOT-PESTLE Analysis: Hydrogen Fuel Cell and Solar Photovoltaic Thermal Technology. IOP Conf. Ser.: Mater. Sci. Eng. 2022, 1257, 012009. DOI:10.1088/1757-899X/1257/1/012009 [Google Scholar]
- Thadani HL, Go YI. Large-scale solar system design, optimal sizing and techno-economic-environmental assessment. Sustain. Energy Res. 2023, 10, 11. DOI:10.1186/s40807-023-00081-0 [Google Scholar]
- Alkaff SA, Shamdasania NH, Ii GY, Venkiteswaran VK. A study on implementation of PV tracking for sites proximate and away from the equator. Process Integr. Optim. Sustain. 2019, 3, 375–382. DOI:10.1007/s41660-019-00086-7 [Google Scholar]