
Dynamic Thermal Performance of a Plate Heat Exchanger Under Viscosity–Velocity Combined: Implications for Seawater-Source Heat Pump Systems

Dynamic Thermal Performance of a Plate Heat Exchanger Under Viscosity–Velocity Combined: Implications for Seawater-Source Heat Pump Systems
Chengyao Liu 1,2 Na Qin 1,2,* Wenzhi Han 1,2 Shiwen Qin 1,2
Received: 05 May 2026 Revised: 21 May 2026 Accepted: 05 June 2026 Published: 24 June 2026

© 2026 The authors. This is an open access article under the Creative Commons Attribution 4.0 International License (https://creativecommons.org/licenses/by/4.0/).
1. Introduction
Low-grade thermal energy recovery from the marine environment is receiving increasing attention as a practical route to improving energy efficiency and reducing carbon emissions in shipping, offshore platforms, islands, ports, and coastal infrastructure [1]. Among the available marine thermal resources, seawater is particularly attractive because of its large thermal capacity, broad availability, and relatively stable seasonal temperature, which make it suitable as both a heat source and a heat sink for seawater-source heat pump (SWHP) systems. Through SWHP technology, the thermal energy stored in seawater can be recovered and upgraded for space heating, cooling, domestic hot water supply, and integrated coastal energy systems. In this context, the efficient use of seawater thermal energy has become an important topic in marine and coastal low-carbon energy research [2].
Alongside seawater-based systems, urban raw sewage has also been widely investigated as a low-grade heat source because of its substantial volume [3], relatively stable year-round temperature (10–18 °C in winter and 20–25 °C in summer) [4], and continuous availability [5]. These characteristics make sewage a useful reference fluid for studying heat recovery under contamination-prone and variable-property conditions, while sewage-source heat pump systems (SSHSs) remain one of the principal technologies for extracting and upgrading low-grade thermal energy [6,7]. Although sewage and seawater differ in composition, both fluids can impose additional thermal resistance, modify near-wall transport, and promote exchanger fouling during long-term operation. For this reason, research on sewage-side heat transfer behavior can also provide useful mechanistic insight into the design and operation of compact heat exchangers for SWHP systems.
In SWHP applications, the heat exchanger is the core component that determines whether seawater thermal energy can be recovered efficiently, stably, and economically. Seawater-side heat exchangers are required to maintain high heat transfer performance under fluctuating flow conditions while resisting biological fouling, suspended solids, salinity effects, and corrosion. Similar operational challenges are encountered in SSHSs, where suspended contaminants, colloids, microorganisms, and inorganic ions can also degrade thermal performance over time. As widely reported, fouling can significantly reduce heat transfer efficiency, increase operating and maintenance costs, and impair the long-term stable operation of both systems [8]. Accordingly, recent research has increasingly focused on compact and efficient heat exchangers capable of operating reliably under harsh fluid conditions [9,10].
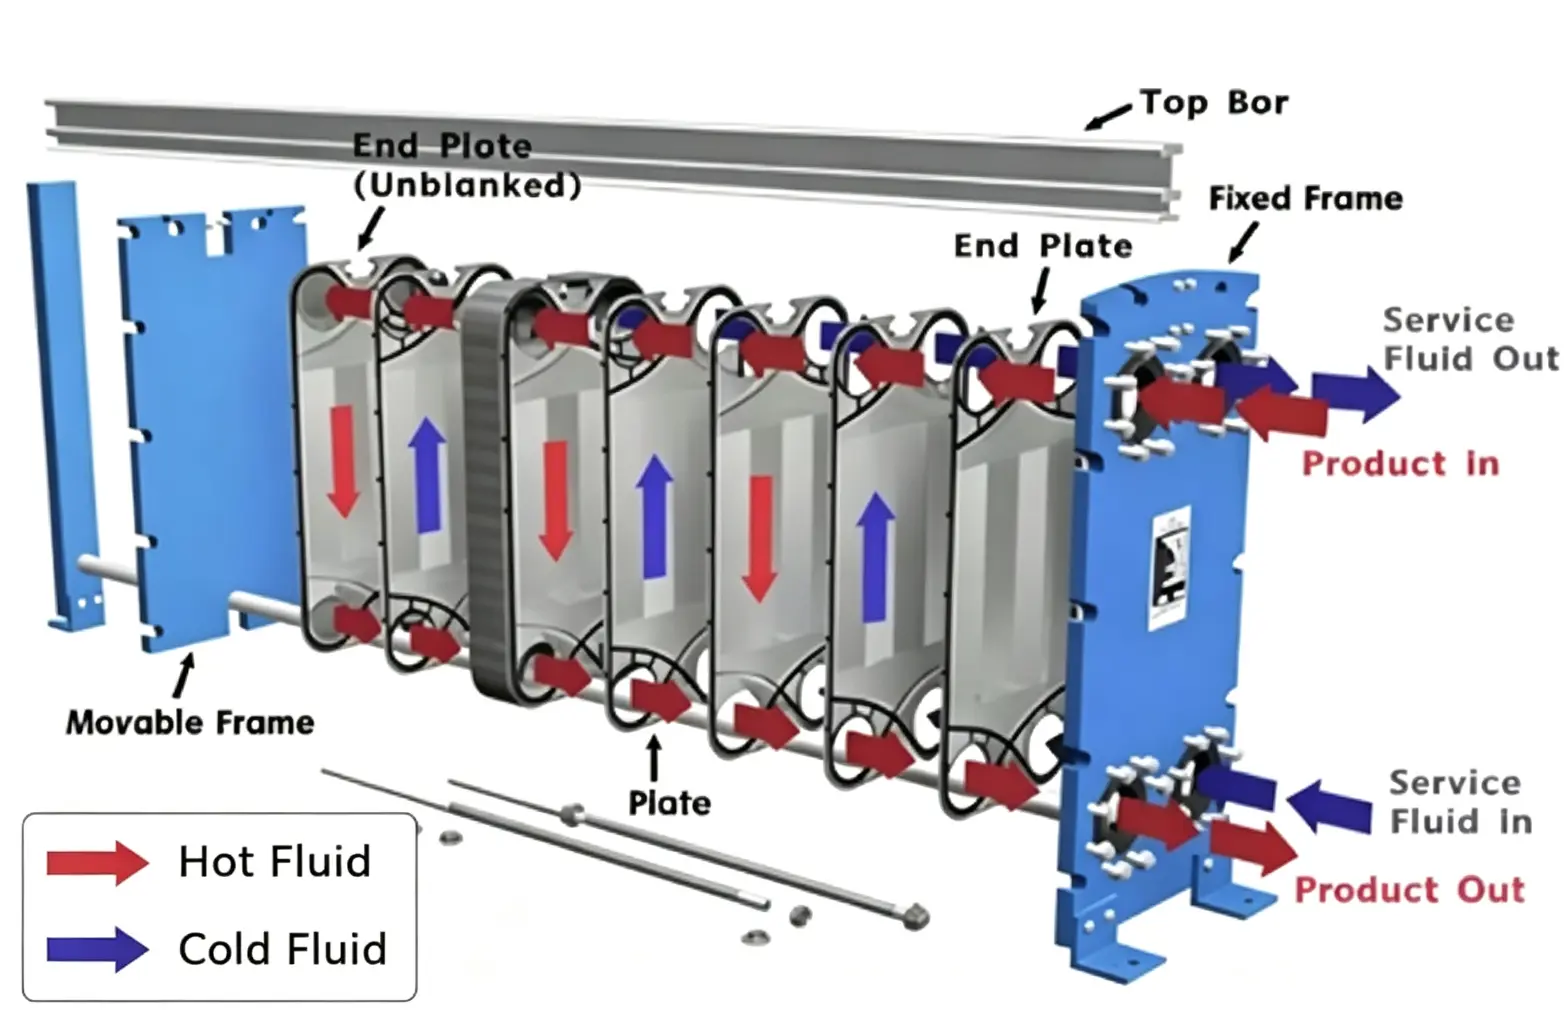
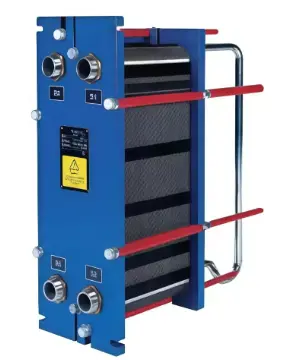
Among the available exchanger configurations, plate heat exchangers (PHEs), first developed in Germany in the 1870s [11], offer several advantages over conventional shell-and-tube heat exchangers, including high thermal effectiveness, compact structure, small footprint, and ease of maintenance [12]. Their relatively uniform heat transfer characteristics and suitability for modular manufacturing make them attractive for both SSHSs and SWHPs, particularly where compact installation and high area-to-volume ratio are required [13]. As shown in Figure 1 and Figure 2, PHEs have already been widely used in sewage heat recovery systems ranging from small building units to district-scale thermal networks [14,15]. Their application potential in seawater-source systems is likewise considerable, especially for coastal buildings, offshore service facilities, and distributed marine energy utilization. Under such conditions, the dynamic thermal response of the PHE directly affects system stability, heat recovery efficiency, and operational control [16].
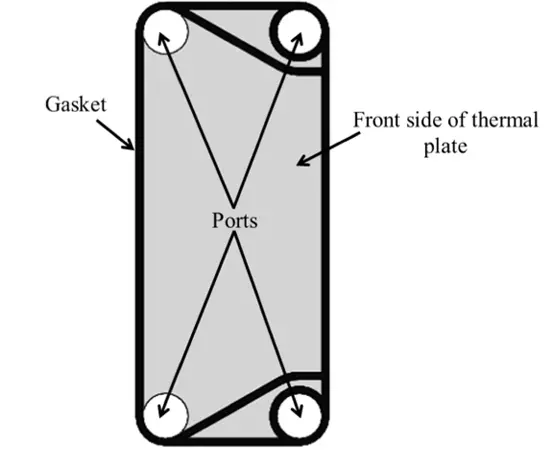
Figure 1. Single thermal plate schematic indicating front surface, port positions, and gasket placement.
 |
 |
|
(a) |
(b) |
Figure 2. Structure of the PHE. (a) Illustrative schematic of PHE’s components; (b) Composed PHE.
A major difficulty in seawater thermal energy recovery lies in the complex transport behavior of real working fluids. Untreated urban sewage is a complex fluid with relatively high viscosity; its apparent viscosity varies with temperature [17], contaminant concentration, and flow velocity [18]. In addition, sewage contains suspended solids, colloids, microorganisms, and inorganic ions that increase fouling risk and hinder the reliable long-term operation of PHEs [19]. Although seawater generally has lower viscosity than sewage, seawater-side heat exchangers also operate under non-ideal conditions involving suspended matter, biological growth, and salinity-driven surface effects. Therefore, from the perspective of transport degradation and fouling-induced thermal resistance, sewage provides a useful high-risk working-fluid scenario for examining exchanger behavior relevant to SWHP applications.
Under such conditions, the coupled effect of fluid viscosity and flow velocity becomes a key factor governing the internal flow regime and heat transfer performance of PHEs [20]. The interaction between plate geometry, such as chevron angle, and flow direction affects the heat transfer coefficient, while viscosity-velocity coupling further modifies boundary-layer development, turbulence intensity, secondary-flow structure, and vortex evolution inside the plate channels [21]. These changes in turn influence key thermo-hydraulic parameters, including heat transfer coefficient, pressure drop, and logarithmic mean temperature difference. Elevated viscosity can also promote fouling deposition and growth by altering near-wall transport and weakening convective mixing [22]. As fouling accumulates, exchanger performance deteriorates continuously, and severe blockage may occur, thereby increasing operation and maintenance costs and reducing long-term system reliability [23]. These issues are directly relevant to SWHP systems because stable seawater energy recovery depends on maintaining acceptable thermal performance under long-term fouling-prone operation.
Extensive efforts have been devoted to understanding the flow and heat transfer characteristics of PHEs. Zhang [24] performed long-term thermophysical measurements on raw sewage from multiple sources and found that key properties, including viscosity and density, show pronounced temperature dependence distinct from that of clean water and secondary treated sewage. Niezgoda et al. [25] numerically demonstrated that viscosity variations in particle-laden fluids alter the aggregation behaviour of suspended particles in PHE channels, leading to substantially higher flow resistance than under clean-water conditions. Yang et al. [26] combined computational fluid dynamics (CFD) simulations with experiments and demonstrated that the structural parameters of PHEs influence wall-temperature distribution through their effect on flow-field uniformity, thereby affecting fouling deposition behaviour. Zhu et al. [27] investigated parallel plate heat exchanger arrays and found that the interaction between flow velocity and layout significantly affects heat transfer efficiency and pressure drop. Xu et al. [28] proposed a full three-dimensional thermo-hydraulic analysis method for microchannel plate heat exchangers to examine non-uniform flow distribution and its impact on thermal performance. Shi et al. [29] and Wan et al. [30] further reported that viscosity-velocity coupling significantly modifies the secondary-flow intensity and vortex distribution in PHE channels, which strongly influences heat transfer enhancement. Prabakaran et al. [31] developed a response-surface-based prediction model for the condensation performance of low-GWP refrigerants and showed that the combined effects of fluid viscosity and flow velocity can affect fouling-layer porosity through changes in interfacial shear stress. Collectively, these studies indicate that viscosity-related transport effects are central to the thermal design and operation of compact heat exchangers under fouling-prone conditions, including those relevant to marine heat recovery.
Wall temperature is another key parameter in this context because it reflects the coupled state of flow and heat transfer within the PHE and provides useful information on exchanger stability, thermal response, and fouling development [32]. The spatial distribution and temporal response of wall temperature affect the fluid-wall temperature difference and therefore influence the transient variation of convective heat transfer coefficients [33]. Hirokawa et al. [34] used high-precision thin-wall temperature measurements to show that wall-temperature distribution can effectively reflect local heat transfer conditions in PHEs, and that the amplitude of temperature fluctuation is positively correlated with the dynamic response of the heat transfer coefficient. Li et al. [35] similarly found in printed circuit heat exchangers that dynamic wall-temperature fluctuations are closely associated with abrupt changes in fluid thermophysical properties. Wall temperature is also linked to fouling development, since its temporal variation can influence fouling initiation, growth, ageing, and partial detachment [36]. Microbial fouling is particularly sensitive to temperature, while wall-temperature gradients can promote the migration of inorganic ions towards the heat transfer surface, thereby favoring the formation of composite deposits. Ma Dong [37] reported that periodic wall-temperature fluctuations in a wide-channel plate heat exchanger induced a three-stage fouling behavior involving rapid growth, partial detachment, and regrowth, thereby impairing long-term heat transfer performance. This points to a feedback process in which viscosity-velocity coupling affects wall-temperature fluctuations, wall-temperature fluctuations influence fouling development, and the resulting fouling layer further increases thermal resistance and aggravates temperature non-uniformity [38]. Such coupling is highly relevant to SWHP systems, where fluctuating operating conditions and seawater-side fouling can intensify interactions among wall shear stress, thermal response, and exchanger degradation [39].
Despite this progress, several issues still limit the accurate prediction and optimization of PHE performance for seawater thermal energy recovery and related coastal applications. First, many existing studies focus on treated sewage or clean water [40], while the coupled effects of viscosity and flow velocity under realistic fouling-prone conditions remain insufficiently addressed [41]. Second, although wall temperature can be measured relatively easily in building and energy management systems [42], predictive models that describe the dynamic interaction between flow-induced temperature variations and fouling development remain limited [43]. Third, quantitative relationships between wall temperature and fouling resistance remain inadequate for online monitoring, performance diagnosis, and operation-oriented control. These limitations hinder the reliable design and efficient operation of SWHP and SSHS units, especially where long-term marine heat recovery requires stable performance, accurate seasonal assessment, and manageable maintenance demand [44].
Therefore, a clearer understanding of viscosity-velocity coupling, its influence on wall-temperature dynamics, and its role in fouling deposition is needed to support the development of efficient and reliable compact heat exchangers for seawater-source heat pump systems and marine thermal energy recovery [45].
Against this background, the present study develops a combined prediction framework for a BR50 plate heat exchanger by combining a steady-state heat transfer model with a transfer-function-based dynamic wall-temperature model. The model is used to examine the effects of sewage-side flow velocity and kinematic viscosity on wall temperature, dynamic response characteristics, sewage-side heat transfer coefficient, and overall heat transfer coefficient. The investigated velocity range is 0.8–1.5 m/s, and the kinematic viscosity is varied up to 10 times that of clean water to represent high-viscosity conditions associated with untreated sewage.
The objectives of this study are threefold:
- (1)
-
to clarify how wall temperature and heat transfer performance vary under coupled changes in viscosity and flow velocity;
- (2)
-
to characterize the dynamic response of wall temperature and its dependence on operating conditions; and
- (3)
-
to assess the relative importance of key parameters through quantitative sensitivity analysis.
Unlike conventional steady-state PHE models, which emphasize static thermal equilibrium and consider only steady-state thermal resistance and pressure drop, this study incorporates a dynamic wall-temperature model in transfer-function form for complex fluids. Within a unified framework, the proposed model couples the relevant dynamic processes, quantitatively evaluates their direct coupling effects, and specifically quantifies their combined influence on wall temperature, the heat-transfer coefficient on the fouling side, and the overall heat-transfer coefficient.
Although raw sewage is used as the working fluid in this study, it is not intended as a direct substitute for seawater. Instead, raw sewage is treated as a representative fouling-prone and variable-property medium for examining the coupled effects of viscosity, flow velocity, and wall-temperature response in plate heat exchangers. These issues are also relevant to seawater-source heat pump systems, where exchanger performance may similarly be affected by transport degradation and additional thermal resistance under non-ideal operating conditions. The present results should therefore be interpreted as mechanism-oriented insight with potential relevance to seawater applications, while direct validation under actual seawater conditions remains necessary.
2. Model Development
2.1. Heat Transfer Model
The BR50 plate heat exchanger investigated in this study is a corrugated-plate heat transfer unit in which hot and cold fluids flow through alternating channels separated by thin metal plates [46,47]. The corrugation pattern enhances turbulence, increases effective heat transfer area, and improves flow distribution [48,49]. In the present configuration, untreated sewage is treated as the hot fluid and clean water as the cold fluid.
The engineering design requirements of the investigated heat exchanger are summarized in Table 1. The rated heat load is 1080 kW, with design inlet and outlet temperatures selected to represent typical operating conditions of sewage-source heat pump systems and related low-grade heat recovery applications [50].
Table 1. Engineering design requirements of the investigated plate heat exchanger.
|
Heat Load (kW) |
Inlet Temperature of Sewage (°C) |
Outlet Temperature of Sewage (°C) |
Inlet Temperature of Water (°C) |
Outlet Temperature of Water (°C) |
|---|---|---|---|---|
|
1080 |
15 |
10 |
7 |
12 |
The principal structural and material parameters of the BR50 PHE are as follows: plate thickness 0.0008 m, plate thermal conductivity 14 W/(m·°C), and equivalent channel diameter 7.6 × 10⁻³ m. The heat transfer model was established by sequentially calculating the sewage-side heat transfer coefficient, the clean-water-side heat transfer coefficient, and the overall heat transfer coefficient. Fluid properties were evaluated using average inlet and outlet temperatures on each side.
For the sewage side, the heat transfer coefficient was determined from the Nusselt correlation applicable to the BR50 PHE under turbulent-flow conditions. The sewage Reynolds number was calculated from the characteristic velocity, equivalent diameter, and kinematic viscosity. At an average sewage temperature of 12.5 °C, the reference thermophysical properties used in the calculation were kinematic viscosity 1.45 × 10⁻⁵ m2/s, thermal conductivity 58.6 × 10⁻² W/(m·°C), specific heat capacity 4.19 kJ/(kg·°C), and Prandtl number 88.95. The Prandtl number increases proportionally with viscosity; therefore, when the viscosity is taken as ten times that of clean water, the Prandtl number also increases by a factor of ten.
The sewage-side Nusselt number correlation used in this study is the empirical correlation obtained by fitting the experimental data of plate heat exchangers for sewage applications. The correlation is obtained under the working conditions of sewage flow velocity 0.3~1.8 m/s and Reynolds number 1500~18,000, which match the application scenario of this study, so it is directly adopted.
For the clean water side, the same procedure was followed. At an average clean-water temperature of 9.5 °C, the reference properties were kinematic viscosity 1.32 × 10⁻⁶ m2/s, thermal conductivity 58.1 × 10⁻² W/(m·°C), specific heat capacity 4.19 kJ/(kg·°C), and Prandtl number 9.73.
The specific heat capacity and thermal conductivity of sewage in this study are derived from the long-term measured average data of municipal sewage for municipal sewage with conventional suspended solid concentrations, the specific heat capacity is 3.9~4.2 kJ/(kg·K), which is slightly higher than that of clean water (4182 J/(kg·K)), the difference is within 5%, which can be approximated as a constant in the model calculation; the thermal conductivity of sewage is 0.56~0.59 W/(m·K). The values adopted in this study are the average values of the measured data, which are consistent with the actual working conditions of urban sewage.
The overall heat transfer coefficient was then obtained by combining the convective resistances on both fluid sides, the conduction resistance of the plate wall, and an equivalent fouling resistance [51]. In this study, a representative fouling resistance value was introduced to account for deposit-related thermal resistance under practical operation. The introduction of a representative constant fouling thermal resistance is intended to incorporate fouling effects into the steady-state thermal analysis in a simplified manner. This approach is consistent with the rapid estimation method commonly used in engineering practice at the conceptual design stage, typically for preliminary equipment selection and performance trend analysis. It aims to provide the model with a baseline thermal resistance consistent with actual operating conditions, where fouling is present, thereby enabling the coupled effects of viscosity and flow velocity to be examined at the mechanistic level without making the model overly complicated by introducing a complex transient fouling model.
In this study, the value of sewage side fouling resistance is taken as 0.8 × 10⁻³ m2·K/W, which is the long-term average fouling resistance value of plate heat exchangers for urban sewage source heat pump systems measured in field tests by existing studies. The basis for selecting this value is as follows: according to the on-site monitoring data of domestic urban sewage source heat pump systems, after 3~5 years of continuous operation, the fouling resistance of plate heat exchangers is generally in the range of 0.6 × 10⁻³~1.0 × 10⁻³ m2·K/W, this study takes the average value of the actually measured data, which is consistent with the long-term average fouling level of plate heat exchangers in actual urban sewage scenarios, and can reasonably reflect the actual thermal resistance of the equipment in normal operation.
Based on the heat balance equation, the required heat transfer area was determined from the heat duty, logarithmic mean temperature difference, and a safety factor of 0.9 to account for fouling and flow non-uniformity. In the process of formula calculation, a safety correction factor ranging from 0.8 to 0.9 is typically introduced to offset the decrease in heat transfer capacity resulting from long-term operation fouling deposition as well as manufacturing and assembly deviations, which guarantees that the equipment can satisfy the heat transfer requirements in long-term operation.
Table 2 lists the main design results at representative flow velocities. As expected, the heat transfer coefficients on both sides and the overall heat transfer coefficient increase with flow velocity, whereas the required heat transfer area decreases.
Table 2. Calculated design parameters at representative flow velocities.
|
Flow Velocity (m/s) |
Sewage-Side Heat Transfer Coefficient W/(m2·k) |
Water-Side Heat Transfer Coefficient W/(m2·k) |
Overall Heat Transfer Coefficient W/(m2·k) |
Heat Transfer Area m2 |
|---|---|---|---|---|
|
```latex{\mathrm{u}}_{\mathrm{s}}=0.8``` |
6805.22 |
12,814.24 |
2716.45 |
147.25 |
|
```latex{\mathrm{u}}_{\mathrm{s}}=1.2``` |
8810.73 |
16,590.64 |
3155.41 |
126.77 |
|
```latex{\mathrm{u}}_{\mathrm{s}}=1.5``` |
10,156.49 |
19,124.71 |
3402.63 |
117.56 |
2.2. Dynamic Wall Temperature Model
Because heat exchangers exhibit thermal inertia, a steady-state model alone cannot describe their transient response under varying operating conditions. To capture wall-temperature dynamics, a transfer-function-based model was developed from energy balances for the hot and cold fluids and the metal wall.
The clean-water-side and sewage-side energy equations were first expressed in terms of the respective outlet temperatures, inlet temperatures, and wall temperature. The wall energy balance was then written as a first-order differential equation describing the transient thermal storage of the plate wall. Based on Equation (12) and Equation (13), they can be rearranged into Equation (15) and Equation (16), where $$\text{a}$$ and $$\text{b}$$ are the heat transfer characteristic coefficients of the cold and hot fluid sides, defined as:
Substituting Equation (17) into Equation (14) and rearranging gives:
After Laplace transformation, the wall-temperature response to inlet temperature disturbances was represented in transfer-function form. This first-order linear transfer function form is applicable to the transient analysis of wall temperature in this study for two main reasons:
The dynamic response of plate wall temperature is dominated by the thermal inertia of the plate itself. Since the heat capacity of the fluid on both sides is much smaller than that of the metal plate, the thermal inertia of the fluid can be ignored, and the dynamic behavior of wall temperature can be accurately approximated by a first-order inertia link, which has been verified by a large number of experimental studies on the dynamic response of plate heat exchangers in existing literature.
This study focuses on the influence of parameter changes on the steady-state heat transfer performance, and only needs a simple and reliable dynamic model to describe the basic response characteristics of wall temperature to working condition disturbances. This first-order transfer function form meets the analysis requirements of this study and clearly reflects the influence of key parameters, such as the heat transfer coefficient and plate heat capacity, on the dynamic response speed.
The resulting wall-temperature dynamics show first-order inertial behavior. Based on the design results and structural parameters of the BR50 PHE, transfer functions were obtained for three representative flow velocities: 0.8, 1.2, and 1.5 m/s. Although the full expressions are omitted here for brevity, the calculated results indicate that the time constant decreases as flow velocity increases. This implies that the heat exchanger wall responds more rapidly to thermal disturbances at higher velocities. The key structural parameters used in the dynamic model are listed in Table 3.
Table 3. Key parameters of the BR50 plate heat exchanger.
|
Parameter |
Value |
Parameter |
Value |
|---|---|---|---|
|
Single plate heat transfer area: m2 |
0.52 |
Flange diameter: DN: mm |
125 |
|
Plate spacing: mm |
4.5 |
Operating temperature: °C |
≤230 |
|
Single flow channel cross-sectional area: m2 |
0.001672 |
Operating pressure: MPa |
0.6, 1.0, 1.6, 2.0, 2.5 |
|
Maximum processing capacity: m3/h |
150 |
Corner hole diameter: mm |
135, 140 |
|
Plate external dimension: mm |
1380 × 495 × 0.8 |
Normal corrugation pitch: mm |
16 |
|
Effective heat transfer area: m2 |
0.5088 |
Flow channel width: mm |
445 |
|
Single plate weight: kg |
4.55 |
Average plate spacing: mm |
4.5 |
|
Corner hole size: mm |
135 |
Average flow channel cross-sectional area: m2 |
0.001672 |
|
Corrugation height: mm |
3.8 |
Average equivalent diameter: mm |
7.6 |
|
Corrugation type |
Isosceles triangle |
Plate material |
304, 316, 316 L |
The calculated parameters hs, hw, and cb and mb were substituted into the governing equations to obtain the numerical transfer functions. The corresponding data are listed in Table 4.
Table 4. Heat exchanger design parameters (sewage viscosity of 1.45 × 10⁻⁵ m2/s).
|
Flow Velocity (m/s) |
Sewage-Side Heat Transfer Coefficient W/(m2°C) |
Water-Side Heat Transfer Coefficient W/(m2°C) |
Overall Heat Transfer Coefficient W/(m2°C) |
cb |
mb |
a |
b |
|---|---|---|---|---|---|---|---|
|
```latex{\mathrm{u}}_{\mathrm{s}}=0.8``` |
6805.22 |
12,814.24 |
1379.07 |
460 |
364 |
17.21 |
9.14 |
|
```latex{\mathrm{u}}_{\mathrm{s}}=1.2``` |
8810.73 |
16,590.64 |
1483.87 |
460 |
364 |
20.70 |
11.00 |
|
```latex{\mathrm{u}}_{\mathrm{s}}=1.5``` |
10,156.49 |
19,124.71 |
1536.36 |
460 |
364 |
23.05 |
12.24 |
Flow velocity $${\mathrm{u}}_{\mathrm{s}}={\mathrm{u}}_{\mathrm{w}}=0.8$$ m/s, $$\text{A}=147.25$$ m2
Flow velocity $${\mathrm{u}}_{\mathrm{s}}={\mathrm{u}}_{\mathrm{w}}=1.2$$ m/s, $$\text{A}=126.77$$ m2
Flow velocity $${\mathrm{u}}_{\mathrm{s}}={\mathrm{u}}_{\mathrm{w}}=1.5$$ m/s, $$\text{A}=117.56$$ m2
From the above transfer functions, it can be observed that the wall temperature of the PHE behaves as a first-order inertial system with respect to the inlet temperatures of the hot and cold fluids. The time constant of this inertial system decreases with increasing flow velocity, indicating a faster dynamic response for building system load regulation. This dynamic response characteristic is of great significance for the stable operation of seawater-source heat pumps under variable marine load conditions.
3. Results and Discussion
3.1. Effect of Flow Velocity on Wall Temperature at High Viscosity
In this study, the wall temperature variation curves under different flow velocities were observed for sewage with extreme viscosity. First, the wall temperature changes at response times of 100 s, 600 s, and 1200 s were verified for each velocity, as shown in Table 5. For comparative analysis, dynamic simulation results for plate heat exchangers under identical operating conditions were added. A time-step independence test was further performed to evaluate the numerical stability of the transient calculation. The results indicate that the predicted wall temperature gradually approached a stable state and became effectively steady after 1200 s. The deviation between the tested time-step cases was less than 1.8%, indicating that the selected temporal discretization provides sufficient numerical accuracy and stability for the present dynamic simulations. These results support the reliability of the proposed dynamic simulation framework.
Table 5. Time-step independence verification (sewage viscosity of 1.45 × 10⁻⁵ m2/s).
|
Response Time (s) |
Wall Temperature of Shell and Tube Heat Exchanger (°C) |
Velocity (m/s) |
Wall Temperature of Plate Heat Exchanger (°C) |
Velocity (m/s) |
||||
|
0.8 |
1.2 |
1.5 |
0.8 |
1.2 |
1.5 |
|||
|
100 |
10.570 |
10.635 |
10.668 |
10.697 |
10.721 |
10.732 |
||
|
600 |
10.568 |
10.634 |
10.667 |
10.697 |
10.721 |
10.727 |
||
|
1200 |
10.567 |
10.636 |
10.664 |
10.697 |
10.721 |
10.733 |
||
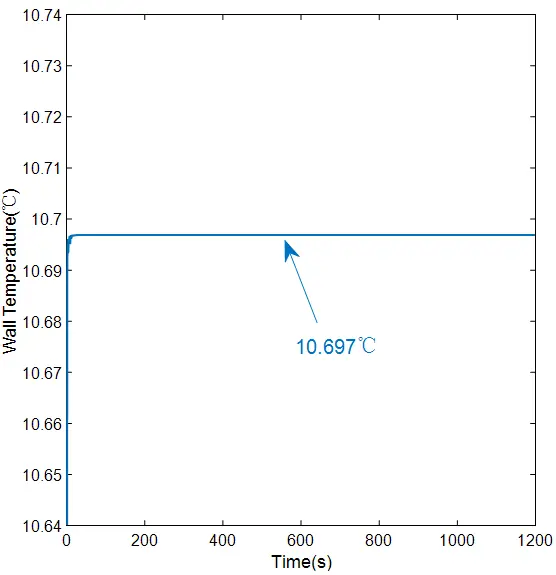
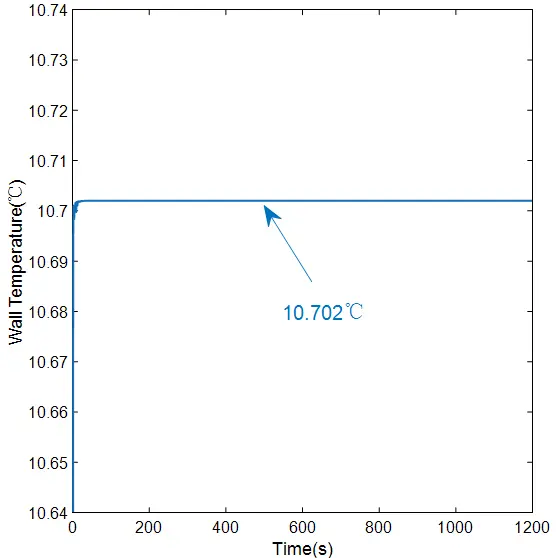
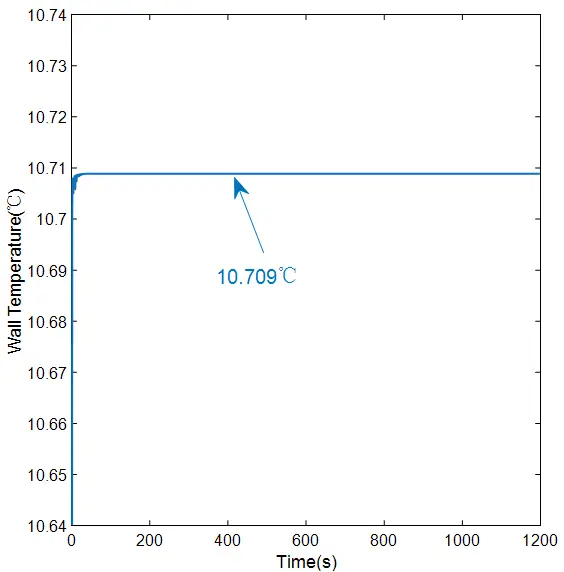
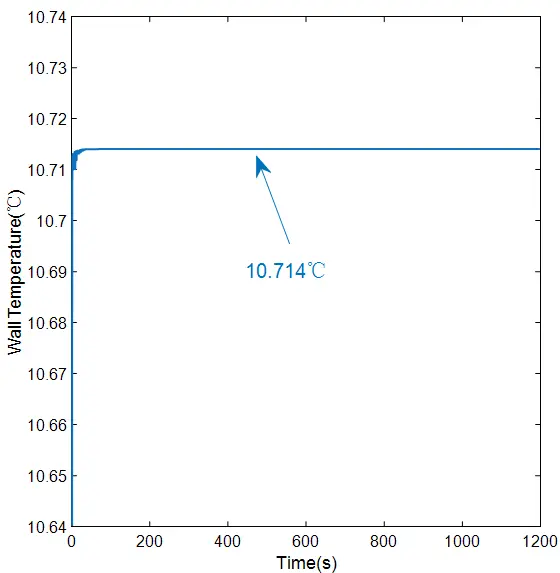
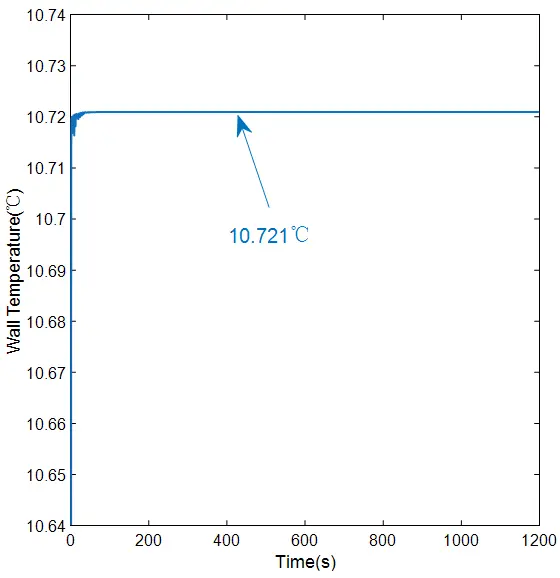
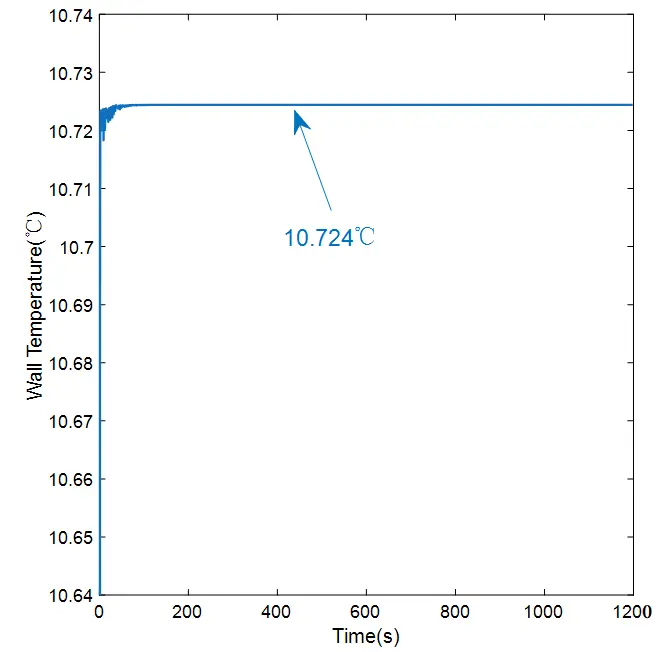
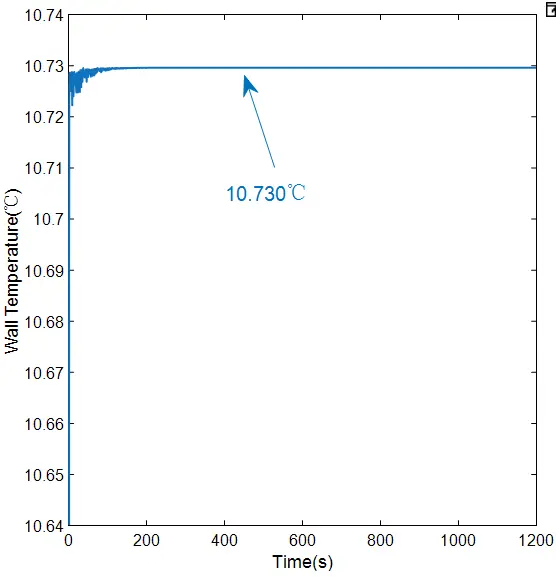
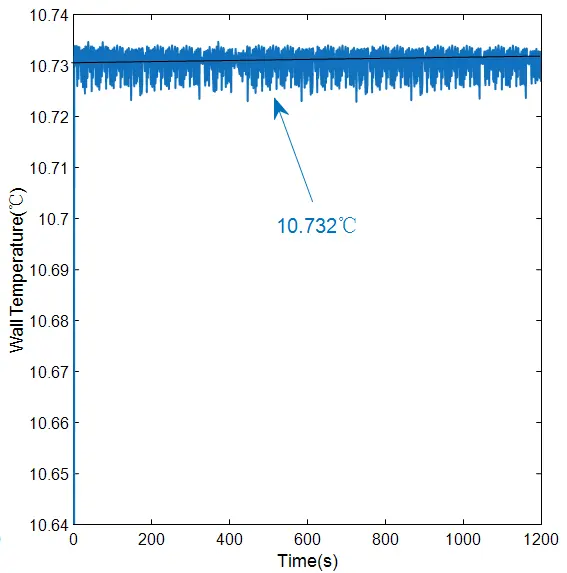
To evaluate wall-temperature behavior under severe operating conditions, simulations were performed at a sewage kinematic viscosity corresponding to 10 times that of clean water. This condition represents a high-viscosity, high-fouling-risk scenario relevant to untreated sewage and, by analogy, to some marine fouling environments. Figure 3a–h illustrate the dynamic time-varying curves of wall temperature at various sewage flow velocities ranging from 0.8 to 1.5 m/s under the extreme condition of 10× clean water viscosity. Meanwhile, Figure 4 presents the steady-state variation curve of wall temperature as a function of sewage flow velocity.
 |
 |
|
(a) |
(b) |
 |
 |
|
(c) |
(d) |
 |
 |
|
(e) |
(f) |
 |
 |
|
(g) |
(h) |
Figure 3. Dynamic simulation curves of wall temperature. (a) Sewage velocity 0.8 m/s; (b) Sewage velocity 0.9 m/s; (c) Sewage velocity 1.0 m/s; (d) Sewage velocity 1.1 m/s; (e) Sewage velocity 1.2 m/s; (f) Sewage velocity 1.3 m/s; (g) Sewage velocity 1.4 m/s; (h) Sewage velocity 1.5 m/s.
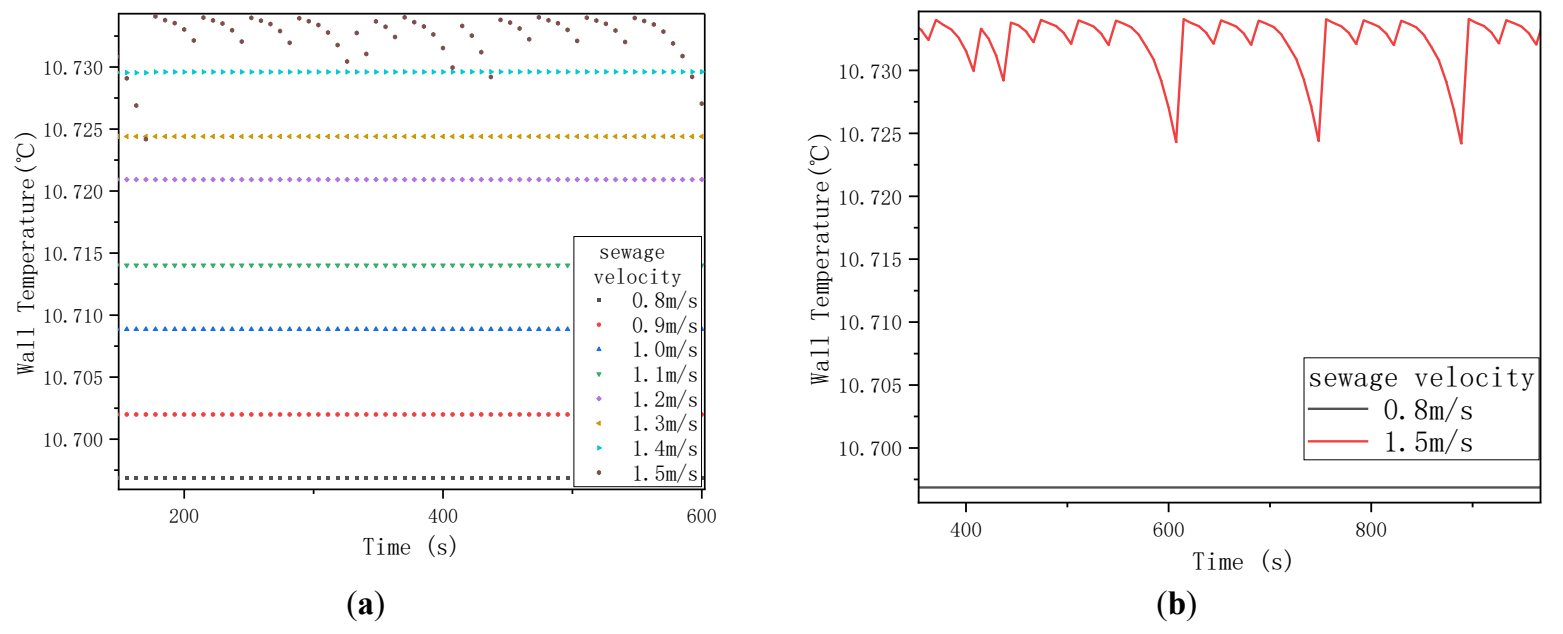
Figure 4. Wall temperature amplification comparison. (a) Sewage flow velocity: 0.8–1.5 m/s; (b) Sewage flow velocity: 0.8 vs. 1.5 m/s.
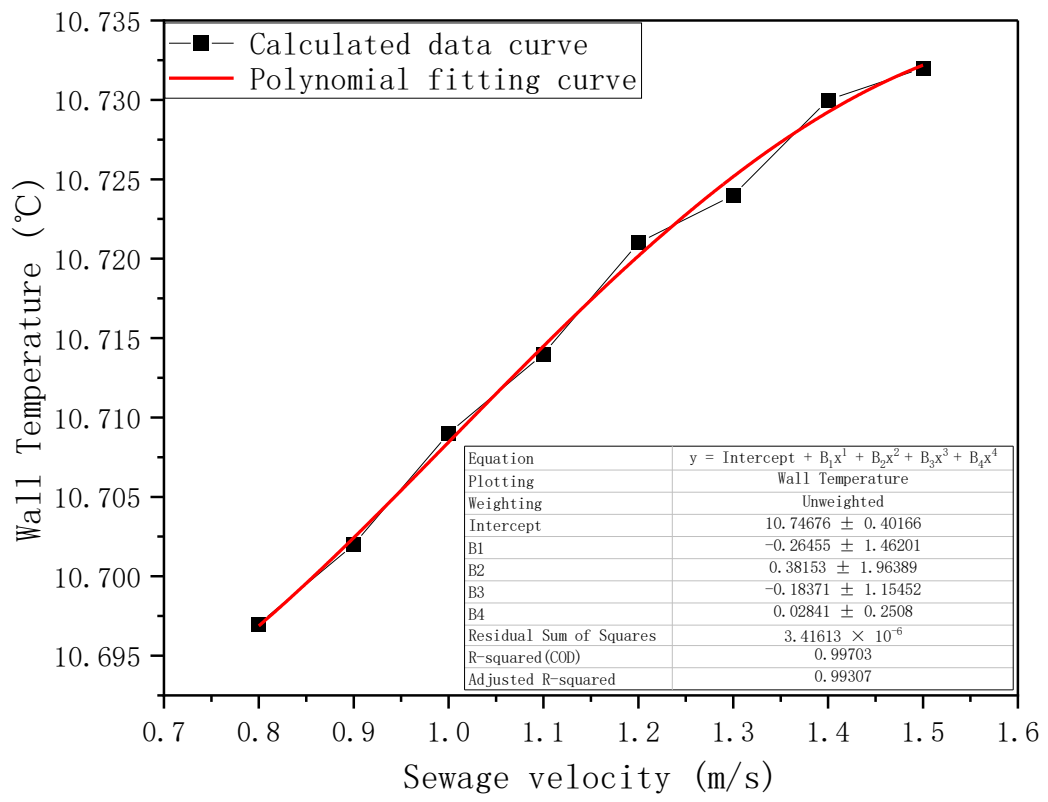
The simulated wall-temperature histories at sewage velocities from 0.8 to 1.5 m/s show that the wall temperature increases slightly with increasing flow velocity. At steady state, the wall temperature rises from 10.697 °C at 0.8 m/s to 10.733 °C at 1.5 m/s, corresponding to an increase of 0.036 °C. Although the absolute change is small, the trend is physically consistent: higher velocity enhances turbulence intensity, reduces the thickness of the thermal boundary layer, and improves convective heat transfer at the sewage side.
As depicted in Figure 5, a fourth-order polynomial was fitted to the steady-state wall temperature as a function of sewage flow velocity, and the fit reproduced the calculated trend well within the investigated range. This provides a convenient reduced-order description for operational prediction under high-viscosity conditions.
|
```latex{\mathrm{t}}_{\mathrm{b}}\text{ }\text{=}\text{ }\text{10.74676}\text{ }-\text{ }\text{0.26455}{\mathrm{u}}_{\mathrm{s}}\text{ }\text{+}\text{ }\text{0.38153}{{\mathrm{u}}_{\mathrm{s}}}^\text{2}\text{ }-\text{ }\text{0.18371}{{\mathrm{u}}_{\mathrm{s}}}^\text{3}\text{ }\text{+}\text{ }\text{0.02841}{{\mathrm{u}}_{\mathrm{s}}}^\text{4}``` |
In dynamic terms, the wall temperature exhibits first-order inertial behavior, in agreement with the transfer-function model. Higher velocity leads to a smaller time constant and a faster approach to steady state. This suggests that flow regulation can influence not only steady heat transfer performance but also transient thermal responsiveness.
3.2. Effect of Viscosity on Heat Transfer Performance
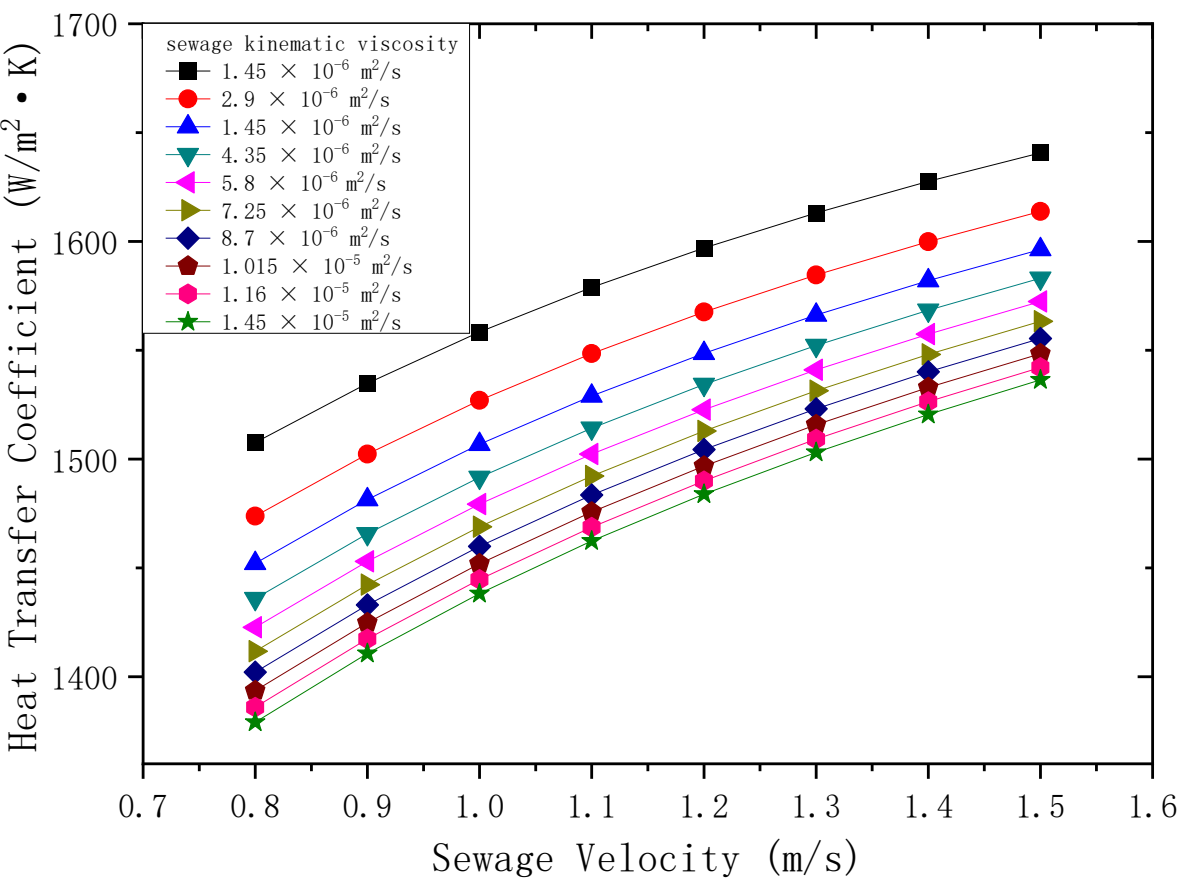
The sewage-side heat transfer coefficient shown in Figure 6 and Figure 7 and the overall heat transfer coefficient shown in Figure 8 and Figure 9 were analyzed over the investigated viscosity and velocity ranges. The results show a consistent pattern: both coefficients increase with flow velocity and decrease with increasing viscosity.
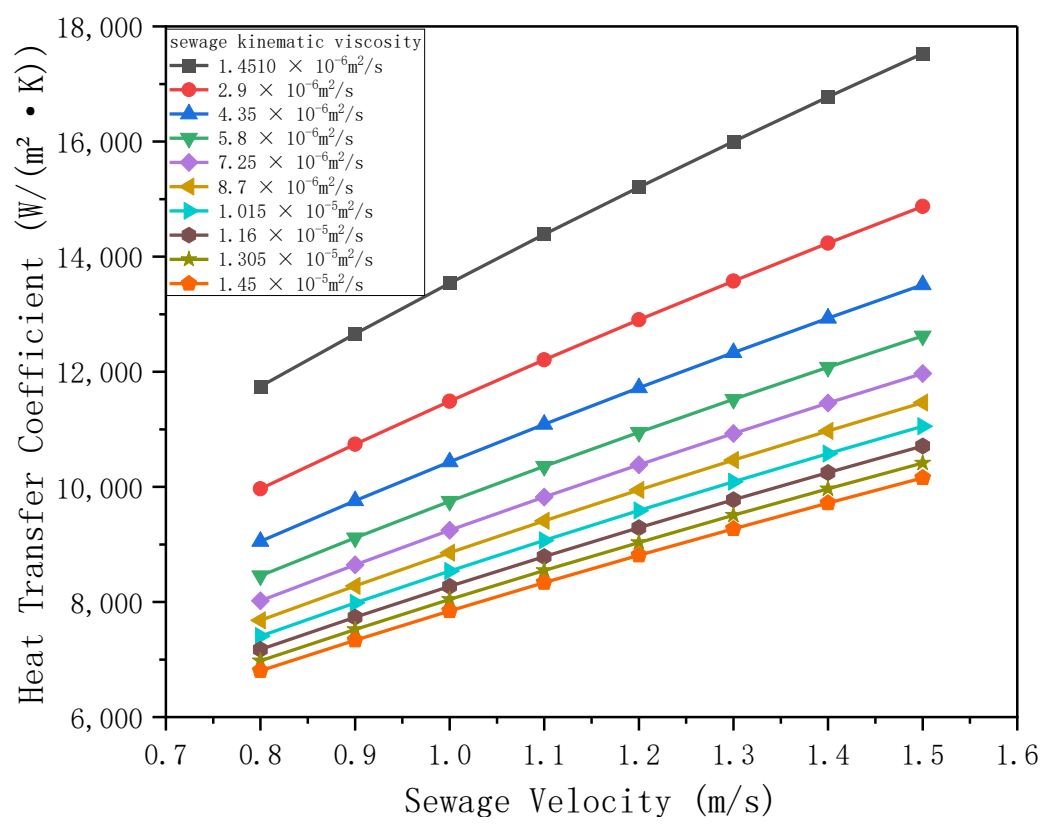
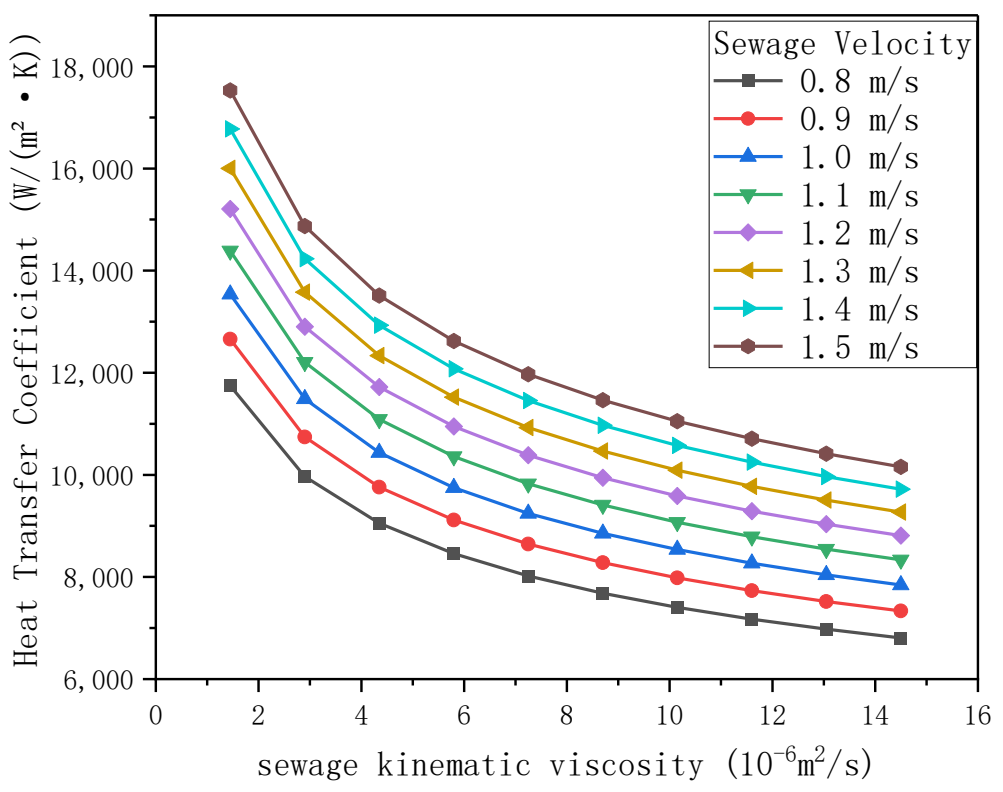
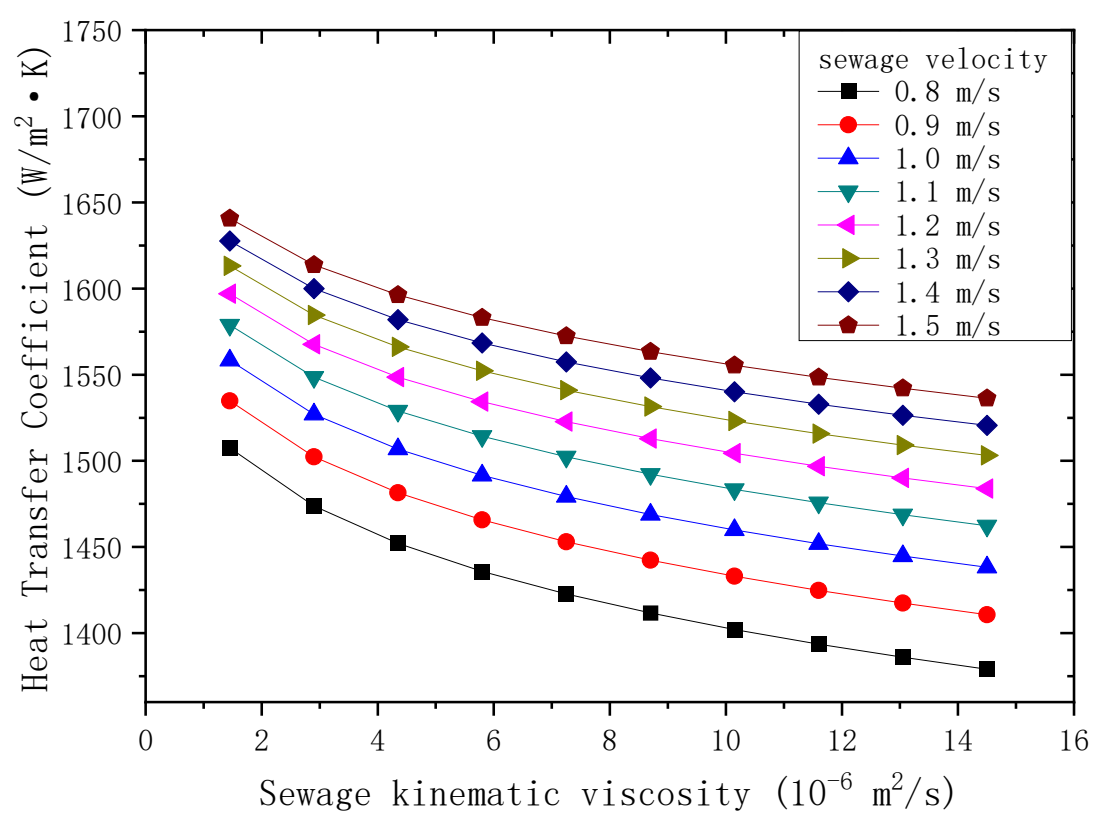
For all viscosity levels considered, the sewage-side heat transfer coefficient increases by 49.2% when the sewage velocity rises from 0.8 to 1.5 m/s. This increase reflects the strong influence of Reynolds number on convective transport in the plate channels. Higher velocity strengthens mixing and turbulence, which in turn increases the local heat transfer coefficient.
The gain in the overall heat transfer coefficient also depends on viscosity. When velocity increases from 0.8 to 1.5 m/s, the overall coefficient increases from 1379.07 to 1536.36 W/(m2·K) at 10 times clean-water viscosity, corresponding to an 11.4% increase. At 5 times clean-water viscosity, the increase is 10.52%, and at 2 times clean-water viscosity, it is 9.5%. These results indicate that the relative benefit of raising flow velocity becomes somewhat more pronounced as viscosity increases.
From a physical perspective, increasing viscosity suppresses turbulence intensity, thickens the thermal boundary layer, and increases resistance to momentum and heat transport. As a result, the heat transfer coefficient decreases even when the wall temperature changes only slightly. This distinction is important because it shows that wall temperature alone may not fully reflect the degree of thermal performance deterioration.
From an operational standpoint, increasing flow velocity is a practical way to offset part of the heat transfer loss caused by high viscosity. However, this should be balanced against the additional pumping power required. The present results therefore, provide a quantitative basis for evaluating the trade-off between thermal performance improvement and flow-related energy consumption.
3.3. Effect of Viscosity on Wall-Temperature Dynamics
Figure 10 and Figure 11 illustrate the overall evolution of wall temperature with flow velocity and viscosity under various combined conditions. Wall-temperature behavior was further examined at three representative flow velocities: 0.8, 1.2, and 1.5 m/s shown in Figure 12, Figure 13 and Figure 14. Under all three conditions, the wall temperature decreases monotonically with increasing sewage viscosity, and the total reduction remains within about 3% as viscosity rises from 1 to 10 times that of clean water.
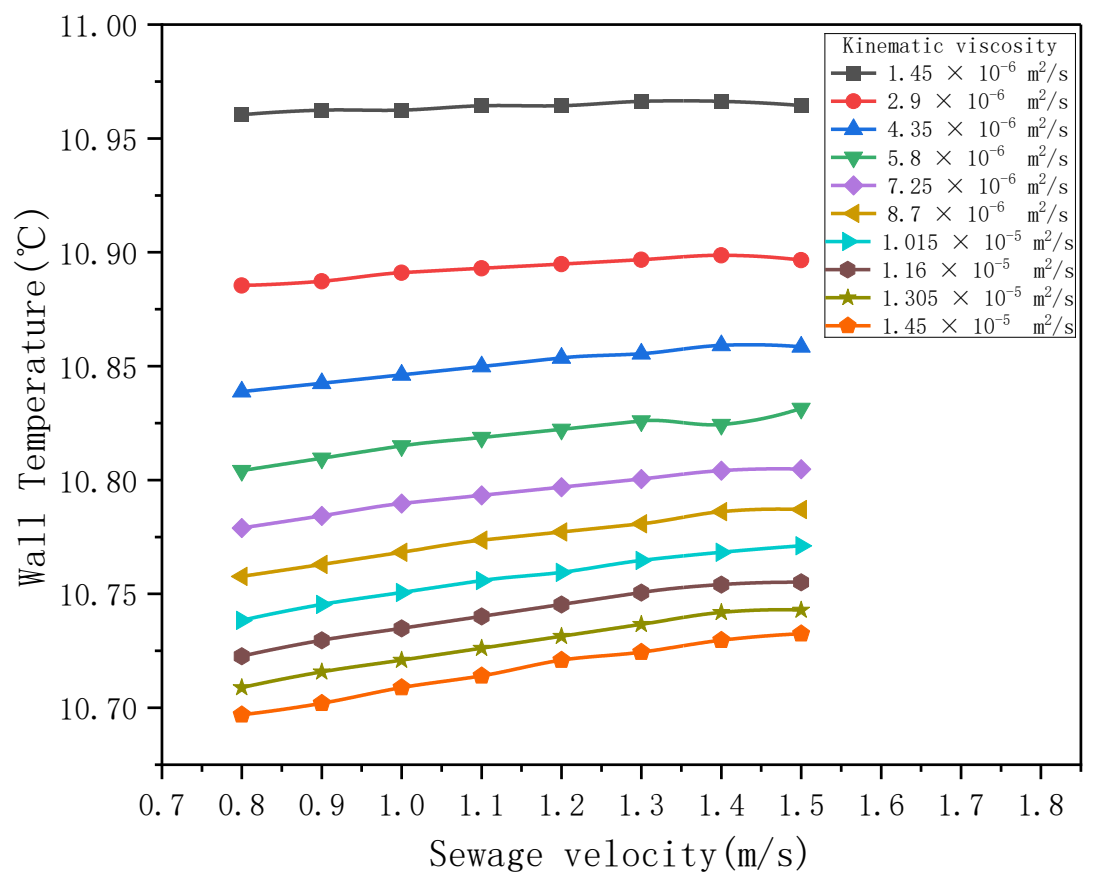
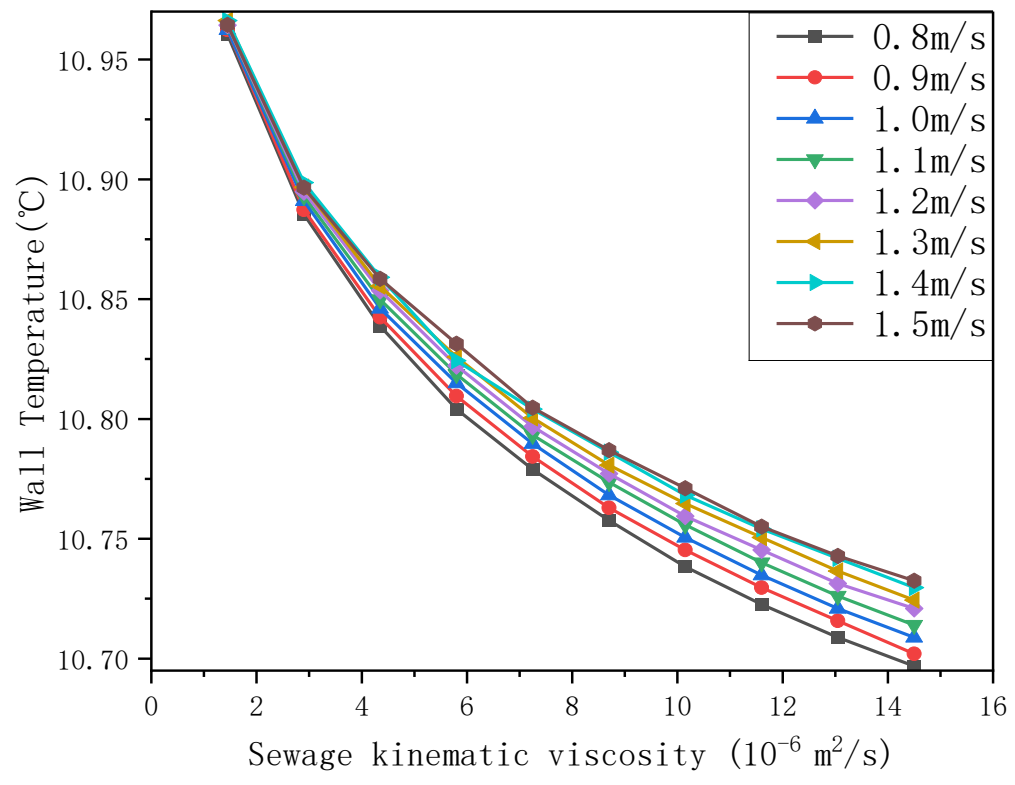
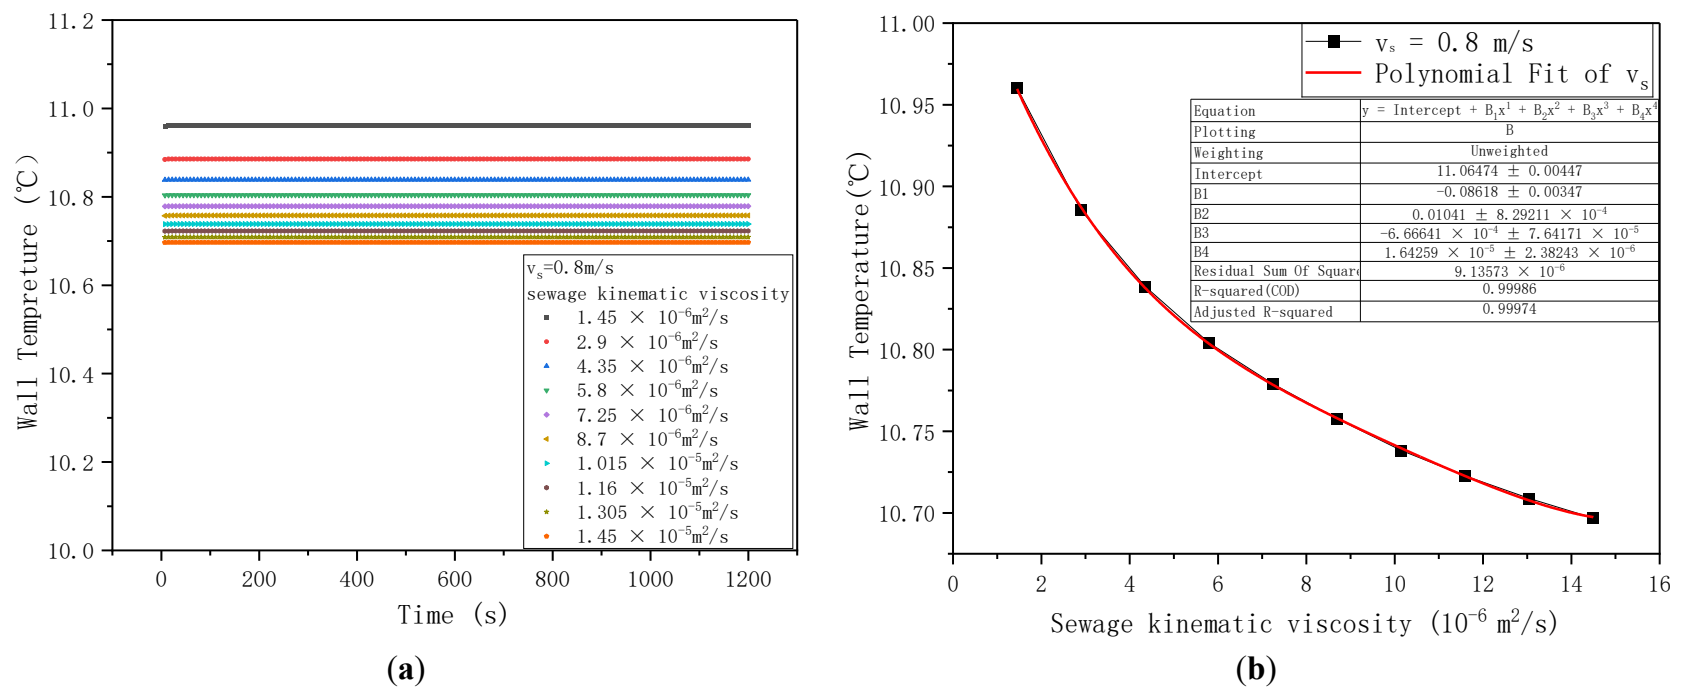
Figure 12. Wall temperature variation (Sewage flow velocity: 0.8 m/s). (a) Wall temperature variation curve; (b) Wall temperature vs. viscosity fitting curve.
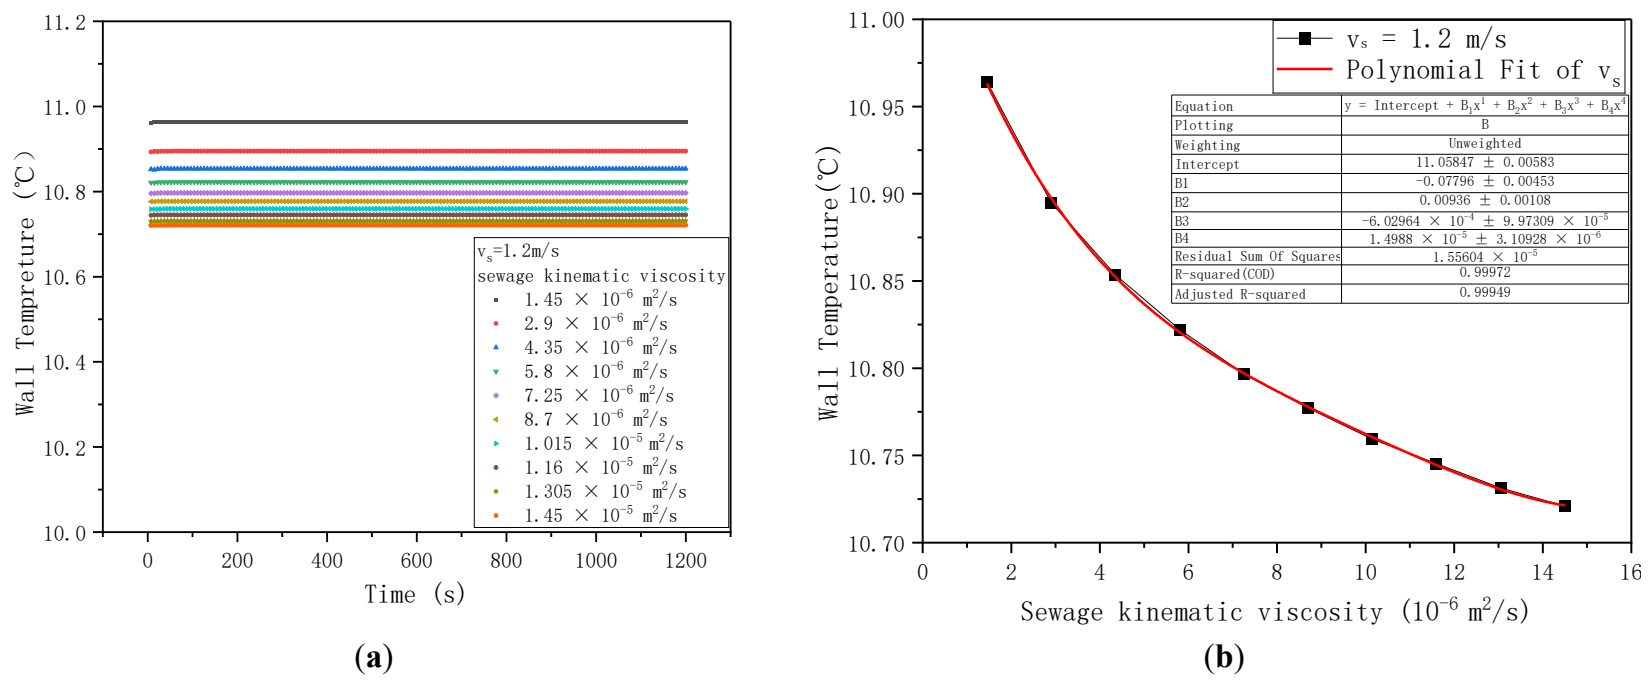
Figure 13. Wall Temperature Variation (Sewage flow velocity: 1.2 m/s). (a) Wall temperature variation curve; (b) Wall temperature vs. viscosity fitting curve.
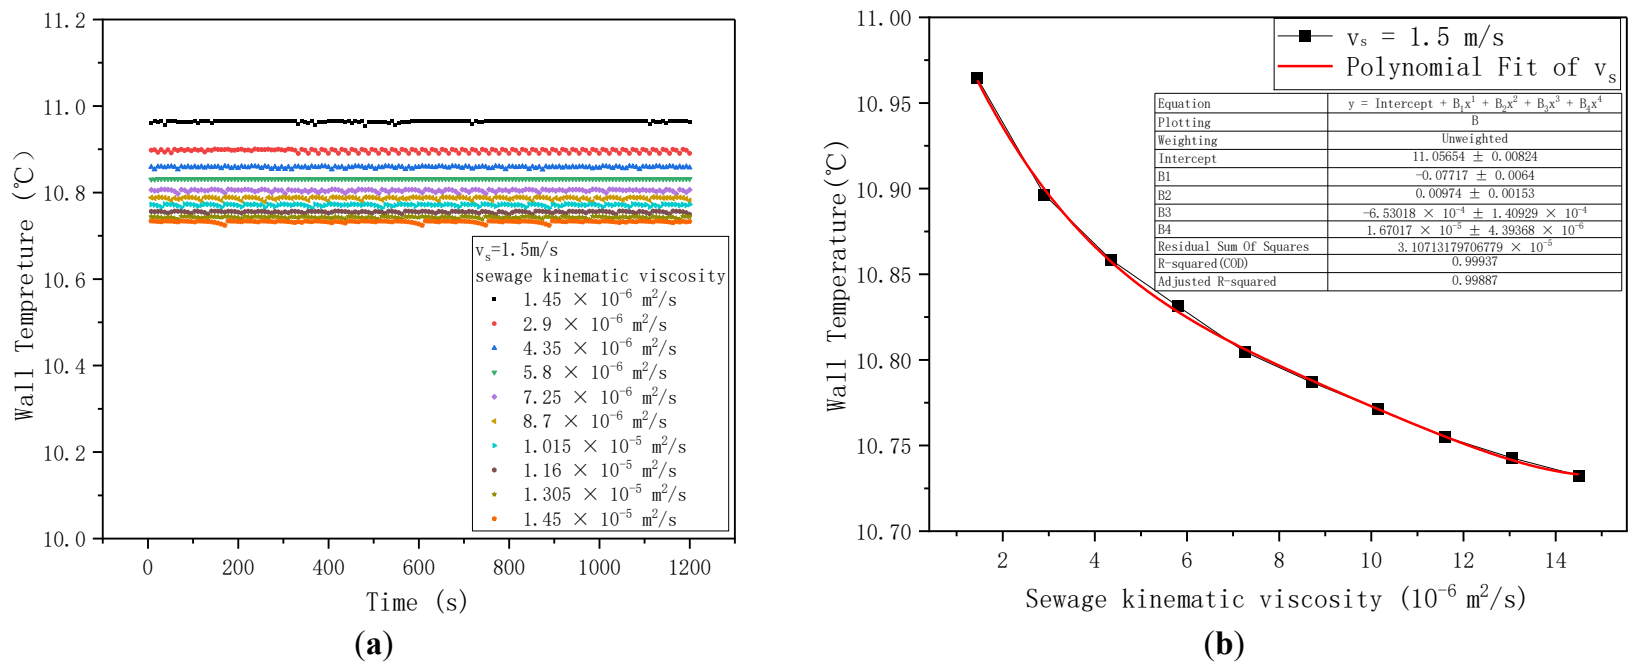
Figure 14. Wall Temperature Variation (Sewage flow velocity: 1.5 m/s); (a) Wall temperature variation curve; (b) Wall temperature vs. viscosity fitting curve.
At 0.8 m/s, the wall temperature decreases from 10.960 °C to 10.697 °C, corresponding to a reduction of 2.4%. At 1.2 m/s, it decreases from 10.964 °C to 10.721 °C, or 2.2%. At 1.5 m/s, it decreases from 10.964 °C to 10.732 °C, also about 2.2%. These results indicate that the effect of viscosity on wall temperature is slightly stronger at lower flow velocity.
This trend can be explained by the reduced turbulence intensity at low velocity. When the base flow is already weakly turbulent, a further increase in viscosity causes a more pronounced suppression of mixing and a greater thickening of the thermal boundary layer. Consequently, the convective heat transfer between sewage and wall is weakened more strongly, leading to a larger reduction in wall temperature.
For each representative velocity, a fourth-order polynomial was fitted to the steady-state wall temperature as a function of viscosity. The fitted curves show similar shapes and provide a practical way to predict wall-temperature variation over the investigated range.
0.8 m/s: $${\mathrm{t}}_{\mathrm{b}}\text{ }\text{=}\text{ }\text{11.06474}\text{ }-\text{ }\text{0.08618}{\mathrm{\nu }}_{\mathrm{s}}\text{ }\text{+}\text{ }\text{0.01041}{{\mathrm{\nu }}_{\mathrm{s}}}^\text{2}\text{ }-\text{ }\text{6.66641}\text{ }\text{×}\text{ }\text{10}^{-4}{{\mathrm{\nu }}_{\mathrm{s}}}^\text{3}\text{ }\text{+}\text{ }\text{1.64259}\text{ }\text{×}\text{ 10}^{-5}{{\mathrm{\nu }}_{\mathrm{s}}}^\text{4}$$
1.2 m/s: $${\mathrm{t}}_{\mathrm{b}}\text{ }\text{=}\text{ }\text{11.05847}\text{ }-\text{ }\text{0.07796}{\mathrm{\nu }}_{\mathrm{s}}\text{ }\text{+}\text{ }\text{0.00936}{{\mathrm{\nu }}_{\mathrm{s}}}^\text{2}\text{ }-\text{ }\text{6.02964}\text{ }\text{×}\text{ }\text{10}^{-4}{{\mathrm{\nu }}_{\mathrm{s}}}^\text{3}\text{ }\text{+}\text{ }\text{1.49855}\text{ }\text{×}\text{ }\text{10}^{-5}{{\mathrm{\nu }}_{\mathrm{s}}}^\text{4}$$
1.5 m/s: $${\mathrm{t}}_{\mathrm{b}}\text{ }\text{=}\text{ }\text{11.05654}\text{ }-\text{ }\text{0.07717}{\mathrm{\nu }}_{\mathrm{s}}\text{ }\text{+}\text{ }\text{0.00974}{{\mathrm{\nu }}_{\mathrm{s}}}^\text{2}\text{ }-\text{ }\text{6.53018}\text{ }\text{×}\text{ }\text{10}^{-4}{{\mathrm{\nu }}_{\mathrm{s}}}^\text{3}\text{ }\text{+}\text{ }\text{1.67017}\text{ }\text{×}\text{ }\text{10}^{-5}{{\mathrm{\nu }}_{\mathrm{s}}}^\text{4}$$
3.4. Combined Effects of Viscosity, Velocity, and Wall Temperature on the Heat Transfer Coefficient
Three-dimensional response surfaces were used to quantify the combined effects of flow velocity and wall temperature on the convective heat transfer coefficient under several viscosity levels, shown in Figure 15, Figure 16 and Figure 17. Across the investigated range, the heat transfer coefficient increases almost linearly with velocity. By contrast, the influence of wall temperature is much weaker. A wall-temperature increase of 0.1 °C raises the heat transfer coefficient by only about 8–12 W/(m2·K), corresponding to less than 1% change.
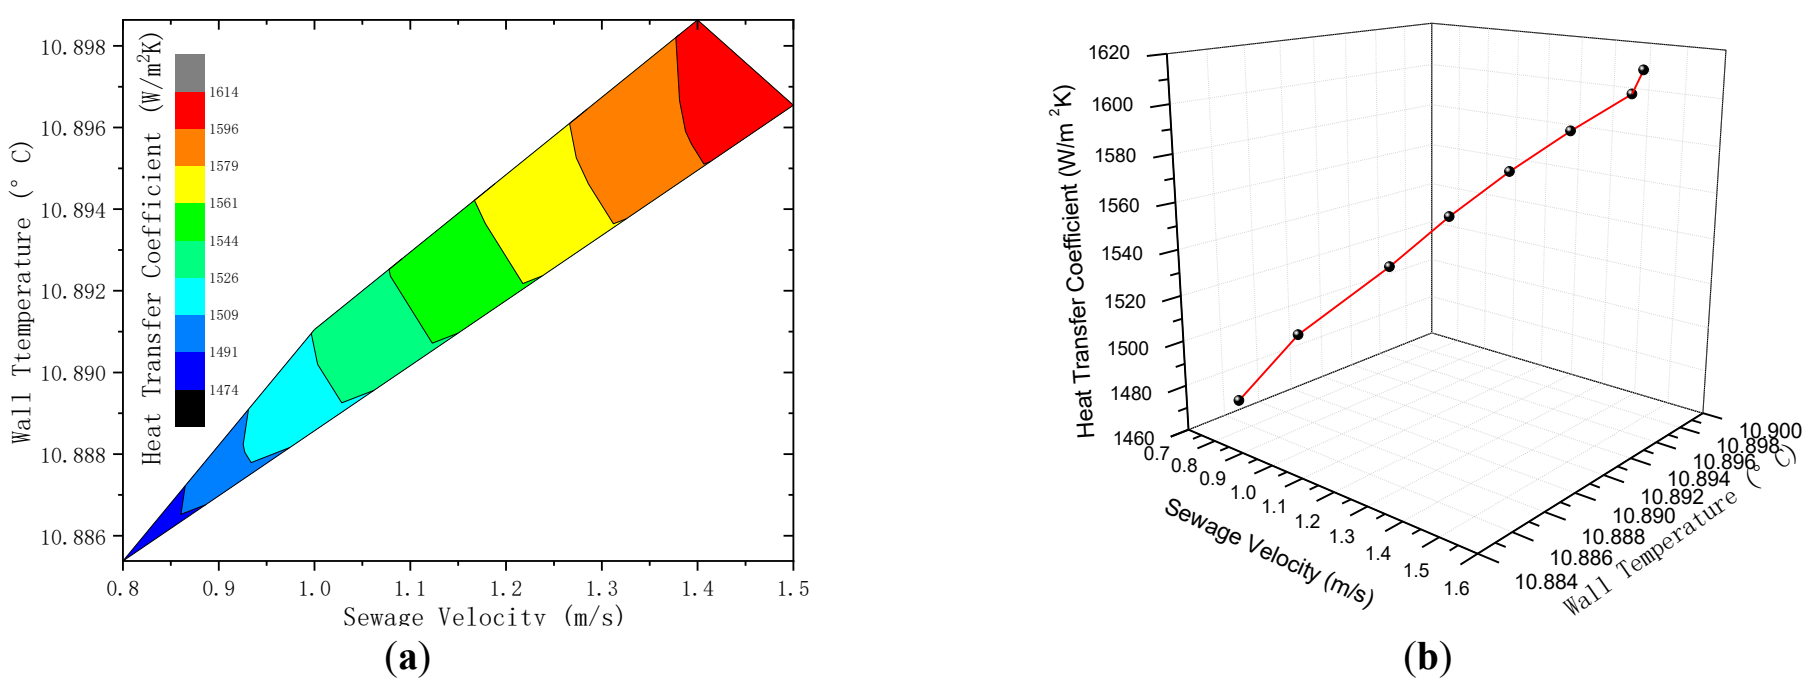
Figure 15. Combined effect diagrams under sewage kinematic viscosity 2.9 × 10⁻⁶ m2/s. (a) Contour plot; (b) 3D plot.
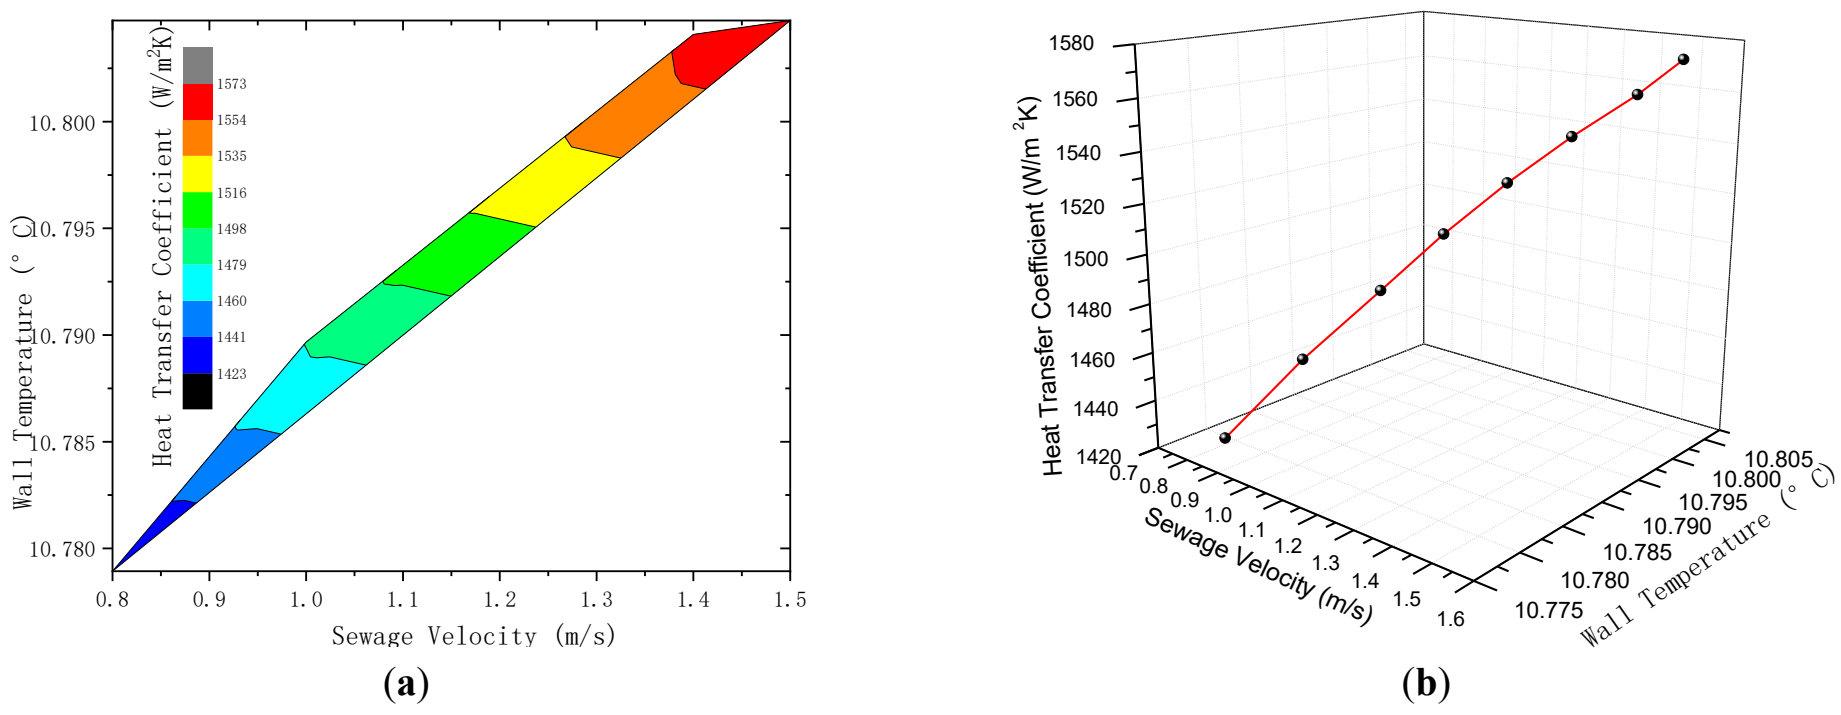
Figure 16. Combined effect diagrams under sewage kinematic viscosity 7.25 × 10⁻⁶ m2/s. (a) Contour plot; (b) 3D plot.
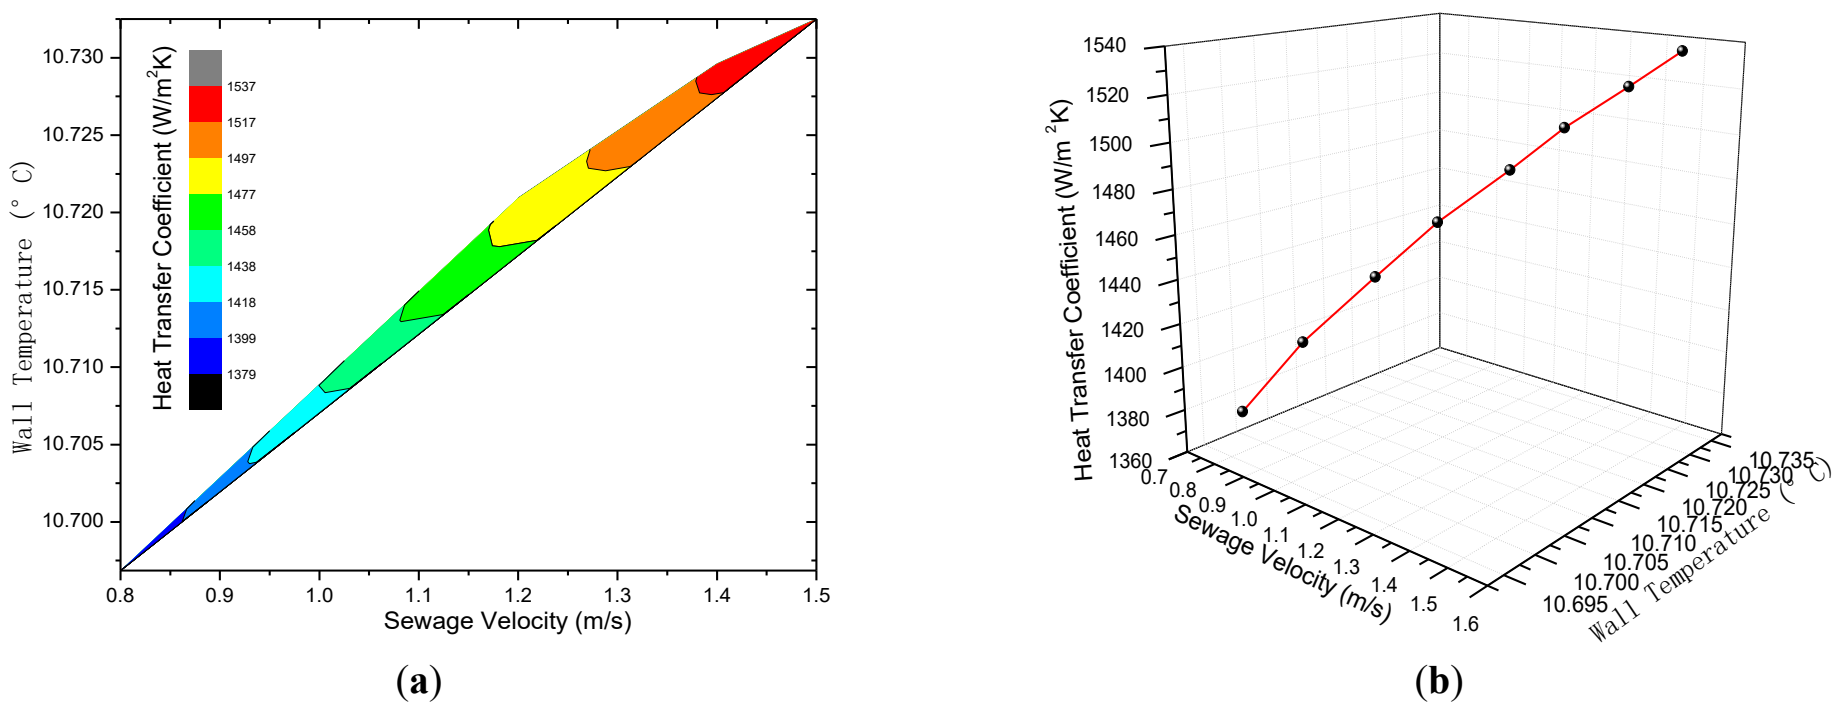
Figure 17. Combined effect diagrams under sewage kinematic viscosity 14.5 × 10⁻⁶ m2/s. (a) Contour plot; (b) 3D plot.
The combined analysis also shows a strong, nonlinear negative relationship between kinematic viscosity and the convective heat transfer coefficient, as shown in Figure 18, Figure 19 and Figure 20. At fixed flow velocity, each increase of 1 × 10⁻⁶ m2/s in kinematic viscosity reduces the heat transfer coefficient by approximately 60–100 W/(m2·K) on average. In parallel, wall temperature rises by around 0.2 °C as viscosity decreases.
At fixed viscosity, increasing the flow velocity from 0.8 to 1.5 m/s raises the heat transfer coefficient by about 120–180 W/(m2·K), corresponding to an improvement of roughly 8–12%. The sensitivity to viscosity is also more pronounced at higher velocity, which suggests that viscosity-induced property changes remain important even when stronger mixing is present.
Overall, the coupled-response results indicate that velocity is the dominant operational variable for heat transfer enhancement, whereas viscosity is the dominant physical factor constraining performance. Wall temperature acts mainly as a secondary indicator rather than a primary control variable.
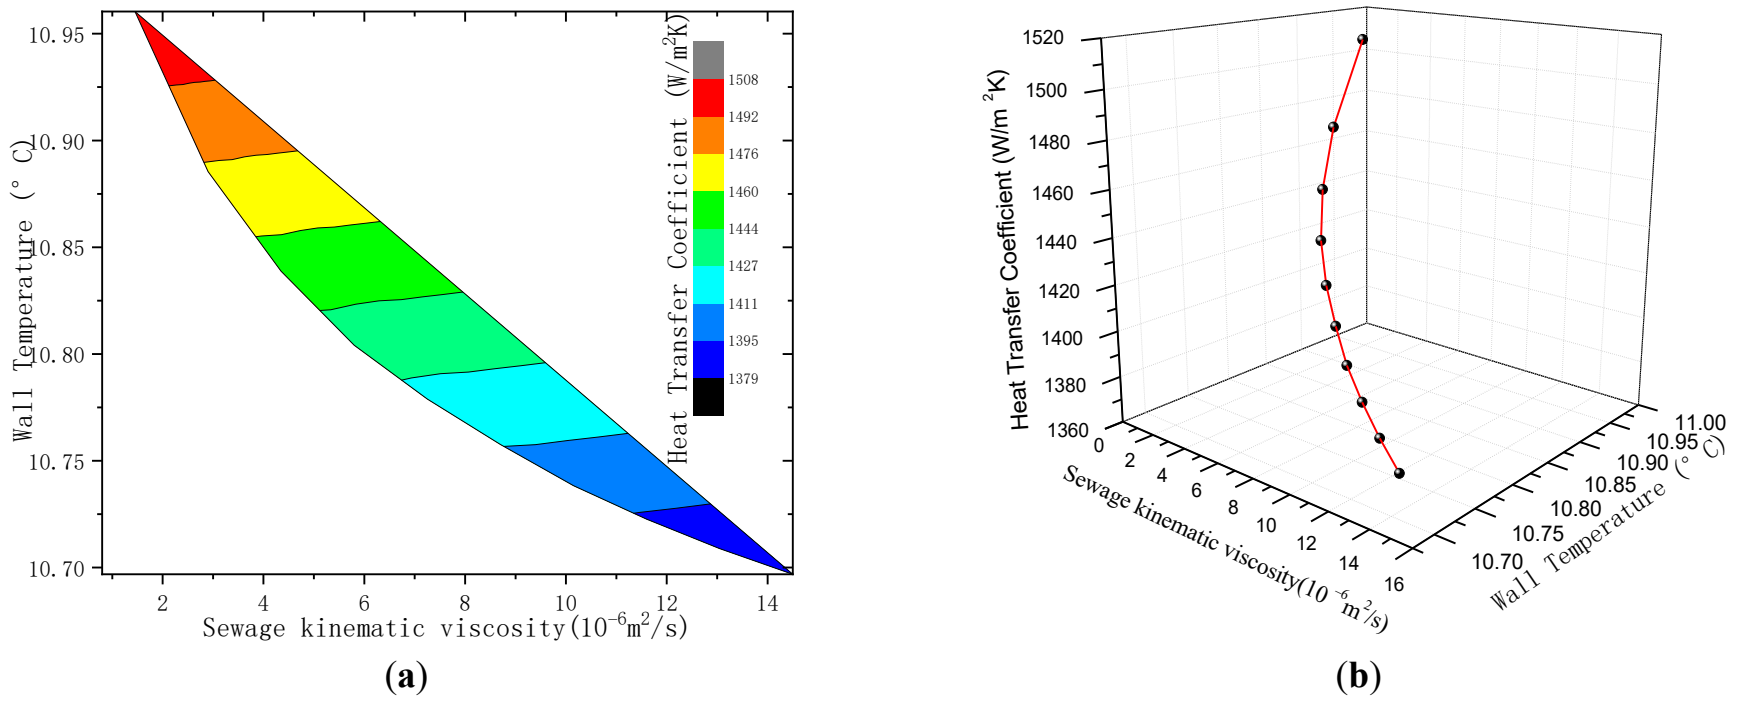
Figure 18. Combined effect diagrams under sewage velocities of 0.8 m/s. (a) Contour plot; (b) 3D plot.
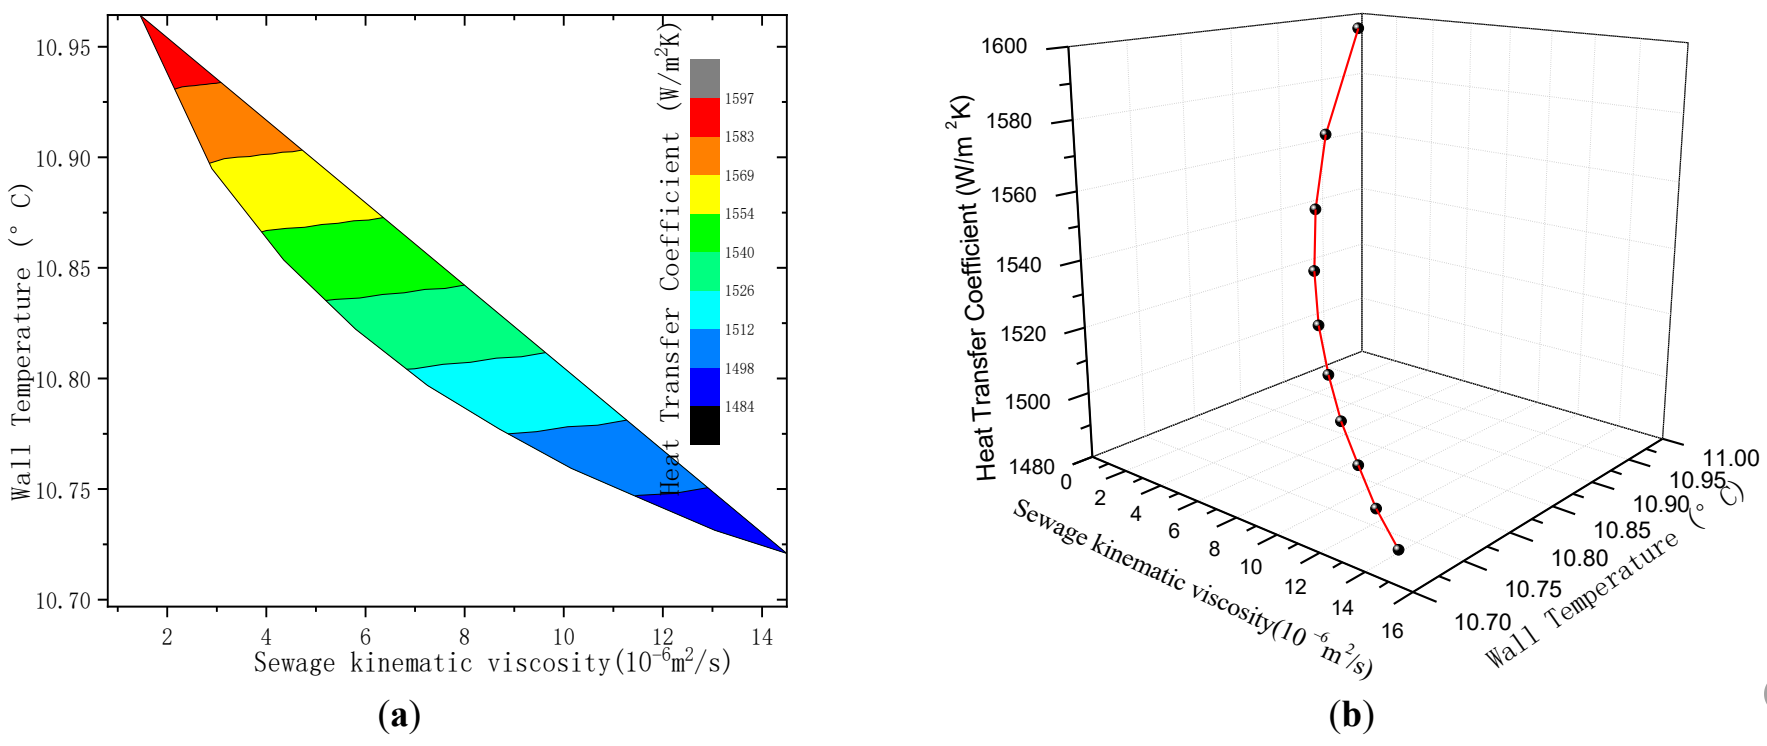
Figure 19. Combined effect diagrams under sewage velocities of 1.2 m/s. (a) Contour plot; (b) 3D plot.
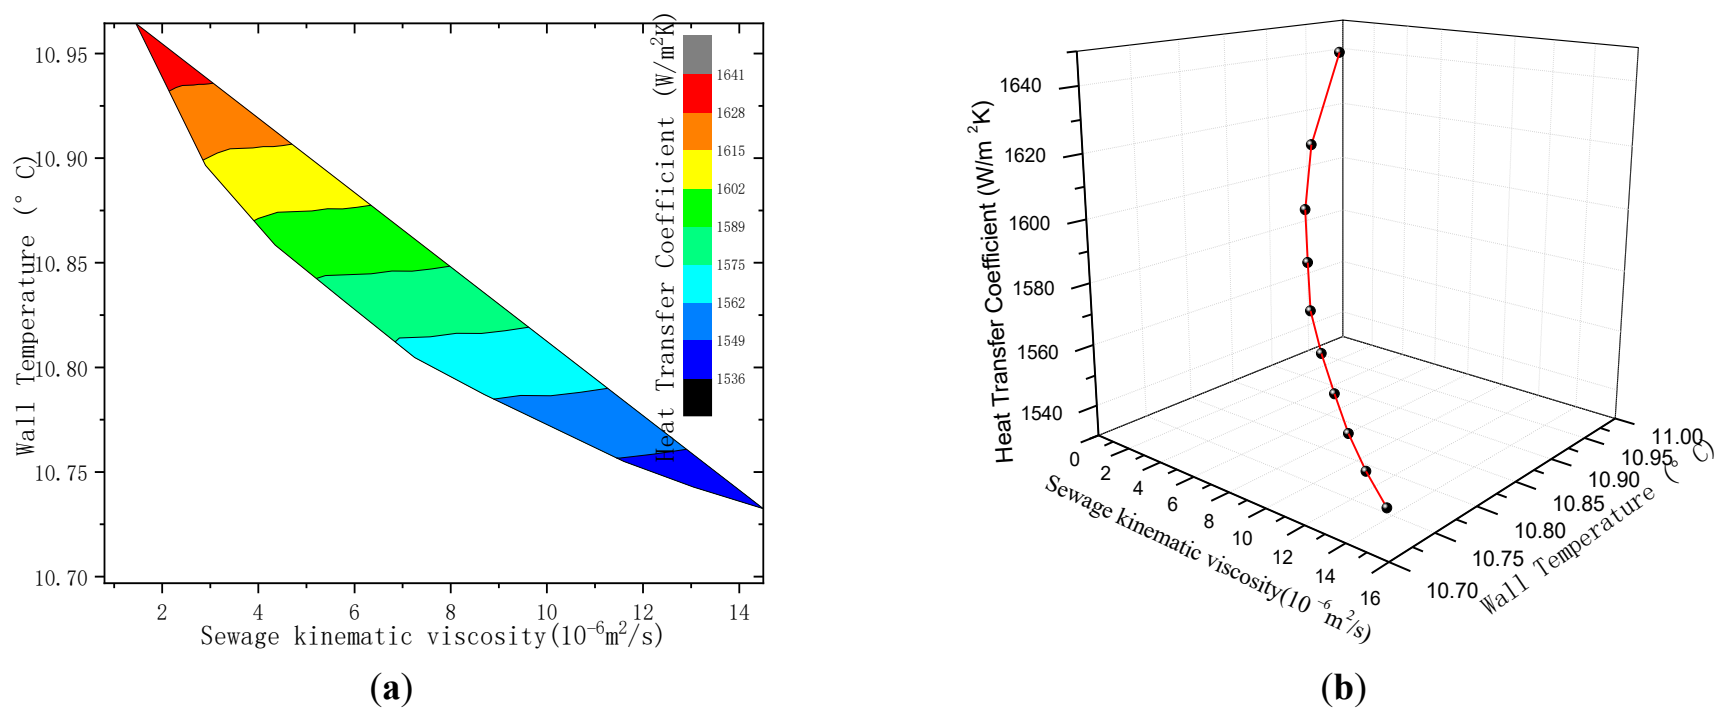
Figure 20. Combined effect diagrams under sewage velocities of 1.5 m/s. (a) Contour plot; (b) 3D plot.
3.5. Quantitative Sensitivity Analysis
A quantitative sensitivity hierarchy was established by comparing the relative variation of the heat transfer coefficient under comparable perturbation ranges. The analysis indicates that kinematic viscosity is the most influential factor, followed by flow velocity, with wall temperature having the weakest effect.
Specifically, an increase of 1 × 10⁻⁶ m2/s in kinematic viscosity causes a reduction of approximately 60–100 W/(m2·K) in the heat transfer coefficient. Over the investigated flow range of 0.8–1.5 m/s, raising velocity leads to an 8–12% improvement in performance. By contrast, a 0.1 °C change in wall temperature produces less than 1% variation in the heat transfer coefficient.
The resulting order of importance is therefore:
kinematic viscosity > flow velocity > wall temperature.
This hierarchy is consistent with the physical interpretation of the results. Viscosity directly alters the flow regime and near-wall transport, whereas velocity functions as the principal adjustable operating parameter. Wall temperature reflects the outcome of the coupled process but has a relatively limited direct effect on heat transfer coefficient variation within the investigated range.
To verify the original importance ranking, the calculation of normalized sensitivity coefficients was added.
where NCS is Normalized Sensitivity Coefficient, y0 is the baseline value of the output variable, and Δy is the change in the output variable; xi,0 is the baseline value of the i-th input parameter, and Δxi is the perturbation change in the i-th input parameter. This coefficient reflects the influence of the input parameter on the output as the ratio of percentage changes, thereby eliminating the effects caused by differences in the perturbation ranges among different parameters and ensuring the rigor of the importance ranking.
We recalculated the normalized sensitivity coefficients for each parameter based on the original perturbation data for all parameters, and the results are presented in Table 6 below. The normalized results clearly show that the kinematic viscosity of wastewater has a much greater influence on the overall heat transfer coefficient than flow velocity and mean wall temperature. The ranking of parameter importance remains: kinematic viscosity > flow velocity > wall temperature. Therefore, the reliability of the original conclusion is supported by the normalization-based analysis.
Table 6. Normalized Sensitivity Coefficient.
|
Parameter |
Baseline Value |
Perturbation Range |
Normalized Sensitivity Coefficient |
|---|---|---|---|
|
$$\nu_\text{s}\,$$(m2/s) |
1.45 × 10⁻⁶ |
1.45 × 10⁻⁶~1.45 × 10⁻⁵ |
−0.812 |
|
us (m/s) |
0.8 |
0.8~1.5 |
0.437 |
|
tb |
10.96 |
10.7~10.96 |
0.124 |
3.6. Implications for Seawater-Source Heat Pump Systems
Although the present model was developed using untreated sewage as the working fluid, the identified trends are relevant to seawater-source heat pump systems and other marine heat recovery applications. In both cases, the heat exchanger may operate under variable flow conditions and in the presence of fouling-related thermal resistance. The present results suggest that under such conditions, viscosity-related performance degradation can be partially offset by increasing flow velocity, while the resulting changes in wall temperature remain comparatively small.
The study should nevertheless be interpreted with appropriate caution. Seawater systems involve additional factors not explicitly modelled here, including salinity-dependent property variation, corrosion, and marine biofouling. Therefore, the present conclusions are best understood as mechanism-level guidance rather than direct design values for real seawater operation. Further validation under actual or simulated seawater conditions is required before quantitative extrapolation to site-specific marine systems.
4. Limitations
Several limitations of the present study should be noted. First, the model was developed and evaluated for sewage-side conditions rather than direct seawater operation. Although the coupling trends may be relevant to marine systems, the effects of salinity, corrosion, and biological fouling were not explicitly included. It should be noted that the conclusions obtained in this study are based on simulation analysis of municipal sewage, and the transferability to seawater-source heat pump (SWHP) systems requires cautious extrapolation. Compared with urban sewage, seawater has unique characteristics, including high salinity, indigenous biofouling tendency, and corrosivity, all of which are not considered in the present study. High salinity will change the thermophysical properties of seawater and may accelerate the corrosion of plate materials and change the surface adhesion characteristics of fouling; biofouling, in particular, will cause more rapid growth of thermal resistance than inorganic particulate fouling in sewage, which may further change the dynamic response behavior of wall temperature. Therefore, the conclusions of the viscosity-velocity importance hierarchy obtained in this paper cannot be directly applied to SWHP systems without verification.
Second, the fouling resistance used in the steady-state heat transfer model was prescribed as an equivalent thermal resistance rather than calculated from a time-dependent fouling growth model. The present analysis therefore, captures the effect of fouling in an approximate thermal sense but does not describe deposit evolution.
Third, the dynamic model represents wall-temperature behavior using a first-order transfer-function framework. This provides a tractable reduced-order description, but more detailed distributed-parameter models may be needed for strongly transient conditions or highly non-uniform flow distributions.
Finally, the conclusions are limited to the investigated velocity range of 0.8–1.5 m/s and the viscosity range up to 10 times that of clean water. Extrapolation beyond these ranges should be treated cautiously.
Furthermore, the thermophysical properties of sewage (kinematic viscosity, thermal conductivity, density, and specific heat) were held constant based on the average temperature of 12.5 °C in the calculation. This constant-property assumption simplifies the mathematical model and allows the isolation of velocity–viscosity interaction. However, it should be noted that the thermophysical properties of real urban sewage, especially at high contaminant concentrations (leading to high viscosity), can vary with temperature. When the actual temperature difference across the plate heat exchanger is large, or when high sewage viscosities are encountered, the temperature dependence of viscosity, thermal conductivity, and density may introduce additional errors into the heat transfer calculation. The potential impact of temperature-driven property variation on the model results has not been quantified in this study and therefore, should be regarded as a source of uncertainty. In future work, a variable-property formulation that accounts for both temperature- and composition-dependent changes should be considered to improve predictive accuracy under broader operating conditions.
5. Conclusions
A combined steady-state heat transfer model and transfer-function-based dynamic wall-temperature model were developed for a BR50 plate heat exchanger operating under variable-viscosity conditions. Numerical simulations were performed for sewage-side flow velocities of 0.8–1.5 m/s and kinematic viscosities up to 10 times that of clean water. The main conclusions are as follows.
-
-
At fixed viscosity, wall temperature increases slightly with flow velocity. Under the highest investigated viscosity, the wall temperature rises from 10.697 °C at 0.8 m/s to 10.733 °C at 1.5 m/s, corresponding to an increase of 0.036 °C. The steady-state trend can be represented by a fourth-order polynomial.
-
-
The wall-temperature dynamics follow first-order inertial behavior, and the time constant decreases with increasing flow velocity. This indicates faster thermal response at higher velocity.
-
-
Both the sewage-side heat transfer coefficient and the overall heat transfer coefficient increase with flow velocity and decrease with kinematic viscosity [2]. When the flow velocity increases from 0.8 to 1.5 m/s, the sewage-side heat transfer coefficient increases by 49.2%.
-
-
The relative gain in the overall heat transfer coefficient becomes more pronounced at higher viscosity. The increase is 11.4% at 10 times clean-water viscosity, 10.52% at 5 times clean-water viscosity, and 9.5% at 2 times clean-water viscosity when the velocity increases from 0.8 to 1.5 m/s.
-
-
Sensitivity analysis shows that the parameter importance follows the order: kinematic viscosity > flow velocity > wall temperature. Viscosity is therefore the dominant physical factor governing thermal performance, while flow velocity is the main adjustable operational variable.
Although the present study is based on untreated sewage, the identified viscosity-velocity coupling behavior is relevant to plate heat exchangers used in seawater-source heat pump systems and other coastal heat recovery applications where variable flow conditions and fouling may affect thermal performance. Future work should include direct validation under seawater conditions and explicit treatment of salinity, biofouling, and corrosion.
In summary, by integrating steady-state and dynamic approaches and providing a framework for quantitative sensitivity analysis and the evaluation of coupled flow–viscosity parameters, this study offers a more comprehensive mechanistic understanding and engineering assessment for optimizing the system performance of plate heat exchangers under realistic, fouling-prone operating conditions, such as those involving seawater-like fluids. Moreover, the conclusion obtained under the more severe operating conditions of wastewater—namely, that viscosity is the dominant limiting parameter—can serve as an early warning and provide guidance for heat exchanger design in SWHP systems, where increased fouling thermal resistance and changes in flow regime may occur.
Statement of the Use of Generative AI and AI-Assisted Technologies in the Writing Process
During the preparation of this manuscript, the author(s) used ChatGPT in order to refine sentence structure, enhance clarity, and ensure grammatical accuracy, without altering the core arguments or original ideas presented in the paper. After using this tool/service, the author(s) reviewed and edited the content as needed and take(s) full responsibility for the content of the published article.
Acknowledgements
The authors would like to thank the financial support of Tianjin Municipal Science and Technology Bureau.
Author Contributions
Conceptualization, C.L.; Methodology, C.L.; Software, C.L., N.Q., W.H. and S.Q.; Validation, W.H. and S.Q.; Formal Analysis, C.L. and N.Q.; Investigation, C.L., N.Q., W.H. and S.Q.; Resources, C.L.; Data Curation, N.Q.; Writing—Original Draft Preparation, C.L.; Writing—Review & Editing, N.Q.; Visualization, N.Q.; Supervision, N.Q.; Project Administration, N.Q.; Funding Acquisition, N.Q.
Ethics Statement
Not applicable.
Informed Consent Statement
Not applicable.
Data Availability Statement
Data will be made available on request.
Funding
This work was supported by the Tianjin Youth Fund Project [grant number 15JCQNJC06800], University-level College Students’ Innovation and Entrepreneurship Training Program of Tianjin University of Technology [grant number 202510060172].
Declaration of Competing Interest
The authors declare that they have no known competing financial interests or personal relationships that could have appeared to influence the work reported in this paper.
Nomenclature
Latin Symbols
A—heat transfer area, [m2]
c—specific heat capacity, [kJ/(kg·°C)]
d—equivalent diameter, [m]
h—heat transfer coefficient, [W/(m2·°C)]
K—overall heat transfer coefficient of heat exchanger, [W/(m2·°C)]
m—mass, [kg]
$$\stackrel{\mathrm{˙}}{\text{m}}$$—mass flow rate, [kg/s]
Nu—Nusselt number
Pr—Prandtl number
Q—heat exchange capacity, [kW]
Re—Reynolds number
r—fouling resistance, [(m2·°C)/W]
t—temperature, [°C]
u—flow velocity, [m/s]
Greek Symbols
$$\text{δ}$$—wall thickness, [m]
$$\text{Δ}$$—difference
$$\text{λ}$$—thermal conductivity, [W/(m·°C)]
$$\text{ν}$$—kinematic viscosity, [m2/s]
$$\text{β}$$—safety factor
Subscripts
b—heat exchanger wall
s—sewage water side
w—clean water side
s1—sewage water inlet
s2—sewage water outlet
w1—clean water inlet
w2—clean water outlet
References
- Liu M, Jin Z, Zhang J, Yuan Y, Ma Q, Mo X, et al. Large-Scale Language Model Assisted Construction of Multi-Source Heterogeneous Knowledge Graphs for Marine Renewable Energy. Mar. Energy Res. 2026, 3, 10002. DOI:10.70322/mer.2026.10002 [Google Scholar]
- Chen R, Samuelson H, Zou Y, Zheng X, Cao Y. Improving building resilience in the face of future climate uncertainty: A comprehensive framework for enhancing building life cycle performance. Energy Build. 2024, 302, 113761. DOI:10.1016/j.enbuild.2023.113761 [Google Scholar]
- Tomrukcu G, Ashrafian T. Climate-resilient building energy efficiency retrofit: Evaluating climate change impacts on residential buildings. Energy Build. 2024, 316, 114315. DOI:10.1016/j.enbuild.2024.114315 [Google Scholar]
- Wang Z, Akbarzadeh M, Aviv D. Multi-objective design exploration for integrated structural-environmental performance of buildings: A review. Energy Build. 2024, 322, 114638. DOI:10.1016/j.enbuild.2024.114638 [Google Scholar]
- Al-Zahrani S. Plate heat exchangers: A state-of-the-art review. Renew. Sustain. Energy Rev. 2026, 227, 116502. DOI:10.1016/j.rser.2025.116502 [Google Scholar]
- Lian JJ, Cui L, Fu Q. Offshore Renewable Energy Advance. Mar. Energy Res. 2024, 7, 10006. DOI:10.70322/mer.2024.10006 [Google Scholar]
- Ma J, Zhang X, Yu J, Wei P. Thermo-economic assessments on building heating by a sewage source heat pump coupled with heat storage system. Therm. Sci. Eng. Prog. 2024, 53, 102756. DOI:10.1016/j.tsep.2024.102756 [Google Scholar]
- Chadly A, Urs RR, Wei M, Maalouf M, Mayyas A. Techno-economic assessment of energy storage systems in green buildings while considering demand uncertainty. Energy Build. 2023, 291, 113130. DOI:10.1016/j.enbuild.2023.113130 [Google Scholar]
- Nikman SA, Mortazavi M, Li D. Additively manufactured heat exchangers: A review on opportunities and challenges. Int. J. Adv. Manuf. Technol. 2021, 112, 601–618. DOI:10.1007/s00170-020-06372-w [Google Scholar]
- Shah RK. Advances in science and technology of compact heat exchangers. Heat Transf. Eng. 2006, 27, 3–22. DOI:10.1080/01457630600559462 [Google Scholar]
- Clark D. Plate Heat Exchanger Design and Development; Brewer: London, UK, 1976. [Google Scholar]
- Wang M, Liu W. Thermal performance analysis of a new multiple flat-plate latent heat storage heat exchanger. J. Energy Storage 2024, 98, 113035. DOI:10.1016/j.est.2024.113035 [Google Scholar]
- Wang M. Experimental Study on Special Heat Exchanger for Waste Heat Recovery of Sewage. Master’s Thesis, Harbin Institute of Technology, Harbin, China, 2020. DOI:10.27061/d.cnki.ghgdu.2020.001564 [Google Scholar]
- Pardiñas ÁÁ, Kauko H, Hazarika MM, Selvnes H, Banasiak K, Hafner A. Two-stage evaporator for R744 heat pumps using greywater as heat source. Energy Build. 2023, 289, 113047. DOI:10.1016/j.enbuild.2023.113047 [Google Scholar]
- Wehbi Z, Taher R, Faraj J, Ramadan M, Castelain C, Khaled M. A short review of recent studies on wastewater heat recovery systems: Types and applications. Energy Rep. 2022, 8, 896–907. DOI:10.1016/j.egyr.2022.07.104 [Google Scholar]
- Wang Y, You S, Zheng W, Zhang H, Zheng X, Miao Q. State space model and robust control of plate heat exchanger for dynamic performance improvement. Appl. Therm. Eng. 2018, 128, 1588–1604. DOI:10.1016/j.applthermaleng.2017.09.120 [Google Scholar]
- Wu X, Wang F, Sun D, Yang W. Rheology and flow characteristic of urban untreated sewage for cooling and heating source. Exp. Therm. Fluid Sci. 2011, 35, 508–514. DOI:10.1016/j.expthermflusci.2010.11.009 [Google Scholar]
- Rios-Iribe EY, Cervantes-Gaxiola ME, Rubio-Castro E, Hernández-Calderón OM. Heat transfer analysis of a non-Newtonian fluid flowing through a plate heat exchanger using CFD. Int. J. Appl. Therm. Eng. 2016, 101, 262–272. DOI:10.1016/j.applthermaleng.2016.02.094 [Google Scholar]
- Fernandes S, Gomes IB, Simões LC, Simões M. Overview on the hydrodynamic conditions found in industrial systems and its impact in (bio)fouling formation. Chem. Eng. J. 2021, 418, 129348. DOI:10.1016/j.cej.2021.129348 [Google Scholar]
- Liang B, Chen M, Fu BA, Guan J. Thermal and flow characteristics in a vertical spiral-type ground heat exchanger based on linear non-equilibrium thermodynamic principle. Energy Build. 2022, 266, 112111. DOI:10.1016/j.enbuild.2022.112111 [Google Scholar]
- Vavřička R, Boháč J, Matuška T. Experimental development of the plate shower heat exchanger to reduce the domestic hot water energy demand. Energy Build. 2021, 254, 111536. DOI:10.1016/j.enbuild.2021.111536 [Google Scholar]
- Wang K, Peng Y, Chen J, Wu P. Investigating subcooled flow boiling heat transfer and fluid dynamics within a shell-and-plate heat exchanger. Appl. Therm. Eng. 2025, 258, 124679. DOI:10.1016/j.applthermaleng.2024.124679 [Google Scholar]
- Xu Z, Jia Y, Wang B, Zhang Y, Liu Z, Wang J. Experimental analysis on bio-fouling of iron bacteria on plate heat exchanger. CIESC J. 2013, 64, 3178–3182. DOI:10.3969/j.issn.0438-1157.2014.08.045 [Google Scholar]
- Zhang Z. Experimental Study on Sewage Flow and Heat Transfer Characteristics in Tube with Unsymmetrically Heated Walls. Master’s Thesis, Dalian University of Technology, Dalian, China, 2018. Available online: https://kns.cnki.net/reader/flowpdf?invoice=dRsJFdfqdeDD9b88tHUMe7VCWiqBHoe%2FAtiNqBioP0Ph24juB%2FWfezUjJv2cNUsPjppKt%2B9j2rcFRqAVig36RA8cny4vQFDaG37WztOTKMcBd2UsSdRwWhCSiRzb2CKLCDFy3u8mseUbXdGnhoJyxwFENG8LvM2gvKW7PfymyE4%3D&platform=NZKPT&sourcetype=nxgp&product=CMFD&filename=1018869934.nh&tablename=cmfd201901&type=DISSERTATION&scope=trial&cflag=overlay&dflag=pdf&pages=&language=CHS&trial=&nonce=2E12B094D2144E5CA0025A851CE8FED7 (accessed on 7 June 2018).
- Niezgoda-Żelasko B, Kuchmacz J. CFD modelling of the flow of ice slurry in plate heat exchanger channels. Energy 2025, 317, 134700. DOI:10.1016/j.energy.2025.134700 [Google Scholar]
- Yang Q, Tong Z, Tong S, Wang Z, Wang H, Wang Y, et al. Collaborative optimization of high-efficiency and anti-fouling for pillow plate heat exchangers in waste heat recovery. Appl. Therm. Eng. 2025, 276, 126985. DOI:10.1016/j.applthermaleng.2025.126985 [Google Scholar]
- Zhu C, Wang Z, Tian Z, Duan H, Luo S, Cai R. Research on Heat Transfer Characteristics of Parallel Plate Heat Exchanger Clusters for District Cooling Systems. J. Tianjin Univ. Sci. Technol. 2025, 58, 1031–1044. Available online: https://kns.cnki.net/nzkhtml/xmlRead/trialRead.html?dbCode=CJFD&tableName=cjfdlast2025&fileName=TJDX202510004&fileSourceType=1&appId=KNS_BASIC_PSMC&invoice=Wb3jACcZuOfC9f5ea7pUgpPmfDc9ei4TSKuDfh/7ECIKaDpm9e0NL4v/jeaKlrS9tr8HDbhab/c6BtcYBHW01gpHecUWoHmRkYj4jFGzpYejB8LitxVdGOP+dQ2D4WnEodFpdcTbewr++Uytb/Ms0S1dJPWIUNKVYWAv6vkIeyo=&platform=NZKPT&type=JOURNAL&cflag=html&trial=&nonce=691AB1521DA245FA9E1517602D55105B (accessed on 24 December 2024).
- Xu H, Liu Q, Qiu H, Ni S, Yang C, Wu Y, et al. Numerical investigation on the nonuniform flow distribution and its impact on the heat transfer performance in the microchannel plate heat exchanger. Appl. Therm. Eng. 2026, 284, 129157. DOI:10.1016/j.applthermaleng.2025.129157 [Google Scholar]
- Shi Q, Song C, Pan W, Lei Y. Flow and heat transfer characteristics and comprehensive evaluation of asymmetric plate heat exchangers for centralized heat supply. Appl. Therm. Eng. 2024, 257, 124306. DOI:10.1016/j.applthermaleng.2024.124306 [Google Scholar]
- Wan X, Song K, Dong H, Hou Q, Wu X, He A, et al. Performance improvement of wavy-plate heat exchanger by vortex generators with adjacent-reverse arrangement. Int. J. Therm. Sci. 2025, 215, 109982. DOI:10.1016/j.ijthermalsci.2025.109982 [Google Scholar]
- Prabakaran R, Mohanraj T, Dhamodharan P, Kim SC. Comparative condensation analysis of low-GWP refrigerants in a plate heat exchanger with response surface methodology optimization. Int. Commun. Heat Mass Transf. 2025, 169, 109653. DOI:10.1016/j.icheatmasstransfer.2025.109653 [Google Scholar]
- Berce J, Zupančič M, Može M, Golobič I. Local temperature distribution of a plate heat exchanger undergoing crystallization fouling. Heat Mass Transf. 2025, 61, 68. DOI:10.1007/s00231-025-03593-1 [Google Scholar]
- Wang Q, Zhang X, Geng X, Chen X, Xing M. Experiments on the characteristics of a sewage water source heat pump system for heat recovery from bath waste. Appl. Therm. Eng. 2022, 204, 117956. DOI:10.1016/j.applthermaleng.2021.117956 [Google Scholar]
- Hirokawa T, Imamura T, Kawanami O. Local heat transfer and dryout behavior in a plate heat exchanger using a thin-wall measurement method. Appl. Therm. Eng. 2025, 281, 128708. DOI:10.1016/j.applthermaleng.2025.128708 [Google Scholar]
- Li Y, Lü Y, Wang F. Study on heat transfer enhancement of supercritical CO2 in printed circuit plate heat exchangers. Cryogenics Supercond. 2025, 53, 36–45. DOI:10.16711/j.1001-7100.2025.09.009 [Google Scholar]
- Krishnan EN, Muneeshwaran M, Rendall J, Brechtl J, Nawaz K. Experimental investigation on heat transfer performance of drain water heat recovery heat exchangers. Energy Build. 2025, 346, 116213. DOI:10.1016/j.enbuild.2025.116213 [Google Scholar]
- Ma D. Study on Heat Transfer Characteristics of Heat Exchangers Under Fluctuating Reclaimed Water Flow and Its Impact on Heat Transfer Performance. Master’s Thesis, Xi’an University of Architecture and Technology, Xi’an, China, 2017. Available online: https://kns.cnki.net/reader/flowpdf?invoice=P%2FwtyZcZpXiGa5tnCtZym8EXs2NPFbW43l0VK8DzQUSzAr8D35CuMKOJBuE6R0G9dR%2FivL5McvVkoSHd7LLtL72Nq8cszqD8jyl90hvw4lY4CXz2Vpe%2FJ6Q5v%2FEWKHbUzPwWElz%2B%2BJmI4smHK9hg3%2FCa5KWbD7%2FVWVjzr%2FFonJQ%3D&platform=NZKPT&sourcetype=nxgp&product=CMFD&filename=1017737158.nh&tablename=cmfd201802&type=DISSERTATION&scope=trial&cflag=overlay&dflag=pdf&pages=&language=CHS&trial=&nonce=579BA95590B34DFF8E9625FA203290E7 (accessed on 4 June 2017).
- Zeng Q, Zhou W, Xu H, Yu J, Wang Z, Zhang Y, et al. Impact of fouling in the thin-plate cut tobacco dryer on equipment process performance. J. Zhengzhou Univ. Light Ind. Nat. Sci. Ed. 2025, 40, 58–63. DOI:10.12187/2025.01.007 [Google Scholar]
- Du Y, Wei W, Xu C, Wang Y, Li X. Heat transfer characteristics of single-phase flow through dimple plate heat exchanger. Appl. Therm. Eng. 2025, 273, 126499. DOI:10.1016/j.applthermaleng.2025.126499 [Google Scholar]
- Yang J, Jacobi A, Liu W. Heat transfer correlations for single-phase flow in plate heat exchangers based on experimental data. Appl. Therm. Eng. 2017, 113, 1547–1557. DOI:10.1016/j.applthermaleng.2016.10.147 [Google Scholar]
- Xuan W, Xu C, Qian C, Wang J, Jiang Z, Ma R, et al. Numerical simulation and thermodynamic test analysis of plate heat exchanger based on topology optimization. Appl. Therm. Eng. 2024, 255, 123882. DOI:10.1016/j.applthermaleng.2024.123882 [Google Scholar]
- Piper M, Zibart A, Djakow E, Springer R, Homberg W, Kenig EY. Heat transfer enhancement in pillow-plate heat exchangers with dimpled surfaces: A numerical study. Appl. Therm. Eng. 2019, 153, 142–146. DOI:10.1016/j.applthermaleng.2019.02.082 [Google Scholar]
- Joybari MM, Selvnes H, Sevault A, Hafner A. Potentials and challenges for pillow-plate heat exchangers: State-of-the-art review. Appl. Therm. Eng. 2022, 214, 118739. DOI:10.1016/j.applthermaleng.2022.118739 [Google Scholar]
- Few J, Manouseli D, McKenna E, Pullinger M, Zapata-Webborn E, Elam S, et al. The over-prediction of energy use by EPCs in Great Britain: A comparison of EPC-modelled and metered primary energy use intensity. Energy Build. 2023, 288, 113024. DOI:10.1016/j.enbuild.2023.113024 [Google Scholar]
- Sun Y, Zhai P, Ning J, Zheng C, Zhang S, Liu C, et al. An integrated system of sinusoidal-corrugated plate heat exchanger and thermoelectric modules for wastewater heat recovery. Energy Convers. Manag. 2022, 267, 115885. DOI:10.1016/j.enconman.2022.115885 [Google Scholar]
- Strobel M, Beckedorff LE, Martins GSM, Oliveira JLG, Paiva KV. Experiments on Gasketed Plate Heat Exchangers with Segmented Corrugation Pattern. ASME J. Heat Transf. 2024, 146, 101901. DOI:10.1115/1.4065453 [Google Scholar]
- Martins GSM, Zanzi MS, de Paiva KV, de Oliveira AAM, Oliveira JLG. Mechanical stress analysis of various GPHE corrugated plates during the assembly and in working conditions. Int. J. Press. Vessel. Pip. 2023, 206, 105013. DOI:10.1016/j.ijpvp.2023.105013 [Google Scholar]
- Arsenyeva O, Tovazhnyansky L, Kapustenko P, Klemeš JJ, Varbanov PS. Review of Developments in Plate Heat Exchanger Heat Transfer Enhancement for Single-Phase Applications in Process Industries. Energies 2023, 16, 4976. DOI:10.3390/en16134976 [Google Scholar]
- dos Santos FJ, Silva RPP, de Paiva KV, Oliveira JLG. Evaluation of plate heat exchangers comprising sections with different chevron angle arrangements. Appl. Therm. Eng. 2024, 249, 123452. DOI:10.1016/j.applthermaleng.2024.123452 [Google Scholar]
- Zahan I, Nasrin R, Jakia NJ. Data analysis for performance index of plate heat exchanger filled by ionanofluid-oil: Parallel versus counterflow. Sci. Rep. 2025, 15, 4688. DOI:10.1038/s41598-025-88851-2 [Google Scholar]
- Muneeshwaran M, Kim HJ, Tayyab M, Tayyab M, Li W, Nawaz K, et al. Flow maldistribution in plate heat exchangers—Impact, analysis, and solutions. Renew. Sustain. Energy Rev. 2025, 207, 114905. DOI:10.1016/j.rser.2024.114905 [Google Scholar]