
A Study on Site Selection and Capacity Allocation of a Four-Energy Complementary Power Generation System in the Zhoushan Archipelago Based on the Analytic Hierarchy Process

A Study on Site Selection and Capacity Allocation of a Four-Energy Complementary Power Generation System in the Zhoushan Archipelago Based on the Analytic Hierarchy Process
Mengjie Hu
1
 Qilin Zhang
1
Xiangyang Li
1
Min Luo
2
Xin Jin
1,*
Qilin Zhang
1
Xiangyang Li
1
Min Luo
2
Xin Jin
1,*
Received: 07 May 2026 Revised: 26 May 2026 Accepted: 22 June 2026 Published: 30 June 2026

© 2026 The authors. This is an open access article under the Creative Commons Attribution 4.0 International License (https://creativecommons.org/licenses/by/4.0/).
1. Introduction
With the global transition toward low-carbon energy, marine renewable energy has become vital for island power systems. Regions like the Zhoushan Archipelago possess diverse resources—including wind, wave, tidal-current, and solar energy—enabling localized multi-energy complementary generation [1]. However, early-stage planning requires a systematic investigation that integrates resource variability, engineering conditions, and marine-use constraints to optimize both site selection and capacity allocation [2].
The stable operation of single-source systems is often constrained by resource variability. Albadi and El-Saadany [3] pointed out that wind power’s intermittency and forecasting errors strain system reserves and scheduling. Similarly, Denholm and Margolis [4] noted that high photovoltaic integration can lead to solar curtailment and flexibility deficits. For marine energy, Reguero et al. [5] found that wave resources exhibit substantial multi-scale variability, while Lewis et al. [6] highlighted that tidal-current development is limited by bathymetry and velocity thresholds. Consequently, a single energy pathway rarely meets the long-term stability requirements of isolated island grids.
To mitigate these instabilities, multi-energy complementary systems utilize temporal and spatial synergies. Jurasz et al. [7] systematically reviewed these complementarities, noting their capacity to smooth output fluctuations. For specific combinations, Fusco et al. [8] demonstrated that combining wind and wave energy reduces total output variability, while Neto et al. [9] found that the periodicity of tidal-current energy partially compensates for the randomness of wind and solar power. As research shifts toward capacity optimization, Zhu et al. [10] successfully determined the optimal capacity allocation for an island hybrid microgrid via multi-objective optimization. However, for island-based four-energy systems (wind, wave, tidal, and solar), a unified framework integrating temporal complementarity, site suitability, and capacity allocation remains underdeveloped.
However, the indicator systems used in existing GIS-MCDM site-selection studies still provide insufficient support for island-based multi-energy complementary systems. On the one hand, the site-selection frameworks proposed by Vasileiou et al., Tian et al., and Yousefi et al. primarily incorporate resources into the evaluation as spatial-intensity indicators. Their focus remains on spatial suitability issues, such as identifying areas with stronger resources, easier construction conditions, and fewer constraints [11,12,13]. In contrast, Jurasz et al.’s review of renewable energy complementarity indicates that the value of multi-energy complementarity is reflected not only in the spatial distribution of resources but also in temporal complementarity, availability coverage, and output smoothing [7]. This implies that for island systems that combine wind, wave, tidal-current, and solar energy, candidate-site suitability should not be determined solely by individual resource intensity and engineering constraints. It should also account for whether multiple resource types can complement one another over time. Furthermore, existing reviews have highlighted the need to distinguish exclusion criteria from evaluation criteria in renewable energy site selection [2]. In marine areas with intensive maritime activities, such as the Zhoushan Archipelago, factors such as nature reserves, cultural heritage zones, and areas occupied by existing marine engineering projects have distinct non-compensatory attributes. If these factors are directly incorporated into a standard weighted scoring system, high resource scores may mathematically offset compliance risks. Consequently, site selection for island-based four-energy complementary systems requires the integration of multi-source temporal complementarity, exclusionary-constraint screening, and the internal ranking of viable sites within a single decision-making framework.
Beyond spatial siting, capacity allocation is crucial for operational stability. Luna-Rubio et al. [14] noted that capacity optimization requires balancing reliability, economics, and performance. Alshammari and Asumadu [15] demonstrated that the capacity ratios of different energy units directly impact system reliability. Building on this, Elkadeem et al. [16] proposed a framework that connects geospatial multi-criteria analysis with energy-economic optimization. For four-energy systems, it remains essential to analyze how installed capacity ratios influence combined-output fluctuations at selected sites.
In light of the above issues, this paper takes the Zhoushan Archipelago as its study area and develops a screening-level site selection and preliminary capacity allocation framework for a four-energy complementary power generation system comprising wind, wave, tidal, and solar energy. Firstly, exclusionary factors—such as nature reserves, cultural heritage areas, and existing marine engineering occupation zones—are treated as preliminary logical veto conditions, thereby achieving a structural separation between feasibility screening and the ranking of viable sites. Secondly, a comprehensive AHP evaluation system is established, which incorporates resource conditions, natural and engineering conditions, socio-economic conditions, and environmental constraints. Within the resource conditions, the Four-Energy Complementarity-Synergy Index (Isyn) is introduced to characterize the combined availability coverage of wind, wave, tidal, and solar energy across the temporal dimension. Furthermore, the TOPSIS method is employed as an alternative MCDM tool to assess the sensitivity of the AHP ranking results to the choice of evaluation method. Finally, using the shortlisted candidate sites, a minimum variance capacity allocation model is established to determine the optimal installed capacity ratios among different energy types and to analyse their impact on the fluctuation of the combined power output. By integrating preliminary logical screening, AHP-based suitability ranking, Isyn temporal complementarity evaluation, TOPSIS robustness verification, and capacity allocation analysis, this paper aims to provide a decision-making framework that features a clear structure, verifiable processes, and ease of updating. This framework is intended for the preliminary site screening, comparison of candidate schemes, and initial capacity allocation of multi-energy complementary offshore power stations in archipelago regions.
2. Materials and Methods
This section presents the methodology for screening-level site selection and preliminary capacity allocation of a four-energy complementary power generation system in the Zhoushan Archipelago. The research process includes the compilation of candidate sites and their baseline attributes, logical veto screening and indicator standardization, AHP weight calculation and comprehensive suitability evaluation, and capacity allocation analysis for the preferred site. The following subsections describe the study area and candidate sites, data sources and derived indicators, the hierarchical indicator system, indicator processing methods, AHP weight determination, comprehensive score calculation, and the capacity allocation model.
2.1. Study Area and Candidate Sites
The Zhoushan Archipelago is located in northeastern Zhejiang Province, south of the Yangtze River Estuary. Comprising more than 1390 islands, it is one of the most densely distributed offshore island regions in China [17]. The East China Sea monsoon provides sustained wind and wave resources, while the topographic constraints of the Zhoushan Channel create a strong tidal-current corridor. In addition, relatively low cloud cover and favorable latitudinal conditions support stable solar radiation input. These characteristics provide favorable conditions for the co-located development of wind, wave, tidal, and solar energy. However, the presence of dense fishing grounds, shipping lanes, and marine spatial control restrictions means that not all resource-rich areas are suitable for engineering development. This overlap between abundant energy resources and intensive maritime-use constraints makes the Zhoushan Archipelago a representative case for applying a multi-energy complementary site selection framework.
The candidate sites were identified in two phases. In the first phase, a preliminary screening was conducted based on the offshore resource assessment of the Zhoushan Archipelago, using multi-source public data and regional numerical simulations. Wind speed, significant wave height, tidal current velocity, and solar irradiance energy density were selected as primary indicators. Engineering constraints, including water depth range (10–50 m), seabed geological suitability, and distance from shore, were also considered. Meanwhile, nature reserves, cultural heritage areas, and existing marine engineering occupation zones were treated as hard exclusion criteria. Areas violating any of these constraints were directly excluded from subsequent evaluation [18]. In the second phase, six candidate sites (M1–M6) were selected from the areas that passed the initial screening. The selection considered resource representativeness, variation in engineering installation conditions, and compatibility with marine functional zoning. These sites were considered technically feasible and subsequently included in the comprehensive multi-criteria evaluation [14].
It should be noted that M1–M6 are not globally optimal sites identified through an exhaustive grid search of the entire study area. Instead, they represent a shortlist of feasible sites selected through screening based on resource endowment, engineering construction conditions, and marine-use constraints. The candidate sites differ substantially in resource composition and engineering conditions. Some sites have abundant wind and wave resources but face challenges such as greater water depth or longer distances from shore. Others offer better engineering accessibility but have relatively weaker resource intensity or temporal complementarity. This trade-off between resource advantages and engineering feasibility provides the basis for the subsequent multi-criteria evaluation.
Figure 1 shows the spatial distribution of candidate sites M1–M6 within the offshore study area of the Zhoushan Archipelago, highlighting their relative geographic locations and spatial dispersion. To support the subsequent AHP-based comprehensive evaluation, this study further summarizes the spatial location, individual resource conditions, resource complementarity indicators, and engineering accessibility of each candidate site. Among these indicators, Isyn is derived from hourly time-series data of wind, wave, tidal, and solar energy. It is used to characterize the temporal availability coverage of multiple energy resources. Its complete definition and calculation method are provided in Section 2.3.
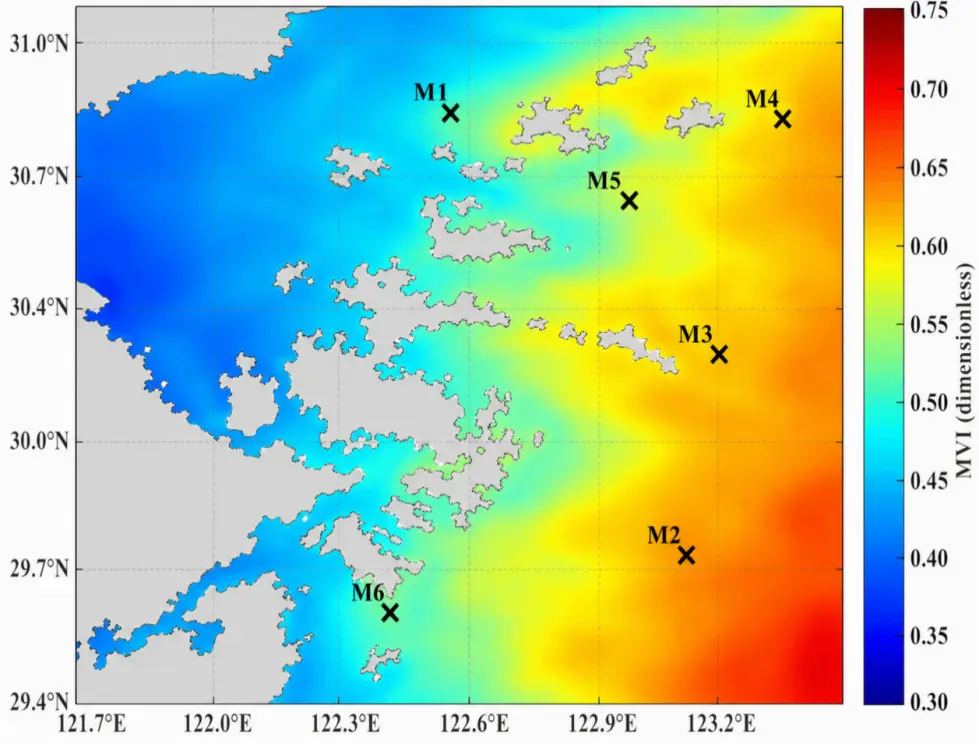
Figure 1. Spatial distribution of candidate sites (M1–M6) in the study area off the Zhoushan Archipelago.
Table 1 shows the basic attribute matrix used for the subsequent AHP-based comprehensive evaluation. Average wind speed, significant wave height, average current velocity, and solar energy density are used to characterize the individual resource conditions of the candidate sites, while Isyn further describes the temporal coverage capacity of multiple energy resources. Water depth and distance from shore reflect engineering-related factors, including foundation type selection, construction complexity, subsea cable transmission requirements, and operation and maintenance accessibility. As shown in Table 1, the six candidate sites differ considerably in terms of resource endowment and engineering conditions, indicating a clear trade-off between resource advantages and engineering feasibility. Therefore, the subsequent evaluation should not rely on a single resource-based ranking. Instead, a multi-criteria assessment is required to comprehensively evaluate site suitability.
Table 1. Site Comprehensive Evaluation Data Sheet.
|
Site |
Longitude (°E) |
Latitude (°N) |
Wind Speed (m/s) |
Significant Wave Height Hs (m) |
Mean Current Velocity (m/s) |
Solar Energy Density (kJ/m2) |
Isyn |
Water Depth (m) |
Distance to Shore (km) |
|---|---|---|---|---|---|---|---|---|---|
|
M1 |
122.30 |
30.74 |
6.26 |
0.66 |
0.78 |
611.12 |
0.9663 |
10.39 |
11.28 |
|
M2 |
122.80 |
29.70 |
6.79 |
1.39 |
0.48 |
293.80 |
0.9813 |
32.33 |
41.63 |
|
M3 |
122.90 |
30.16 |
6.65 |
1.35 |
0.41 |
595.07 |
0.9686 |
43.64 |
13.64 |
|
M4 |
123.00 |
30.72 |
6.59 |
1.33 |
0.58 |
600.60 |
0.9746 |
33.41 |
17.21 |
|
M5 |
122.70 |
30.52 |
6.46 |
0.92 |
0.53 |
603.54 |
0.9414 |
34.59 |
19.35 |
|
M6 |
122.20 |
29.56 |
6.16 |
1.18 |
0.67 |
586.86 |
0.9214 |
8.01 |
9.10 |
2.2. Data Sources and Evaluation Indicator System
The data used in this study characterize resource, engineering, socio-economic, and environmental conditions, serving as fundamental inputs for the AHP-based evaluation. For the four resource categories, 20-year wind and solar data, along with wind-field data used to drive wave simulations, are derived from the ECMWF ERA5 reanalysis dataset [19]. Tidal-current velocities are obtained via MIKE hydrodynamic simulations of the East China Sea [20]. Additionally, basic geographic data supporting bathymetric and topographic analyses are sourced from NOAA and GEBCO global datasets [21,22].
Based on these datasets, a comprehensive evaluation system is constructed using quantitative indicators (e.g., average wind speed, significant wave height, and water depth) and qualitative factors (e.g., seabed geology, marine spatial planning, and shipping traffic). As shown in Figure 2, the AHP framework follows a four-level hierarchy: the goal layer (optimal site selection), the criteria layer (C1 resource, C2 natural/engineering, C3 socio-economic, and C4 environmental conditions), the sub-criteria layer (specific indicators), and the alternative layer (six candidate sites, M1–M6). Through standardization, scoring, and logical veto screening, these indicators enable the AHP weight calculation and final suitability assessment.
Within this evaluation system, C1 Resource Conditions are used to characterize the development potential of wind, wave, tidal-current, and solar energy. This criterion includes individual resource indicators, such as wind speed, significant wave height, tidal-current velocity, and solar energy density, and introduces the Index Isyn to characterize the combined temporal availability of multiple resource types. C2 Natural and Engineering Conditions primarily reflect the suitability of offshore engineering construction, including factors such as water depth, seabed geology, and topography. C3 Socio-economic Conditions describes the external supporting conditions for project implementation, including distance from shore, compatibility with marine spatial planning, natural resource abundance, and the match between electricity demand and supply. C4 Environmental Constraints characterize non-exclusionary but graded external constraints, such as shipping traffic, fishing activities, and future marine development.
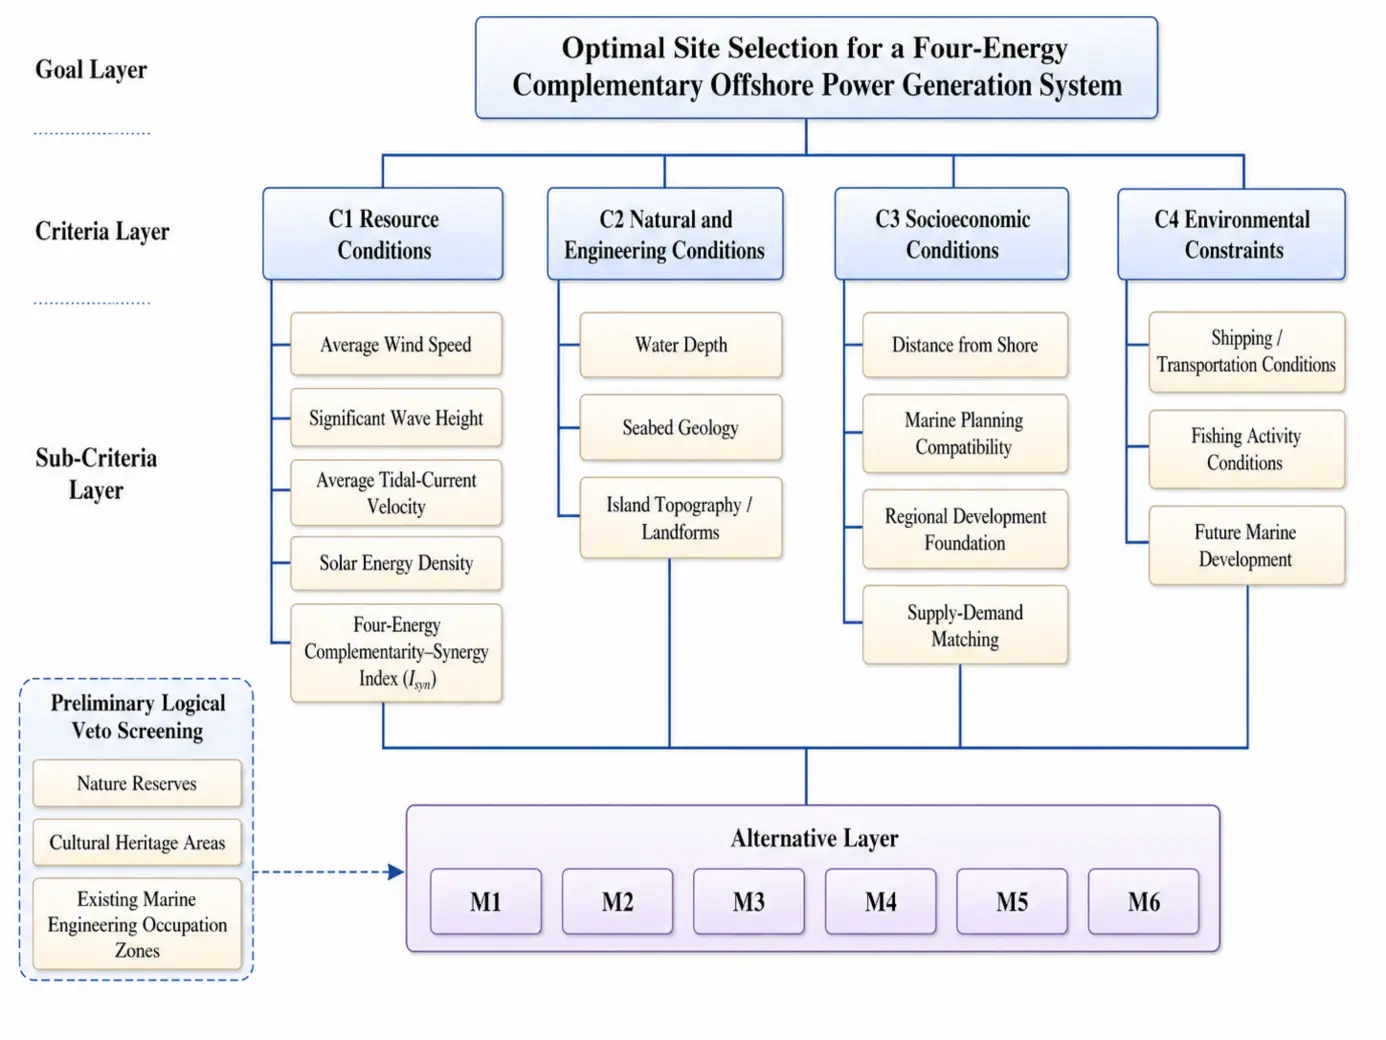
It should be noted that not all environmental and marine-use factors are suitable for treatment as standard weighted indicators. Factors such as shipping traffic, fishing activities, and future marine development vary in intensity and are therefore incorporated into the AHP system for graded evaluation. In contrast, nature reserves, historical and cultural heritage areas, and areas occupied by existing marine engineering projects have strong non-compensatory attributes. If a candidate site is subject to such exclusionary constraints, they should not be offset by other high-scoring indicators. Consequently, this study treats these factors as preliminary logical veto criteria to distinguish between two levels of decision-making: “whether a site has basic development eligibility” and “which feasible site is superior”.
2.3. Four-Energy Complementarity–Synergy Index
Within the resource condition criterion, average wind speed, significant wave height, average current velocity, and solar energy density reflect the individual resource intensities of wind, waves, tidal-currents, and solar energy, respectively. Although these indicators describe the average development potential of individual resources at a candidate site, they cannot adequately reflect complementarity among different resources over time. For isolated island grids or weakly interconnected grid scenarios, site suitability depends not only on the adequacy of individual resources but also on whether multiple resources can compensate for one another at different times, thereby improving system availability and reducing the risk of power-supply interruptions [23]. Therefore, this study introduces the Index (Isyn) as sub-criterion S5 under the resource condition criterion to characterize the joint availability of wind, wave, tidal-current, and solar energy over the time series. This index (Isyn) is defined as the proportion of total hours during the statistical period in which at least one resource reaches its availability threshold. Its calculation formula is as follows:
where t is a discrete time index on an hourly scale; $$P_{\mathrm{wind}}(t),P_{\mathrm{wave}}(t),P_{\mathrm{tidal}}(t),\,\mathrm{and}\,P_{\mathrm{solar}}(t)$$ represent the values of wind power density (W·m−2), wave power flux (kW·m−1), tidal power density (W·m−2), and solar irradiance power density (W·m−2) at time t, respectively; the thresholds of 80 W·m−2, 2.5 kW·m−1, 64 W·m−2, and 113 W·m−2 correspond to the availability determination thresholds for the four resource types, respectively; “The above thresholds have not been recalculated in this paper, but are based on the screening-level availability thresholds established in existing assessments of offshore renewable energy complementarity. Specifically, the wind power density of 80 W·m−2 and the wave power flux of 2.5 kW m−1 are referenced from Wen et al. [24,25]; The tidal power density of 64 W·m−2 can be derived from a typical cut-in velocity of 0.5 m/s using the tidal power density formula, and is based on relevant studies on combined wind-wave-tidal development [26]; the solar power density of 113 W·m−2 is based on existing literature on offshore wind-solar complementarity assessments. These thresholds are intended solely for hourly availability assessments during the screening stage and should not be interpreted as universal engineering cut-in values applicable to all equipment or all sea areas”. $$\vee$$ represents a logical OR, meaning that if any resource exceeds the corresponding threshold, it is deemed that at least one resource is available during that hour; N(.) denotes the number of hours satisfying the logical condition in parentheses, and Ntotal denotes the total number of hours within the statistical period. Isyn takes values between [0, 1], with larger values indicating more comprehensive availability coverage of multi-source resources over time.
Compared with complementarity metrics based on correlation coefficients or covariance structures, Isyn adopts a threshold-exceedance proportion, making it less sensitive to outliers; its physical meaning can be directly interpreted as the proportion of hours during which at least one resource is available. This indicator can effectively capture the potential system-level value of temporal diversity during the early site-selection stage, when a complete techno-economic dispatch model has not yet been introduced, and is therefore suitable for incorporation into the AHP resource condition criterion [27].
Unlike individual resource indicators such as average wind speed, significant wave height, or solar energy density, Isyn does not directly measure the intensity of a single resource type; rather, it assesses the combined temporal coverage capability of multiple resources. This indicator is suitable for the early site-selection stage because comprehensive power dispatch models are typically not yet available, while it remains necessary to determine whether candidate sites have a sound basis for multi-energy complementarity. The calculated Isyn values for each candidate site are listed in Table 1 and incorporated as a sub-indicator under the resource condition criterion for the subsequent AHP-based comprehensive evaluation.
2.4. Indicator Processing and Comprehensive Suitability Evaluation
After the hierarchical indicator system is established, the various evaluation indicators must be converted into a unified scale that is comparable and suitable for weighting. The indicators can be classified into three types: continuous numerical indicators, qualitative categorical indicators, and exclusive hard constraints. Continuous indicators—such as average wind speed, significant wave height, average current velocity, solar energy density, Isyn, water depth, and distance from shore—have different units of measurement and may be benefit-type or cost-type indicators. Qualitative indicators—such as seabed geology, island topography, compatibility with marine planning, shipping/transport conditions, fishing activity conditions, and projected marine development—cannot be directly represented by continuous numerical values. Hard exclusionary factors—such as nature reserves, cultural heritage areas, and existing marine engineering occupation zones—are inherently exclusive and non-compensable. Therefore, before conducting the comprehensive evaluation, these three categories of indicators are processed separately [2].
For continuous indicators, this study employs a normalisation method to convert them into dimensionless scores ranging from 0 to 1. Let xij denote of candidate site i the raw value under j indicator For benefit-type indicators—where a higher numerical value indicates greater suitability—Equation (2) is applied, and rij denote the standardised indicator score [28].
For cost-based or constraint-based indicators, where a smaller value generally indicates lower implementation difficulty or weaker constraints, Equation (3) is applied:
In the formula, max(xj) and min(xj) represent the maximum and minimum values, respectively, for all candidate sites under indicator j. Through the above process, all continuous indicators are converted into standardized scores with a consistent direction; that is, the larger the value of rij, the more favorable the candidate site is under that indicator. Among these, average wind speed, significant wave height, average current velocity, solar energy density, and $${I}_{\mathrm{s}\mathrm{y}\mathrm{n}}$$ belong to benefit-type indicators; while indicators such as water depth and distance from shore—which are related to construction difficulty, transmission costs, and O&M accessibility—are treated as cost-type or constraint-type indicators.
For qualitative and semi-quantitative indicators, a five-level linguistic scale is adopted. Specifically, each indicator is assigned to one of five levels—‘Excellent’, ‘Good’, ‘Average’, ‘Poor’, or ‘Very Poor’—with corresponding scores of 1.0, 0.8, 0.6, 0.4, and 0.2, respectively. This method is appropriate for indicators that cannot be easily quantified on a continuous scale but can be rated based on suitability, including seabed geology, topography, planning compatibility, shipping/transport conditions, fishing activity conditions, and projected marine development. By assigning these grade scores, qualitative judgments are transformed into standardized scores that can be integrated into the comprehensive evaluation, while preserving the interpretability of the evaluation process [29]. For exclusive hard constraints, such as nature reserves, cultural heritage areas, and existing marine engineering occupation zones this paper does not incorporate them into the standard weighted scoring system, but instead employs a pre-screening logical veto mechanism to exclude them ,the hard constraint specified in ; when the constraint is satisfied [17]. Let Vik denote whether candidate site i satisfies the kth hard constraint; if the constraint is satisfied, Vik = 1; otherwise, Vik = 0. The overall feasibility status Vi of a candidate site can be expressed as:
In the formula, k represents the number of hard constraints. When Vi = 1, it indicates that candidate site i has passed all hard constraint screenings and may proceed to the subsequent AHP comprehensive evaluation; when Vi = 0, it indicates that the site violates at least one exclusive constraint and should be excluded from the candidate set. The rationale for this approach lies in the fact that such constraints possess distinct non-compensatory characteristics: if a candidate site conflicts with a nature reserve, cultural heritage site, or an area occupied by existing marine engineering projects, it should not be permitted to offset compliance risks with high resource scores, even if its resource conditions are superior.
After indicator standardization and preliminary feasibility screening, the Analytic Hierarchy Process (AHP) is applied to determine the indicator weights at both the criterion and sub-criterion levels. AHP is particularly suitable for this study, as the site selection problem involves multiple criteria—resource conditions, natural and engineering conditions, socio-economic conditions, and environmental and marine use compatibility—arranged in a hierarchy. Such a structure calls for a weighting method that can reflect hierarchical relationships, incorporate planning preferences, and maintain interpretability. Judgment matrices are constructed at the criterion and sub-criterion levels to derive the local and global weights of each indicator. Consistency tests are then conducted to verify the logical consistency of the matrices [30,31]. Let the judgment matrix be A and the weight vector be W. Then, the AHP weight calculation can be written as:
In this formula, λmax represents the largest eigenvalue of judgment matrix A. By normalizing its corresponding eigenvector, the weights for each indicator at this level can be obtained. To ensure the judgment matrix exhibits adequate consistency, a consistency test is performed; when the consistency ratio meets the required criteria, the resulting weights are employed for subsequent comprehensive evaluation.
After indicator standardization and feasibility screening, the relative importance of the assessment criteria must be established for the subsequent comprehensive suitability evaluation. Given the distinct hierarchical structure of the indicator system and its incorporation of multiple factors—resources, engineering, socio-economic aspects, and marine spatial compatibility—the Analytic Hierarchy Process (AHP) is used to assign weights to each indicator. Ultimately, the comprehensive suitability score for each candidate site is calculated as the weighted sum of the standardized scores for each sub-criterion, multiplied by their corresponding overall weights:
In the formula, Si represents the comprehensive suitability score of candidate site i; Wj represents the global weight of sub-criterion j; Rij represents the standardized score of candidate site i under sub-criterion j; and m represents the number of sub-criteria included in the weighted evaluation. A higher comprehensive score indicates that the candidate site has greater overall suitability under the current indicator system and weighting structure. To improve interpretability, the overall suitability score is further decomposed into contributions from the four criteria groups—resource conditions, natural and engineering conditions, socio-economic conditions, and environmental and marine spatial compatibility—so as to reveal the main strengths of each candidate site. It should be noted that the AHP weights are not fixed values; rather, they reflect the screening objectives, data availability, and planning preferences specific to the Zhoushan Archipelago case. When applying this framework to other marine areas, the judgment matrices should be rebuilt according to local resource characteristics, engineering conditions, policy constraints, and stakeholder preferences. The composite suitability scores are intended only for preliminary ranking during the screening stage and should not be regarded as the final engineering decision.
2.5. Capacity Allocation Model
After the comprehensive suitability assessment is completed and the preferred sites are identified, this study further conducts capacity allocation analysis. The comprehensive suitability assessment identifies candidate sites with high development potential, while the capacity allocation analysis determines the relative installed capacity ratios of wind, wave, tidal-current, and solar energy at the preferred sites to reduce fluctuations in combined multi-source output and improve power-supply stability. This study constructs a capacity allocation model from the perspective of output stability, focusing on the effects of temporal complementarity among multi-source resources on capacity ratios and combined-output fluctuations [7].
Let Pj(t) denote the normalised output per unit capacity of energy source j at time t, and aj denote the capacity allocation ratio for the corresponding energy type [32]. Here, j = 1, 2, 3, 4 represent wind, wave, tidal, and solar energy, respectively. The combined output of the four energy sources can be expressed as
where P(t) is the combined normalised output at time t, and aj satisfies:
To reduce fluctuations in the combined output, this paper determines the capacity allocation ratios with the objective of minimising the variance of the combined output. Since the standard deviation is a monotonic transformation of the variance, minimising the variance is equivalent to minimising the standard deviation of the combined output. The objective function is expressed as:
where T is the number of time steps within the statistical period, and $$\bar{P}$$ is the mean of the combined output. If the planning requirements necessitate meeting a given average output level [30], the following average output constraint is further incorporated:
where Preq is the specified average power demand. Using the above model, the relative capacity ratios of wind, wave, tidal, and solar energy at the optimal site can be obtained, and the smoothing effect of different energy combinations on power output fluctuations can be further evaluated. This capacity allocation model constitutes the final stage of the two-stage framework proposed in this study. Together with the aforementioned logical veto screening and AHP-based comprehensive suitability evaluation, it forms a continuous analytical process of “feasibility screening–site ranking–capacity allocation” [16]. The overall methodological workflow is shown in Figure 3.
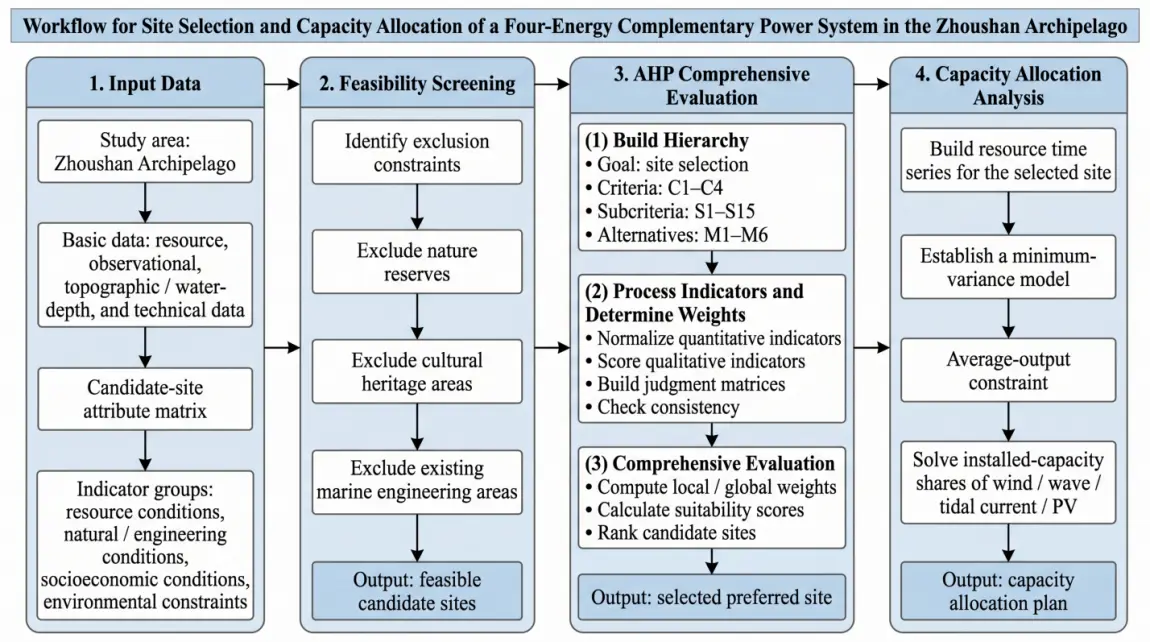
Figure 3. Process Flow for Site Selection and Capacity Allocation of a Quadruple-Energy Complementary Ocean Power Generation System.
2.6. Framework for Sensitivity Analysis and Robustness Testing
Following the comprehensive suitability assessment, a sensitivity analysis and robustness testing framework is introduced to evaluate the influence of three factors on the candidate site rankings: the subjectivity of AHP weights, the threshold setting of the Four-Energy Complementarity-Synergy Index (Isyn), and the uncertainty in the input data. Previous studies have shown that although multi-criteria decision-making (MCDM) methods are widely used in renewable energy site selection, the resulting rankings are often sensitive to the indicator system, weight assignment, standardization approach, and the specific evaluation model employed. Therefore, at the screening stage, the results from a single MCDM method should not be regarded as the final site selection decision; rather, they should be further verified through sensitivity analysis and comparison with alternative methods to confirm their robustness [33].
The robustness analysis consists of three parts. First, a perturbation analysis of the AHP weights is performed to examine how variations in key indicators—such as the weights of resource conditions, natural and engineering conditions, Isyn, water depth, distance from shore, and marine planning compatibility—affect the site rankings [34]. For each perturbation scenario, the weights were renormalised, and the composite scores and ranking results for M1–M6 were recalculated. This analysis was primarily used to determine whether the top-ranked site had changed, and whether there was a possibility of a swap in the rankings of the preceding sites, such as M3 and M4.
Secondly, Isyn threshold perturbation analysis was conducted. Isyn characterises the combined availability coverage of wind, wave, tidal, and solar energy over time using a threshold-exceedance approach; the setting of resource availability thresholds may influence its results. Therefore, in subsequent reviews, the availability thresholds for the four energy types can be adjusted individually, and the Isyn values for each candidate site recalculated to assess the extent to which this indicator affects the comprehensive ranking results.
Thirdly, a comparison of alternative MCDM methods is conducted. TOPSIS is a widely used ranking method in multi-attribute decision-making; its fundamental principle is to determine priorities based on the relative distances of candidate solutions to the positive and negative ideal solutions [35]. Unlike AHP, which emphasizes hierarchical structures, decision matrices, and weight-based evaluation, TOPSIS focuses more on the relative closeness of each alternative to the ideal solution in a multi-criteria space. Therefore, TOPSIS is employed as an alternative MCDM method to assess the sensitivity of the candidate site rankings to the choice of evaluation approach. It should be emphasized that TOPSIS is introduced not to replace the original AHP framework, but to serve as a methodological robustness check on the AHP-based rankings. Should discrepancies arise between the two sets of rankings, they should be interpreted as evidence of sensitivity in the MCDM method, rather than grounds for rejecting the preferred sites identified under the AHP framework.
3. Results and Discussion
3.1. Characteristics of Candidate Sites
Table 1 shows that there is no single option among the six candidate sites that excels in all indicators; rather, a trade-off exists between resource endowment, temporal complementarity, engineering accessibility and marine spatial constraints. In other words, the relative merits of the candidate sites cannot be determined directly by any single resource indicator, but require a comprehensive assessment based on multiple categories of indicators [18].
In terms of resource conditions, M2 performs well in terms of wind and wave resources and the four-energy synergy index, indicating strong potential for multi-energy development; however, its considerable distance from shore and relatively low solar energy indicators may increase the difficulty of subsequent power transmission and operation and maintenance [36]. M1 possesses certain advantages in tidal and solar conditions, but its wave conditions are relatively weak, resulting in an unbalanced resource profile. M6 benefits from its nearshore and shallow-water location, indicating good engineering accessibility; however, its wind speed and four-energy synergy index are relatively low, making it difficult to assess its overall suitability based solely on engineering convenience.
In contrast, M3 and M4 exhibit a well-balanced performance in terms of wind and wave resources, solar conditions, the four-energy complementary index (Isyn), and engineering feasibility, making them the primary contenders in the subsequent comprehensive evaluations. Neither site holds an absolute advantage across all individual indicators; rather, they achieve a reasonable balance among resource conditions, temporal complementarity, and engineering constraints. This also demonstrates that the site selection for four-energy complementary offshore power stations cannot be reduced to a simple ranking of individual resource intensities; instead, it requires a comprehensive trade-off among resource endowments, temporal complementarity, engineering feasibility, and marine spatial constraints.
In this study, factors related to power transmission, construction, and O&M accessibility are partially captured by indicators such as distance from shore, water depth, and planning compatibility. However, more detailed aspects—including grid connection point conditions, subsea cable routing feasibility, port and navigation support, and construction windows—still need to be verified at the project feasibility stage. Building on the above differences among candidate sites, the next section examines the AHP weighting structure to clarify the relative importance of various indicators in the comprehensive suitability evaluation and their influence on the site rankings.
3.2. Weighting Structure and Suitability Drivers
After clarifying the differences in resource and engineering attributes among the candidate sites, the next step is to determine the relative importance of different evaluation indicators in the comprehensive site-selection process. Based on the AHP weight determination method described in Section 2.4, this study calculates the criterion-level weights, as well as the local and global weights of each sub-criterion. Figure 4 illustrates the weighting structure of sub-criteria within each primary criterion, where local weights reflect the relative importance of a sub-criterion within its respective primary criterion, whilst global weights reflect the sub-criterion’s overall influence across the entire evaluation system. The complete weighting results are presented in Appendix Table A1.
Figure 4 illustrates the local weight structures of the sub-criteria under the four primary criteria, highlighting the dominant factors within each criterion. Figure 4a corresponds to C1 Resource Conditions and shows the relative importance of average wind speed, significant wave height, average current velocity, solar energy density, and Isyn within the resource criterion. Figure 4b corresponds to C2 Natural and Engineering Conditions and illustrates the relative influence of water depth, island topography and geomorphology, and seabed geology on engineering feasibility. Figure 4c corresponds to C3 Socio-economic Conditions and compares the weights of marine planning compatibility, regional development infrastructure, supply–demand matching, and distance from shore. Figure 4d corresponds to C4 Environmental and Marine-Use Compatibility and shows the relative roles of shipping conditions, fishery activity, and future marine-use development in ranking feasible sites. It should be noted that Figure 4 presents only the local weights of the sub-criteria within their respective primary criteria; the complete local and global weight results are provided in Appendix Table A1.
At the criterion level, resource conditions are assigned the highest weight (0.658), followed by natural and engineering conditions (0.198), socio-economic conditions (0.087), and environmental and marine use compatibility (0.056). This indicates that the evaluation system is primarily resource-driven, while engineering, socio-economic, and environmental factors serve to calibrate the rankings that would otherwise be based solely on resource indicators [37]. In other words, early-stage site selection for a four-energy complementary system must first ensure that candidate sites have adequate resource potential, but the final ranking cannot rely on a single resource indicator alone.
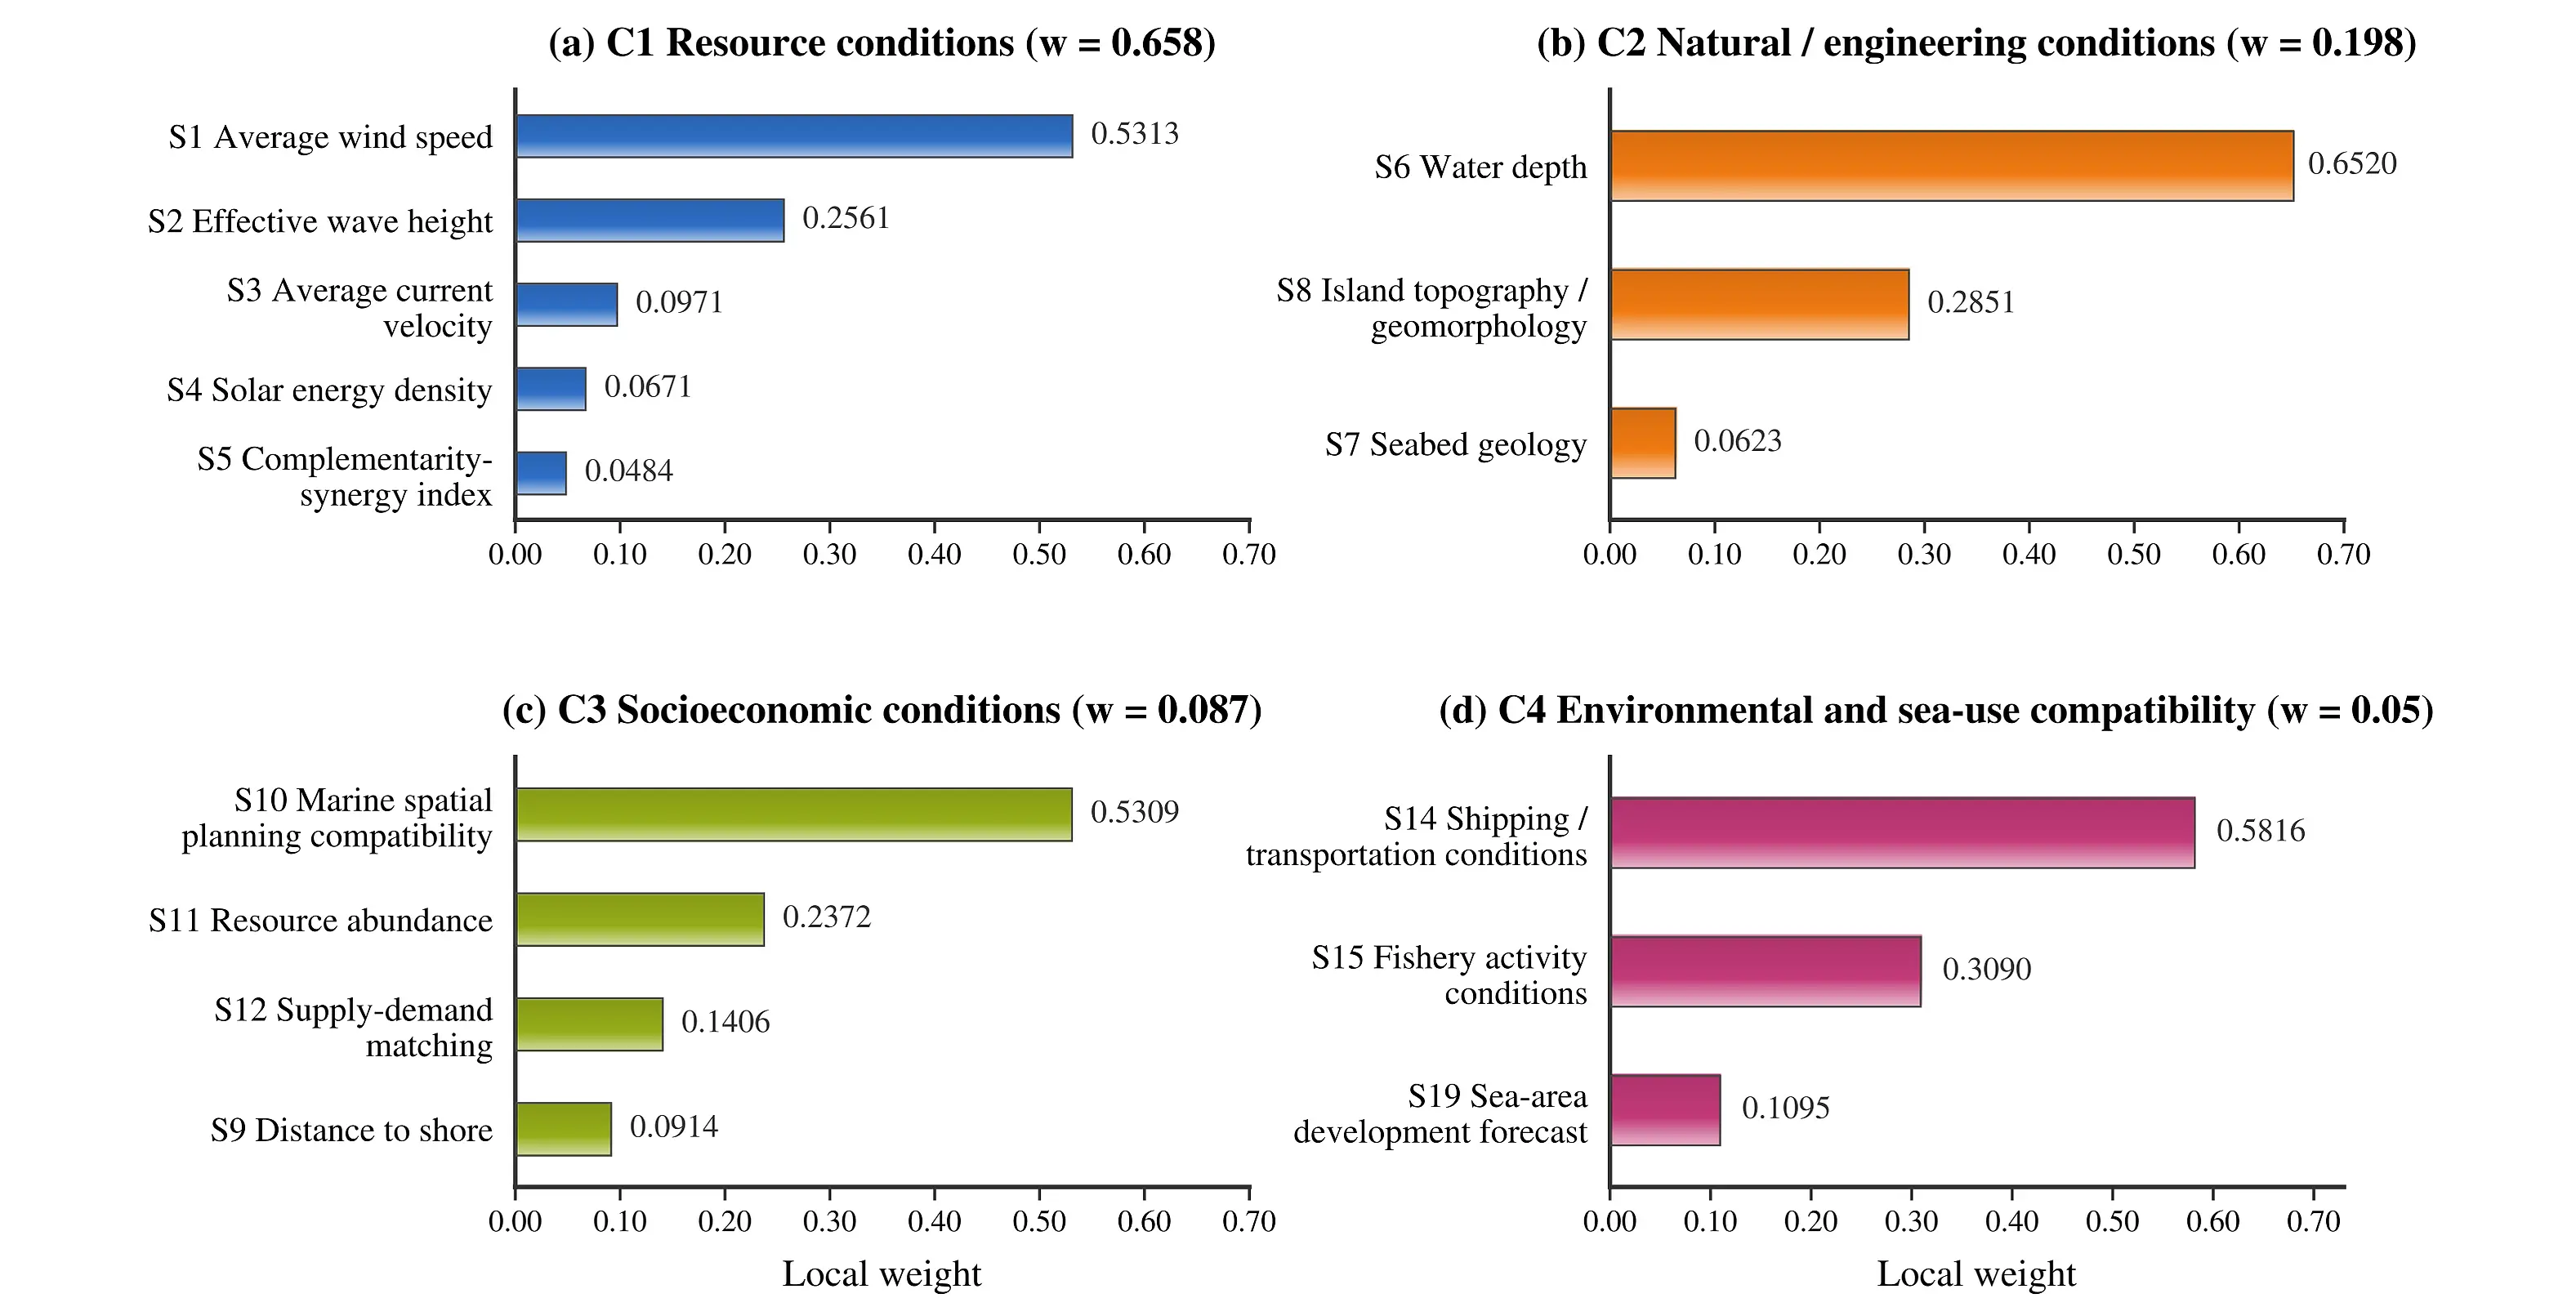
Figure 4. Comparison of local and global weights for each sub-criterion in the AHP model for: (a) C1 Resource Conditions; (b) C2 Natural (Engineering) Conditions; (c) C3 Socio-economic Conditions; (d) C4 Environmental Constraints.
With respect to the global weights of the sub-criteria, S1 (average wind speed), S2 (significant wave height), and S6 (water depth) are the primary factors influencing the comprehensive suitability assessment. Among these, average wind speed and significant wave height represent the available wind and wave energy resources, whereas water depth directly affects the difficulty of foundation construction, site conditions, and engineering costs [38]. Although the weight of Isyn is lower than that of certain individual resource indicators, its inclusion enables the temporal complementarity among wind, wave, tidal, and solar energy to be incorporated into the comprehensive evaluation, thus preventing the assessment from relying solely on average resource intensity. Within C3, the global weight of marine planning compatibility exceeds that of distance from shore, suggesting that, at the screening stage, spatial planning and permitting considerations impose greater constraints than transmission distance alone. The overall weight of C4 is relatively low, primarily because exclusionary constraints—such as nature reserves, cultural heritage sites, and existing marine engineering occupation zones—have already been filtered out during the preliminary logical screening stage; accordingly, the environmental and marine use indicators retained in the AHP evaluation serve mainly for differentiated comparison among the feasible sites [39].
It should be emphasized that the weighting structure is developed specifically for the Zhoushan Archipelago case, reflecting its screening objectives, data availability, and planning preferences; therefore, it should not be regarded as a fixed system applicable to all marine areas. When extending this framework to other marine areas, the judgment matrix should be reconstructed according to local resource characteristics, engineering conditions, marine spatial planning, policy constraints, and stakeholder preferences. Hence, the AHP weights derived in this study are intended to provide an interpretable ranking basis for the screening stage of the Zhoushan case, rather than to serve as universal weights that can be directly transferred to other regions.
3.3. Comprehensive Ranking and Site Interpretation
Based on the indicator standardization method described in Section 2 and the AHP-derived global weights, this study calculates the comprehensive suitability scores of the six candidate sites. The results are shown in Table 2. The complete criterion-level weights, sub-criterion local weights, and global weights are provided in Appendix Table A1. The comprehensive ranking is M3 > M4 > M5 > M2 > M6 > M1. M3 obtains the highest score of 0.1852, while M4 scores 0.1816, only 0.0036 lower than M3. This small difference indicates that the two sites have similar overall suitability under the screening criteria. M5 and M2 rank third and fourth, respectively, with only a slight score difference between them, whereas M6 and M1 have relatively lower comprehensive scores. This ranking reflects the screening suitability results under the current indicator system and AHP weighting structure, rather than a direct determination of the final site for the engineering project.
To explain the reasons behind the ranking, Figure 5 further presents the contribution of each candidate site’s scores under the four primary criteria. It should be noted that the sub-figures in Figure 5 are arranged according to the comprehensive ranking order in Table 3, rather than being re-ordered within a single criterion; simultaneously, the sub-figures use the same horizontal scale to facilitate direct comparison of the relative contributions of different criteria to the comprehensive score. As can be seen from Figure 5a, resource conditions are the dominant factor influencing the comprehensive ranking, with M3 and M4 ranking highest in terms of contribution from resource conditions; this is also the primary reason for their high comprehensive suitability scores. Although the contributions from resource conditions for M5 and M2 are similar, M5 ranks slightly higher than M2 in the comprehensive ranking, indicating that non-resource criteria—such as natural engineering, socio-economic factors, and environmental compatibility—have had a moderating effect on the final ranking.
Figure 5c indicates that socio-economic conditions also provide some support for the composite scores of M3 and M4, with M3 scoring slightly higher than M4; meanwhile, M2’s contribution under this criterion is higher than that of M5, suggesting that M2 is not at a disadvantage across all non-resource dimensions. Figure 5d shows that differences between sites in terms of environmental and marine use compatibility are relatively minor, and that M3 is not the highest-scoring option under this criterion. This further illustrates that M3’s overall advantage does not stem from absolute superiority across all dimensions, but rather from a balance among resource conditions, engineering conditions, socio-economic factors, and environmental compatibility.
Taken together, Table 2 and Figure 5 demonstrate that site selection for a four-energy complementary offshore power station cannot be reduced to a simple ranking of resource intensity. M3 ranks first, primarily owing to its favorable resource conditions and balanced performance across non-resource criteria. M4, with a score close to that of M3 and certain advantages in non-resource criteria, should also be prioritized in subsequent engineering feasibility studies. Although M2 performs well on selected resource indicators and socio-economic conditions, its overall score does not place it among the top two. M6 and M1 further illustrate that advantages such as nearshore location, shallow water, or individual resource strength do not automatically translate into the highest overall suitability. These results indicate that the AHP framework presented in this paper can perform a comprehensive trade-off among resource endowment, engineering feasibility, socio-economic conditions, and environmental compatibility, thereby providing a structured basis for identifying preferred site options at the screening stage. However subsequent engineering decisions still require further validation in conjunction with the robustness verification framework described in Section 2.6 and project-level engineering feasibility studies.
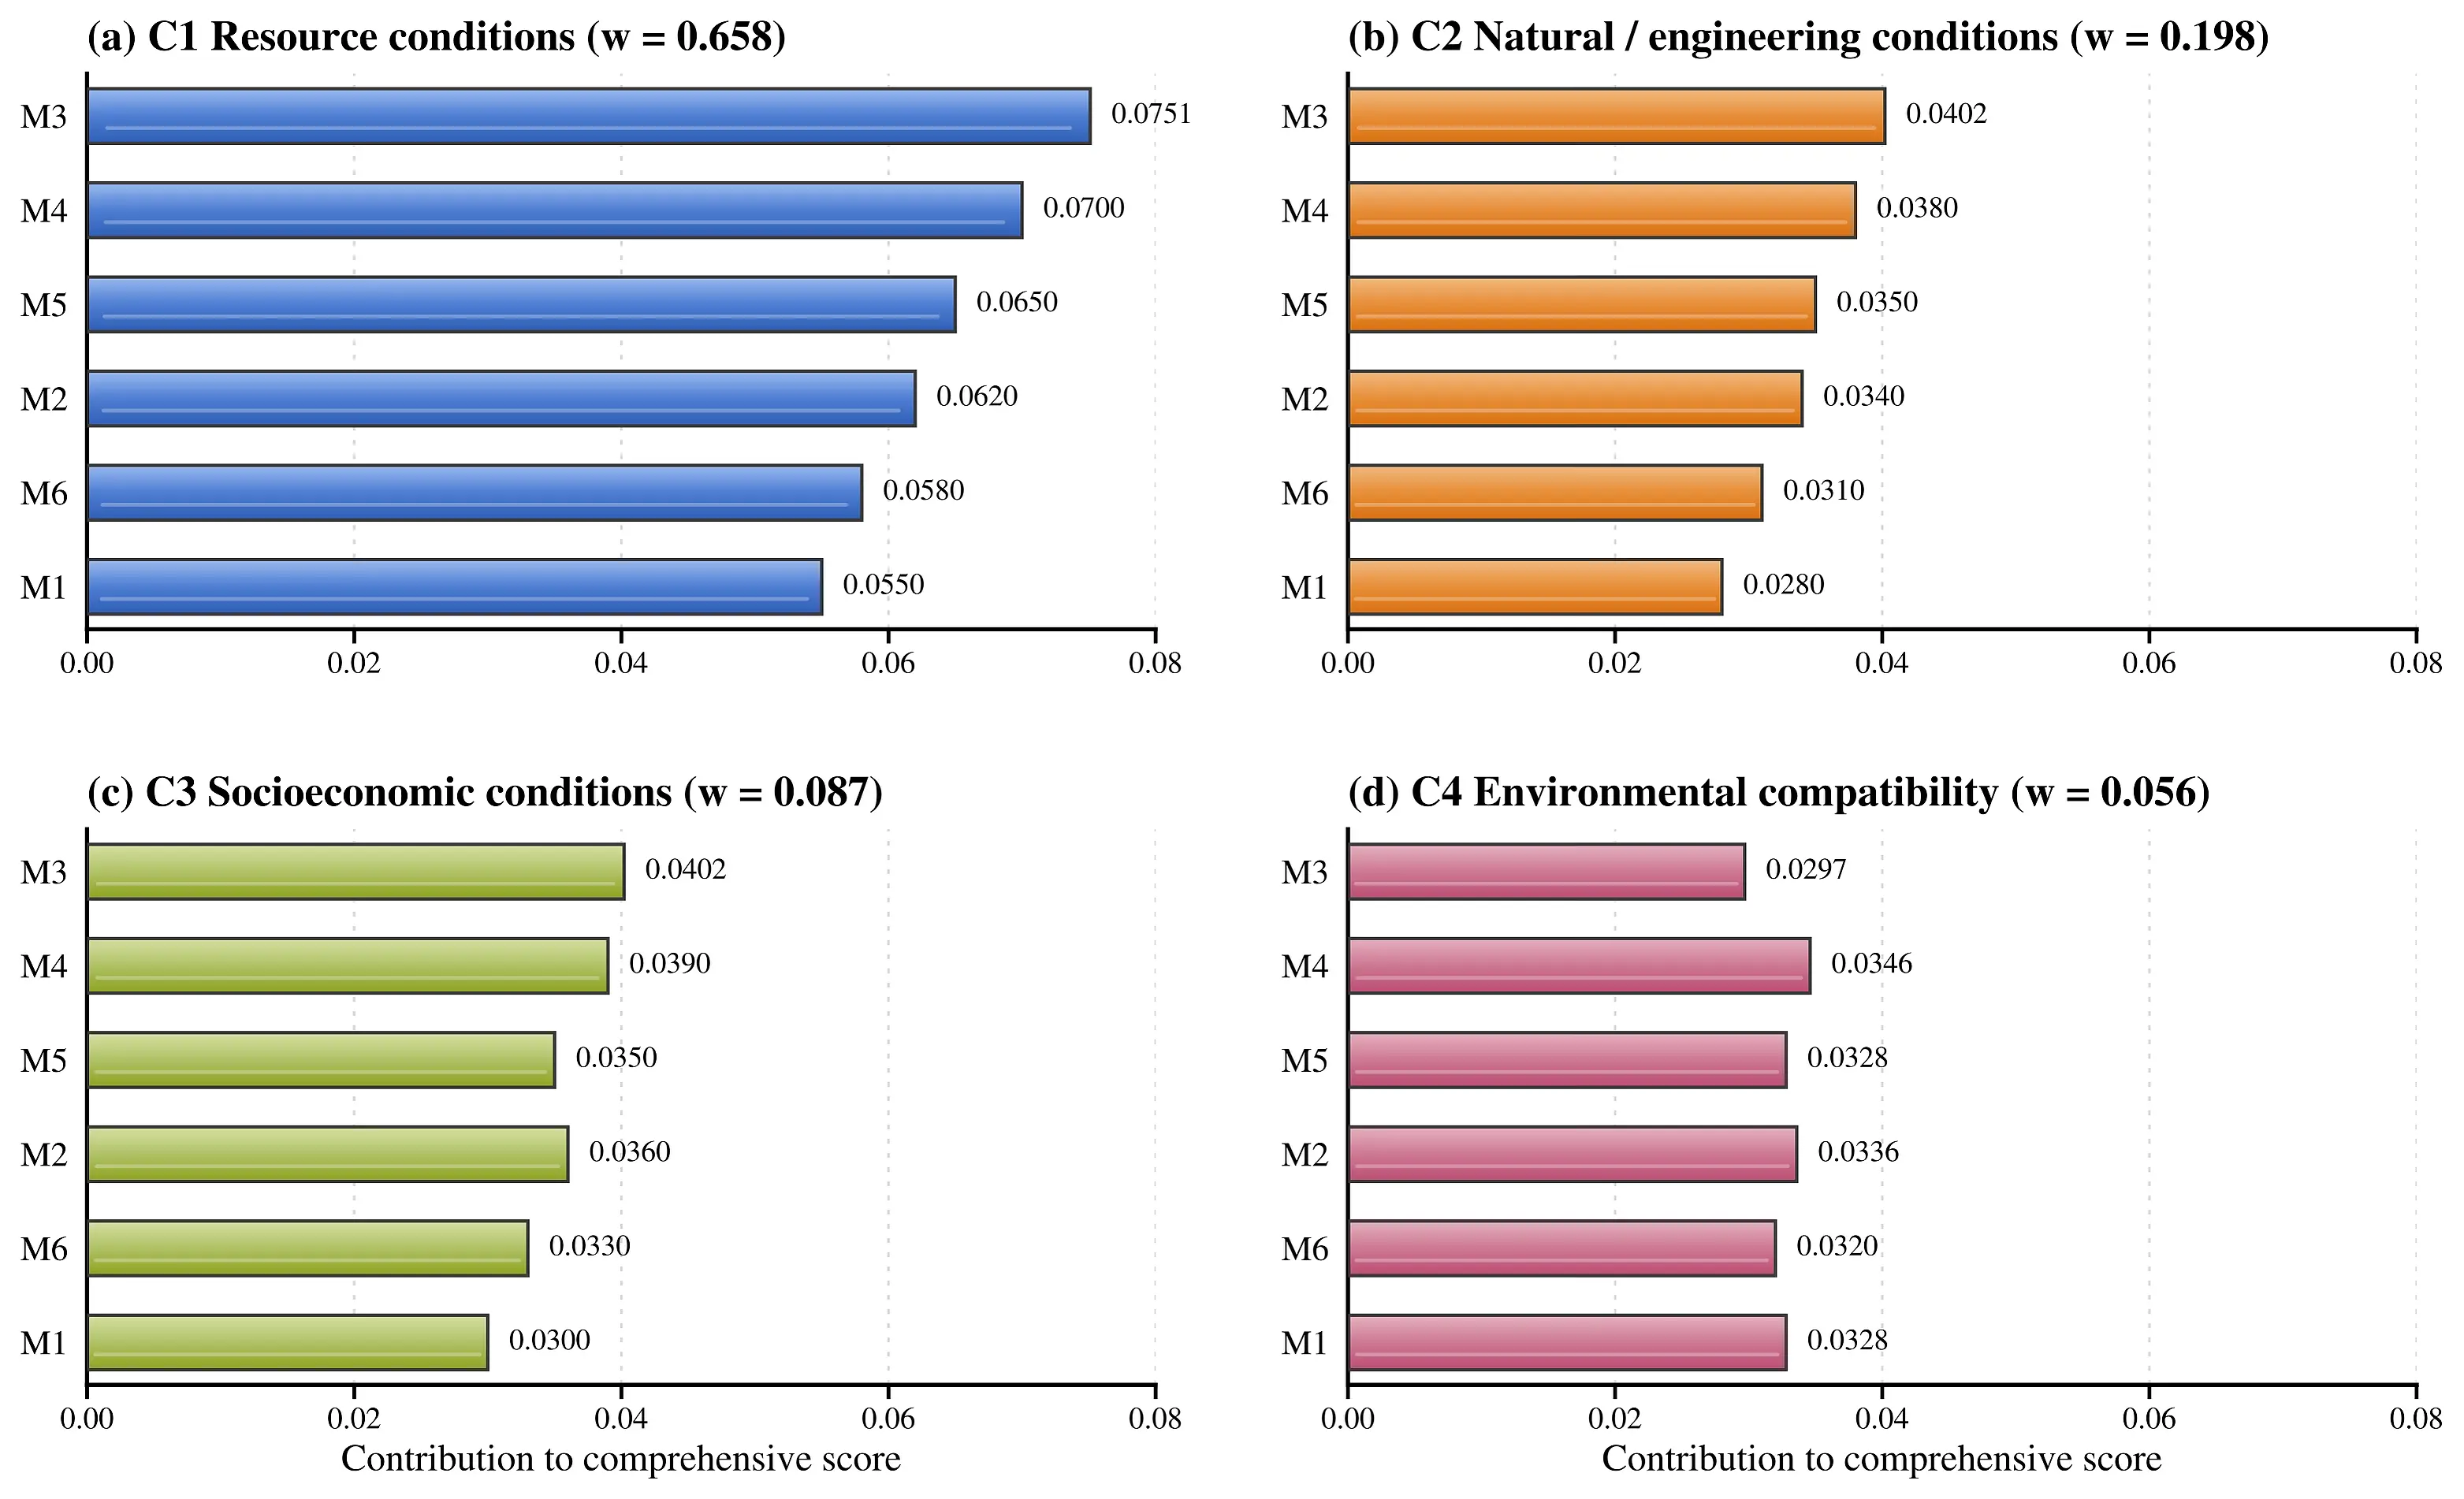
Figure 5. Decomposition of criterion-level contributions to the comprehensive suitability scores of candidate sites
Table 2. Comprehensive Suitability Scores and Ranking of Candidate Sites.
|
Site |
Comprehensive Score g |
Rank |
|---|---|---|
|
M3 |
0.1852 |
1 |
|
M4 |
0.1816 |
2 |
|
M5 |
0.1678 |
3 |
|
M2 |
0.1656 |
4 |
|
M6 |
0.1540 |
5 |
|
M1 |
0.1458 |
6 |
To further examine the sensitivity of the AHP ranking results to the choice of evaluation method [40], the TOPSIS method is used to rank the candidate sites. The TOPSIS input indicators are drawn from the quantifiable continuous indicators listed in Table 1, namely, average wind speed, effective wave height, average current velocity, solar energy density, the four-energy complementarity–synergy index (Isyn), water depth, and distance from shore. Among them, average wind speed, effective wave height, average current velocity, solar energy density, and the four-energy complementarity–synergy index are set as benefit-type indicators, whereas water depth and distance from shore are set as cost-type indicators. To maintain consistency with the AHP evaluation, the global weights of the corresponding indicators from the AHP model are used in the TOPSIS calculations. Table 3 presents the calculation results.
Table 3. Differences between TOPSIS comparative analysis results and AHP rankings.
|
Site |
AHP Composite Score |
AHP Ranking |
TOPSIS Positive Ideal Distance D+ |
TOPSIS Negative Ideal Distance D− |
TOPSIS Proximity C |
TOPSIS Ranking |
|---|---|---|---|---|---|---|
|
M2 |
0.1656 |
4 |
0.0747 |
0.2496 |
0.7697 |
1 |
|
M4 |
0.1816 |
2 |
0.1002 |
0.1828 |
0.6460 |
2 |
|
M3 |
0.1852 |
1 |
0.1129 |
0.1999 |
0.6390 |
3 |
|
M5 |
0.1678 |
3 |
0.1533 |
0.1191 |
0.4374 |
4 |
|
M6 |
0.1540 |
5 |
0.2321 |
0.1168 |
0.3348 |
5 |
|
M1 |
0.1458 |
6 |
0.2139 |
0.1051 |
0.3295 |
6 |
As shown in Table 3, the TOPSIS ranking results are M2 > M4 > M3 > M5 > M6 > M1, which do not fully align with the AHP ranking results of M3 > M4 > M5 > M2 > M6 > M1. In particular, M2 rose to first place in the TOPSIS results, primarily due to its strong performance in continuous resource indicators such as average wind speed, effective wave height, and the four-energy complementarity–synergy index. As TOPSIS places greater emphasis on the degree of proximity between candidate solutions and the ideal solution, when a site possesses advantages across several resource-based continuous indicators simultaneously, its proximity score may increase significantly.
In contrast, the AHP-based evaluation incorporates not only continuous resource indicators but also factors such as natural and engineering conditions, socio-economic conditions, and environmental constraints, and it reflects the relative importance of each indicator through a hierarchical structure and weight allocation. Consequently, although Site M2 excels in certain resource indicators, it does not rank among the top two in the AHP-based evaluation. This suggests that relying solely on resource advantages cannot fully capture a site’s overall suitability; the ranking of candidate sites is also affected by a combination of factors, including engineering accessibility, maritime spatial compatibility, and environmental constraints.
It is worth noting that M3 and M4 consistently rank among the top sites under both methods. In the AHP results, M3 and M4 obtain overall scores of 0.1852 and 0.1816, respectively—a narrow margin; similarly, in the TOPSIS results, their closeness coefficients are 0.6460 and 0.6390, again indicating very close performance. This indicates that both M3 and M4 exhibit strong overall performance regardless of the evaluation method used. The ranking differences between TOPSIS and AHP do not imply that the AHP results are invalid; rather, they indicate that different MCDM methods may produce different ranking orders when candidate sites perform similarly [39].
Therefore, this paper interprets the AHP ranking results as preliminary selection outcomes under the current indicator system and weighting structure, rather than as the final conclusion regarding the engineering site. M3 can be considered the preferred candidate site within the AHP framework, whilst M4 and M2 should be treated as alternative sites requiring focused review in subsequent engineering feasibility studies. On this basis, the subsequent capacity allocation analysis will continue to use the preferred candidate site M3, as determined by the AHP comprehensive evaluation, as the demonstration case for further analysis of the combination ratios among the four energy types and their impact on the fluctuation of combined output [41].
3.4. Capacity Allocation Results for the Preferred Site
After the comprehensive suitability ranking is completed, a preliminary capacity allocation analysis is performed for the preferred site. According to the evaluation results presented in Table 2 and Figure 5, Site M3 attained the highest overall suitability score and exhibited a relatively balanced performance across resource, engineering, and socio-economic conditions. It was therefore selected as the demonstration site for the capacity allocation model. It should be noted that the capacity allocation analysis does not determine the final engineering plan; rather, it examines how different proportions of energy units affect combined output fluctuations, particularly during the screening stage. In other words, the AHP ranking addresses which site is more suitable for priority development, while the capacity allocation model further examines how different energy types should be combined at the preferred site to reduce output fluctuations.
Figure 6 illustrates the capacity allocation results for the M3 site and the corresponding combined output characteristics. Based on a minimum variance objective function, this paper optimises the capacity ratios of wind, wave, tidal, and solar energy at the M3 site [42]. The results indicate that the capacity allocation ratios for M3 are: wind energy 18.50%, wave energy 24.50%, tidal energy 41.33%, and solar energy 15.67%. Among these, tidal energy accounts for the highest proportion, indicating that, under the resource conditions at the M3 site, tidal energy makes a significant contribution to smoothing combined output, whilst wind, wave, and solar energy act as supplementary sources, collectively participating in multi-energy complementarity [6]. These results indicate that capacity allocation does not simply involve selecting a single energy source with the highest resource intensity, but rather involves reducing fluctuations in combined output by adjusting the proportional relationships between different energy units.
The capacity allocation results show that the optimised four-energy configuration at Site M3 achieves a combined capacity factor of 13.43%, with an output standard deviation of 0.08. Figure 6 presents the corresponding installed-capacity proportions of wind, wave, tidal-current, and solar energy. These results indicate that, after capacity optimisation, the four energy sources at M3 can complement one another to a certain extent, thereby mitigating the influence of fluctuations in any single resource on the overall system output. Combined with the preceding site-selection results, M3 is not only the most suitable candidate site under the AHP-based comprehensive evaluation, but also has favourable resource and engineering conditions for implementing a wind–wave–tidal–solar complementary capacity configuration.
It should be emphasised that the capacity configuration results shown in Figure 6 represent a preliminary analysis at the screening stage and do not constitute the final engineering installation plan. Actual project implementation will require further consideration of project-level factors such as equipment selection, unit capacity, foundation types, submarine cable transmission, grid connection capacity, energy storage configuration, dispatch strategies, construction costs, and O&M conditions [43]. Furthermore, as the comprehensive suitability scores for M4 and M3 are similar, M4 should still be considered as a key alternative site in subsequent engineering feasibility studies. Future research may involve further comparative analyses of capacity allocation, economic viability, and grid connection feasibility for M3 and M4, respectively, to verify the engineering applicability of the preferred site and capacity combination scheme.
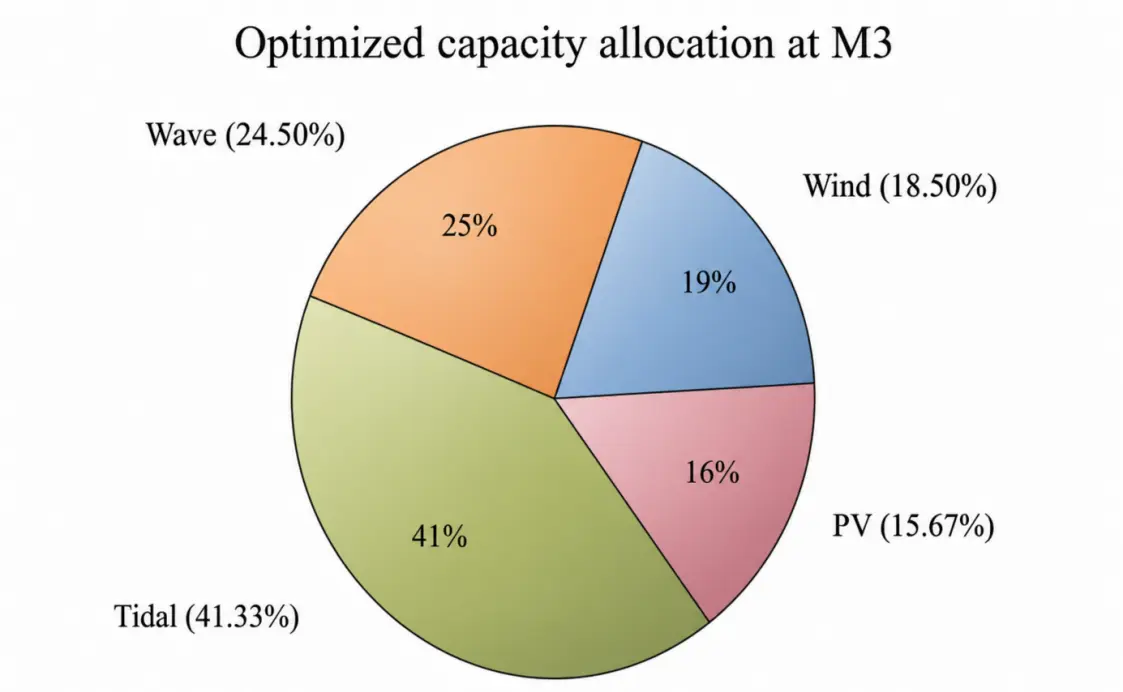
Figure 6. Optimized capacity allocation ratios (wind, wave, tidal, and PV) for the preferred site M3.
To further quantify the average power output and the degree of power fluctuation for this capacity configuration scheme, this paper uses the capacity factor (CFt) and the standard deviation of output (σ) as performance evaluation metrics [7]. Specifically, (CFt) is used to characterize the average power output of the combined system over the statistical period, while (σ) is used to measure the degree of fluctuation in the combined output around the mean. They are defined as follows:
The definitions of CF and σ are given in Equation (11) and Equation (12), respectively.
In the equation, (Pt) represents the combined output at the (t)th time step, ($$\bar{P}$$) represents the average combined output over the statistical period, (Prated) represents the rated output of the combined system, and (n) represents the number of time steps in the statistical period. Calculations based on Equation (11) and Equation (12) yield a capacity factor of (CF = 13.43%) and a standard deviation of output of (σ = 0.08) for the M3 site capacity configuration scheme. In the calculation, all four energy-output time series were normalized on an hourly basis, and the same minimum-variance optimization procedure and average-output constraint were applied to all six candidate sites to ensure comparability. These results indicate that, under the constraint of a given average hourly power generation target, wind, wave, tidal, and photovoltaic energy can form a certain degree of complementarity after capacity ratio adjustments, thereby reducing fluctuations in the combined output.
At the same time, to avoid reporting only the preferred site without a comparative reference, Table 4 also lists the installed capacity shares obtained for the six candidate sites using the same minimum variance model. This table is not intended to re-rank the sites, but rather to illustrate the differences in capacity allocation structures under various resource combination conditions.
Table 4. Optimal Installed Capacity Shares for Each Candidate Site.
|
Site |
Wind Energy (%) |
Wave Energy (%) |
Tidal Energy (%) |
PV (%) |
|---|---|---|---|---|
|
M1 |
33.19 |
23.07 |
31.49 |
12.24 |
|
M2 |
17.06 |
24.69 |
41.95 |
16.30 |
|
M3 |
18.50 |
24.50 |
41.33 |
15.67 |
|
M4 |
18.96 |
24.52 |
40.25 |
16.27 |
|
M5 |
22.37 |
24.81 |
37.39 |
15.43 |
|
M6 |
29.06 |
23.27 |
34.05 |
13.63 |
As shown in Table 4, tidal energy generally accounts for a relatively high proportion in the minimum-variance configuration results for all candidate sites, whereas wave energy remains relatively stable. By contrast, the proportions of wind and photovoltaic energy vary with the resource conditions of each site. These results indicate that, under the average-output target and variance-minimization constraints defined in this study, capacity allocation does not simply maximize individual resource intensity. Instead, it is determined by the joint fluctuation relationships among the time series of different energy sources. For the optimized site M3, the installed capacity structure is similar to that of M4. Both sites exhibit a configuration characterized by a high proportion of tidal energy, a moderate proportion of wave energy, and wind and photovoltaic energy as supplementary sources. This result is consistent with the earlier finding that M3 and M4 have similar overall suitability. It also suggests that both sites should be further compared in subsequent engineering feasibility studies.
3.5. Engineering Suitability Analysis and Research Limitations
The site ranking results presented in this paper should be regarded as screening-level theoretical evaluations, not as final engineering decisions. The AHP evaluation, the Isyn index, the TOPSIS analysis, and the capacity configuration model together provide a structured basis for preliminary screening, ranking, comparison, and resource complementarity assessment of candidate sites; however, they cannot substitute for project-level feasibility studies [44]. For offshore multi-energy complementary power stations, the final site selection and construction plan must be further validated using detailed engineering data, including foundation types, geotechnical conditions, construction windows, submarine cable routes, grid connection capacity, energy storage and dispatch strategies, port support conditions, project investment, and long-term O&M strategies.
It should be noted that this study focuses on establishing a screening-level site selection and preliminary capacity allocation methodology, rather than on providing deterministic predictions for specific engineering plans. Factors such as foundation types, construction organization, submarine cable routing, grid connection, and long-term O&M costs depend heavily on project-level survey data, engineering design parameters, and local approval conditions. Therefore, it is difficult to reliably estimate these practical engineering factors using only the publicly available data and model inputs employed in this study. Accordingly, the findings are not presented as directly implementable engineering solutions; rather, they serve as a reference for candidate site identification and methodology development during the preliminary planning stage.
From an engineering perspective, factors such as water depth, distance from shore, marine spatial planning compatibility, and existing marine infrastructure occupancy have been incorporated into the screening and evaluation process. Among these, water depth and distance from shore can partially reflect foundation construction difficulty, submarine cable transmission costs, and O&M accessibility; marine planning compatibility and existing marine infrastructure occupancy can be used to preliminarily identify potential conflicts between site development and current marine space uses. However, these indicators reflect only a portion of the engineering suitability and cannot fully capture project construction costs, construction accessibility, or grid connection difficulty [45]. Actual engineering construction, therefore, requires more detailed feasibility studies that integrate seabed geology, foundation design options, construction vessel and equipment availability, submarine cable route optimization, grid connection point locations, and grid absorption capacity.
Furthermore, the TOPSIS comparative analysis indicates that the candidate site rankings are sensitive to the choice of multi-criteria decision-making method. This suggests that the AHP results should not be regarded as a definitive site selection conclusion; rather, they represent a preliminary prioritization under the current indicator system and weighting structure. For candidate sites with similar overall performance or inconsistent rankings across different evaluation methods, further verification should be conducted using more detailed engineering data and project constraints [46].
Therefore, the framework proposed in this paper—which integrates preliminary logical screening, AHP-based suitability evaluation, TOPSIS comparative analysis, and capacity allocation—is more appropriate for the early planning stage of island multi-energy complementary power generation systems. This framework can help identify candidate sites with high overall suitability and reveal the sensitivity of the ranking results to indicator weights, evaluation methods, and data conditions. If the project advances to the engineering feasibility stage, the key candidate sites should be further verified through detailed project-level assessments, building on the screening results and incorporating on-site surveys, engineering design, grid connection, environmental impact assessments, marine spatial use approvals, and project economic analyses.
4. Conclusions
Taking the Zhoushan Archipelago as the study area, this paper develops a screening-level site selection framework that integrates logical veto screening, AHP-based suitability evaluation, TOPSIS comparative analysis, and capacity allocation analysis to support the complementary development of wind, wave, tidal, and solar energy. The framework combines spatial exclusion constraints, resource and engineering conditions, multi-criteria suitability assessment, ranking robustness verification, and capacity allocation into a coherent process, and it is intended to inform the preliminary planning of multi-energy complementary offshore power stations in island regions.
During the site evaluation phase, nature reserves, cultural heritage sites, and existing marine engineering footprints are established as preliminary exclusion criteria. This approach distinguishes between two decision-making tiers—‘basic feasibility’ and ‘internal suitability ranking’—thereby preventing high resource scores from masking or offsetting exclusive spatial constraints. For resource assessment, this paper introduces the Index Isyn, which utilizes available-hour coverage to quantify the temporal synergy and combined availability of multi-source resources. This ensures that the evaluation captures both individual resource intensity and the synergistic potential of multi-energy combinations in mitigating output volatility.
Within the proposed evaluation framework, Site M3 achieves the highest overall suitability among the six candidate sites and maintains a favorable balance among resource conditions, engineering feasibility, and planning compatibility. It can therefore be considered the preferred candidate site at the screening level under the current AHP indicator system and weighting structure. Meanwhile, the TOPSIS comparative analysis reveals that the candidate site rankings are somewhat sensitive to the choice of multi-criteria decision-making method. This suggests that the AHP results should not be interpreted as a definitive engineering site decision; rather, they serve as a screening-level preferred outcome and a reference for subsequent engineering verification. Furthermore, the capacity allocation analysis shows that at Site M3, tidal energy acts as the primary source (accounting for 41.33% of the total installed capacity), complemented by wave and wind energy, with solar photovoltaic contributing to daytime output. This finding demonstrates that conducting capacity allocation analysis after site screening can help convert the temporal complementarity of multiple resources into a relatively smooth combined power output.
In summary, this paper combines exclusionary constraint screening, comprehensive suitability ranking, robustness verification, and capacity allocation into a single analytical process, thereby allowing spatial feasibility, multi-criteria suitability, method sensitivity, and combined-output stability to be considered simultaneously when comparing candidate sites. It should be noted that these results are confined to a screening-level theoretical analysis and cannot substitute for project-level engineering design and feasibility studies. Because factors such as foundation types, construction windows, submarine cable routes, grid connection, energy storage dispatch, long-term O&M strategies, and project economics depend heavily on project-level survey data and engineering parameters, this study does not offer deterministic predictions for specific implementation plans. Future work should incorporate field surveys, seabed geology, submarine cable routing, grid connection, energy storage dispatch, environmental impact assessments, and project economic analysis to carry out project-level feasibility verification for the key candidate sites.
Appendix A
Table A1. Criteria-level weights, sub-criteria local weights, and global weights of the AHP model.
|
Criterion |
Criterion Weight |
Sub-Criteria |
Local Weight |
Global Weight |
|---|---|---|---|---|
|
C1 Resource Conditions |
0.658 |
S1 Average Wind Speed |
0.5313 |
0.3497 |
|
0.658 |
S2 Significant wave height |
0.2561 |
0.1685 |
|
|
0.658 |
S3 Average Flow Velocity |
0.0971 |
0.0639 |
|
|
0.658 |
S4 Solar energy density |
0.0671 |
0.0442 |
|
|
0.658 |
S5 Isyn |
0.0484 |
0.0319 |
|
|
C2 Natural (Engineering) Conditions |
0.198 |
S6 Water Depth |
0.6527 |
0.1294 |
|
0.198 |
S7 Seabed Geology |
0.0623 |
0.0124 |
|
|
0.198 |
S8 Island Topography/Landforms |
0.2851 |
0.0565 |
|
|
C3 Socio-economic Conditions |
0.087 |
S9 Distance from Shore |
0.0914 |
0.0080 |
|
0.087 |
S10 Marine Planning Compatibility |
0.5309 |
0.0464 |
|
|
0.087 |
S11 Regional Development Foundation |
0.2372 |
0.0207 |
|
|
0.087 |
S12 Supply-Demand Matching |
0.1406 |
0.0123 |
|
|
C4 Environmental Constraints |
0.056 |
S14 Shipping/Transportation Conditions |
0.5816 |
0.0327 |
|
0.056 |
S15 Fishing Activity Conditions |
0.3090 |
0.0174 |
|
|
0.056 |
S19 Marine Development Forecast |
0.1095 |
0.0062 |
Statement of the Use of Generative AI and AI-Assisted Technologies in the Writing Process
During the preparation of this work, the authors used generative AI and AI-assisted technologies only to assist with English language polishing, grammar correction, formatting consistency, and readability improvement. These tools were not used to generate research ideas, design the methodology, collect or analyze data, produce results, draw scientific conclusions, or replace the authors’ academic judgment. After using these tools, the authors carefully reviewed, edited, and verified all AI-assisted content and take full responsibility for the content of the published article.
Author Contributions
Conceptualization, M.H. and X.J.; Methodology, M.H. and M.L.; Software, M.H.; Validation, M.H. and Q.Z.; Formal Analysis, M.H. and M.L.; Investigation, M.H. and Q.Z.; Resources, X.J. and M.L.; Data Curation, M.H. and Q.Z.; Writing—Original Draft Preparation, M.H.; Writing—Review & Editing, Q.Z., X.L., M.L. and X.J.; Visualization, M.H. and X.L.; Supervision, X.J.; Project Administration, X.J.; Funding Acquisition, X.J. All authors have read and agreed to the published version of the manuscript.
Ethics Statement
Not applicable. This study did not involve human participants, animals, clinical data, or personal information.
Informed Consent Statement
Not applicable. This study did not involve human participants.
Data Availability Statement
The foundational data for this study, including ECMWF ERA5 reanalysis, regional tide and wave observations, NOAA/GEBCO bathymetry, SWAN/MIKE simulations, and standard equipment parameters, were obtained from public sources. The processed data supporting the findings—including indicator normalizations, the Index Isyn, AHP weightings, and optimal capacity allocations—are available from the corresponding author upon reasonable academic request.
Funding
This study was supported by the National Natural Science Foundation of China (Grant No. 42405142) and the National Key Research and Development Program of China for Young Scientists (Grant No. 2023YFB3906000). All analyses and writing were independently conducted by the researchers.
Declaration of Competing Interest
The authors declare that they have no known competing financial interests or personal relationships that could have appeared to influence the work reported in this paper.
References
- Lewis A, Estefen S, Huckerby J, Musial W, Pontes T, Torres-Martinez J. Ocean energy. In IPCC Special Report on Renewable Energy Sources and Climate Change Mitigation; Edenhofer O, Pichs-Madruga R, Sokona Y, Seyboth K, Matschoss P, Kadner S, et al., Eds.; Cambridge University Press: Cambridge, UK and New York, NY, USA, 2011; pp. 497–534. DOI:10.1017/CBO9781139151153.010 [Google Scholar]
- Shao M, Han Z, Sun J, Xiao C, Zhang S, Zhao Y. A review of multi-criteria decision-making applications for renewable energy site selection. Renew. Energy 2020, 157, 377–403. DOI:10.1016/j.renene.2020.04.137 [Google Scholar]
- Albadi MH, El-Saadany EF. Overview of wind power intermittency impacts on power systems. Electr. Power Syst. Res. 2010, 80, 627–632. DOI:10.1016/j.epsr.2009.10.035 [Google Scholar]
- Denholm P, Margolis RM. Evaluating the limits of solar photovoltaics (PV) in traditional electric power systems. Energy Policy 2007, 35, 2852–2861. DOI:10.1016/j.enpol.2006.10.014 [Google Scholar]
- Reguero BG, Losada IJ, Méndez FJ. A global wave power resource and its seasonal, interannual and long-term variability. Appl. Energy 2015, 148, 366–380. DOI:10.1016/j.apenergy.2015.03.114 [Google Scholar]
- Lewis M, Neill SP, Robins PE, Hashemi MR. Resource assessment for future generations of tidal-stream energy arrays. Energy 2015, 83, 403–415. DOI:10.1016/j.energy.2015.02.038 [Google Scholar]
- Jurasz J, Canales FA, Kies A, Guegouz M, Beluco A. A review on the complementarity of renewable energy sources: Concept, metrics, application and future research directions. Sol. Energy 2020, 195, 703–724. DOI:10.1016/j.solener.2019.11.087 [Google Scholar]
- Fusco F, Nolan G, Ringwood JV. Variability reduction through optimal combination of wind/wave resources—An Irish case study. Energy 2010, 35, 314–325. DOI:10.1016/j.energy.2009.09.023 [Google Scholar]
- Neto PBL, Saavedra OR, Oliveira DQ. The effect of complementarity between solar, wind and tidal energy in isolated hybrid microgrids. Renew. Energy 2020, 147, 339–355. DOI:10.1016/j.renene.2019.08.134 [Google Scholar]
- Zhu W, Guo J, Zhao G, Zeng B. Optimal sizing of an island hybrid microgrid based on an improved multi-objective grey wolf optimiser. Processes 2020, 8, 1581. DOI:10.3390/pr8121581 [Google Scholar]
- Vasileiou M, Loukogeorgaki E, Vagiona DG. GIS-based multi-criteria decision analysis for site selection of hybrid offshore wind and wave energy systems in Greece. Renew. Sustain. Energy Rev. 2017, 73, 745–757. DOI:10.1016/j.rser.2017.01.161 [Google Scholar]
- Tian F, Li X, Liu M, Xia C, Guo X, Fang X, et al. Application of a GIS-Based Multi-Criteria Decision-Making Approach to the Siting of Ocean Thermal Energy Conversion Power Plants: A Case Study of the Xisha Sea Area, China. Energies 2024, 17, 5097. DOI:10.3390/en17205097 [Google Scholar]
- Yousefi H, Motlagh SG, Montazeri M. Multi-criteria decision-making system for wind farm site-selection using geographic information system (GIS): Case study of Semnan Province, Iran. Sustainability 2022, 14, 7640. DOI:10.3390/su14137640 [Google Scholar]
- Luna-Rubio R, Trejo-Perea M, Vargas-Vázquez D, Ríos-Moreno GJ. Optimal sizing of renewable hybrid energy systems: A review of methodologies. Sol. Energy 2012, 86, 1077–1088. DOI:10.1016/j.solener.2011.10.016 [Google Scholar]
- Alshammari N, Asumadu J. Optimum unit sizing of hybrid renewable energy system utilizing harmony search, Jaya and particle swarm optimization algorithms. Sustain. Cities Soc. 2020, 60, 102255. DOI:10.1016/j.scs.2020.102255 [Google Scholar]
- Elkadeem MR, Younes A, Sharshir SW, Campana PE, Wang S. Sustainable siting and design optimisation of hybrid renewable energy systems: A geospatial multi-criteria analysis. Appl. Energy 2021, 295, 117071. DOI:10.1016/j.apenergy.2021.117071 [Google Scholar]
- Liu Z, Shi L, Guo J, Cai T, Wang X, Xia X. Spatiotemporal changes and utilisation intensity of the Zhoushan Archipelago coastline over four decades. J. Mar. Sci. Eng. 2024, 12, 2013. DOI:10.3390/jmse12112013 [Google Scholar]
- Cradden L, Kalogeri C, Barrios IM, Galanis G, Ingram D, Kallos G. Multi-criteria site selection for offshore renewable energy platforms. Renew. Energy 2016, 87, 791–806. DOI: 10.1016/j.renene.2015.10.035 [Google Scholar]
- Hersbach H, Bell B, Berrisfors P, Hirahara S, Horányi A, Muñoz-Sabater J, et al. The ERA5 global reanalysis. Q. J. R. Meteorol. Soc. 2020, 146, 1999–2049. DOI: 10.1002/qj.3803 [Google Scholar]
- Warren IR, Bach HK. MIKE 21: A modelling system for estuaries, coastal waters and seas. Environ. Softw. 1992, 7, 227–250. DOI:10.1016/0266-9838(92)90006-P [Google Scholar]
- Amante C, Eakins BW. ETOPO1 Arc-Minute Global Relief Model: Procedures, Data Sources and Analysis; National Geophysical Data Center, NOAA: Boulder, Colorado, 2009. [Google Scholar]
- Weatherall P, Marks KM, Jakobsson M, Schmitt T, Tani S, Arndt JK, et al. A new digital bathymetric model of the world’s oceans. Earth Space Sci. 2015, 2, 331–345. DOI:10.1002/2015EA000107 [Google Scholar]
- Pérez-Collazo C, Greaves D, Iglesias G. A review of combined wave and offshore wind energy. Renew. Sustain. Energy Rev. 2015, 42, 141–153. DOI:10.1016/j.rser.2014.09.032 [Google Scholar]
- Wen Y, Kamranzad B, Lin P. Joint exploitation potential of offshore wind and wave energy along the south and southeast coasts of China. Energy 2022, 249, 123710. DOI:10.1016/j.energy.2022.123710 [Google Scholar]
- Onea F, Rusu E. An Evaluation of Marine Renewable Energy Resources Complementarity in the Portuguese Nearshore. J. Mar. Sci. Eng. 2022, 10, 1901. DOI:10.3390/jmse10121901 [Google Scholar]
- Hagerman G, Polagye B. Methodology for Estimating Tidal Current Energy Resources and Power Production by Tidal In-Stream Energy Conversion Devices; Electric Power Research Institute: Palo Alto, CA, USA, 2006. [Google Scholar]
- Zuo Y, Chen S, Yang K, Guo B. On the correlation and complementarity assessment of ocean wind, solar and wave energy resources. In IET Conference Proceedings CP843; The Institution of Engineering and Technology: Stevenage, UK, 2023; pp. 1329–1336. [Google Scholar]
- Vafaei N, Ribeiro RA, Camarinha-Matos LM. Assessing normalization techniques for Simple Additive Weighting Method. Procedia Comput. Sci. 2022, 199, 1229–1236. DOI:10.1016/j.procs.2022.01.156 [Google Scholar]
- Chen SJ, Hwang CL. Fuzzy Multiple Attribute Decision Making: Methods and Applications; Springer: Berlin/Heidelberg, Germany, 1992; Volume 375, pp. 289–486. DOI:10.1007/978-3-642-46768-4_5 [Google Scholar]
- Saaty TL. How to make a decision: The analytic hierarchy process. Eur. J. Oper. Res. 1990, 48, 9–26. DOI:10.1016/0377-2217(90)90057-I [Google Scholar]
- Pohekar SD, Ramachandran M. Application of multi-criteria decision making to sustainable energy planning—A review. Renew. Sustain. Energy Rev. 2004, 8, 365–381. DOI:10.1016/j.rser.2003.12.007 [Google Scholar]
- Kamjoo A, Maheri A, Dizqah AM, Putrus GA. Multi-objective design under uncertainties of hybrid renewable energy systems using NSGA-II and chance-constrained programming. Int. J. Electr. Power Energy Syst. 2016, 74, 187–194. DOI:10.1016/j.ijepes.2015.07.007 [Google Scholar]
- Delgado MG, Sendra JB. Sensitivity analysis in multicriteria spatial decision-making: A review. Hum. Ecol. Risk Assess. Int. J. 2004, 10, 1173–1187. DOI:10.1080/10807030490887221 [Google Scholar]
- Chen Y, Yu J, Khan S. Spatial sensitivity analysis of multi-criteria weights in GIS-based land suitability evaluation. Environ. Model. Softw. 2010, 25, 1582–1591. DOI:10.1016/j.envsoft.2010.06.001 [Google Scholar]
- Hwang CL, Yoon K. Multiple Attribute Decision Making: Methods and Applications; Springer: Berlin/Heidelberg, Germany, 1992. DOI:10.1007/978-3-642-48318-9 [Google Scholar]
- Cavazzi S, Dutton AG. An offshore wind energy geographic information system (OWE-GIS) for assessment of the UK’s offshore wind energy potential. Renew. Energy 2016, 87, 212–228. DOI:10.1016/j.renene.2015.09.021 [Google Scholar]
- Vagiona DG, Kamilakis M. Sustainable site selection for offshore wind farms in the South Aegean—Greece. Sustainability 2018, 10, 749. DOI:10.3390/su10030749 [Google Scholar]
- Díaz H, Guedes Soares C. An integrated GIS approach for site selection of floating offshore wind farms in the Atlantic continental European coastline. Renew. Sustain. Energy Rev. 2020, 134, 110328. DOI:10.1016/j.rser.2020.110328 [Google Scholar]
- Malczewski J. GIS-based multicriteria decision analysis: A survey of the literature. Int. J. Geogr. Inf. Sci. 2006, 20, 703–726. DOI:10.1080/13658810600661508 [Google Scholar]
- Kolios A, Mytilinou V. Lozano-Minguez E, Salonitis K. A comparative study of multiple-criteria decision-making methods under stochastic inputs. Energies 2016, 9, 566. DOI:10.3390/en9070566 [Google Scholar]
- Chaouachi A, Covrig CF, Ardelean M. Multi-criteria selection of offshore wind farms: Case study for the Baltic States. Energy Policy 2017, 103, 179–192. DOI:10.1016/j.enpol.2017.01.018 [Google Scholar]
- Erdinc O, Uzunoglu M. Optimum design of hybrid renewable energy systems: Overview of different approaches. Renew. Sustain. Energy Rev. 2012, 16, 1412–1425. DOI:10.1016/j.rser.2011.11.011 [Google Scholar]
- Anoune K, Bouya M, Astito A, Ben Abdellah A. Sizing methods and optimization techniques for PV-wind based hybrid renewable energy system: A review. Renew. Sustain. Energy Rev. 2018, 93, 652–673. DOI:10.1016/j.rser.2018.05.032 [Google Scholar]
- Sánchez-Lozano JM, García-Cascales MS, Lamata MT. Identification and selection of potential sites for onshore wind farm development in the Region of Murcia, Spain. Energy 2014, 73, 311–324. DOI:10.1016/j.energy.2014.06.024 [Google Scholar]
- Díaz H, Guedes Soares C. A novel multi-criteria decision-making model to evaluate floating wind farm locations. Renew. Energy 2022, 185, 431–454. DOI:10.1016/j.renene.2021.12.014 [Google Scholar]
- Jahanshahloo GR, Hosseinzadeh Lotfi F, Izadikhah M. Extension of the TOPSIS method for decision-making problems with fuzzy data. Appl. Math. Comput. 2006, 181, 1544–1551. DOI:10.1016/j.amc.2006.02.057 [Google Scholar]