
Influence of Nutrient Enrichment and Temperature on Aquatic Invertebrate Communities in a Tropical Riverine System in Kenya
Influence of Nutrient Enrichment and Temperature on Aquatic Invertebrate Communities in a Tropical Riverine System in Kenya
Charity Nafuna Barasa
1,*
 Gelas Simiyu Muse
1
Judith Ashindu Khazenzi
1
Luckson Solicitor Maurice Gondwe
2
Gelas Simiyu Muse
1
Judith Ashindu Khazenzi
1
Luckson Solicitor Maurice Gondwe
2
Received: 28 March 2026 Revised: 19 May 2026 Accepted: 02 June 2026 Published: 22 June 2026

© 2026 The authors. This is an open access article under the Creative Commons Attribution 4.0 International License (https://creativecommons.org/licenses/by/4.0/).
1. Introduction
The persistence of past human-caused disturbances and the magnitude of their effects alter aquatic environments [1]. Anthropogenic activities such as changing land cover due to mining, construction of dams and roads, agricultural activities, and cattle grazing pose increasing pressure on freshwater ecosystems [2]. These activities alter nutrient dynamics, disrupt ecological balance, and deteriorate water quality [3]. Globally, groundwater and surface water systems are essential to more than five billion people for various purposes, including housing, manufacturing, crop production, and drinking water [4]. Eutrophication, characterized by habitat changes, hypoxia, and elevated primary productivity, is primarily driven by nutrient enrichment from industrial discharges, municipal effluents, and agricultural runoff [5]. In turn, these eutrophication conveys significant hazards to human health, fisheries, aquaculture, and biodiversity [6]. The most endangered organisms are benthic macroinvertebrates, which serve as crucial biomarkers of ecological integrity because of their limited mobility, diverse resilience to contamination, and vital roles in food web dynamics and nutrient cycling [7].
Ephemeroptera, Plecoptera, and Trichoptera (EPT) taxa have attracted most of the bioassessment attention; however, other orders, such as Odonata, Diptera, and Coleoptera, are increasingly recognized for their ecological significance and potential as bioindicators [8]. The diverse tolerance levels of Coleoptera, Odonata, and Diptera to pollution and habitat disturbance have made them widely acknowledged as significant bioindicators of aquatic ecosystem health [9]. The presence, absence, or relative abundance of these insect orders can serve as a valid indicator of water quality, as they occupy a variety of ecological niches and exhibit unique life-cycle features [10]. Dipterans thrive in contaminated or degraded environments [11].
Odonata, such as dragonflies and damselflies, are typically linked to cleaner waters [12]. Coleopterans offer more information on habitat conditions and gradients in water quality due to their wide range of sensitivities [13]. As a result, determining the diversity and makeup of these communities provides a reliable and economical method of analyzing the ecological integrity of freshwater systems.
Across trophic gradients, the Odonata, Diptera, and Coleoptera species may detect microscopic changes in water quality because of their varied ecological characteristics and differing levels of sensitivity to nutrient enrichment [14]. In aquatic environments, macroinvertebrate families like the Chironomidae (Diptera), Coenagrionidae and Lestidae (Odonata), and Dytiscidae and Hydrophilidae (Coleoptera) are essential and frequently employed as bioindicators of water quality [15]. These families belong to several functional feeding groups; chironomids are mostly collector-gatherers, damselflies (Coenagrionidae and Lestidae) are predators, and beetles are both predators and collector-gatherers [16]. They are especially helpful for evaluating the ecological integrity of various freshwater environments because of their differing tolerances to organic enrichment and habitat disturbance.
Numerous indices have been used to rate the water quality statuses [17]. The Water Quality Index (WQI) integrates several physicochemical variables into a single score to provide a quantitative assessment of the health of the water [18]. The swift advancement of computer science has led to the introduction of artificial intelligence (AI) technologies in water quality assessment models, such as ES and ML-based models. Through the use of computers, ES techniques, and ML models enhance human specialists’ decision-making skills to address challenging problems requiring specialized knowledge and experience [19]. The overall quality of the water can also be determined by combining the values of the nutrient pollution index (NPI), heavy metal pollution index (HPI), heavy metal evaluation index (HEI), and average water quality index (WQI) [20]. However, the cumulative, physiologically significant impacts of nutrient stress on aquatic communities may not be well captured by physicochemical parameters alone [21]. The resolution and dependability of water quality evaluations are improved when the assessment indices are combined with biological indicators, enabling the identification of ecological thresholds and long-term effects [22]. By integrating data on macroinvertebrate communities (Odonata, Diptera, and Coleoptera), measured nitrate–nitrogen and phosphate–phosphorus concentrations, and direct field observations of nearby human activities, this study provides a novel framework for assessing nutrient enrichment in a tropical river system. The nutrient levels at each sampling station were interpreted with regard to the local anthropogenic influences such as land use patterns, domestic wastewater discharge and agricultural activities, rather than merely depending on physicochemical indices. This method gives a more ecologically significant evaluation of water quality and offers important insights for freshwater monitoring in understudied tropical regions by integrating biological indicators with spatially informed interpretation of nutrient trends. The purpose of this study therefore, is to describe the community structure of Odonata, Diptera, and Coleoptera in River Kiminini with different nutrient loads, investigate the connection between these taxa and Nutrient pollution index, and assess their suitability as bioindicators for nutrient enrichment in freshwater ecosystems. This study advances the creation of improved biomonitoring frameworks by combining community ecology and water quality measures, and it offers empirical evidence in support of including a wider range of species in aquatic ecosystem evaluations.
2. Methodology
2.1. Study Area
The study was conducted on the River Kiminini in Trans Nzoia County, as presented by [22]. Ten sampling stations were established along the river continuum as shown in Figure 1 below.
Each station had unique land-use and riparian conditions that influenced surface runoffs, nutrient transport, and ecological processes along the river system.
S1 was characterized by dense plantings and natural trees on both sides of the river, and small-scale vegetable farming. Dense vegetation could have enhanced rainfall interception, infiltration, soil stability, and the reduction of surface runoff flowing into the river. However, runoff from the adjacent vegetable farm may contribute to nutrient loading into the river, especially during rainfall events.
Station S2 had blue gum trees on both sides of the river, a few natural trees, and Napier grass plantations. The dense tree cover and grass could have reduced surface runoff through enhanced water retention.
Station S3 was characterized by large scale maize farming on both sides of the river. The intensive maize farming activity may have influenced the river through increased surface runoff from land clearing, soil disturbances, and the lack of vegetation cover. Sediment and fertilizer-enriched runoffs from the exposed soils could have found their way into the river during wet seasons.
Station S4 had a mixture of crops such as maize, bananas, kales, hay plantation, and relatively less dense riparian vegetation. Mixed crop production with limited riparian vegetation could have increased surface runoff and nutrient loading into the river during rainy seasons.
Station S5 had kales, napier grass, bananas, fish ponds, and dense natural vegetation cover on both side of the river. The dense vegetation may have reduced surface runoff. The crops grown at this station use minimal fertilizers, promoting less nutrient flow into the river system.
Station S6 had maize, bananas, sugarcane plantations, a few blue gum trees, and less riparian vegetation cover. Intensive agricultural activities and few riparian vegetation could have caused high surface runoff and sediment transport. Fertilizer application during sugarcane cultivation could lead to nutrient enrichment of surface runoff during rainfall events.
Station S7 was characterized by maize, banana plantations, and a few blue gum trees. This land use patterns could have contributed to increased surface runoff, thereby increasing nutrient loads and sediment input into the river.
Station S8 had natural and planted trees together with maize plantations. The natural and planted trees could have reduced runoff intensity by improving infiltration and stabilizing the soil. However, runoff from maize farms would likely contribute nutrients to the river during rainfall events.
Station S9 had a large-scale sugarcane plantation, livestock keeping, and a few planted and native tree cover. Intensive agricultural activity and livestock keeping could have caused soil compaction, reduced infiltration rates, and caused increased surface runoff. Livestock keeping may have also contributed to organic waste and nutrient enrichment. The lack of riparian vegetation would have accelerated soil erosion and sediment transportation.
Station S10 had maize, bananas, and vegetable farming activities. These activities could have contribute to the river’s nutrient enrichment through surface runoff due to fertilizer application.
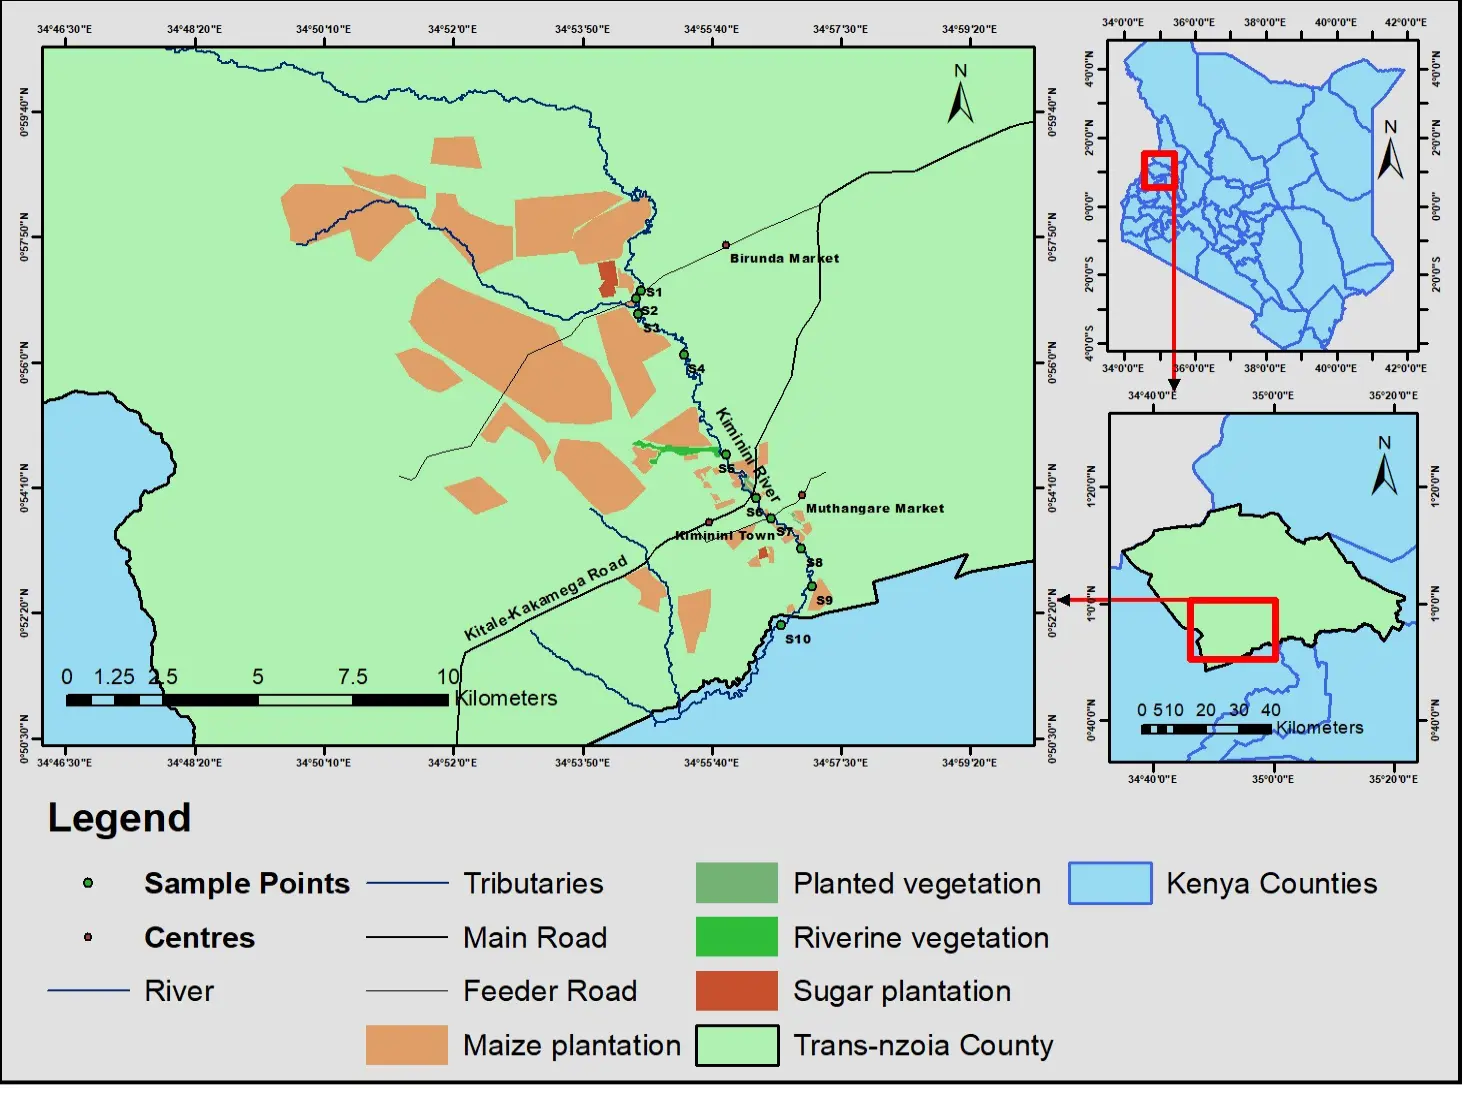
Figure 1. Map of the study area along River Kiminini showing sampling stations and land use patterns in Kiminini subcounty, Trans-Nzoia county, Kenya.
2.2. Sampling Period
Field sampling was conducted for three months, from July to September 2023 (Supplementary Table S1). These months are considered wet seasons with high rainfall throughout the months and moderate temperatures associated with the wet season. The available regional climate patterns suggest that rainfall conditions during this period were within the normal interannual variability for Trans-Nzoia County. Sampling during the wet season makes it possible for the evaluation of the responses of the macroinvertebrate community and the dynamics of nutrients during periods of high runoff and hydrology. Wet season sampling provides an exceptional opportunity to assess macroinvertebrate responses and nutrient dynamics since rainfall-driven runoff supplies the river with the largest nutrient loads. In addition to producing significant nutrient pulses through the mobilization of fertilizers, animal waste, and other watershed nutrients, increased discharge also modifies habitat through scouring and modifications to flow velocity and depth. Higher nutrient concentrations and physical disruption are experienced by macroinvertebrates in rivers during the wet season, enabling researchers to examine how functional attributes and community composition shift under extreme stress [23]. In contrast, during the dry phase of the hydrological cycle, the rivers’ dry-season flow becomes minimal, lowering concentrations of dissolved and total nutrients (Nitrates and Phosphates). This is due to a number of factors, including increased uptake by algae and macrophytes, decreased input from the catchment due to decreased surface runoff, and increased denitrification due to longer residence times of the water, thus favoring only taxa adapted to stagnant pools, which limits direct comparison of nutrient effects [24].
2.3. Sampling Design
The study adopted a descriptive survey design. Samples were collected from ten sampling stations and analyzed for nitrate–nitrogen and Phosphates–phosphorus as described in [22]. The NPI was then calculated.
2.4. Nutrient Pollution Index
Nutrients are essential to the survival, development, and reproduction of organisms [25]. Autotrophs are dependent on visible solar radiation, inorganic nutrients (carbon dioxide, nitrate, and phosphate), and photosynthesis to create the organic molecules that form cell organelles and support growth, survival, and reproduction [26]. Nutrient pollution due to land use changes, the combined sewer overflows, and discharging sites have been found important point sources of nutrient pollution [27]. Runoffs and its nutrient content are the main factors driving degradation in river water quality [28]. Therefore, NPI is an essential technique for assessing the level of nutrient contamination in water [29]. The NPI formula below has been shown to be efficient in a study by [30] on the application of the nutrient pollution index and water quality index to evaluate water quality in Turkey.
The formula of NPI is given in the Equation below.
| ```latex\mathrm{N}\mathrm{P}\mathrm{I}=\left(\frac{\mathrm{C}-\mathrm{N}}{\mathrm{M}\mathrm{A}\mathrm{C}-\mathrm{N}}\right)+\left(\frac{\mathrm{C}-\mathrm{P}}{\mathrm{M}\mathrm{A}\mathrm{C}-\mathrm{P}}\right)``` |
where:
$$\mathrm{C}-\mathrm{N}$$ = measured nitrate-nitrogen concentration (NO3–N)
$$\mathrm{C}-\mathrm{P}$$ = measured phosphate-phosphorus concentration (PO43−)
$$\mathrm{M}\mathrm{A}\mathrm{C}-\mathrm{N}$$ = maximum allowable concentration for NO3–N = 3 mg/L (ecological protective threshold [31]
$$\mathrm{M}\mathrm{A}\mathrm{C}-\mathrm{P}$$ = maximum allowable concentration for PO43− = 0.1 mg/L (river eutrophication threshold)
Values <1 represent no pollution, 1–3 moderate pollution, 3–6 considerable pollution, and >6 very high pollution.
2.5. Odonata, Coleoptera, and Diptera Identification
In the freshwater ecosystem, aquatic insects have been the most significant and varied part of the biota [32]. The water quality and ecological health status of water for animals and human use in streams can be determined using different aquatic invertebrate family biotic indices such as the Biological monitoring working party index, South west regional classification, and Ephemeroptera, Plecoptera, and Trichoptera indexes along with the physical and chemical properties [33]. In this study, samples of aquatic insects belonging to the Odonata, Diptera, and Coleoptera orders were carefully sorted and identified in the laboratory to their family level to ensure accurate taxonomic classification. Using distinctive morphological characteristics, the larval stages, which are frequently tiny and morphologically diverse, were examined under a dissecting microscope to enable accurate identification. On the other hand, direct visual examination identified larger, more morphologically distinct specimens without the need for magnification.
Each specimen was identified and then assigned to the proper taxonomic order and family. An updated standard taxonomic key was used to confirm each organism into their specific order and family [34]. The number of individuals in each order and family was noted to allow for a quantitative analysis of the composition of the community.
2.6. Data Analysis
Statistical analysis was done by R programming language version 4.5.3. The data were subjected to the Shapiro-Wilk test for normality at p = 0.05. Since the data was normally distributed after Shapiro wilk test, a One-way analysis of variance (ANOVA) was conducted to assess whether there was any statistically significant difference among means of the nutrient parameters. Multivariate and bivariate analysis were performed to bring out the relationship between the macroinvertebrate community and the nitrates, phosphates, and temperature. The R packages used in the analysis were Readr for data importation, ggplot2 for data visualization, ggpubr for plot clarity, reshape2 for reshaping data between wide and long formats, Vegan for multivariate analysis, and tidyr for data manipulation and transformation.
3. Results and Discussion
3.1. Nutrient Pollution Index
The level of nutrient enrichment in aquatic ecosystems, especially from excessive inputs of nitrogen and phosphorus, is assessed using the Nutrient Pollution Index (NPI), a composite metric [35]. It combines important nutrient concentrations into a single index, making it a useful tool for evaluating water quality, locating hotspots for nutrient pollution, and assisting management plans designed to minimize eutrophication and its related ecological effects [36]. The nutrient pollution index scores of River Kiminini were calculated based on the Nitrates–Nitrogen and Phosphate–Phosphorus levels shown in Table 1 below.
Table 1. Means of nitrates, phosphates and temperature across different sampling stations along River Kiminini Source [22].
|
Stations |
S1 |
S2 |
S3 |
S4 |
S5 |
S6 |
S7 |
S8 |
S9 |
S10 |
Significance |
|---|---|---|---|---|---|---|---|---|---|---|---|
|
Nitrates−Nitrogen (mg/L) |
12.09 ± 2.27 |
11.77 ± 2.27 |
14.40 ± 2.04 |
8.33 ± 2.85 |
8.29 ± 2.02 |
9.19 ± 1.90 |
10.85 ± 2.89 |
9.77 ± 1.88 |
12.54 ± 2.47 |
10.94 ± 1.75 |
p < 0.6610 |
|
Phosphates−Phosphorus (mg/L) |
1.02 ± 0.27 |
1.15 ± 0.41 |
1.24 ± 0.33 |
1.09 ± 0.26 |
0.69 ± 0.17 |
1.00 ± 0.18 |
1.00 ± 0.19 |
1.00 ± 0.17 |
1.29 ± 0.12 |
1.09 ± 0.25 |
p < 0.9660 |
|
Temperature (°C) |
20.48 ± 0.62 |
17.20 ± 1.92 |
19.90 ± 0.70 |
21.03 ± 0.45 |
21.30 ± 0.40 |
22.27 ± 0.55 |
22.15 ± 0.40 |
22.02 ± 0.89 |
22.07 ± 0.91 |
21.55 ± 0.62 |
p < 0.0040 ** |
** Indicates that temperature differed significantly among the sampling stations (p < 0.01).
The indices are shown in the Table 2 below. The index has its classification where by scores below 1 represents no pollution, a range of (1–3) represents moderate pollution, (3–6) implies considerable pollution and scores above 6 indicate very high pollution levels. The River Kiminini’s nutrient enrichment status is clearly indicated by the Nutrient Pollution Index (NPI) ratings, which are shown in Table 2. Well preserved environmental conditions are reflected in an NPI value below 1.0, which indicates no pollution. Moderate pollution is indicated by scores between 1.0 and 3.0, where nutrient levels may start to compromise the health of aquatic ecosystems. Considerable pollution is indicated by values between 3.1 and 6.0, which correspond to nutrient concentrations high enough to have a major ecological impact. Extreme nutrient enrichment and a high probability of ecological damage are indicated by scores higher than 6.0, which denote very high pollution levels. This classification makes it easier to compare different sampling locations and allows for simple interpretation of the river’s nutritive quality.
All the sampling stations along the River Kiminini showed very high pollution with variation in the scores between stations. Station S3 had the highest score of 17.2, which is in the nutrient pollution index standard range of (>6), implying very high pollution. The high score is attributed to large-scale maize farming, which utilizes high volumes of synthetic fertilizers that are, in turn, washed into the river through runoff during the wet season. The lowest score was in station S5 (9.66), which lied in the nutrient pollution index standard range of (>6), representing very high pollution. The score value at station S5 was lower than at other stations, although it was still in a very high pollution classification, probably due to less impact from the observed agricultural activities of kales, napier grass, and bananas along the river. This study applies the index in a tropical watershed and links the scores to land-use factors at fine spatial resolution, going beyond merely reporting NPI values. Diffuse nutrient pollution in similar rivers across the globe can be evaluated using a reproducible paradigm that combines quantitative nutrient indicators with in-depth field data of agricultural activities. These findings agree with [28] in their study on Landscape patterns regulating nonpoint source nutrient pollution in an agricultural watershed, which found that farmlands are a major contributor to water pollution.
Table 2. Nutrient pollution index score, NPI standard values, and their classification in different stations along River Kiminini.
|
Station |
C−N |
MAC−N |
C−P |
MAC−P |
NPI |
NPI Standard Values |
NPI Classification |
|---|---|---|---|---|---|---|---|
|
S1 |
12.09 |
3 |
1.02 |
0.1 |
14.23 |
>6 |
Very high pollution |
|
S2 |
11.77 |
3 |
1.15 |
0.1 |
15.42 |
>6 |
Very high pollution |
|
S3 |
14.4 |
3 |
1.24 |
0.1 |
17.2 |
>6 |
Very high pollution |
|
S4 |
8.33 |
3 |
1.09 |
0.1 |
13.68 |
>6 |
Very high pollution |
|
S5 |
8.29 |
3 |
0.69 |
0.1 |
9.66 |
>6 |
Very high pollution |
|
S6 |
9.19 |
3 |
1 |
0.1 |
13.06 |
>6 |
Very high pollution |
|
S7 |
10.85 |
3 |
1 |
0.1 |
13.62 |
>6 |
Very high pollution |
|
S8 |
9.77 |
3 |
1 |
0.1 |
13.26 |
>6 |
Very high pollution |
|
S9 |
12.54 |
3 |
1.29 |
0.1 |
17.08 |
>6 |
Very high pollution |
|
S10 |
10.94 |
3 |
1.09 |
0.1 |
14.55 |
>6 |
Very high pollution |
3.2. Odonata, Diptera, and Coleoptera Abundance
The stacked bar chart below (Figure 2) represents the distribution of Coleoptera (blue), Diptera (brown), and Odonata (green) across ten different sampling stations labelled (S1 to S10) along River Kiminini. The horizontal axis represents the different sampling stations, while the vertical axis indicates the total number of individual species collected per order. The community structure was dominated by Odonata in most sampled stations. Station S1 (n = 53) had the highest record, suggesting the availability of a favorable environment. The high abundance could have been supported by the dominance of both planted and natural trees, as well as the vegetable farming, which does not utilize a lot of synthetic fertilizers. S9 (4) had the lowest representation of Odonata, indicating that the station was sensitive to local environmental stressors. The large-scale plantation of sugarcane along the station could have contributed to high pollution levels, thus reducing the Odonata order. These results agree with the River Kiminini nutrient pollution index scores that confirmed station S9 in the classification of very high pollution with a high NPI score of 17.08 due to pollution from intensive sugarcane farming, as compared to station S1, which was also in the very high pollution classification with a lesser NPI score of 9.66, indicating lower effects from human activities in the area. According to [37], Odonata were found to be sensitive to stressors in both aquatic and terrestrial habitats, thus providing insights into the impacts of urbanization on aquatic ecosystems. A study by [38] also recorded lower richness of Odonata in human impacted regions. The largest number of Diptera was found at station S9 (30), which indicated high levels of organic loading and pollution. The pollution concentrations lowered the dissolved oxygen levels since Diptera are adapted to living in low oxygen environments. These findings are supported by [39] who found out that some larval chironomids can supplement their oxygen requirements in oxygen-poor habitats by using haemoglobin, which imparts the red body color and gives rise to the vernacular name bloodworms. Stations S5, S6, and S8 had the lowest reported value of Diptera (6), indicating that the water in the mentioned stations was significantly a favorable environment compared to the other stations as indicated in their NPI scores. A study by [40] on the determination of dipteran larvae in indication of low water quality found out that the presence of high numbers of Diptera order in a station indicated a poor status of freshwater. The abundance of coleoptera varied, with the highest reading at station S7 (17) likely because of the available food sources of the decomposing organic matter that these species prefer provided by maize remains, banana leaves and blue gum tree leaves in the station. Coleoptera are helpful in determining the impacts of human activities by use of their richness and diversity, they are easy to handle, have ecological faithfulness, fragility to small environmental changes and good organism responses [41]. In addition to being very sensitive to a variety of ecological factors, Coleopterans respond quickly to changes in their surroundings and are readily and economically sampled using a variety of techniques. They were lowest at station S3 (3) due to contaminated water as evidenced by the high NPI score of 17.2 as compared to the water quality in station S7 (13.62). The lower numbers in station S3 were also as a result of lesser flora and particulate matter at station S3 which serves as food, habitat and breeding site for the Coleoptera [42]. The regional variance in macroinvertebrate order abundance suggests that different sampling stations reacted differently to habitat conditions and environmental gradients [43]. These findings showed that, in contrast to the Coleoptera and Odonata, the Diptera order was outstanding at surviving in highly polluted water, as evidenced by their dominance in stations with high NPI scores, such as S9, and their decreased abundance in S5, which had the lowest NPI score. The study on the distribution of macroinvertebrates at the order level offers important information about the ecological well-being and environmental conditions of freshwater systems. Localized surges in Diptera and Coleoptera, along with the high relative abundance of Odonata across some stations, point to intricate relationships between environmental factors and biotic communities. These findings support the use of macroinvertebrate assemblages as bioindicators in ongoing, fine-scale biomonitoring to inform conservation and restoration plans.
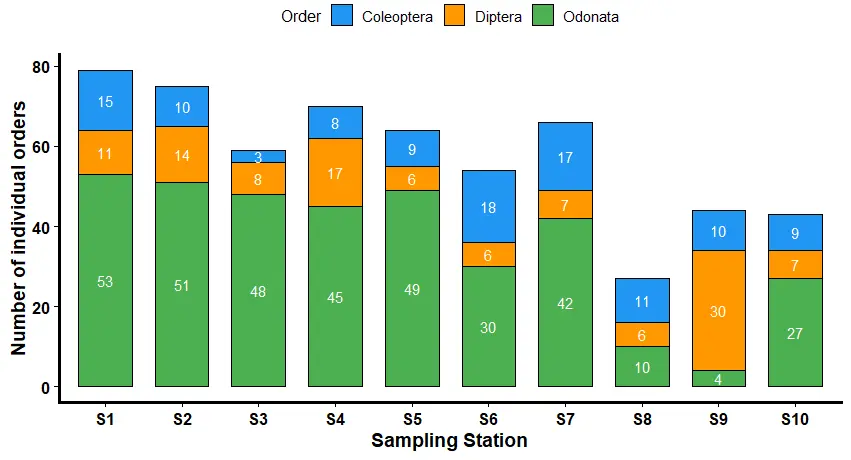
Figure 2. Distribution of Odonata, Diptera, and Coleoptera abundance across different stations along River Kiminini.
3.3. Odonata, Coleoptera, and Diptera Orders, Family, Abundance, FFG, and Pollution Sensitivity
There were significant variations in water quality, food resource availability, and habitat structure reflected through the distribution of the five macroinvertebrate families among the stations.
The stations with a lower value of the nutrient pollution index score had higher abundances of predatory families like Dytiscidae (Coleoptera) and the damselfly families Coenagrionidae and Lestidae (Odonata), especially S1, S7, S8, and the least affected station S5, where stable habitats, a variety of prey, and well-oxygenated conditions supported their feeding needs (Table 3). In contrast, their numbers declined sharply at the most polluted stations (S3 and S9), where habitat degradation and reduced prey diversity limited their populations. Hydrophilidae (Coleoptera), a predator at larval stage and tolerant to moderate disturbance, recorded high numbers in stations S7 and S8 with an abundance of 7 in both stations, possibly due to food resources provided by the decomposing organic matter from tree leaves, maize, and bananas. The lowest count of the Hydrophilidae was at station S3 due to high pollution levels, evidenced by the NPI score of 17.2. Dytiscidae family had a high count in station S7, which had a slightly low nutrient pollution index score of (13.62) as compared to stations S3 and S9. The high abundance could also have been supported by the availability of food sources, such as prey, and by a good habitat structure provided by leaf litter from trees at the station and by aquatic vegetation that provided an enabling breeding site for the organisms. The lowest count of the Dytiscidae family was at station S3, probably due to the high nutrient pollution score of 17.2 and poor habitat structure due to the absence of trees in the station. Chironomidae (Diptera), also collector-gatherers, were most abundant at the most polluted station S9, which had a high nutrient pollution index of 17.08, implying very high pollution. This is attributed to Chironomidae’s tolerance to polluted environments [44]. The high abundance was also supported by high organic loading and fine particulate organic matter from sugarcane, planted and native trees, which favored their feeding strategy and their potential to withstand low dissolved oxygen levels. The Diptera counts were lowest in stations S5, S6, and S8, with a similar count of 6, which were stations with a lower nutrient pollution index score as compared to S3 and S9, implying favorable environmental conditions that are less preferred by the Chironomids. In the Odonata order, the Coenagrionidae family had a high count in station S1, with 32 organisms, probably due to the slightly low nutrient pollution index score in the station, and also the cooler water temperatures provided by the planted and native trees in the station. The high abundance could also have been supported by the litter from tree leaves, which served as food sources in their decomposition stage and a refuge from predators. They were recorded lowest at station S9 due to the high pollution levels caused by intensive sugarcane farming, evidenced by a high nutrient pollution score in the station. The Lestidae family had a high abundance in stations S1 and S2, with a similar count of 21 organisms due to the slightly lower nutrient pollution index score of 14.23 and 15.42, respectively. The high numbers could also be attributed to the good vegetative structure around the stations, evidenced by the presence of both the native and planted trees, which provided perching spots for the organisms and a hiding place for their prey. The Lestidae were lowest in station S9, with a record of 1 organism due to high pollution levels, evidenced by the high nutrient pollution index score of 17.08. The significance of these families as biomarkers of ecological integrity is generally demonstrated by the prevalence of collector-gatherers in contaminated environments and the predominance of predatory families in less polluted areas [45].
Table 3. Showing Odonata, Coleoptera, and Diptera orders, family, abundance, FFG, and pollution sensitivity along River Kiminini.
|
Station |
Order |
Family |
Abundance |
FFG |
Pollution Sensitivity |
|---|---|---|---|---|---|
|
S1 |
Coleoptera (Water beetles) |
Dytiscidae |
9 |
Predators |
Moderately tolerant |
|
Hydrophilidae |
6 |
Predators |
Tolerant |
||
|
Diptera (Chironomids) |
Chironomidae |
11 |
Collector-gatherers |
Tolerant |
|
|
Odonata (Damselfly) |
Coenagrionidae |
32 |
Predators |
Moderately tolerant |
|
|
Lestidae |
21 |
Predators |
Moderately sensitive |
||
|
S2 |
Coleoptera (Water beetles) |
Dytiscidae |
6 |
Predators |
Moderately tolerant |
|
Hydrophilidae |
4 |
Predators |
Tolerant |
||
|
Diptera (Chironomids) |
Chironomidae |
14 |
Collector-gatherers |
Tolerant |
|
|
Odonata (Damselfly) |
Coenagrionidae |
30 |
Predators |
Moderately tolerant |
|
|
Lestidae |
21 |
Predators |
Moderately sensitive |
||
|
S3 |
Coleoptera (Water beetles) |
Dytiscidae |
1 |
Predators |
Moderately tolerant |
|
Hydrophilidae |
2 |
Predators |
Tolerant |
||
|
Diptera (Chironomids) |
Chironomidae |
8 |
Collector-gatherers |
Tolerant |
|
|
Odonata (Damselfly) |
Coenagrionidae |
29 |
Predators |
Moderately tolerant |
|
|
Lestidae |
19 |
Predators |
Moderately sensitive |
||
|
S4 |
Coleoptera (Water beetles) |
Dytiscidae |
5 |
Predators |
Moderately tolerant |
|
Hydrophilidae |
3 |
Predators |
Tolerant |
||
|
Diptera (Chironomids) |
Chironomidae |
17 |
Collector-gatherers |
Tolerant |
|
|
Odonata (Damselfly) |
Coenagrionidae |
28 |
Predators |
Moderately tolerant |
|
|
Lestidae |
17 |
Predators |
Moderately sensitive |
||
|
S5 |
Coleoptera (Water beetles) |
Dytiscidae |
6 |
Predators |
Moderately tolerant |
|
Hydrophilidae |
3 |
Predators |
Tolerant |
||
|
Diptera (Chironomids) |
Chironomidae |
6 |
Collector-gatherers |
Tolerant |
|
|
Odonata (Damselfly) |
Coenagrionidae |
30 |
Predators |
Moderately tolerant |
|
|
Lestidae |
19 |
Predators |
Moderately sensitive |
||
|
S6 |
Coleoptera (Water beetles) |
Dytiscidae |
7 |
Predators |
Moderately tolerant |
|
Hydrophilidae |
11 |
Predators |
Tolerant |
||
|
Diptera (Chironomids) |
Chironomidae |
6 |
Collector-gatherers |
Tolerant |
|
|
Odonata (Damselfly) |
Coenagrionidae |
19 |
Predators |
Moderately tolerant |
|
|
Lestidae |
11 |
Predators |
Moderately sensitive |
||
|
S7 |
Coleoptera (Water beetles) |
Dytiscidae |
10 |
Predators |
Moderately tolerant |
|
Hydrophilidae |
7 |
Predators |
Tolerant |
||
|
Diptera (Chironomids) |
Chironomidae |
7 |
Collector-gatherers |
Tolerant |
|
|
Odonata (Damselfly) |
Coenagrionidae |
26 |
Predators |
Moderately tolerant |
|
|
Lestidae |
16 |
Predators |
Moderately sensitive |
||
|
S8 |
Coleoptera (Water beetles) |
Dytiscidae |
4 |
Predators |
Moderately tolerant |
|
Hydrophilidae |
7 |
Predators |
Tolerant |
||
|
Diptera (Chironomids) |
Chironomidae |
6 |
Collector-gatherers |
Tolerant |
|
|
Odonata (Damselfly) |
Coenagrionidae |
6 |
Predators |
Moderately tolerant |
|
|
Lestidae |
4 |
Predators |
Moderately sensitive |
||
|
S9 |
Coleoptera (Water beetles) |
Dytiscidae |
6 |
Predators |
Moderately tolerant |
|
Hydrophilidae |
4 |
Predators |
Tolerant |
||
|
Diptera (Chironomids) |
Chironomidae |
30 |
Collector-gatherers |
Tolerant |
|
|
Odonata (Damselfly) |
Coenagrionidae |
3 |
Predators |
Moderately tolerant |
|
|
Lestidae |
1 |
Predators |
Moderately sensitive |
||
|
S10 |
Coleoptera (Water beetles) |
Dytiscidae |
5 |
Predators |
Moderately tolerant |
|
Hydrophilidae |
4 |
Predators |
Tolerant |
||
|
Diptera (Chironomids) |
Chironomidae |
7 |
Collector-gatherers |
Tolerant |
|
|
Odonata (Damselfly) |
Coenagrionidae |
17 |
Predators |
Moderately tolerant |
|
|
Lestidae |
10 |
Predators |
Moderately sensitive |
3.4. Correlation Between the Odonata, Diptera, and Coleoptera Abundance and the Nutrient Pollution Index
The relationship between the Nutrient Pollution Index (NPI) and the abundance of Coleoptera, Diptera, and Odonata is illustrated in Figure 3 below. All sampling stations along the River Kiminini had NPI scores above 6, implying very high pollution. The three panels show the Pearson correlation analysis between the Odonata, Diptera, and the Coleoptera with the NPI. The Odonata on the left panel showed a weak, non-significant negative correlation with NPI (r = −0.22, p = 0.535). This implies that an increase in nutrient levels along the River Kiminini slightly decreased the Odonata abundance. These results agree with findings of [46], who noted Odonata preference to denser riparian vegetation, good water quality, and diverse flows and substrate in neotropical savanna headwater streams.
Diptera (middle panel) showed a positive but non-significant relationship with NPI (r = 0.54, p = 0.107), indicating that their abundance increased with an increase in the nutrient pollution, consistent with their tolerance to degraded water quality. These results concur with a study by [33] on family variation of aquatic insects and water properties to assess freshwater quality in El-Mansouriya stream, Egypt, which found the Diptera, particularly the chironomid larvae, to be tolerant to pollution.
Coleoptera (right panel) showed a negative, non-significant correlation (r = −0.33, p = 0.345). This suggests that an increase in the NPI scores decreased slightly the coleoptera abundance, implying sensitivity to elevated nutrient levels. The findings on Coleoptera are supported by a study on aquatic Coleoptera response to environmental factors of freshwater ecosystems in Changbai Mountain, northeast China, which found organic matter, phosphorus, and nitrates to have a significant impact on the aquatic beetle community [47].
The observed patterns show differences in pollution tolerance among the three taxa, with Diptera being better suited to the nutrient enrichment indicator and Coleoptera and Odonata serving as possible early indicators of further ecological deterioration, even though these relationships were not statistically significant (p > 0.05).
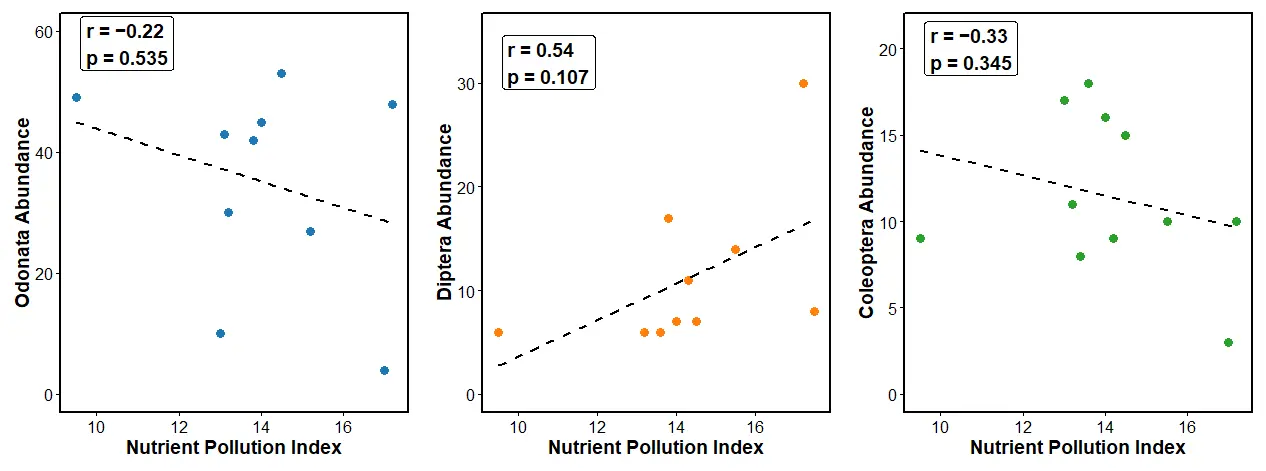
Figure 3. Showing a scatter plot of nutrient pollution index against the different aquatic orders along River Kiminini.
3.5. Redundancy Analysis Between the Families of Odonata, Diptera, and Coleoptera Abundance and the Temperature, Nitrates−N, and Phosphates−P
The Figure 4 below shows a Redundancy analysis plot between the Odonata, Diptera, Coleoptera families and the temperature, Nitrates–N, and Phosphates–Phosphorus. There is structural organization of the macroinvertebrate community based on nutrient concentration along two axes. The first axis demonstrates a variation of 37% (RDA1) while the second axis accounts for 8.2% (RDA2). The dominance of RDA1(37%) suggests that nutrient enrichment is the major environmental gradient influencing the distribution pattern of the studied organisms. There is a distinct segregation of sampling stations and the organisms into two groups along the positive direction of RDA1 because of increasing anthropogenic pollution of the environment with Nitrates–Nitrogen and Phosphates–phosphorus. On the other hand, stations clustered at the negative side of RDA1 are less polluted. The high variance recorded in RDA1 (37%) indicates a strong impact of nutrients on the studied macroinvertebrate community structure.
There was a strong positive association between the Chironomidae, Phosphates–phosphorus, and Nitrates–Nitrogen on the positive direction of RDA1. This close association implies that the Chironomidae are tolerant to nutrient enrichment. Ecologically, Chironomidae are known for their high adaptability and are capable of surviving in hypoxic environments due to physiological features, such as a hemoglobin-like pigment that enhances oxygen extraction from polluted water bodies [48]. This attribute approves Chironomidae as an excellent indicator of the deterioration of freshwater bodies. Phosphates–P, Nitrates–N, and Chironomidae are associated with station S9, signifying that this station is impacted by the highest nutrient enrichment.
Coenagrionidae and Lestidae, on the contrary, were positioned on the negative panel of RDA1, showing an inverse relationship with high nutrient levels. The organisms were clustered in station S5, which was a less polluted area, demonstrating their preference for stable habitats and good environmental conditions. These findings are supported by [49], who reported Coenagrionidae and Lestidae as good bioindicators of a preserved environment.
The close association between Hydrophilidae, Dytiscidae families and temperature suggests that temperature influenced their ecological niche formation greatly. Temperature has important roles for the life of Hydrophilidae and Dytiscidae species since the temperature affects metabolism, development, feeding activity, and reproduction of the organisms [50]. Hydrophilidae and Dytiscidae larva demonstrated a strong relationship with stations S1, S8, and S10. These indicate that the locations were warm enough to create favorable conditions for the survival of the organisms.
In summary, these findings reveal that nutrient pollution and temperature play a crucial role in the formation of the ecological structure of the examined biological communities. The transition from sensitive Coenagrionidae and Lestidae to tolerant Chironomidae along the nutrient gradient demonstrates the presence of disturbance caused by human activities.
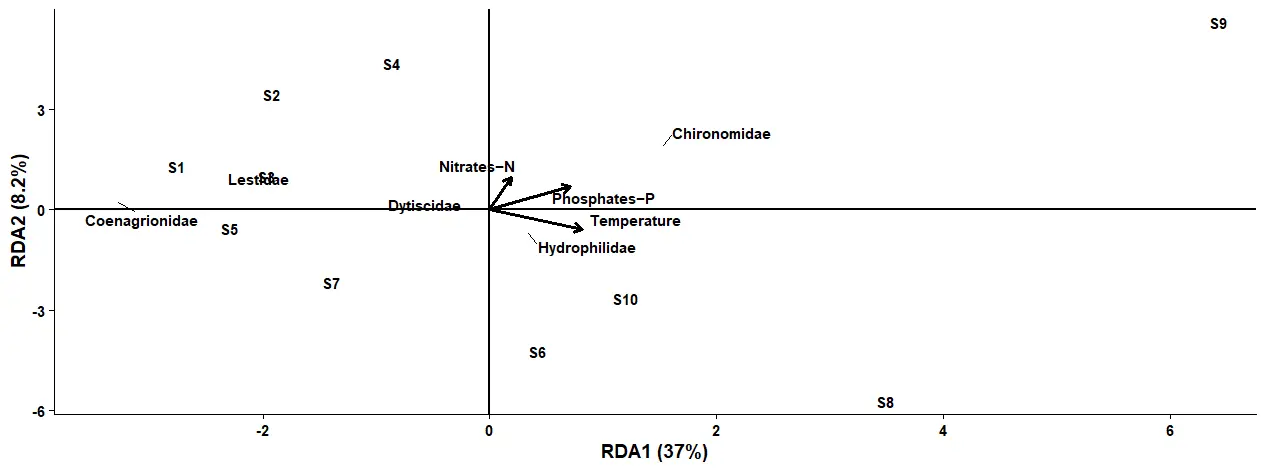
Figure 4. Redundancy analysis between the families of Odonata, Diptera and Coleoptera abundance and the Temperature, Nitrates–N and Phosphates–P.
3.6. Pearson Correlation Matrix Between the Families of Odonata, Diptera, and Coleoptera Abundance and the Temperature, Nitrates–N, and Phosphates–P
The correlation heatmap (Figure 5) below shows the correlations between the families of Odonata, Diptera, and Coleoptera abundance and the Temperature, Nitrates–N, and Phosphates–P. The matrix demonstrates both positive and negative correlations ranging from weak to extremely strong associations, suggesting complex ecological interactions within the aquatic ecosystem.
There was a high positive correlation between Coenagrionidae and Lestidae (r = 0.99). The close connection implies that the organisms have a similar preference to the ecological needs. These findings are supported by the fact that both Coenagrionidae and Lestidae are sensitive species with a preference to clean and preserved aquatic environments [51]. On the contrary, Coenagrionidae (r = −0.55) and Lestidae (r = −0.63) exhibited negative correlations with temperature. The negative correlations suggest that an increase in temperature causes a negative impact on the distribution of these families. Ecologically, an increase in water temperatures results in a reduction in the availability of dissolved oxygen, thus leading to stress among aquatic organisms [52]. Lestidae exhibited a higher negative correlation compared to Coenagrionidae, implying that the tolerance range of this species is narrower than that of Coenagrionidae.
Chironomidae demonstrated a high positive correlation with phosphates (r = 0.61) and a moderate positive correlation with nitrates (r = 0.26). These findings demonstrate the capacity of the Chironomidae to survive in nutrient-polluted and oxygen-depleted water. The results agree with [53], who reported that the Chironomidae are able to survive in harsh ecological conditions. In addition, Chironomidae had a higher correlation coefficient with phosphates than with nitrates, suggesting that phosphorus is the most influential parameter in chironomid proliferation.
Hydrophilidae showed the positive correlations with temperature (r = 0.44) and Dytiscidae (r = 0.51). These results indicate that the Hydrophilidae possess a wide range of ecological conditions and a strong adaptive and coping mechanism [54]. Additionally, Hydrophilidae were characterized by the negative correlations with nitrates (r = −0.30), phosphates (r = −0.21), Coenagrionidae (r = −0.26), and Lestidae (r = −0.28), which implies that the Odonata families partially differed from the Coleoptera assemblages.
Dytiscidae showed weak positive correlations with Coenagrionidae (r = 0.17) and Lestidae (r = 0.14) and negative associations with nitrates (r = −0.25) and phosphates (r = −0.34). These findings imply that Dytiscidae prefer locations with low nutrient pollution as well as better ecological conditions.
Temperature exhibited negative correlations with both nitrate (r = −0.38) and phosphate levels (r = −0.25). This trend may have been influenced by hydrological changes at the time of sampling, as data collection occurred during the wet season. Surface runoff during rainfall periods impacted the nutrient concentrations within the sampling stations.
The nitrates and phosphates had a high significant positive relationship (r = 0.72), implying that the two nutrients share the same anthropogenic source. The sources of the nutrients could be from agricultural fertilizer use, livestock keeping, and domestic effluents [55].
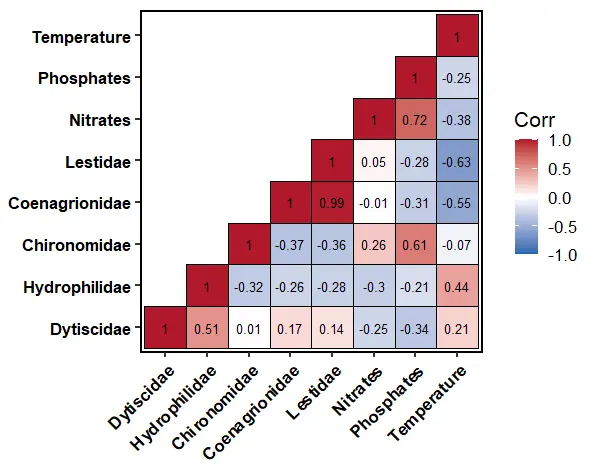
Figure 5. Pearson correlation matrix between the families of Odonata, Diptera, and Coleoptera abundance and the Temperature, Nitrates−N, and Phosphates−P.
3.7. Trophic Pyramid of the Odonata, Diptera, and Coleoptera Families
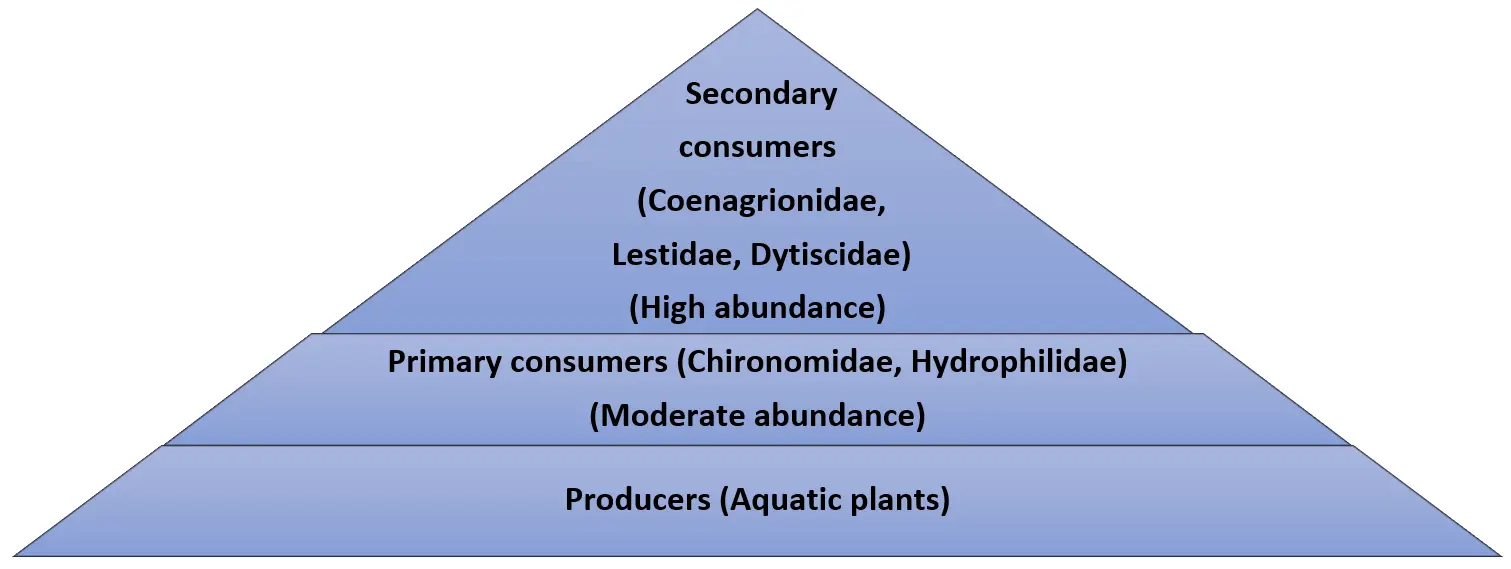
The trophic pyramid of River Kiminini follows the three-tiered food chain, which comprises primary producers, primary consumers, and secondary consumers. The primary producers of the food chain are constituted by aquatic plants, which serve as the energy base of the river. The primary consumers include collector gatherers that feed on fine particulate organic matter and riparian debris. They primary consumers in this study are Chironomidae (Diptera) and Hydrophilidae (Coleoptera). The secondary consumers include predators such as Dytiscidae (Coleoptera), Coenagrionidae (Odonata), and Lestidae (Odonata).
3.8. Trophic Pyramid in Less Disturbed Stations
The trophic pyramid varied according to the contamination levels in the river, as shown in Figure 6 below. The stations that were less polluted exhibited a high abundance of predators such as Coenagrionidae (32), Lestidae (21), and Dytiscidae (10). These findings demonstrate that the environments in stations S1, S2, and S5 were suitable for the survival of predators with well-preserved habitat structure, well-oxygenated water, vegetative cover around the river banks, and prey availability. On the other hand, there was a control of the lower trophic levels by predatory family members through a top-down regulation pattern.
3.9. Trophic Pyramid in Disturbed Stations
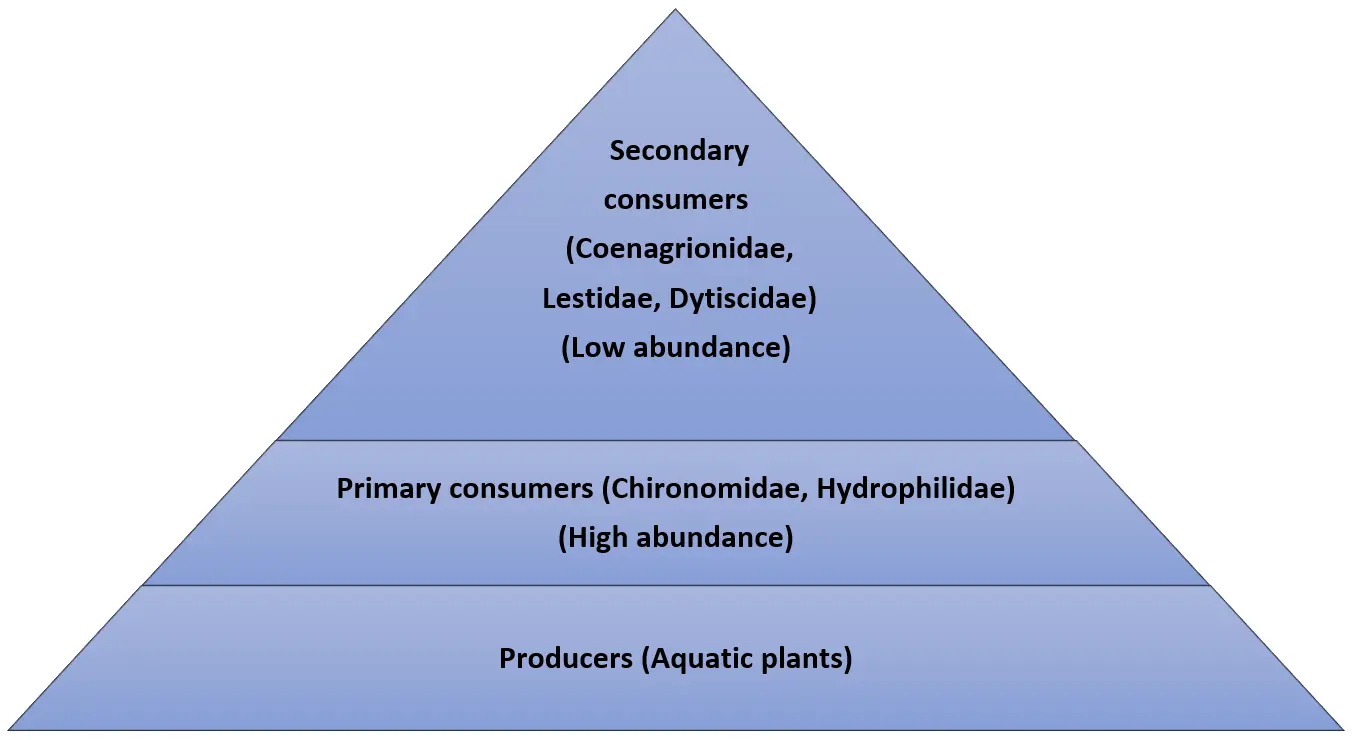
Figure 7 below shows a trophic pyramid in disturbed stations along the River Kiminini. The river had two stations, which were highly disturbed; station S9 and station S3. The food chain analysis demonstrated a trophic simplification due to habitat alteration and pollution stress. There was a significant decrease in predators, where Coenagrionidae reduced to 3, Lestidae decreased to 1 organism and Dytiscidae decreased to 1. The reduction in predator population is a result of poor habitat conditions, increased nutrient content, and decreased concentration of dissolved oxygen, thus making it difficult for the organisms to breed and feed. As a result, tolerant collector-gatherers like Chironomidae became dominant and increased in numbers with a high count of 30 individuals in station S9. This shift indicates a transition from a balanced predator-regulated food web to a detritus-driven trophic structure dominated by pollution-tolerant taxa and reduced top-down ecological control.
4. Conclusions and Recommendations
Based on the findings, the agricultural activities such as intensive production of maize in station S3 and sugarcane production in station S9 influenced the abundance of aquatic insects, leading to a reduction in the populations of Coenagrionidae and Lestidae in the stations with high levels of pollution (S3 and S9). At station S9, high counts of Chironomidae were noted, implying tolerance to organic pollutants. The population of Dytiscidae was observed to be high in the stations with low levels of pollution, indicating their sensitivity to habitat destruction.
There are several limitations in this study that calls for further research. Seasonality was not considered despite the fact that aquatic insects are affected by rainfall and other environmental factors. The identification of the species was done to the family level, making it difficult to determine genus variations under pollution. Additionally, the study lacks an ecological threshold and fauna-nutrient interaction. Furthermore, there is no data about specific agrochemicals chemicals used in farms around the research area.
Despite the above-mentioned weaknesses, the Odonata, Coleoptera, and Diptera families are suitable bioindicators in aquatic ecosystems.
Supplementary Materials
The following supporting information can be found at: https://www.sciepublish.com/article/pii/1070, Table S1: Raw data of the physical chemical parameters, the macroinvertebrates and their families.
Statement of the Use of Generative AI and AI-Assisted Technologies in the Writing Process
During the preparation of this manuscript, the authors used Deekseek.com to rate the flow of work, improve coherence, check grammatical errors and to generate codes of data analysis. After using this tool/service, the authors reviewed and edited the content as needed and takes full responsibility for the content of the published article.
Acknowledgments
We acknowledge Doreen Meso of the Biotechnology Laboratory, University of Eldoret, for her vital support during the laboratory analyses.
Author Contributions
C.N.B.: Conceptualization, Data Curation, Formal Analysis, Funding Acquisition, Investigation, Methodology, Project Administration, Resources, Software, Visualization, Writing original draft, Review & Editing. G.S.M.: Conceptualization, Data Curation, Investigation, Methodology, Project Administration, Software, Supervision & Validation. J.A.K.: Conceptualization, Data Curation, Investigation, Methodology, Project Administration, Software, Supervision & Validation. L.S.M.G.: Conceptualization, Data Curation, Investigation, Methodology, Project Administration, Software, Validation, Visualization, Writing, Review & Editing.
Ethics Statement
Not applicable.
Informed Consent Statement
Not applicable.
Data Availability Statement
All the required data are uploaded as supplementary material.
Funding
This research received no external funding.
Declaration of Competing Interest
The authors declare that they have no known competing financial interests or personal relationships that could have appeared to influence the work reported in this paper.
References
- Bănăduc D, Curtean-Bănăduc A, Barinova S, Lozano V, Afanasyev S, Leite T, et al. Multi-Interacting Natural and Anthropogenic Stressors on Freshwater Ecosystems: Their Current Status and Future Prospects for 21st Century. Water 2024, 16, 1483. DOI:10.3390/w16111483 [Google Scholar]
- Ogidi OI, Akpan UM. Aquatic Biodiversity Loss: Impacts of Pollution and Anthropogenic Activities and Strategies for Conservation. In Biodiversity in Africa: Potentials, Threats and Conservation; Chibueze Izah S, Ed.; Springer Nature: Singapore, 2022; pp. 421–448. DOI:10.1007/978-981-19-3326-4_16 [Google Scholar]
- Castello L, Macedo MN. Large‐scale degradation of Amazonian freshwater ecosystems. Glob. Change Biol. 2016, 22, 990–1007. DOI:10.1111/gcb.13173 [Google Scholar]
- Akhtar N, Syakir Ishak MI, Bhawani SA, Umar K. Various Natural and Anthropogenic Factors Responsible for Water Quality Degradation: A Review. Water 2021, 13, 2660. DOI:10.3390/w13192660 [Google Scholar]
- Tiwari AK, Pal DB. Chapter 11—Nutrients contamination and eutrophication in the river ecosystem. In Ecological Significance of River Ecosystems; Madhav S, Kanhaiya S, Srivastav A, Singh V, Singh P, Eds.; Elsevier: Amsterdam, The Netherlands, 2022; pp. 203–216. DOI:10.1016/B978-0-323-85045-2.00001-7 [Google Scholar]
- Lan J, Liu P, Hu X, Zhu S. Harmful Algal Blooms in Eutrophic Marine Environments: Causes, Monitoring, and Treatment. Water 2024, 16, 2525. DOI:10.3390/w16172525 [Google Scholar]
- Sumudumali RGI, Jayawardana JMCK. A Review of Biological Monitoring of Aquatic Ecosystems Approaches: With Special Reference to Macroinvertebrates and Pesticide Pollution. Environ. Manag. 2021, 67, 263–276. DOI:10.1007/s00267-020-01423-0 [Google Scholar]
- Tchakonté S, Ajeagah GA, Camara AI, Diomandé D, Nyamsi Tchatcho NL, Ngassam P. Impact of urbanization on aquatic insect assemblages in the coastal zone of Cameroon: the use of biotraits and indicator taxa to assess environmental pollution. Hydrobiologia 2015, 755, 123–144. DOI:10.1007/s10750-015-2221-5 [Google Scholar]
- Taek GGM. Evaluation of aquatic insects as bioindicators of water quality in industrial areas of Surabaya, East Java. Genbinesia J. Biol. 2024, 3, 105–112. DOI:10.55655/genbinesia.v3i3.58 [Google Scholar]
- Silva HV. Effects of Urbanization on the Diversity, Life-History Traits and Fluctuating Asymmetry of Odonates (Odonata: Zygoptera and Anisoptera). Ph.D. Dissertation, Universidade de São Paulo, São Paulo, Brazil, 2022. DOI:10.11606/T.59.2022.tde-15122022-100733 [Google Scholar]
- Arimoro FO, Ikomi RB, Iwegbue CMA. Water quality changes in relation to Diptera community patterns and diversity measured at an organic effluent impacted stream in the Niger Delta, Nigeria. Ecol. Indic. 2007, 7, 541–552. DOI:10.1016/j.ecolind.2006.06.002 [Google Scholar]
- Parihar D, Mathur M. A Review on the Impact of Polluted Water on Insect Diversity (Odonates). (SSRN Scholarly Paper No. 5270493). 2025. Available online: https://papers.ssrn.com/sol3/papers.cfm?abstract_id=5270493 (accessed on 12 April 2026).
- Sharma S, Sharma G, Pir FA. Diversity and habitat selection of aquatic beetles (Coleoptera). IOSR J. Pharm. Biol. Sci. (IOSR-JPBS) 2019, 14, 31–37. Available online: https://www.researchgate.net/profile/Faisal-Ahmad-Pir/publication/330279767 (accessed on 8 March 2026).
- Priya J, Ritesh B, Majid A, Sanjay T. A review on: Insects as bioindicators for an ecosystem and key species in trophic level. World J. Adv. Res. Rev. 2024, 24, 430–446. DOI:10.30574/wjarr.2024.24.1.3007 [Google Scholar]
- Enabulele CO, Olomukoro JO. Benthic Macroinvertebrates as Indicators of Water Quality and Ecological Health in a Tropical Lake, Southern Nigeria. Limnol. Freshw. Biol. 2024, 1276–1283. DOI:10.31951/2658-3518-2024-A-5-1276 [Google Scholar]
- Copatti CE, Fagundes LS, Juliana Q, Copatti BR. Diversity of Aquatic Arthropods on Eichhornia crassipes (Mart.) Solms Roots Before and After Removal of Substrate in a Reservoir in Southern Brazil. 2013. Available online: https://panamjas.org/pdf_artigos/PANAMJAS_8(4)_265-275.pdf (accessed on 12 April 2026).
- Rana R, Ganguly R. Water quality indices: Challenges and applications—An overview. Arab. J. Geosci. 2020, 13, 1190. DOI:10.1007/s12517-020-06135-7 [Google Scholar]
- Uddin MG, Nash S, Rahman A, Olbert AI. A comprehensive method for improvement of water quality index (WQI) models for coastal water quality assessment. Water Res. 2022, 219, 118532. DOI:10.1016/j.watres.2022.118532 [Google Scholar]
- Yan T, Shen SL, Zhou A. Indices and models of surface water quality assessment: Review and perspectives. Environ. Pollut. 2022, 308, 119611. DOI:10.1016/j.envpol.2022.119611 [Google Scholar]
- Ustaoğlu F, Taş B, Tepe Y, Topaldemir H. Comprehensive assessment of water quality and associated health risk by using physicochemical quality indices and multivariate analysis in Terme River, Turkey. Environ. Sci. Pollut. Res. 2021, 28, 62736–62754. DOI:10.1007/s11356-021-15135-3 [Google Scholar]
- Schuijt LM, Peng FJ, van den Berg SJP, Dingemans MML, Van den Brink PJ. (Eco)toxicological tests for assessing impacts of chemical stress to aquatic ecosystems: Facts, challenges, and future. Sci. Total Environ. 2021, 795, 148776. DOI:10.1016/j.scitotenv.2021.148776 [Google Scholar]
- Barasa CN, Simiyu Muse G, Khazenzi JA. Human activities influence on distribution of Ephemeroptera, Plecoptera, and Trichoptera (EPT) in a tropical riverine ecosystem in Kenya. J. Freshw. Ecol. 2025, 40, 2539125. DOI:10.1080/02705060.2025.2539125 [Google Scholar]
- Juvigny‐Khenafou NPD, Piggott JJ, Atkinson D, Zhang Y, Macaulay SJ, Wu N, et al. Impacts of multiple anthropogenic stressors on stream macroinvertebrate community composition and functional diversity. Ecol. Evol. 2021, 11, 133–152. DOI:10.1002/ece3.6979 [Google Scholar]
- Day J, Malan H, Malijani E, Abegunde A. Review: Water quality in non-perennial rivers (with erratum). Water SA 2019, 45, 487–500. DOI:10.17159/wsa/2019.v45.i3.6746 [Google Scholar]
- Samat NA, Yusoff FM, Rasdi NW, Karim M. Enhancement of Live Food Nutritional Status with Essential Nutrients for Improving Aquatic Animal Health: A Review. Animals 2020, 10, 2457. DOI:10.3390/ani10122457 [Google Scholar]
- Dervash MA, Yousuf A, Ozturk M, Bhat RA. Monitoring of Nutrient Pollution in Water. In Phytosequestration: Strategies for Mitigation of Aerial Carbon Dioxide and Aquatic Nutrient Pollution; Dervash MA, Yousuf A, Ozturk M, Bhat RA, Eds.; Springer International Publishing: Cham, Switzerland, 2023; pp. 75–82. DOI:10.1007/978-3-031-26921-9_8 [Google Scholar]
- Nie J, Feng H, Witherell BB, Alebus M, Mahajan MD, Zhang W, et al. Causes, Assessment, and Treatment of Nutrient (N and P) Pollution in Rivers, Estuaries, and Coastal Waters. Curr Pollut. Rep 2018, 4, 154–161. DOI:10.1007/s40726-018-0083-y [Google Scholar]
- Wu J, Lu J. Landscape patterns regulate non-point source nutrient pollution in an agricultural watershed. Sci. Total Environ. 2019, 669, 377–388. DOI:10.1016/j.scitotenv.2019.03.014 [Google Scholar]
- Isiuku BO, Enyoh CE. Pollution and health risks assessment of nitrate and phosphate concentrations in water bodies in South Eastern, Nigeria. Environ. Adv. 2020, 2, 100018. DOI:10.1016/j.envadv.2020.100018 [Google Scholar]
- Tokatlı C. Drinking water quality assessment in villages located in Meriç River Basin (Edirne, Turkey). Sigma J. Eng. Nat. Sci. 2018, 36, 871–886. Available online: https://dergipark.org.tr/en/pub/sigma/issue/65473/1012255 (accessed on 5 January 2026).
- de Vries W, Kros J, Kroeze C, Seitzinger SP. Assessing planetary and regional nitrogen boundaries related to food security and adverse environmental impacts. Curr. Opin. Environ. Sustain. 2013, 5, 392–402. DOI:10.1016/j.cosust.2013.07.004 [Google Scholar]
- Omokunle AB. Ecological Assessment of a Tropical River Using Aquatic Insects Assemblage and Water Quality as Indicators. Entomol. Appl. Sci. Lett. 2023, 10, 1–9. DOI:10.51847/BdyuwBQT5v [Google Scholar]
- Haggag AA, Mahmoud MA, Bream AS, Amer MS. Family Variation of Aquatic Insects and Water Properties to Assess Freshwater Quality in El-Mansouriya Stream, Egypt. Afr. Entomol. 2018, 26, 162–173. DOI:10.4001/003.026.0162 [Google Scholar]
- Hauer FR, Resh VH. Macroinvertebrates. In Methods in Stream Ecology; Academic Press: Cambridge, MA, USA, 2017; Volume 1, pp. 297–319. DOI:10.1016/B978-0-12-416558-8.00015-9 [Google Scholar]
- Apori SO, Giltrap M, Dunne J, Tian F. Assessment of Nitrate and Phosphate Concentrations in Discharge Water from Ditch Networks across Different Peatland Use Types: Implications for Sustainable Peatland Use Management. Sustainability 2024, 16, 6463. DOI:10.3390/su16156463 [Google Scholar]
- Sitote YM, Gebremedhine MG. Comprehensive Review of Eutrophication in Freshwater Ecosystems: Causes, Effects, Assessment, and Management Strategies. 2024. Available online: https://www.preprints.org/frontend/manuscript/e08e5b56533e2aad747fd9435e67ca73/download_pub (accessed on 26 February 2026).
- Villalobos-Jimenez G, Dunn Am, Hassall C. Dragonflies and damselflies (Odonata) in urban ecosystems: A review. Eur. J. Entomol. 2016, 113, 217–232. DOI:10.14411/eje.2016.027 [Google Scholar]
- Vilenica M, Mihaljević Z. Odonata Assemblages in Anthropogenically Impacted Habitats in the Drava River—A Long-Term Study. Water 2022, 14, 3119. DOI:10.3390/w14193119 [Google Scholar]
- Adler PH, Courtney GW. Ecological and Societal Services of Aquatic Diptera. Insects 2019, 10, 70. DOI:10.3390/insects10030070 [Google Scholar]
- Timm H, Haldna M. Do abundance and percentage of dipteran larvae and Oligochaeta indicate low water quality in streams and lake littoral? Oceanol. Hydrobiol. Stud. 2019, 48, 415–429. DOI:10.2478/ohs-2019-0036 [Google Scholar]
- Sharma S, Pandey P, Dave V. Role of aquatic beetles for water quality assessment. Int. J. Recent Sci. Res. 2013, 4, 1673–1676. Available online: https://www.researchgate.net/publication/309133283_Role_of_Aquatic_Beetles_for_Water_Quality_Assessment (accessed on 26 February 2026).
- Pintar MR, Resetarits WJ. Tree leaf litter composition drives temporal variation in aquatic beetle colonization and assemblage structure in lentic systems. Oecologia 2017, 183, 797–807. DOI:10.1007/s00442-017-3813-8 [Google Scholar]
- Ludlam JP, Welsh DP, Clark EV, Downs EL, Gordon ES, Huang JX, et al. Assessing Taxonomic and Functional Responses of Stream Macroinvertebrate Communities to Multi‐Scale Influences of Urban Land Cover. River Res. Appl. 2025, 41, 2297–2308. DOI:10.1002/rra.70045 [Google Scholar]
- Rossaro B, Marziali L, Boggero A. Response of Chironomids to Key Environmental Factors: Perspective for Biomonitoring. Insects 2022, 13, 911. DOI:10.3390/insects13100911 [Google Scholar]
- Meissner AGN. Relating Fluvial Geomorphology to Macroinvertebrate Distribution. Ph.D. Dissertation, University of Saskatchewan, Saskatoon, SK, Canada, 2016. [Google Scholar]
- Silva LFR, Castro DMP, Juen L, Callisto M, Hughes RM, Hermes MG. Functional responses of Odonata larvae to human disturbances in neotropical savanna headwater streams. Ecol. Indic. 2021, 133, 108367. DOI:10.1016/j.ecolind.2021.108367 [Google Scholar]
- Dong B, Geng C, Cai Y, Ji L. Aquatic Coleoptera response to environmental factors of freshwater ecosystems in Changbai Mountain, northeast China. Aquat. Ecosyst. Health Manag. 2014, 17, 171–178. DOI:10.1080/14634988.2014.910441 [Google Scholar]
- Podder R, Nath S, Modak BK, Weltje L, Malakar B. Tube length of chironomid larvae as an indicator for dissolved oxygen in water bodies. Sci. Rep. 2022, 12, 19971. DOI:10.1038/s41598-022-23953-9 [Google Scholar]
- Pimenta PC, Pelli A. The life of dragonflies: Order Odonata. Ciência e Natura 2019, 41, e43. DOI:10.5902/2179460X32305 [Google Scholar]
- Bonacina L, Fasano F, Mezzanotte V, Fornaroli R. Effects of water temperature on freshwater macroinvertebrates: A systematic review. Biol. Rev. 2023, 98, 191–221. DOI:10.1111/brv.12903 [Google Scholar]
- Hamdi R, Zerguine K, Ramdani K. Diversity and distribution of aquatic macroinvertebrates in Lake Tonga and Mekhada Marsh (north-east Algeria) in relation to climate change. Biharean Biol. 2024, 18, 99–114. Available online: https://biozoojournals.ro/bihbiol/cont/v18n2/bb_e241205_Hamdi.pdf (accessed on 2 December 2025).
- Johnson MF, Albertson LK, Algar AC, Dugdale SJ, Edwards P, England J, et al. Rising water temperature in rivers: Ecological impacts and future resilience. WIREs Water 2024, 11, e1724. DOI:10.1002/wat2.1724 [Google Scholar]
- Saç G, Özuluğ O, Ağdamar S, İnci H, Yürekli ÖD, Özuluğ M. Life in Extreme Conditions: Diet and Condition of the Extremophile Fish Aphanius almiriensis (Teleostei: Cyprinodontiformes) in a Thermal Rheocrene Spring. Ecol. Evol. 2025, 15, e71411. DOI:10.1002/ece3.71411 [Google Scholar]
- Rodriguez G, Fikáček M, Minoshima YN, Archangelsky M, Torres PLM. Going underwater: Multiple origins and functional morphology of piercing-sucking feeding and tracheal system adaptations in water scavenger beetle larvae (Coleoptera: Hydrophiloidea). Zool. J. Linn. Soc. 2021, 193, 1–30. DOI:10.1093/zoolinnean/zlaa132 [Google Scholar]
- Wang R, Wang Q, Dong L, Zhang J. Cleaner agricultural production in drinking-water source areas for the control of non-point source pollution in China. J. Environ. Manag. 2021, 285, 112096. DOI:10.1016/j.jenvman.2021.112096 [Google Scholar]