Effect of Carbon Source on Microstructure and Mechanical Properties of Silicon Carbide Fabricated by Two-Step Reaction Sintering

Effect of Carbon Source on Microstructure and Mechanical Properties of Silicon Carbide Fabricated by Two-Step Reaction Sintering
Zhijun Ma 1 Yun Li 2 Xueqin Pan 1 Nanlong Zhang 1 Jianfeng Yang 1,* Bo Wang 1,*
Received: 21 March 2026 Revised: 07 April 2026 Accepted: 21 May 2026 Published: 02 June 2026

© 2026 The authors. This is an open access article under the Creative Commons Attribution 4.0 International License (https://creativecommons.org/licenses/by/4.0/).
1. Introduction
Silicon carbide (SiC) ceramics are critical structural materials for high-temperature and high-stress applications [1,2,3,4], and the pursuit of manufacturing dense, complex-shaped SiC components in a cost-effective manner has driven the development of various sintering techniques. Among these, reaction-bonded silicon carbide (RBSC) processing stands out due to its distinct advantages of a significantly lower sintering temperature, minimal dimensional shrinkage, and the feasibility of producing large, near-net-shape components, which collectively contribute to reduced manufacturing costs [5,6,7,8,9].
Despite this attractive balance of advantages, there are challenges limiting the wider use of RBSC. The RBSC materials usually contain a residual silicon of about 10–20 vol.% in the final microstructure [10,11], which severely degrades the high-temperature strength, creep resistance, and thermal shock behavior of the ceramic composite [12,13]. There is substantial research addressing decreasing the residual silicon content. Firstly, carbon sources can be designed to enhance the Si–C reaction efficiency or convert to Si alloy. Zhang et al. [14] confirmed that carbon-source characteristics strongly affect phase evolution and final properties of RBSC ceramics. Zhong et al. [15] employed TiC as a novel carbon source in the selective laser sintering process; the TiC reacted with liquid silicon to form SiC and TiSi. Park et al. [16] used diamond powder as the primary carbon source, leveraging the significant volume expansion effect when diamond reacts with silicon to form SiC, successfully decreasing residual silicon content below 5 vol%. Furthermore, Shang et al. [17] optimized the gradation ratio of SiC particles of different sizes to increase preform packing density and optimize capillary channels, thereby effectively reducing residual silicon content. Despite these advances, conventional reaction sintering from a single carbon source still remains difficult to further lower the residual Si content, attributed to the premature closure of infiltration channels caused by the formation of in-situ SiC. Secondly, hybrid carbon source systems have also been investigated [18,19]. Compared with conventional single-stage reaction sintering, two-step reactive sintering has emerged as a particularly effective processing route modification for reducing residual silicon in RBSC ceramics. Zhang et al. [20] utilized two-step reactive sintering with nano-carbon black alongside carbon microspheres as active and inert carbon sources, respectively, to prepare high-performance reaction-sintered silicon carbide with residual silicon of 6%, achieving a Vickers hardness of 25.3 GPa and Young’s modulus of 443 GPa. Pan et al. [21] further showed that carbon-source characteristics significantly influence the microstructure and properties of two-step reaction-sintered SiC ceramics. The two-step reactive sintering can involve a first reaction between a highly reactive carbon source and part of the less reactive carbon, together with molten silicon, as in the original reaction sintering, followed by a second reaction between the remaining less reactive carbon and the residual liquid silicon. This staged process not only promotes more complete silicon consumption but also helps prevent premature channel blockage, thereby improving the overall efficiency of the reaction-sintering process [20,21]. Although these studies have verified that residual silicon can be reduced through the above strategy, the specific interplay between carbon source characteristics and the processing requirements of more advanced, slurry-based net-shaping techniques remains inadequately explored and essential for manufacturing complex geometries.
Characteristics and morphology of the active carbon source vary greatly according to their precursors, and have a great influence on the preform formation, reaction behavior, and final microstructure of two-step RBSC ceramics. In this work, RBSC with a low residual Si was fabricated using SiC–C preform by gel casting followed by two-step reaction sintering. Three active carbon sources, such as petroleum coke (PC), carbon microspheres (MC), and nano-carbon black (CB), are used as different activated carbon sources to investigate the effects of the carbon sources on slurry viscosity, preform characteristics, phase evolution after sintering, and the final mechanical properties.
2. Experimental Procedure
2.1. Starting Material
The raw materials used in this study included commercially available α-SiC powder (10 µm, >99% purity, Shanghai Chaowei Nanotechnology Co., Ltd., Shanghai, China) and three distinct carbon sources: nano-sized carbon black (CB, N330, 99.7% purity, Tianjin Tianyishiji Co., Ltd., Tianjin, China), green micro-spherical carbon (MC, 20 µm, >99% purity, Tianjin Eminent Battery Material Co., Ltd., Tianjin, China), and petroleum coke (PC, 20 µm, >99% purity, Tianjin Zhuobang Electronics Co., Ltd., Tianjin, China). Graphitized mesocarbon microbeads (MCMB, 10 µm, >99% purity, Guangzhou Nano Chemistry Technology Co., Ltd., Guangzhou, China) were used as an inert carbon additive. Phenolic resin (PF, 2130, Yuyao Meisheng Plasticization Co., Ltd., Yuyao, China) served as the binder, and ethylene glycol (EG, Tianjin Damao Chemical Reagent Factory Co., Ltd., Tianjin, China) was used as a solvent. Silicon particles (purity > 99%) were employed as the infiltration source.
2.2. Sample Preparation
The starting materials for the slurry included α-SiC, graphitized MCMB, active carbon, phenolic resin, and ethylene glycol with a mass ratio of 43.6:10.3:9.2:18.4:18.4, corresponding to a volume ratio of 23.7:8.9:8.9:29.2:29.2. This composition comes from previous research in our group [20,21], in which residual inert carbon is introduced to eliminate residual Si if volume shrinkage is higher than 24%. Phenolic resin was first dissolved in ethylene glycol homogeneously, and α-SiC powder, graphitized MCMB, and polyethylene glycol (1 wt.% relative to SiC, as dispersant) were added into the solution. Different active carbon powder of CB, MC, or PC was added individually into three batches of the above mixture. The solid loading was 63 wt.% by taking ethylene glycol and phenolic resin as the liquid phase. The mixtures were stirred for 3 h at a speed of 500 rpm. Finally, benzoyl chloride, as a curing agent, was added during continuous stirring for an additional 0.5 h, and the obtained slurries were degassed under vacuum for 1 h. The prepared slurries were poured into molds, and the cast samples were firstly soaked at 80 °C for 3 h, followed by heating to 150 °C at a rate of 0.5 °C·min−1 and holding for 16 h. The cured green bodies were then subjected to carbonization of the phenolic resin, in a horizontal tube furnace under a flowing argon atmosphere with a heating rate of 1.5 °C·min−1 below 600 °C, 1 °C·min−1 from 600 °C to 800 °C, and dwelling at 800 °C for 4 h.
The obtained preforms were placed on a bed of silicon particles within a graphite crucible and sintered in a vacuum furnace. The sintering process comprised two steps: first, heating to 1350 °C and holding for 20 min under vacuum (pressure below 20 Pa); second, the temperature was increased from 1350 °C to 1550 °C at a heating rate of 20 °C/min to allow melting silicon infiltration and reaction with active carbon, and maintaining for 1 h to complete the reaction between silicon and inert carbon, leading to the formation of β-SiC and final densification.
2.3. Characterizations
The structural characteristics of the carbon sources were assessed by laser Raman spectroscopy. The wavelength was 633 nm, and the wave number ranged from 100 cm−1 to 1950 cm−1. The bulk density and open porosity of the preforms and sintered RBSC composites were determined by the Archimedes method using deionized water as the immersion medium. Volumetric shrinkages from slurry to preform were obtained by comparing the density of the preform and the solid density in the slurry, considering the carbonization rate of phenolic resin as 50%. The volume fractions of each solid phase in the preform (V) can be calculated from the volume fractions of the components in the slurry (Vs) and the overall volumetric shrinkage after carbonization (s), i.e., V = Vs/(1 − s). Phase identification was carried out by X-ray diffraction (XRD, X’Pert Pro, PANalytical, Almelo, The Netherlands). Microstructural analysis was conducted using a field-emission scanning electron microscope (Gemini SEM 500, Carl Zeiss, Jena, Germany) operated in both secondary electron (SE) and backscattered electron (BSE) modes. Bending strength was measured via three-point bending tests on bar specimens (3 mm × 4 mm × 36 mm) using a universal testing machine (Instron-1195, Instron, Norwood, MA, USA) with a support span of 36 mm. Vickers hardness was evaluated using a Vickers hardness tester under a load of 9.8 N with a dwell time of 10 s, at least five indentations were performed on each polished sample to obtain an average value.
3. Results and Discussion
3.1. Characteristics of Raw Materials and Preforms
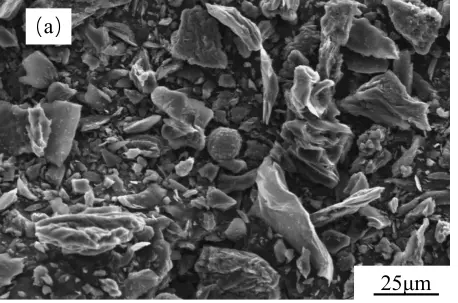
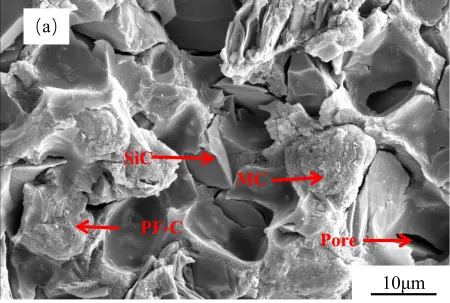
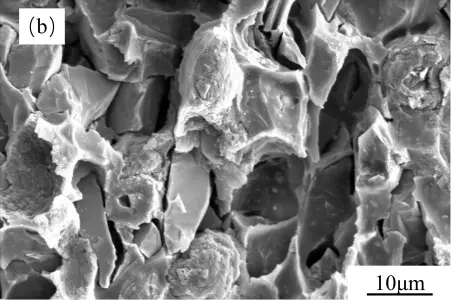
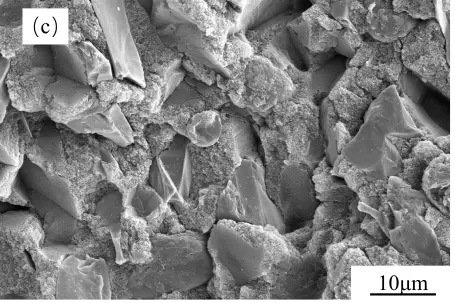
Figure 1 presents the SEM morphologies of the three carbon powders used as active carbon sources. As shown in Figure 1a, PC powder exhibited an ununiform and irregular morphology. The particles appeared as angular fragments or blocks with rough surfaces, exhibiting significant aggregation and a broad particle size distribution. Although such a morphology may lead to a less regular packing structure, the relatively large particle size and low specific surface area are expected to result in weaker particle–particle interactions and a lower slurry viscosity. In contrast, the MC particles (Figure 1b) displayed a relatively uniform spherical morphology, and their smaller particle size may increase interparticle interactions and flow resistance compared with the coarse PC particles. Figure 1c revealed that CB primarily consisted of large, dense aggregates formed by the nano-sized particles. However, in the slurry, these aggregates were split into individual nano-sized particles with extremely high specific surface area, which were expected to dominate the rheological behavior of the slurry. Due to the different precursors, the carbon atoms follow completely different nucleation and growth pathways, leading to differences in the morphology of the three carbon materials [22,23]. PC is derived from petroleum-based components [24], MC is derived from biomass and its derivatives [22], and CB is derived from natural gas [23].
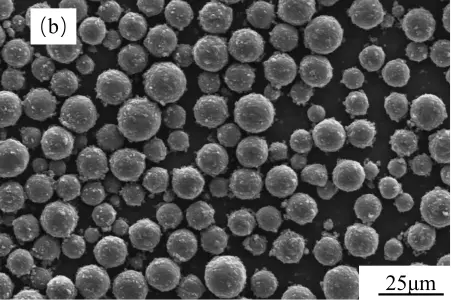
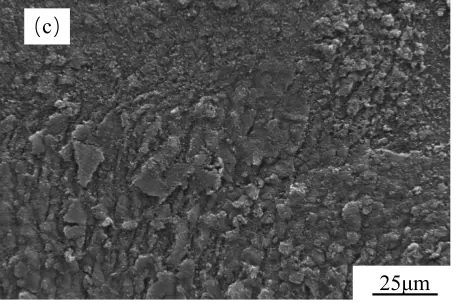
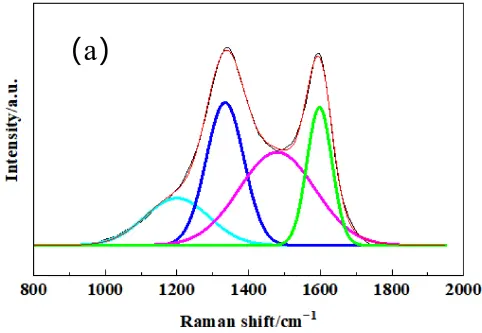
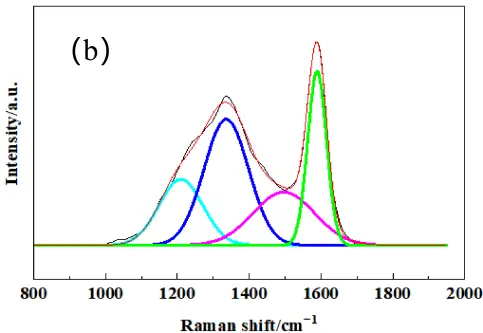
To further quantify the structural order of the different active carbon materials, laser Raman spectroscopy was performed. The laser Raman spectrum after peak fitting is shown in Figure 2. Two characteristic bands were exhibited in the spectra for all samples, and the D-band at approximately 1350 cm−1 associated with disordered carbon or defects, and the G-band at around 1580 cm−1 corresponded to the in-plane vibration of sp2-bonded carbon atoms in a graphite crystal. All three types of carbon showed obvious D-bands, indicating strong amorphous carbon structure and high reaction activity of the carbon sources, indicating that they were suitable for active carbon.
The graphitization degree can be estimated by the integral intensity ratio R (AD/AG), which indicates a lower R value indicating higher structural order [25]. In order to accurately obtain the intensity, area and position of the D peak and G peak, the Gauss model is used to fit the Raman spectrogram of carbon materials. From the fitted Raman spectrogram, the peak area, FWHM, and maximum height of the D peak and G peak were obtained. Notably, all three carbon sources exhibited broad D-bands, indicating a high degree of structural disorder and low crystallinity, indicating higher disorder and more abundant reactive sites, which implied they could be used as activated carbon sources. As summarized in Table 1, PC possessed the highest degree of graphitization, while CB was the most disordered, which may be correlated with the carbon source as PC is from petroleum coke, and CB is from natural gas.
 |
 |
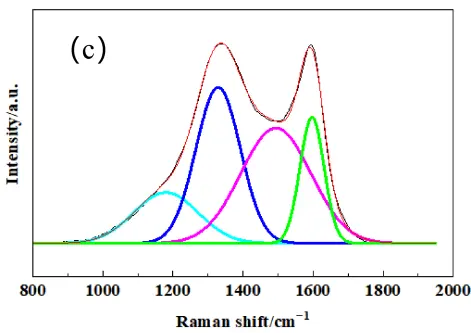 |
Figure 2. The fitted Laser Raman spectrogram pattern of raw carbon powders of (a) PC, (b) MC, (c) CB. The colored lines represent the deconvoluted individual peaks: cyan for sp3 hybridized carbon, blue for D−band, pink for sp2 hybridized carbon, and green for G−band.
Table 1. Graphitization degree results from Raman spectra of raw carbon materials.
|
Carbon Material |
Peak Area (D) |
FWHM /cm−1 (D) |
Maximum Height (D) |
Peak Area (G) |
FWHM /cm−1 (G) |
Maximum Height (G) |
R (AD/AG) |
|---|---|---|---|---|---|---|---|
|
PC |
155,839 |
123 |
1181 |
99,996 |
82 |
1142 |
1.55 |
|
MC |
143,496 |
146 |
922 |
83,481 |
61 |
1273 |
1.71 |
|
CB |
186,565 |
149 |
1169 |
81,351 |
80 |
944 |
2.29 |
Figure 3 illustrates the viscosity of slurries prepared with different active carbon sources. The slurry using CB exhibited the highest viscosity, which could be attributed to its exceptionally high specific surface area, small particle size, and strong particle–particle interaction. These characteristics increase the amount of liquid absorbed on the particle surfaces and enhance interparticle friction, thereby increasing the flow resistance of the slurry. The vast surface area of CB particles led to a significant increase in the internal friction and flowing resistance within the slurry. Conversely, the slurry with PC, which had the largest particle size and the lowest specific surface area, had the lowest viscosity. These results indicate that the carbon source characteristics not only affect slurry flowability but may also influence the packing behavior and structural uniformity of the preform formed during gelcasting.
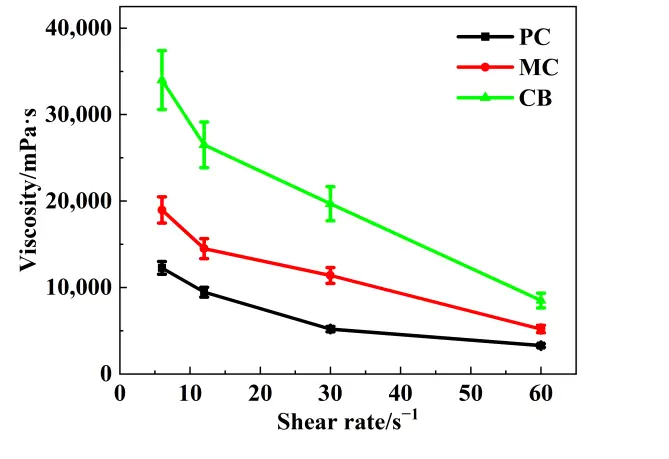
Figure 4 shows SEM images of the preforms with different active carbon powders. In all samples, no obvious pores were present, indicating that the pyrolyzed carbon from phenolic resin filled the space among the starting SiC and carbon particles. In the PC-derived preform (Figure 4a), the SiC particles and carbon phases were interwoven, with pyrolyzed carbon filling the gaps irregularly. However, some local carbon networks could be observed. Obviously large-particle pull-out sites can be observed on the fracture surface, suggesting that the coarse PC particles were detached during fracture. This behavior may be related to the large particle size of PC, because the phenolic resin was adsorbed onto and around these coarse particles, occupying a relatively larger local space. During curing and carbonization, the shrinkage of the resin was therefore more likely to be constrained by the rigid particle framework, leading to a less synchronous contraction of the matrix and a higher tendency for interfacial debonding. The preform derived from MC (Figure 4b) showed improved microstructure uniformity. The carbon phase was dispersed in island-like manner within the SiC skeleton, and the SiC particles appeared to have a more uniform distribution and closer packing. Although the MC-derived preform still exhibited several pull-out traces, these features were less pronounced than those in the PC-derived sample, indicating that the shrinkage of resin was somewhat less constrained and the packing state was more uniform. For the preforms with large active particles like PC and MC, some cracks were clearly demonstrated, attributed to the shrinkage of phenolic resin curing and carbonization. Most notably, from the preform derived from CB (Figure 4c), the proportion of the SiC and inert carbon particle skeleton appeared lowest, while the active nano-sized carbon black particles were mixed with the pyrolyzed carbon and distributed in a continuous pattern. The SiC and inert carbon particles formed a non-interconnected network, resulting in a large shrinking capacity during the curing and carbonization of the phenolic resin. As a result, fewer particle pull-out sites were observed on the fracture surface, suggesting that the resin-derived carbon contracted more synchronously with the surrounding fine particles.
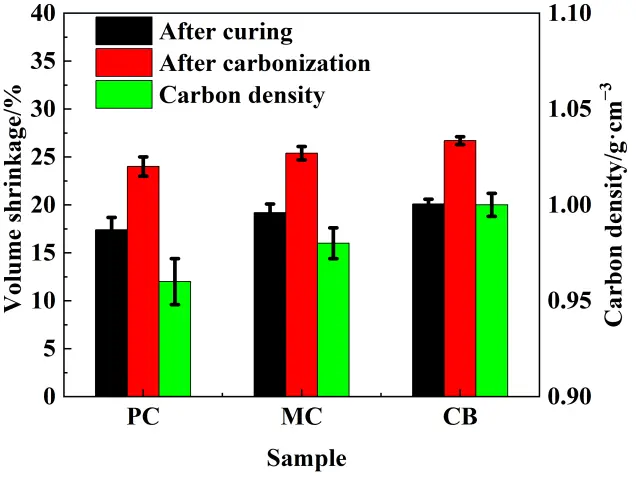
The preform microstructure is consistent with the quantitative analysis of the green bodies as presented in Table 2 and Figure 5. The shrinkages during the curing and carbonization were possibly influenced by the different active carbon sources. The volumetric shrinkage from slurry to carbonized preform varied within a narrow range, in a range of 24–27%, however, the CB-derived preform achieved the highest green density (1.72 g·cm−3) and the lowest pore volume fraction (31%), suggesting a more efficient packing and consolidation of the slurry during gelation and pyrolysis. Carbon density of each preform was calculated based on volumetric shrinkage, which was defined as the mass of carbon derived from the starting powder per unit volume of the preform. The high carbon density facilitated greater consumption of the infiltrated silicon, with some inert carbon remaining. Although the CB slurry exhibited the highest viscosity, it underwent the greatest shrinkage during curing and pyrolysis. This is consistent with the findings of Zhang et al. [26], in which a more stable coarse-particle skeleton resulted in lower shrinkage, while a reduced coarse-particle volume fraction led to increased volumetric shrinkage. This behavior may be associated with the finer particle characteristics and more homogeneous dispersion of the CB source, which favored the formation of a denser and more uniform preform architecture. This dense, homogeneous preform architecture, rich in finely distributed reactive carbon (CB), was poised to create optimal conditions for subsequent silicon infiltration and uniform residual Si distribution during the first step reaction during the sintering. Such a Si distribution was favorable for the second step reaction and contributed to the decrease of the final residual Si content.
Table 2. Volume fraction of each component in the preform prepared by different active carbon sources.
|
Sample |
Active Carbon /vol.% |
Resin Carbon /vol.% |
Inert Carbon (vi) /vol.% |
SiC (vSiC) /vol.% |
Porosity (p) /% |
ρpreform /g·cm−3 |
|---|---|---|---|---|---|---|
|
PC |
11.8 ± 0.19 |
11.8 ± 0.19 |
11.8 ± 0.16 |
31.3 ± 0.42 |
33.3 ± 0.89 |
1.66 ± 0.022 |
|
MC |
12.0 ± 0.11 |
12.0 ± 0.11 |
12.1 ± 0.12 |
31.8 ± 0.30 |
32.1 ± 0.64 |
1.69 ± 0.016 |
|
CB |
12.1 ± 0.08 |
12.1 ± 0.08 |
12.3 ± 0.08 |
32.4 ± 0.21 |
31.1 ± 0.46 |
1.72 ± 0.011 |
3.2. Microstructure of RBSC Samples
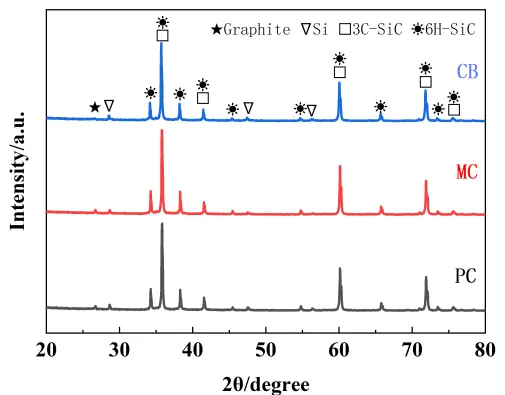
The XRD patterns of the RBSC composites prepared with different carbon sources are presented in Figure 6. All the patterns confirmed the presence of three crystalline phases: residual silicon (Si), residual carbon (C), and silicon carbide (SiC). The SiC phase consisted of both the original α-SiC (from the raw powder) and the newly in-situ formed β-SiC from the reaction between molten silicon and the carbon source during sintering. Notably, the diffraction peaks corresponding to residual silicon exhibited similar low intensities across all three samples, indicating considerably lower Si contents than those typically observed in conventional reaction-bonded silicon carbide ceramics. This suggested that the first reaction between Si and active carbon occurred, in which additional silicon was consumed through a secondary reaction with inert carbon, effectively reducing the residual silicon content.
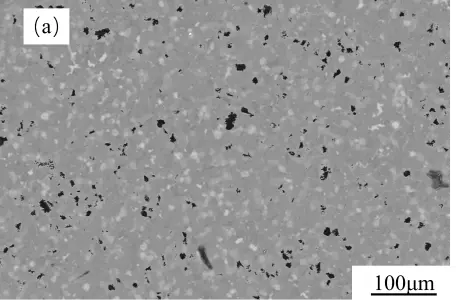
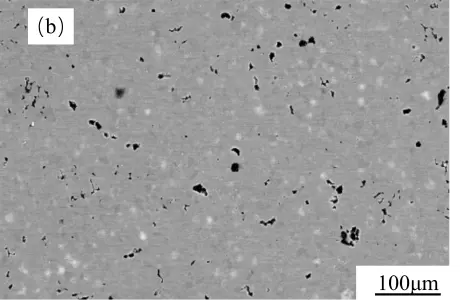
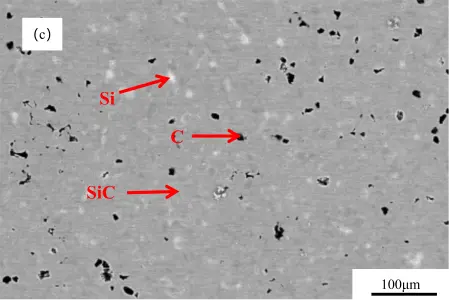
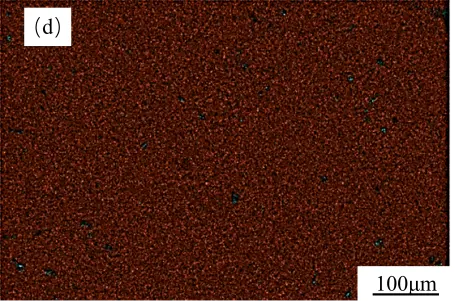
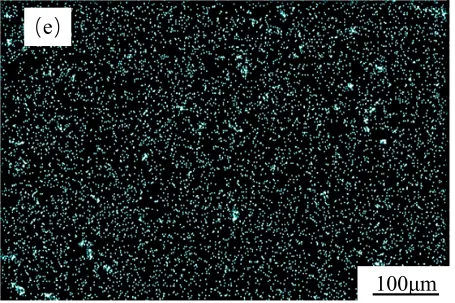
Backscattered electron (BSE) images of the polished surfaces of the obtained samples and EDS elemental mapping images of the CB sample are presented in Figure 7. It revealed the phase distribution based on atomic number contrast: dark gray SiC, bright white residual Si, and black residual carbon. In the PC-derived composite (Figure 7a), residual carbon appeared as large, irregular blocks or flakes, while residual silicon was present as extensive bright white regions, which suggests a less uniform carbon distribution and incomplete local reaction. This is related to the relatively coarse PC particles in the preform, which can lead to a more uneven distribution of active carbon after carbonization. The MC-derived composite (Figure 7b) exhibited more regular, quasi-spherical residual carbon and visibly reduced residual silicon. The CB-derived composite (Figure 7c) showed the most homogeneous microstructure, with minimal residual carbon and silicon, which can be attributed to its higher carbon density and lower porosity. In the CB preform, fine carbon black particles were adsorbed onto the resin-derived carbon, resulting in a more continuous carbon distribution. This means that, during silicon infiltration, the carbon phase could contact Si more sufficiently and react more completely, thereby reducing the residual Si content. This denser preform provides more active carbon per unit volume and a more effective pore network for silicon infiltration, allowing more free silicon to be consumed during the reaction process and thereby reducing the residual Si content.
 |
 |
 |
 |
 |
 |
Figure 7. SEM backscattering pictures of polished surfaces of RBSC with different carbon sources: (a) PC, (b) MC, (c) CB. EDS elemental mapping images of the CB sample: (d) Overlay, (e) C, (f) Si.
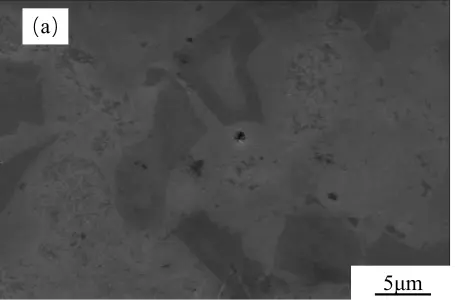
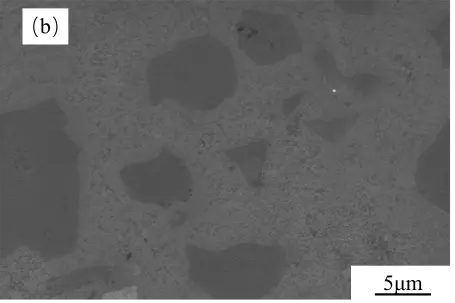
Higher-magnification secondary electron (SE) images (Figure 8) provide further insight into the morphology of the SiC phases. In the PC-derived composite (Figure 8a), the newly formed β-SiC appeared as coarse, irregular aggregates surrounding the original polygonal α-SiC grains, resulting in a rough surface with poorly defined boundaries. In contrast, the MC-derived composite (Figure 8b) exhibited more discrete spherical or nodular β-SiC aggregates that effectively bridged the α-SiC particles, forming a moderately continuous network with a smoother texture. For the CB-derived composite (Figure 8c), the extremely fine and highly reactive carbon source promoted the formation of a very fine-grained and uniform β-SiC phase. This β-SiC seamlessly filled the interstices between the α-SiC skeleton particles, yielding a dense and homogeneous matrix free of discernible large β-SiC grains or distinct phase boundaries. This microstructural evolution correlated directly with the carbon source characteristics: the finer and more uniformly distributed the reactive carbon, the more homogeneous the SiC formation.
 |
 |
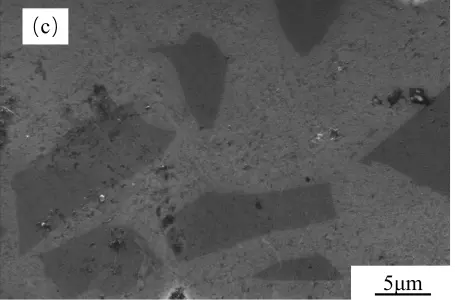 |
Figure 8. SEM secondary electronic pictures of polished surfaces of RBSC with different carbon sources. (a) PC, (b) MC, (c) CB.
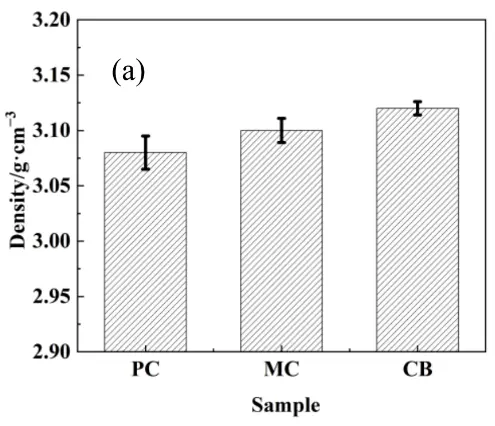
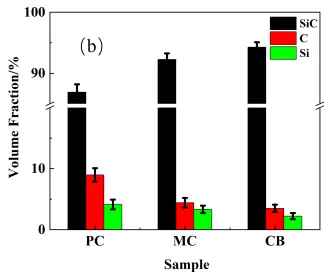
For the reaction bonding sintering of SiC, the reaction between the carbon and molten Si leads to volume expansion that fills in the original pores, increasing in the SiC content, and decreasing the porosity. The volume expansion for the active and inert carbon is 1.87 and 2.08, respectively, considering their different densities [21]. Based on the phase fractions in the preform (Table 2) and the measured sintered density, the volume fractions of SiC, residual carbon, and residual silicon in the RBSC composites and inert carbon source reaction rate were calculated using Equation (1), Equation (2), Equation (3) and Equation (4), and the results are shown in Figure 9. The CB sample possessed the highest density and SiC phase content, with the lowest residual silicon content. Conversely, the PC sample exhibited the lowest density and SiC content, with the highest residual silicon. This variation correlated with the microstructural observations of the preform and sintered samples. For the PC composite, the high residual carbon and Si content arose primarily from the high content of infiltrated liquid Si due to its high porosity. Furthermore, the wide particle size distribution resulted in the incomplete reaction of larger PC particles, which served as an additional inert carbon source. For the PC and MC samples, the coarse pore structure resulted in the heterogeneous distribution of infiltrated silicon, leaving substantial residual silicon in the sintering body due to enhanced distance between Si and inert carbon. The residual carbon primarily consisted of unreacted carbon microspheres for the MC and CB samples, however, the relatively larger MC particle size compared with CB resulted in less uniform silicon distribution during infiltration, thereby limiting secondary reaction efficiency. Coupled with its high reactivity and uniform silicon infiltration, these characteristics promoted relatively complete reaction and efficient silicon consumption for the CB sample, both facilitating the maximization of SiC formation. As the residual Si contents were correlated with the porosity of the preform, it was meaningless to compare them directly; instead, a reaction rate for inert carbon was introduced by comparing the volume contents of inert carbon in the preform and the sintering bodies. As shown in Figure 9c, the CB sample exhibited the highest reaction rate, indicating that it underwent the most complete reaction with molten Si during the second step sintering, attributed to the relatively fine dispersion of residual Si after the first step sintering. Thus, selecting an active carbon source with fine particle size and good dispersibility promotes both the first-stage and secondary reactions, leading to superior phase composition.
|
```latex{V}_{SiC}={v}_{SiC}+{v}_{A}×1.87+{v}_{i}×\alpha ×2.08``` |
(1) |
|
```latex{V}_{inert \,carbon}={v}_{i}×\left(1-\alpha \right)``` |
(2) |
|
```latex{V}_{Si}=p-{v}_{A}×0.87+{v}_{i}×\alpha ×1.08``` |
(3) |
|
```latex{\text{ρ}}_{\mathrm{R}\mathrm{B}\mathrm{S}\mathrm{C}}={V}_{SiC}×3.21+{V}_{inert\, carbon}×2.0+{V}_{Si}×2.33``` |
(4) |
where $${V}_{SiC}$$, $${V}_{inert\, carbon}\, \mathrm{a}\mathrm{n}\mathrm{d}\,{ V}_{Si}$$ represent the Volume fraction of SiC, inert carbon, and Si in RBSC, respectively, and $${v}_{SiC}$$, $${v}_{i} \,\mathrm{a}\mathrm{n}\mathrm{d}$$ $$p$$ represent the Volume fraction of SiC, inert carbon, and pore in the preform, respectively, and vA is the sum of the volume fraction of active carbon and resin carbon in the preform. Here, $${\text{ρ}}_{\mathrm{R}\mathrm{B}\mathrm{S}\mathrm{C}}$$ represents the density of RBSC$$,\,\mathrm{ }\mathrm{a}\mathrm{n}\mathrm{d}\mathrm{ }\,\text{α}$$ represents the reaction rate of inert carbon.
 |
 |
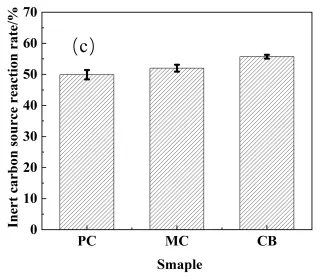 |
Figure 9. Density and phase volume fraction of the RBSC with different active carbon sources. (a) Density, (b) Phase volume fraction, (c) Inert carbon source reaction rate.
3.3. Mechanical Properties of RBSC Samples
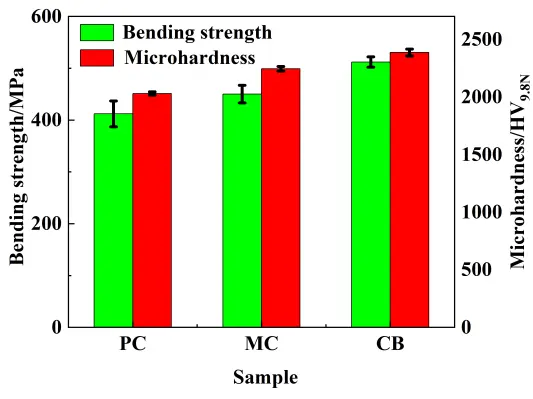
The bending strength and Vickers hardness of the RBSC composites are presented in Figure 10. The strength increased in the order: PC (412 ± 25 MPa) < MC (450 ± 17 MPa) < CB (512 ± 10 MPa). This trend was in perfect agreement with the previous microstructural evolution. The superior strength of the CB-derived composite could be attributed to a combination of factors stemming from its optimized phase composition and refined microstructure. Residual silicon and carbon have significantly lower mechanical strength, and the CB-derived composite inherently possesses a higher intrinsic strength potential.
The Vickers hardness results followed the same ranking as the bending strength. SiC is the hardest constituent in the RBSC materials; therefore, the highest Vickers hardness was achieved in the CB-derived composite, as its maximal SiC phase content. The lower Vickers hardness of the PC composite was attributed to its higher content of soft residual silicon and carbon, which provided easier paths for indenter penetration.
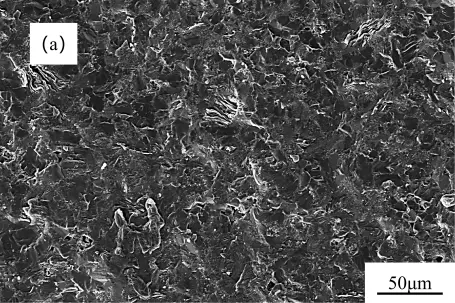
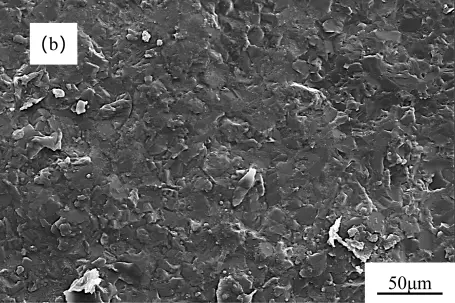
The fracture surfaces of the RBSC composites were examined to understand their failure mechanisms, as shown in Figure 11. The PC-derived composite (Figure 11a) exhibited a rough and uneven fracture surface with widespread particle pull-out and interfacial debonding. This fracture morphology indicated weak interfacial bonding, which accounted for its low bending strength and Vickers hardness. In contrast, the CB-derived composite (Figure 11c) exhibited the smoothest fracture surface, characterized by well-defined grain boundaries and minimal secondary phase spalling, indicating strong interfacial bonding, and superior bending strength and Vickers hardness. As reported by Zhou et al. [27], residual silicon or carbon tends to destroy the uniform microstructure of the sintered body, and the presence of Si band regions disrupts the connectivity stability between large and small SiC particles. These findings are consistent with our observations. Among the three composites, the CB sample possesses the lowest residual Si and residual carbon contents, which correspondingly exhibit the smoothest fracture surface and superior mechanical properties.
 |
 |
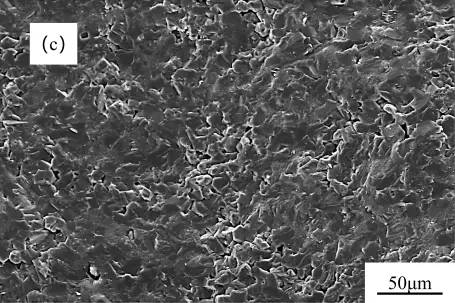 |
Figure 11. SEM images of RBSC fracture surfaces with different carbon sources: (a) PC, (b) MC, (c) CB.
4. Conclusions
Effects of three active carbon sources (petroleum coke-PC, carbon microspheres-MC, and nano-carbon black-CB) on the processing behavior, microstructure, phase evolution, and properties of two-step reaction-bonded silicon carbide (RBSC) ceramics were systematically investigated. The processing behavior and final phase composition of the RBSC are influenced by the active carbon sources used. Due to its high specific surface area and strong adsorption capacity, nano-carbon black (CB) resulted in slurry with high viscosity and larger shrinkage, attributed to its high specific surface area and shrinkage of the preform. This behavior facilitated the formation of a denser and more homogeneous carbon distribution in the preform. The uniform distribution of reactive carbon mixture of CB and pyrolyzed phenolic resin shortened the diffusion distance of molten silicon and improved the accessibility of the reaction interface leading to the most complete second reaction, producing RBSC composites with the highest SiC phase content and the lowest residual carbon and silicon content. In addition, the CB-derived sample exhibited the highest inert carbon source reaction rate, indicating the most efficient secondary reaction among the three carbon sources. This confirms that the two-step sintering strategy is most effective when combined with a well-dispersed, high-activity carbon source like CB. The superior mechanical properties are a direct consequence of the optimized phase composition and microstructure. For the CB-derived RBSC composite, a bending strength of 512 MPa and a Vickers hardness of 2386.6 HV are achieved, benefiting from its high SiC content, as well as the low residual silicon and low residual carbon contents. Overall, the results demonstrate that the particle size, specific surface area, and dispersion behavior of the carbon source play a decisive role in regulating slurry rheology, preform structure, reaction completeness, and final properties of RBSC ceramics.
Statement of the Use of Generative AI and AI-Assisted Technologies in the Writing Process
During the preparation of this manuscript, the author(s) used DeepSeek to improve the language and readability of the text. All content was carefully reviewed and revised by the authors, who take full responsibility for the final content of the manuscript.
Author Contributions
Z.M.: Conceptualization, Methodology, Software, Data curation, Writing—original draft, Visualization, Investigation, Writing—review and editing. Y.L.: Funding acquisition, Writing—review and editing. X.P.: Validation, Resources. N.Z.: Investigation, Validation. J.Y.: Project administration, Funding acquisition, Supervision, Writing—review and editing. B.W.: Project administration, Funding acquisition, Supervision, Writing—review and editing. All authors have read and agreed to the published version of the manuscript.
Ethics Statement
Not applicable.
Informed Consent Statement
Not applicable.
Data Availability Statement
The original contributions presented in this study are included in the article. Further inquiries can be directed to the corresponding authors.
Funding
This work was supported by the Shaanxi Innovation Capacity Support Program (Science and Technology Innovation Team, 2025RS-CXTD-027), Youth Innovation Team Project of Shaanxi Universities (23JP073), Key Research and Development Program of Shaanxi (No. 2024PT-ZCK-04), Shaanxi Province Qin Chuang Yuan “Scientist+Engineer” Team Construction Project (Nos. 2024QCY-KXJ-120, 2024QCY-KXJ-117).
Declaration of Competing Interest
The authors declare that they have no known competing financial interests or personal relationships that could have appeared to influence the work reported in this paper.
References
-
Yoshida K, Mukai H, Imai M, Hashimoto K, Toda Y, Hyuga H, et al. Reaction sintering of two-dimensional silicon carbide fiber-reinforced silicon carbide composite by sheet stacking method. J. Nucl. Mater. 2007, 367–370, 769–773. DOI:10.1016/j.jnucmat.2007.03.084 [Google Scholar]
-
He XL, Zhou Y, Jia D, Guo Y. Effect of sintering additives on microstructures and mechanical properties of short-carbon-fiber-reinforced SiC composites prepared by precursor pyrolysis–hot pressing. Ceram. Int. 2006, 32, 929–934. DOI:10.1016/j.ceramint.2005.07.007 [Google Scholar]
-
Chai W, Deng YF, Wang YY, Li Z, Yuan JL. Application Status of SiC Ceramics. Light Ind. Mach. 2012, 30, 117–120. DOI:10.3969/j.issn.1005-2895.2012.04.031 [Google Scholar]
-
Davim JP. Ceramic Matrix Composites: Materials, Manufacturing and Engineering; De Gruyter: Berlin, Germany, 2016. [Google Scholar]
-
Guo SW, Zhang GY, Li LB, Wang WY, Zhao XZ. Effect of materials and modelling on the design of the space-based lightweight mirror. Mater. Des. 2009, 30, 9–14. DOI:10.1016/j.matdes.2008.04.056 [Google Scholar]
-
Wang YX, Tan SH, Jiang DL. The effect of porous carbon preform and the infiltration process on the properties of reaction-formed SiC. Carbon 2004, 42, 1833–1839. DOI:10.1016/j.carbon.2004.03.018 [Google Scholar]
-
Xu SJ, Qiao GJ, Li DC, Yang H, Liu Y, Lu TJ. Reaction forming of silicon carbide ceramic using phenolic resin derived porous carbon preform. J. Eur. Ceram. Soc. 2009, 29, 2395–2402. DOI:10.1016/j.jeurceramsoc.2009.01.022 [Google Scholar]
-
Singh M, Behrendt DR. Microstructure and mechanical properties of reaction-formed silicon carbide (RFSC) ceramics. Mater. Sci. Eng. A 1994, 187, 183–187. DOI:10.1016/0921-5093(94)90346-8 [Google Scholar]
-
Luo ZH, Jiang DL, Zhang JX, Lin QL, Chen ZM, Huang ZR. Preparation of reaction-bonded silicon carbide with well controlled structure by tape casting method. Ceram. Int. 2012, 38, 2125–2128. DOI:10.1016/j.ceramint.2011.10.053 [Google Scholar]
-
Ness JN, Page TF. Microstructural evolution in reaction-bonded silicon carbide. J. Mater. Sci. 1986, 21, 1377–1397. DOI:10.1007/BF00553278 [Google Scholar]
-
Tong YG, Bai SX, Liang XB, Qin QH, Zhai JT. Reactive melt infiltration fabrication of C/C-SiC composite: Wetting and infiltration. Ceram. Int. 2016, 42, 17174–17178. DOI:10.1016/j.ceramint.2016.08.007 [Google Scholar]
-
Chakrabarti OP, Ghosh S, Mukerji J. Influence of grain size, free silicon content and temperature on the strength and toughness of reaction-bonded silicon carbide. Ceram. Int. 1994, 20, 283–286. DOI:10.1016/0272-8842(94)90042-6 [Google Scholar]
-
Esfehanian M, Guenster J, Juergen JG, Horvath J, Koch D, Grathwohl G. High-temperature mechanical behavior of carbon–silicide–carbide composites developed by alloyed melt infiltration. J. Eur. Ceram. Soc. 2008, 28, 1267–1274. DOI:10.1016/j.jeurceramsoc.2007.09.053 [Google Scholar]
-
Zhang XF, Chen D, Gu HZ, Huang A, Fu LP. Effects of carbon sources on properties of reaction-bonded silicon carbide. Bull. Chin. Ceram. Soc. 2024, 43, 312–316+353. DOI:10.16552/j.cnki.issn1001-1625.2024.01.021 [Google Scholar]
-
Zhong T, Lei L, Zhang Z, Hu D, Zhang J. Preparation of high-strength silicon carbide by SLS-RS. Mater. Sci. Eng. A 2024, 914, 147114. DOI:10.1016/j.msea.2024.147114 [Google Scholar]
-
Park JH, Kim DJ, Kim SW, Youm MR, Nahm S, Park SW. Effects of diamond as a main carbon source on the fabrication and mechanical properties of reaction-bonded SiC. Ceram. Int. 2024, 50, 35169–35177. DOI:10.1016/j.ceramint.2024.06.325 [Google Scholar]
-
Shang J, Ma Y, Liu Y, Chen J, Cao Y, Pan Y, et al. Optimizing capillary channels via particle distribution to fabricate low-residual-silicon reaction-bonded SiC composites. Ceram. Int. 2026, 52, 2591–2605. DOI:10.1016/j.ceramint.2025.12.077 [Google Scholar]
-
Li W, Cui C, Li S, Zhang G, Jin B, Bao J, et al. Vat photopolymerization of large-aperture high performance SiC mirror through multiphase carbon infiltration modification. Addit. Manuf. 2024, 85, 104160. DOI:10.1016/j.addma.2024.104160 [Google Scholar]
-
Dong HL, Qin SN, Xie HH, Liu P, Liu ZY, Yang XF. Application of compound carbon sources in additive manufacturing of high strengths reaction bonded SiC ceramics by fused deposition modeling method. J. Eur. Ceram. Soc. 2025, 45, 117675. DOI:10.1016/j.jeurceramsoc.2025.117675 [Google Scholar]
-
Zhang NL, Yang JF, Deng YC, Wang B, Yin P. Preparation and properties of reaction bonded silicon carbide (RB-SiC) ceramics with high SiC percentage by two-step sintering using compound carbon sources. Ceram. Int. 2019, 45, 15715–15719. DOI:10.1016/j.ceramint.2019.04.224 [Google Scholar]
-
Pan XL, Zhang MJ, Wang B, Yang JF. Influence of the inert carbon source on the microstructure and properties of two-step reaction-sintered silicon carbide ceramics. J. Funct. Mater. 2025, 56, 230–236. DOI:10.3969/j.issn.1001-9731.2025.01.023 [Google Scholar]
-
Kan YN, Chen BW, Zhai SC, Mei CT. Effect of Carbon Source Composition on Morphology and Spectral Characteristics of Carbon Microspheres. Spectrosc. Spectr. Ana. 2020, 40, 3153–3160. DOI:10.3964/j.issn.1000-0593(2020)10-3153-08 [Google Scholar]
-
Wang WW, Huang YY, Xu Y, Hong RY. Research Progress on Process and Equipment of Conductive Carbon Black Prepared by Plasma Method. China Powder Sci. Technol. 2018, 24, 52–59. DOI:10.13732/j.issn.1008-5548.2018.02.009 [Google Scholar]
-
Ma WW, Hao TY. Separation and Analysis of Soluble Organic Matter from Petroleum Coke. Shandong Chem. Ind. 2019, 48, 117–120+128. DOI:10.19319/j.cnki.issn.1008-021x.2019.19.046 [Google Scholar]
-
Cuesta A, Dhamelincourt P, Laureyns J, Martínez-Alonso A, Tascón JMD. Raman microprobe studies on carbon materials. Carbon 1994, 32, 1523–1532. DOI:10.1016/0008-6223(94)90148-1 [Google Scholar]
-
Zhang MJ, Ma ZJ, Pan XQ, Li Y, Zhang NL, Xue JX, et al. Electromagnetic Interference Shielding Effectiveness of Pure SiC-Ti3SiC2 Composites Fabricated by Reactive Melt Infiltration. Materials 2025, 18, 157. DOI:10.3390/ma18010157 [Google Scholar]
-
Zhou YB, Sha WH, Liu YY, Lyu YN, Huang YH. Influence of Carbon Source on Microstructural and Mechanical Properties of High-Performance Reaction-Bonded Silicon Carbide. Materials 2022, 15, 5250. DOI:10.3390/ma15155250 [Google Scholar]