Effects of Drying Time, Ultrasonic Vibration Intensity, and Target Powder Bed Temperature on Subsystem-Level Energy Consumption in Binder Jetting Additive Manufacturing

Effects of Drying Time, Ultrasonic Vibration Intensity, and Target Powder Bed Temperature on Subsystem-Level Energy Consumption in Binder Jetting Additive Manufacturing

Received: 12 March 2026 Revised: 02 April 2026 Accepted: 11 May 2026 Published: 19 May 2026

© 2026 The authors. This is an open access article under the Creative Commons Attribution 4.0 International License (https://creativecommons.org/licenses/by/4.0/).
1. Introduction
Binder jetting additive manufacturing prints objects layer by layer by jetting a liquid binder from a printhead onto selected regions of a powder bed [1,2,3]. It is particularly suitable for fabricating ceramic components with internal channels and tailored porosity, which are difficult to achieve with conventional manufacturing methods [4,5,6]. These ceramic components are often needed in such industries as energy and aerospace [7].
For hopper-based binder jetting printers, several subsystems, such as the drying unit and the ultrasonic vibration-assisted powder hopper, consume more energy than other subsystems. The drying unit (typically an infrared lamp) provides localized heating after the binder is jetted onto selected regions of a powder layer, to cause the solvent present in the binder to evaporate, preventing excessive spreading of the binder into the surrounding powder, and ensuring that the printed part can support subsequent layers [8,9]. Drying time is defined as the period during which the drying unit is in operation over the powder bed [10]. The ultrasonic vibration-assisted powder hopper (henceforth referred to as ultrasonic hopper) generates high-frequency mechanical vibrations, driven by a piezoelectric actuator that converts electrical energy into mechanical motion, to facilitate desired powder dispensing onto the powder bed [11]. Ultrasonic vibration intensity represents the intensity of these vibrations and is expressed as a percentage of the hopper’s maximum vibration capacity [11]. The powder bed maintains an elevated temperature during printing to promote binder spreading and improve the bonding between powder particles [12,13]. The target powder bed temperature is defined as the desired temperature for the powder bed. An infrared temperature sensor monitors the temperature of the powder bed surface. The printer then adjusts the power output of the drying unit accordingly to achieve the target powder bed temperature [14,15]. Understanding the effects of these subsystems on energy consumption is essential for assessing environmental impact, identifying opportunities to improve hardware design, and reducing operational costs.
Table 1 lists reported studies investigating the effects of drying conditions and ultrasonic hopper parameters on various response variables in binder jetting.
Table 1. Reported studies on the effects of drying time, ultrasonic vibration intensity, or target powder bed temperature on response variables other than energy consumption.
The effects of these process parameters on energy consumption in binder jetting remain unexplored. Moreover, no published work has addressed the effects of target powder bed temperature on energy consumption. Only two reported studies have assessed the energy consumption of binder jetting, both proposing models to predict energy consumption as process parameters change. Meteyer et al. (2014) developed an energy consumption model for life-cycle inventory analysis, and their study was based on the MLab binder jetting printer (ExOne, North Huntington, PA, USA) [10]. In a subsequent study, the same group (2015) proposed a method to predict the energy consumption of binder jetting depending on part geometry and process parameters [18]. However, experimental studies on energy consumption for specific commercial binder jetting printers remain relatively scarce in the literature. Because different binder jetting printers vary in architecture, the effects of process parameters on energy consumption can differ substantially between printers. Consequently, detailed experimental studies on individual systems remain important for understanding subsystem-level energy consumption and identifying opportunities for optimization. The present work contributes to this area by investigating energy consumption data for a representative laboratory-scale binder jetting printer. Specifically, this study provides an experimental investigation regarding the effects of key process parameters, namely drying time, ultrasonic vibration intensity, and target powder bed temperature, on subsystem-level energy consumption of Innovent+ binder jetting printers (ExOne, North Huntington, PA, USA).
This paper has four sections. Following this introduction, Section 2 introduces the powder materials, the printer and printing parameters, the design of experiments, and the setup used to measure energy consumption. Section 3 presents and discusses the experimental results. Finally, Section 4 summarizes the conclusions of the study.
2. Materials and Methodology
2.1. Powder Materials
Silicon carbide (SiC) powder (Electro Abrasives LLC, Buffalo, NY, USA) was used as the feedstock powder in this study. Its average particle diameter was 14 μm, according to measurements using a laser scattering analyzer (Partica LA-960, Horiba, Kyoto, Japan).
2.2. Printer and Printing Parameters
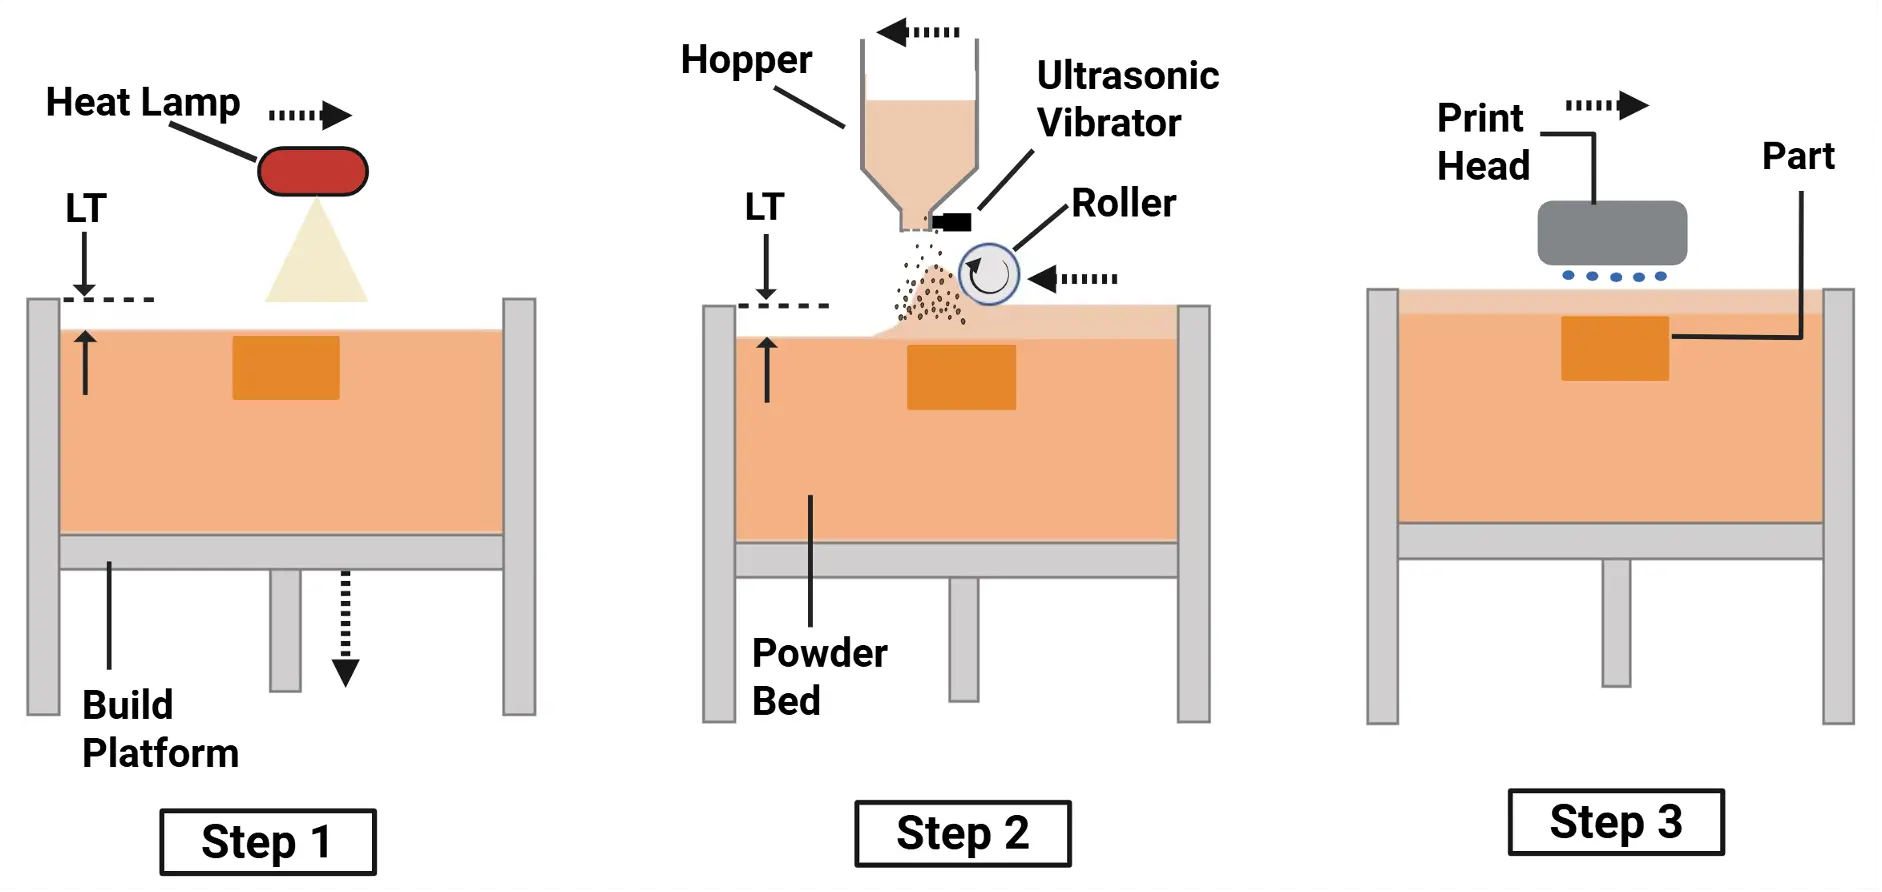
The major steps of printing each layer in the binder jetting process are described below and illustrated in Figure 1 [19]. In Step 1, the build platform is lowered by a distance equal to layer thickness (LT) [2]. An infrared lamp (the drying unit) then scans the powder bed from left to right, over a freshly bound powder layer. In Step 2, the ultrasonic hopper containing the feedstock powder traverses over the powder bed from right to left, dispensing powder onto the build platform. Simultaneously, a counter-rotating roller spreads the powder in the same direction, forming a new layer. In Step 3, the printhead jets liquid binder onto selected regions of the powder layer. These steps are repeated layer by layer until the part is fully formed [3,20,21].
In this study, the Innovent+ binder jetting printer (ExOne, North Huntington, PA, USA) was used. The printing parameters that were kept constant, along with their values, are presented in Table 2. Definitions of these parameters are provided in the literature [2]. The printing parameters listed in Table 2 were selected to represent typical printing parameters for the binder jetting process using the Innovent+ printer. The chosen values were based on the manufacturer’s recommended operating ranges and commonly used settings reported in the binder jetting literature [22,23,24], allowing the effects of drying time, ultrasonic vibration intensity, and powder bed temperature on energy consumption to be evaluated under realistic process conditions.
Table 2. Printing parameters and their values.
|
Printing Parameter and Unit |
Value |
|---|---|
|
Layer thickness (μm) |
100 |
|
Roller traverse speed (mm/s) |
5 |
|
Roller rotation speed (rpm) |
300 |
|
Recoat speed (mm/s) |
25 |
|
Binder saturation (%) |
50 |
|
Binder set time (s) |
30 |
2.3. Experimental Design
A one-factor-at-a-time (OFAT) experimental design was adopted to isolate the effects of individual process parameters (drying time, ultrasonic vibration intensity, target powder bed temperature) on energy consumption. This approach enabled clear attribution of observed energy consumption trends to specific subsystems, reflecting main effects under controlled conditions rather than a full multivariate representation of the energy consumption of the binder jetting process.
2.3.1. Experiments Regarding Effects of Drying Time
In experiments regarding the effects of drying time, no feedstock powder was used. The printer performed a mock printing of parts with dimensions (length × width × thickness) of 10 mm × 10 mm × 1 mm, in 10 layers, following a digital three-dimensional (3D) model. This model was designed using the SOLIDWORKS Student Edition 2025 SP3.0 computer-aided design (CAD) software and exported as an STL file, which provided instructions for the binder jetting printer. Each layer was treated as a replicate to characterize the variability in energy consumption during repeated operation of the drying unit under the same controlled operating conditions.
The absence of feedstock powder was intentional. Specifically, it allowed the contribution of the drying unit to energy consumption to be isolated from other potential contributions, such as heat transfer within the powder bed. Therefore, the experiments regarding the effects of drying time aimed to investigate energy consumption under controlled, no-powder mock printing conditions, rather than a complete representation of thermal effects of binder jetting during actual printing.
Experiments were conducted at five drying times, namely 1, 15, 30, 45, and 60 s. The selected drying times span the recommended range (15 to 30 s) for SiC printing [6,25,26,27]. To minimize noise in energy consumption measurements, the ultrasonic vibration intensity was set to zero. Additionally, the target powder bed temperature was set to 50 °C, a value commonly used in binder jetting for a wide range of materials.
2.3.2. Experiments Regarding Effects of Ultrasonic Vibration Intensity
Two sets of experiments were conducted. In the first set of experiments, there was no powder in the ultrasonic hopper. In the second set, 1 kg of SiC powder was inside the hopper, but the screen through which the powder was dispensed from the hopper onto the build platform was sealed by tape, preventing any powder from leaving the hopper. The concept of the sealed screen is illustrated in Figure 2. Figure 2a shows the ultrasonic hopper containing powder, with the screen unsealed, allowing free flow of the powder through the screen, and Figure 2b shows the hopper with the screen sealed with tape, preventing any powder flow through the screen. In both sets of experiments, the hopper did not traverse from one side to the other. Additionally, instead of executing a normal print function, the “drain recoat” function was used for both sets of experiments to mimic the powder dispensing operation without actual powder flow. Ultrasonic vibration was turned on for 10 s at 25%, 50%, 75%, and 100% intensity. For each intensity, experiments were repeated 10 times (10 cycles). Each cycle was treated as a replicate to characterize the variability in measured energy consumption during repeated operation of the ultrasonic hopper under the same controlled operating conditions.
The approaches, first, to use no powder and, second, to use powder while sealing the screen, aimed to isolate the energy consumption of the ultrasonic hopper from other processes involved in powder dispensing, such as hopper traversal, powder spreading, and binder jetting. Consequently, the experiments aimed at investigating the effects of ultrasonic vibration intensity on energy consumption, rather than fully replicating the powder dispensing during printing.
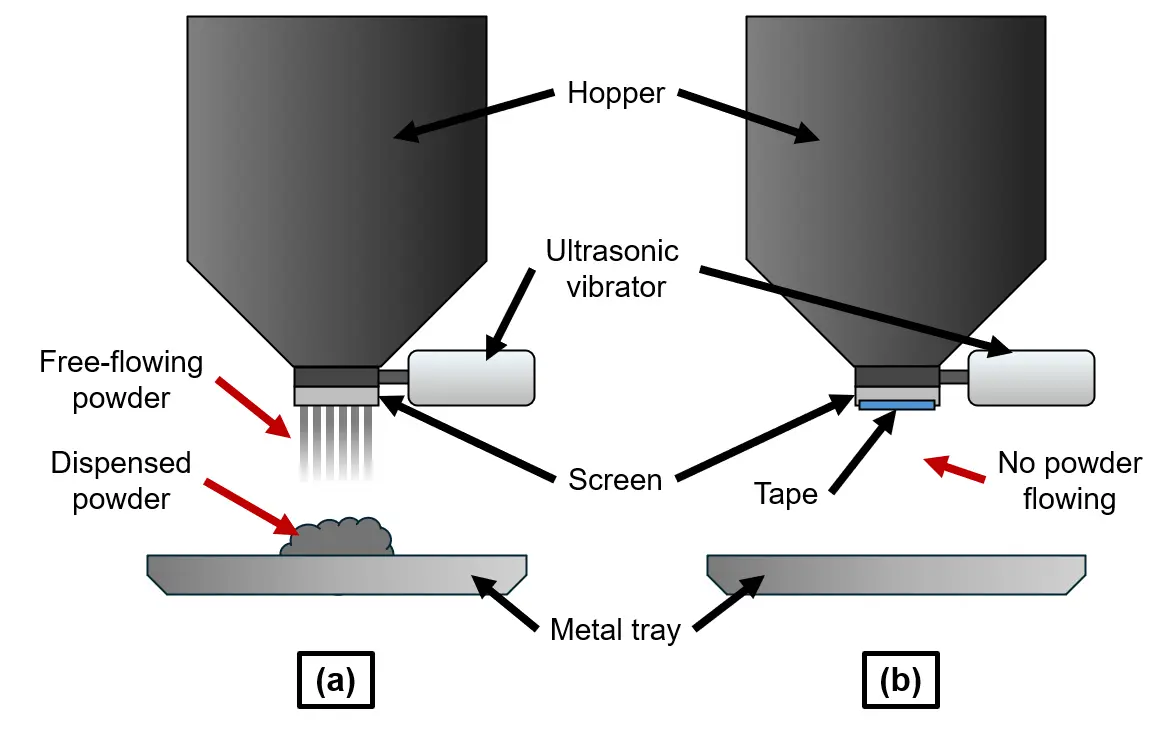
Figure 2. Ultrasonic hopper containing powder, (a) with the screen unobstructed, allowing the powder to flow through, and (b) with the screen sealed by tape, preventing any powder from flowing through. The sealed screen isolated the effects of ultrasonic vibration intensity on energy consumption from the effects of powder dispensing from the hopper.
2.3.3. Experiments Regarding Effects of Target Powder Bed Temperature
In these experiments, 1 kg of SiC powder was loaded in the ultrasonic hopper. The printer was instructed to perform Steps 1 and 2, described in Section 2.2 and illustrated in Figure 1, 10 times (10 powder layers). Each layer was treated as a replicate to characterize the variability in measured energy consumption across repeated printer operations under the same controlled operating conditions. Drying time was fixed at 30 s and then at 60 s. Target powder bed temperature was the powder bed temperature setpoint specified in the printer control system, while powder bed temperature was the measured temperature of the surface of the powder bed, recorded by the infrared sensor. Target powder bed temperature was set to 40, 60, and 80 °C. The selected target powder bed temperatures span the recommended range for SiC printing [6,25,26,27]. Ultrasonic vibration intensity was kept constant at 100%. Powder bed temperature was measured using the printer’s built-in infrared temperature sensor, located inside the printer chamber near the powder bed, which monitored the surface temperature of the powder bed. The sensor provided continuous, layer-by-layer temperature measurements, which the printer’s control system used to regulate the power output of the infrared drying unit to achieve the specified target powder bed temperature. The temperature values reported in this study corresponded to the measured surface temperature recorded for each layer during the drying phase.
2.4. Measurement of Energy Consumption
The procedure for measuring energy consumption is described below and illustrated in Figure 3. In Step 1, a line splitter (ELS2A, Amprobe, WA, USA) was connected to a standard 120 V AC outlet. The line splitter separated the live wire from the neutral and ground wires, enabling current measurements without directly modifying the electricity cord of the printer [28]. In Step 2, the printer’s electricity cord was plugged into the output end of the line splitter. In Step 3, a clamp ammeter (376FC, Fluke, WA, USA) was clamped to the splitter. The splitter isolated the live wire, allowing accurate current readings without interference from the neutral or ground wires. Finally, in Step 4, the clamp ammeter was turned on. As measurements were carried out, real-time current data were collected via the clamp ammeter’s Bluetooth interface.
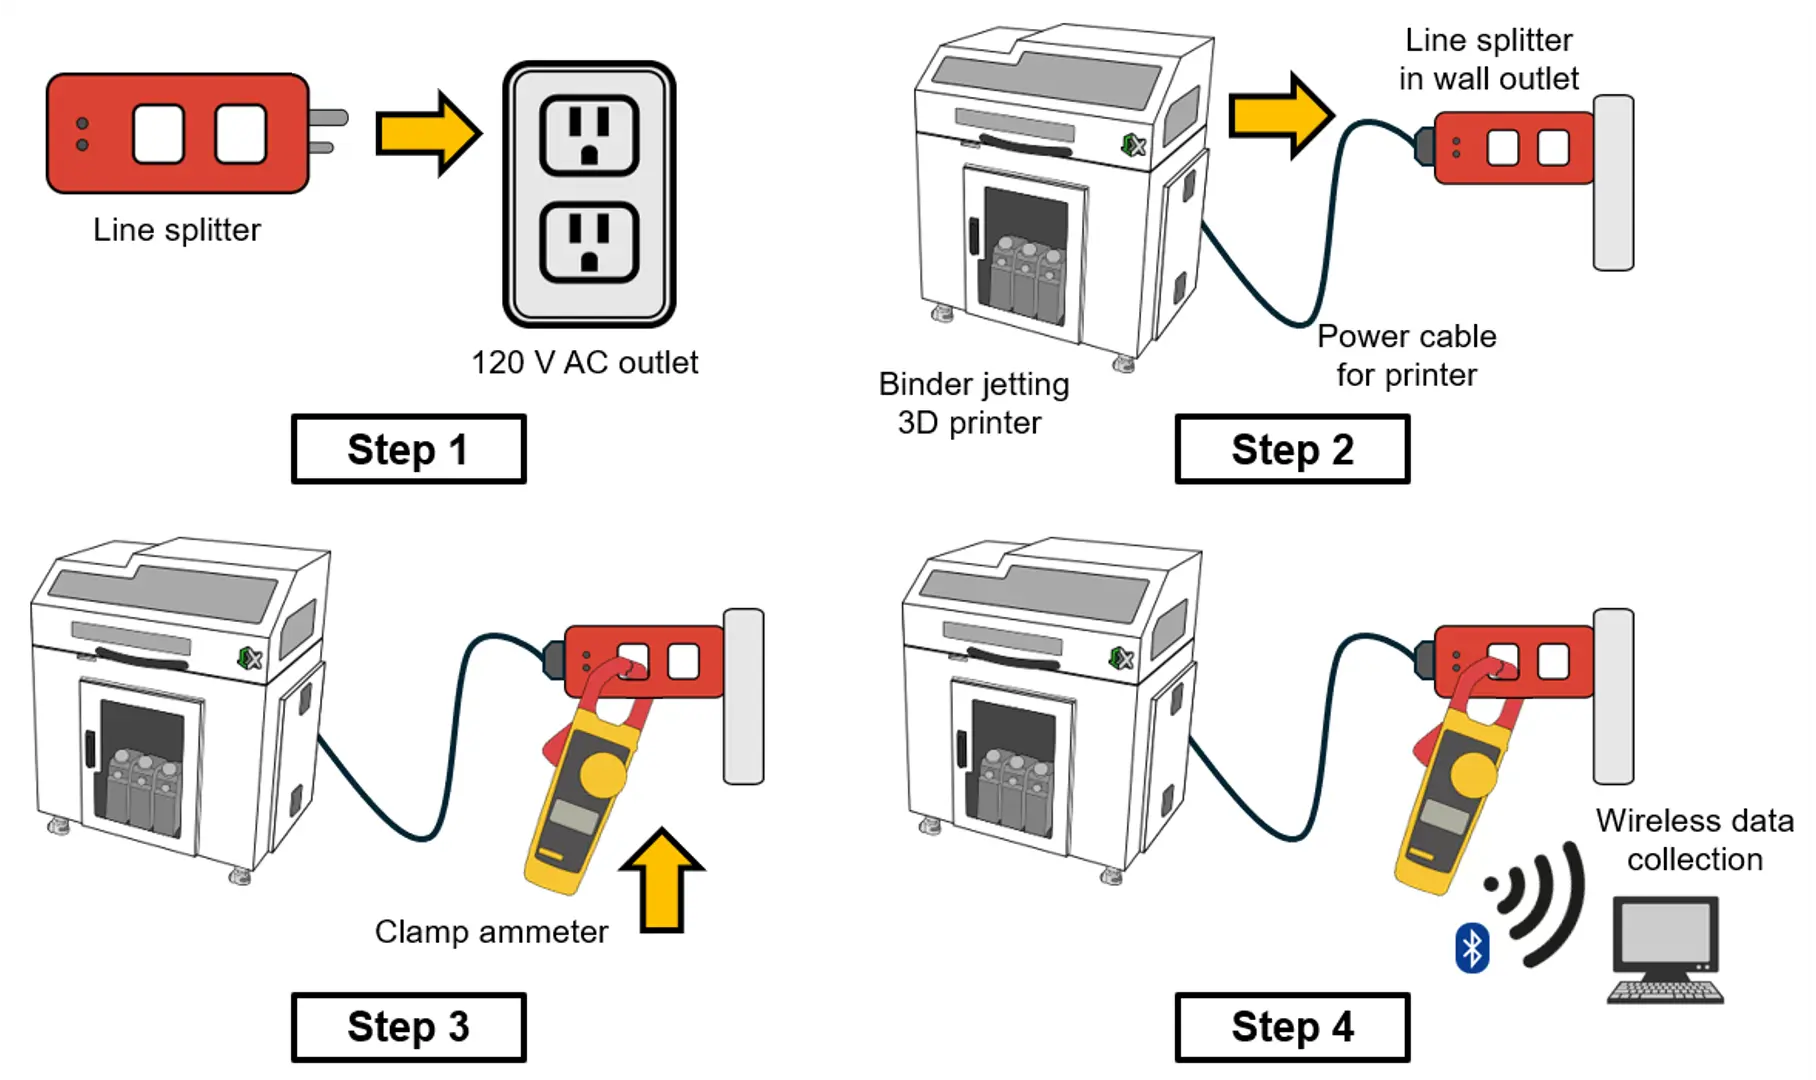
Figure 3. Experimental setup for measuring energy consumption using a line splitter and a clamp ammeter to record current drawn by the binder jetting printer under controlled conditions.
The energy consumed by the printer, E, in Joules, was calculated via Equation (1),
|
```latex{E = }{\int }_{{{t}}_{{1}}}^{ {{ t}}_{{2}}}{V}{(}{t}{)}{I}{(}{t}{)}{cos}{(}{φ}{)}{dt}``` |
(1) |
where V(t) is the voltage (in V; it was equal to 120 V in this study); t1 and t2 are the start point and end point of the measurement (in s), respectively; I(t) (in A) is the current drawn by the printer at a given sampling time; φ is the phase angle between voltage and current; and cos(φ) is the power factor. Current data were collected every 1 s. The integration was performed using the Trapezoidal Rule [29].
The clamp ammeter reported root-mean-square (RMS) current (this is the standard way electrical meters report current). In Equation (1), the current term I(t) therefore corresponds to the measured RMS current at a given sampling time. Because instantaneous voltage and phase angle were not measured, the calculations were performed using the approximation of Equation (2). Consequently, the calculated energy values represent an estimate of energy consumption.
|
```latexE ≈{ }{\int }_{{{t}}_{{1}}}^{ {{ t}}_{{2}}}{V}{(}{t}{)}{I}{(}{t}{)}{dt}``` |
(2) |
For the infrared drying unit, which consisted of a resistive heating element, the power factor approached unity (cos(φ) ≈ 1). Under these conditions, the approximation of Equation (2) provided a good estimate of real power consumption.
In contrast, the piezoelectric actuator that drove the ultrasonic hopper behaved predominantly as a capacitive load, for which the power factor was less than unity. In this case, assuming cos(φ) ≈ 1 led to an overestimation of the real energy consumption of the ultrasonic hopper. Therefore, Equation (2) provided an upper-bound estimate of the real energy consumption of the ultrasonic hopper.
According to the manufacturer’s specifications, the clamp ammeter provides an AC current accuracy of ±2% of the measured value, and an additional uncertainty of ±5 digits for frequencies between 10 and 100 Hz. For the current levels observed in this study, the uncertainty would be approximately ±0.2–0.4 A. Because energy consumption was estimated from the product of voltage and current, this translated to an estimated measurement uncertainty of approximately 2–3% in the calculated energy consumption values.
3. Results
The statistical analysis presented in this section focuses on descriptive characterization of the experimental data obtained during repeated subsystem operation under the same controlled operating conditions. Mean, median, quartiles, and standard deviation were used to quantify central tendency and variability of energy consumption measurements across repeated layers or cycles, while scatter plots and box plots were used to visualize the distributions across experimental conditions. This approach allowed trends in energy consumption to be examined while highlighting the variability across layers or cycles.
3.1. Results on the Effects of Drying Time on Energy Consumption
Figure 4 presents a time series of the current measured during the mock printing of 10 layers, with a drying time of 30 s. The horizontal axis indicates the elapsed time (s), while the vertical axis displays the current drawn (A). A similar current profile was observed across all layers. At the onset of the drying phase for each layer, a sharp spike in current (inrush current spike) was recorded. This spike corresponded to the energy needed to activate the infrared lamp. Following this spike, the current dropped and remained relatively stable for the rest of the drying phase. Upon completion of the drying phase, the current decreased to a baseline level and remained there during the idle phase, defined as the interval between successive drying phases in which the infrared lamp was inactive, and no current was drawn for drying.
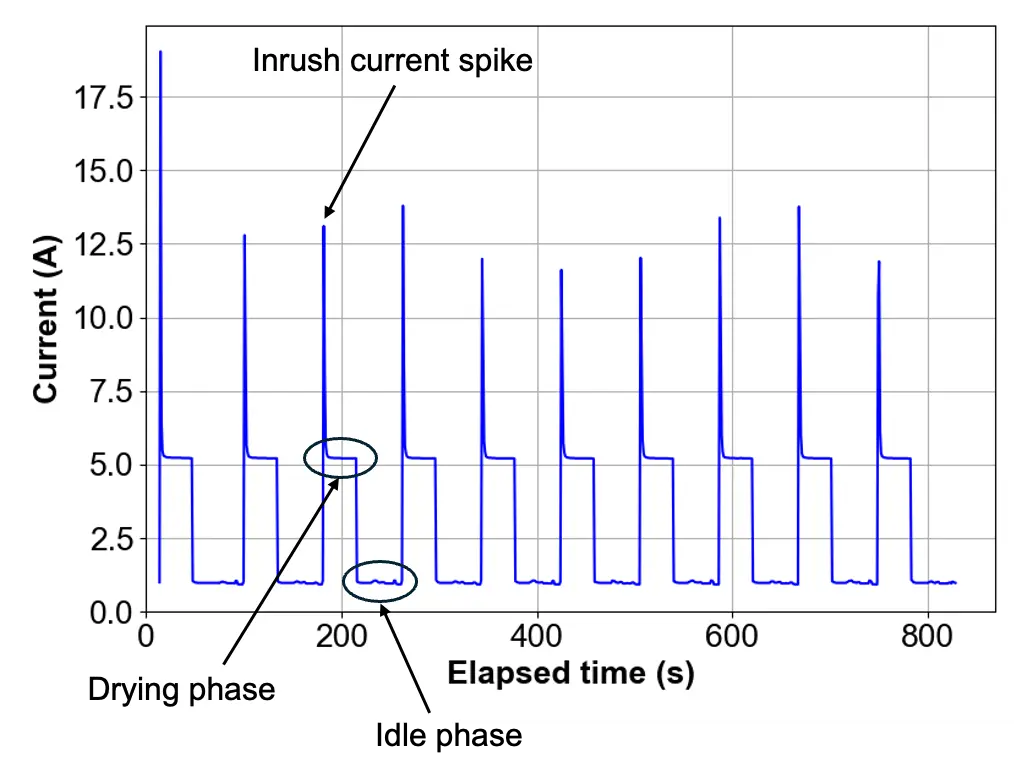
Figure 4. Time series of current during mock printing of 10 layers at a drying time of 30 s. Each layer exhibited an initial inrush current spike followed by a steady-state drying phase and a low-current idle phase.
Current measurements were recorded as RMS values at 1-s intervals. This sampling interval limited the ability to resolve transient electrical events occurring at sub-second timescales. In particular, the inrush current spikes associated with activation of the infrared lamp occurred over a much shorter duration than the sampling interval. Therefore, their amplitude and duration could not be resolved with sufficient temporal accuracy to reliably quantify their contribution to energy consumption. As a result, these spikes were excluded from further analysis to focus on the steady-state current drawn during the drying phase. Because the inrush spikes occurred only briefly during activation of the drying unit, while the steady-state drying phase lasted several tens of seconds, their contribution represented a small portion of the total energy consumption.
Removal of inrush current spikes resulted in 10 waveforms resembling rectangular pulses, each representing a different layer. Figure 5 displays these waveforms at a drying time of 30 s. The resulting waveforms exhibited rather consistent shape, magnitude, and duration across all layers. For the removal of inrush current spikes, differences between consecutive current measurements were investigated. Each inrush current spike started when a sharp increase between consecutive current measurements occurred, and ended when a sharp decrease between consecutive current measurements was observed. The values within the spike were replaced by the first value of the subsequent drying phase to maintain the continuity of the waveform.
The rectangular form of each pulse reflected the current drawn during the steady-state portion of the drying phase. This separation between drying phase and idle phase allowed for energy calculations at different layers, using Equation (1). More specifically, t1 and t2 were the start point and end point of the drying phase, respectively, and the integral of Equation (1) was calculated through the area of the drying phase under the curve.
Figure 6 shows the energy consumption at different drying times (1, 15, 30, 45, and 60 s) and layers. It is evident that, as drying time increased, energy consumption increased. Although a linear relationship between drying time and energy consumption was observed, an initial energy offset was observed, especially at drying times of 1 and 15 s. This offset was attributed to measurement variability at very short drying times, which became negligible at longer drying times.
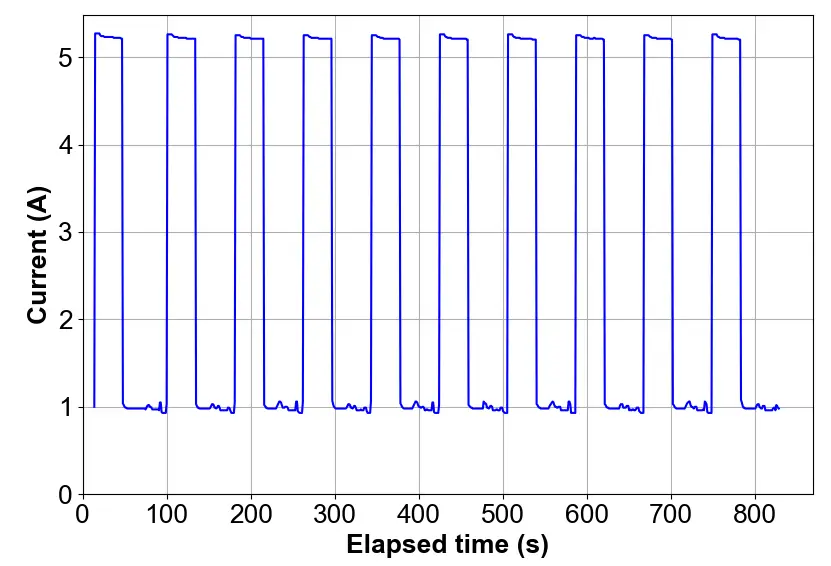
Figure 5. Time series of current during mock printing of 10 layers at a drying time of 30 s, after removing inrush current spikes, showing consistent rectangular pulse-like waveforms corresponding to steady-state drying phases across layers.
Table 3 summarizes descriptive statistics (mean, median, minimum, maximum, first quartile, third quartile, and standard deviation) for the effects of drying time on energy consumption. Notably, the differences in mean energy consumption between drying times were substantially larger than the corresponding standard deviations within each condition. This indicated a clear separation between the distributions of energy consumption values at different drying times. Figure 7 presents box plots of energy consumption across different layers, at each of the five drying times (1, 15, 30, 45, and 60 s).
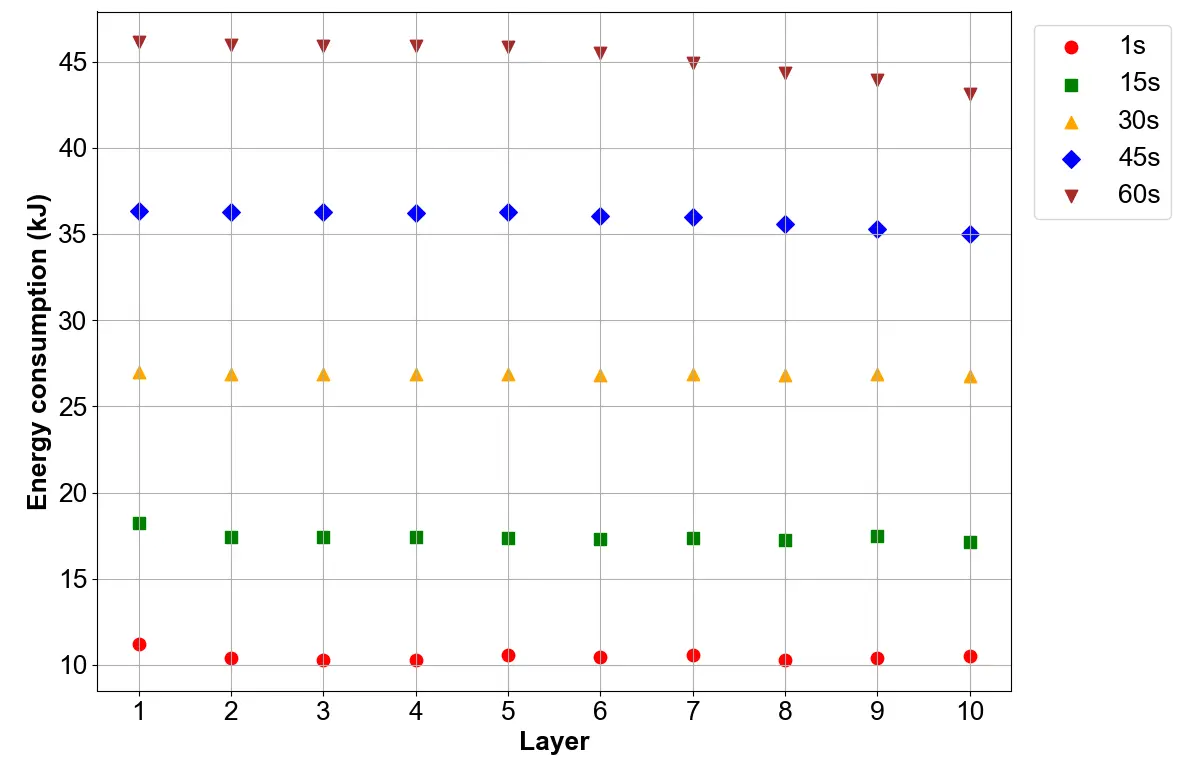
Figure 6. Energy consumption at each layer for different drying times (1, 15, 30, 45, and 60 s) under controlled, no-powder conditions. Energy consumption increased with drying time, exhibiting an approximately linear trend with relatively low variability across layers.
Table 3. Descriptive statistics for the effects of drying time on energy consumption.
|
Drying Time (s) |
Mean (kJ) |
Median (kJ) |
Minimum (kJ) |
Maximum (kJ) |
Q1 (kJ) |
Q3 (kJ) |
Standard Deviation (kJ) |
|---|---|---|---|---|---|---|---|
|
1 |
10.494 |
10.436 |
10.264 |
11.207 |
10.322 |
10.536 |
0.2721 |
|
15 |
17.443 |
17.394 |
17.144 |
18.209 |
17.311 |
17.439 |
0.2887 |
|
30 |
26.862 |
26.864 |
26.759 |
26.975 |
26.847 |
26.873 |
0.0524 |
|
45 |
35.925 |
36.130 |
34.990 |
36.348 |
35.695 |
36.253 |
0.4714 |
|
60 |
45.156 |
45.668 |
43.118 |
46.117 |
44.496 |
45.920 |
1.0330 |
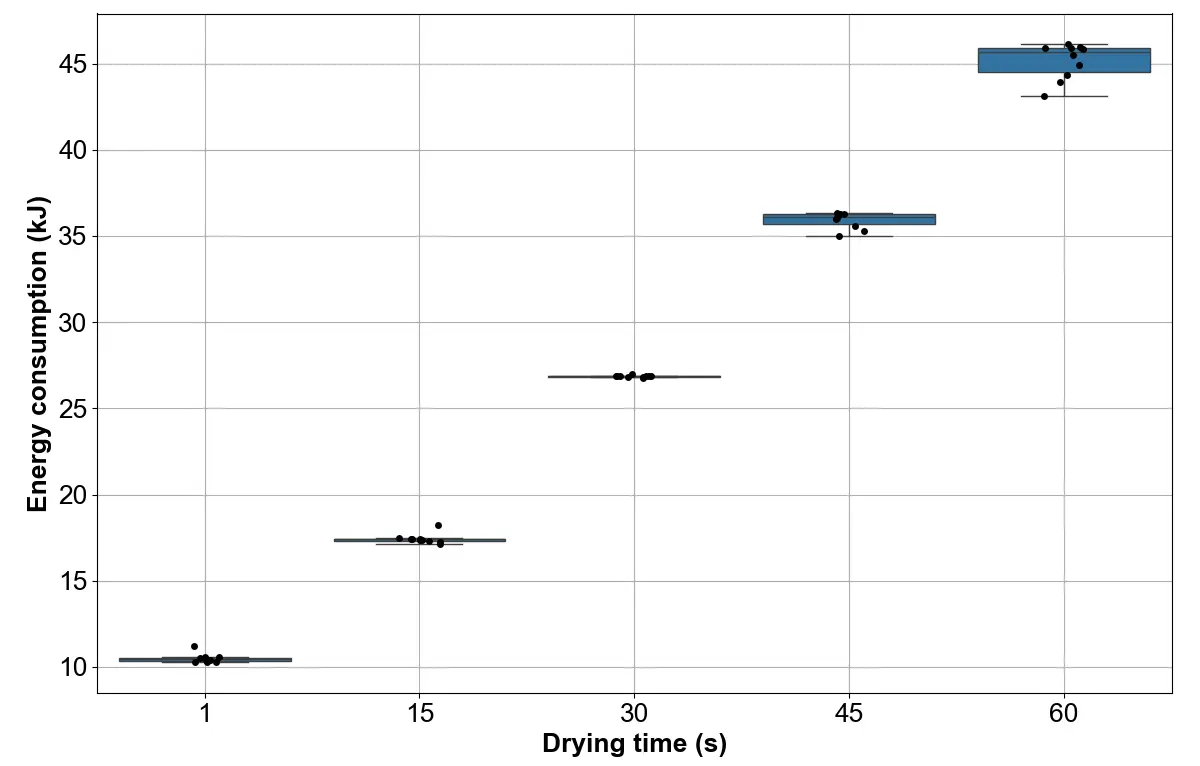
Figure 7. Box plots of energy consumption across different layers for different drying times (1, 15, 30, 45, and 60 s) under controlled, no-powder conditions, showing increasing median and distribution shift with drying time and generally low variability at each drying time.
The mean energy consumption increased approximately linearly with drying time, as confirmed by linear regression analysis (p < 0.001, R2 = 0.997), from 10.494 kJ at a drying time of 1 s to 17.443 kJ at a drying time of 15 s, to 26.862 kJ at a drying time of 30 s, 35.925 kJ at a drying time of 45 s, and 45.1564 kJ at a drying time of 60 s, confirming a strong effect of drying time on energy consumption. The median energy consumption followed a similar trend, increasing from 10.436 kJ at drying time of 1 s to 17.394 kJ at 15 s, 26.864 kJ at 30 s, 36.130 kJ at 45 s, and 45.669 kJ at 60 s. The close agreement between the median and the mean across all drying times suggested that the data set had largely symmetric distributions. At a drying time of 1 s, the data spread was very narrow, with energy consumption values across layers clustering between 10.264 kJ (minimum) and 11.207 kJ (maximum). This narrow spread, reflected in both the small interquartile range (IQR, equal to Q3 − Q1) and the low standard deviation, indicated highly consistent energy consumption distribution across different layers. At a drying time of 15 s, energy consumption shifted upward to a range of 17.144–18.2094 kJ. The IQR remained small (17.311–17.439 kJ), suggesting that, despite the increase in energy consumption, the spread of energy consumption values between layers remained narrow. Although the standard deviation was slightly higher at a drying time of 15 s (0.2887 kJ) compared with that when drying time was 1 s (0.2721 kJ), it still indicated stable energy consumption across layers. At a drying time of 30 s, the distribution again shifted upward, with values spanning from 26.759 to 26.975 kJ. This condition exhibited the narrowest spread among all drying times, as evidenced by the smallest IQR (26.847–26.873 kJ) and the lowest standard deviation (0.0524 kJ). This indicated that energy consumption was exceptionally consistent across layers. At a drying time of 45 s, energy consumption increased to values between 34.990 and 36.348 kJ. While the IQR (35.695–36.253 kJ) increased slightly compared to shorter drying times, the spread remained narrow. The standard deviation (0.4714) suggested slightly increased variation across layers, though overall consistency remained high. Finally, at a drying time of 60 s, energy consumption reached its highest values, ranging from 43.118 to 46.117 kJ. This condition exhibited the largest IQR (44.496–45.920 kJ) and the highest standard deviation (1.0330 kJ), indicating greater variability in energy consumption values across layers.
To evaluate the potential bias introduced into the energy consumption data by excluding inrush current spikes, per-layer energy consumption was calculated for all drying times with the spikes retained. The mean energy consumption associated with the inrush spikes ranged from approximately 0.87 kJ per layer at a drying time of 45 s to 1.05 kJ per layer at a drying time of 1 s. As a fraction of total per-layer energy consumption, the spike contribution decreased from about 10% at a drying time of 1 s to about 2% at a drying time of 60 s, because the energy consumption at the spike remained approximately constant while the energy consumption during the drying phase increased with drying time. Because energy consumption related to inrush current spikes was approximately constant, including the spikes would not affect the linear relationship between drying time and energy consumption (the regression slope changed by only 0.42% when the spikes were included).
3.2. Results on the Effects of Ultrasonic Vibration Intensity on Energy Consumption
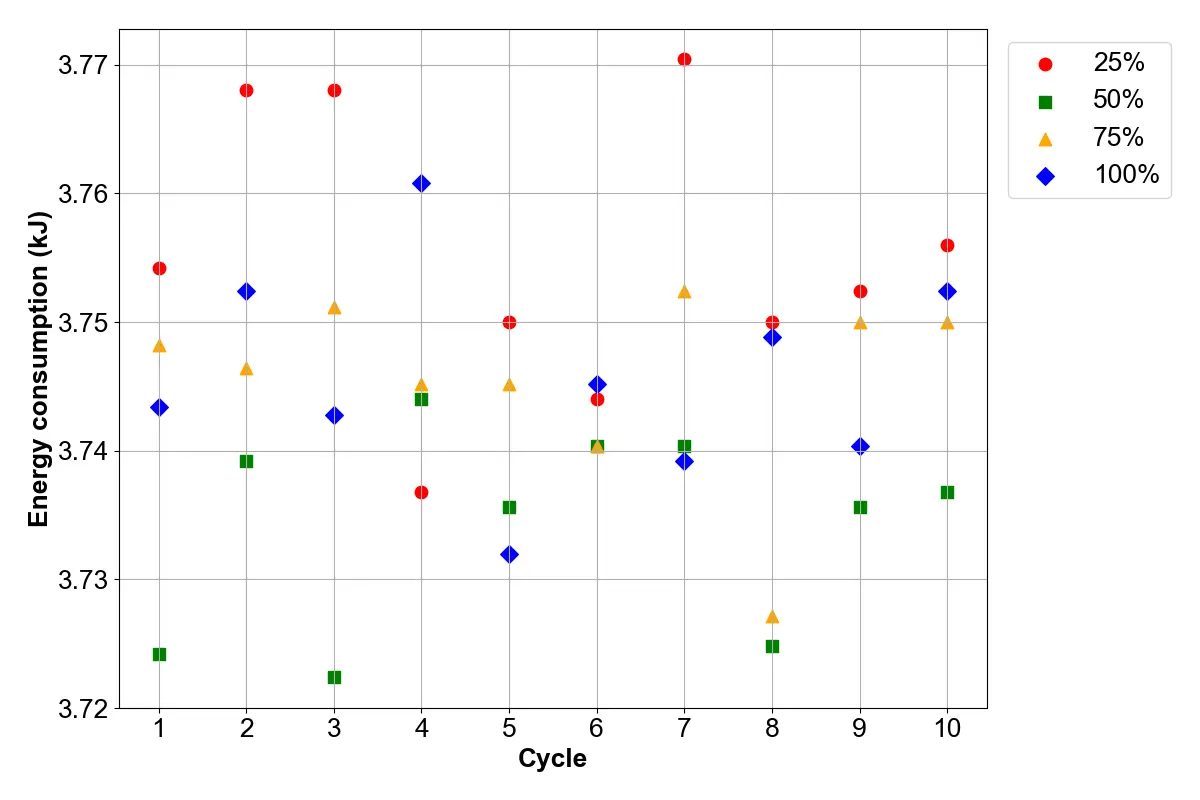
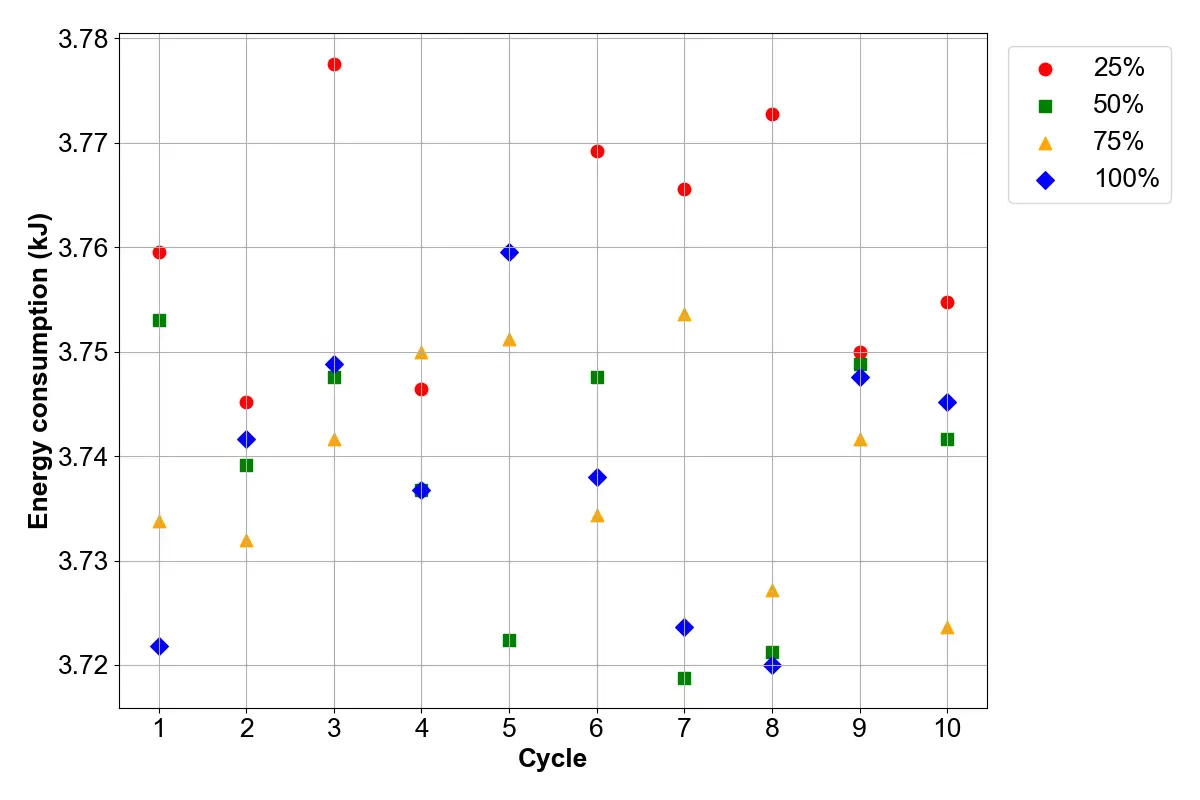
Figure 8 presents the energy consumption at each cycle and different ultrasonic vibration intensities (25%, 50%, 75% and 100%), without powder (Figure 8a) and with powder (Figure 8b) in the hopper. The scatter plots showed strong overlap among the data points. While minor cycle-to-cycle fluctuations were evident, no clear separation or systematic trends with increasing ultrasonic vibration intensity could be identified from the scatter plots alone. Consequently, the scatter plots alone were insufficient to clearly distinguish the effects of ultrasonic vibration intensity on energy consumption.
 |
|
(a) |
 |
|
(b) |
Figure 8. Energy consumption per cycle for different ultrasonic vibration intensities (25%, 50%, 75%, and 100%). Energy consumption showed minor variation from cycle to cycle, and across different vibration intensities. (a) Without powder; (b) With powder.
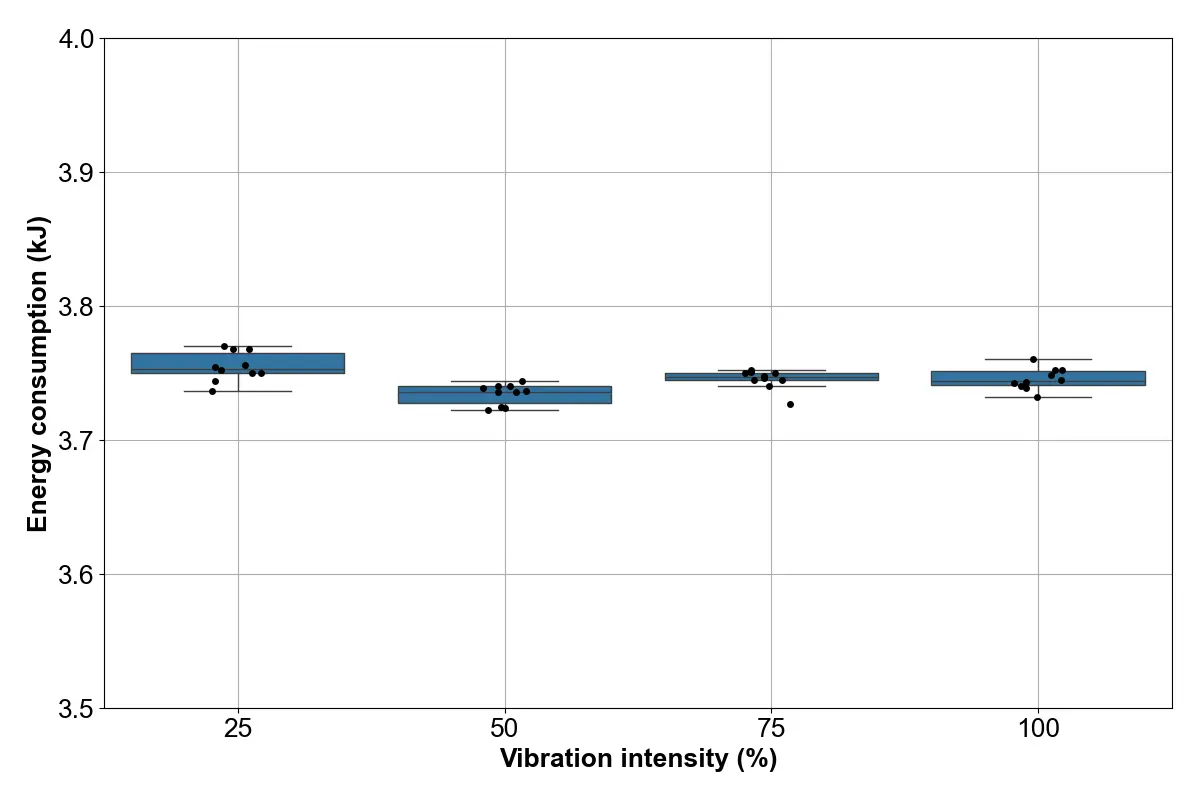
The descriptive statistics for the effects of ultrasonic vibration intensity on energy consumption are summarized in Table 4 and Table 5. Notably, the mean energy consumption values across the tested ultrasonic vibration intensities differed only marginally, and these differences were comparable to or smaller than the corresponding standard deviations within each condition. This indicated that the distributions of energy consumption values largely overlapped, suggesting that ultrasonic vibration intensity had little effect on energy consumption under the investigated conditions. Figure 9 presents box plots of energy consumption across different cycles at each of the four ultrasonic vibration intensities (25%, 50%, 75%, and 100%), without (Figure 9a) and with powder (Figure 9b), respectively.
Table 4. Descriptive statistics for the effects of ultrasonic vibration intensity on energy consumption, without powder.
|
Ultrasonic Vibration Intensity (%) |
Mean (kJ) |
Median (kJ) |
Minimum (kJ) |
Maximum (kJ) |
Q1 (kJ) |
Q3 (kJ) |
Standard Deviation (kJ) |
|---|---|---|---|---|---|---|---|
|
25 |
3.755 |
3.753 |
3.737 |
3.770 |
3.750 |
3.765 |
0.0110 |
|
50 |
3.734 |
3.736 |
3.722 |
3.744 |
3.726 |
3.740 |
0.0077 |
|
75 |
3.746 |
3.747 |
3.727 |
3.752 |
3.745 |
3.750 |
0.0074 |
|
100 |
3.746 |
3.744 |
3.732 |
3.761 |
3.741 |
3.752 |
0.0082 |
Table 5. Descriptive statistics for the effects of ultrasonic vibration intensity on energy consumption, with powder.
|
Ultrasonic Vibration Intensity (%) |
Mean (kJ) |
Median (kJ) |
Minimum (kJ) |
Maximum (kJ) |
Q1 (kJ) |
Q3 (kJ) |
Standard Deviation (kJ) |
|---|---|---|---|---|---|---|---|
|
25 |
3.760 |
3.760 |
3.745 |
3.778 |
3.751 |
3.768 |
0.0112 |
|
50 |
3.738 |
3.740 |
3.719 |
3.753 |
3.726 |
3.748 |
0.0126 |
|
75 |
3.739 |
3.738 |
3.724 |
3.754 |
3.733 |
3.748 |
0.0104 |
|
100 |
3.738 |
3.740 |
3.720 |
3.760 |
3.727 |
3.747 |
0.0131 |
 |
|
(a) |
 |
|
(b) |
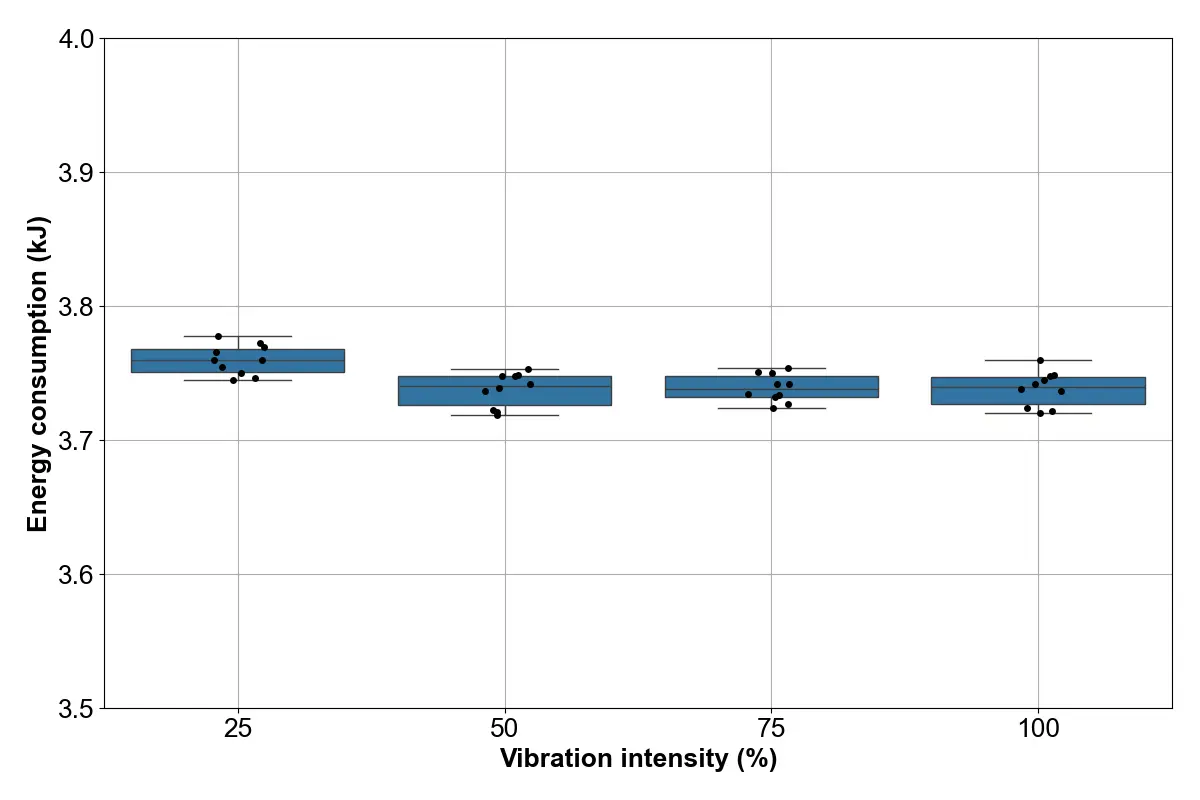
Figure 9. Box plots of energy consumption across different cycles, for different ultrasonic vibration intensities (25%, 50%, 75%, and 100%). Energy consumption distributions overlapped significantly, suggesting that ultrasonic vibration intensity did not significantly affect energy consumption. (a) Without powder; (b) With powder.
The mean energy consumption remained nearly constant across all ultrasonic vibration intensities when no powder was used, varying slightly between 3.734 and 3.755 kJ. A decrease in the mean was observed when increasing the vibration intensity from 25% to 50%, followed by a small increase when further increasing the vibration intensity to 75% and 100%. However, these differences were minimal, indicating that ultrasonic vibration intensity did not have a meaningful impact on the mean energy consumption. The median energy consumption followed a similar trend, with values ranging from 3.736 to 3.753 kJ. The close agreement between mean and median at all vibration intensities indicated that energy consumption distributions were approximately symmetric. This further confirmed that energy consumption was stable and largely unaffected by changes in ultrasonic vibration intensity in the absence of powder in the hopper. At a vibration intensity of 25%, energy consumption values were tightly clustered between 3.737 and 3.770 kJ, with a very small IQR (3.750–3.765 kJ) and a low standard deviation (0.0110 kJ), again indicating highly consistent energy consumption. Increasing the ultrasonic vibration intensity to 50% resulted in a marginal decrease in energy consumption, with values ranging from 3.722 to 3.744 kJ. The IQR (3.726–3.740 kJ) and standard deviation (0.0077 kJ) were slightly smaller than those at a vibration intensity of 25%, suggesting lower variability. At a vibration intensity of 75%, energy consumption increased slightly, spanning from 3.727 to 3.752 kJ, while maintaining a narrow IQR (3.745–3.750 kJ) and low standard deviation (0.0074 kJ). Similarly, at a vibration intensity of 100%, energy consumption values ranged from 3.732 to 3.761 kJ. Although the standard deviation increased marginally (0.0084 kJ), the IQR (3.741–3.752 kJ) remained small.
The mean energy consumption ranged from 3.738 to 3.760 kJ across all ultrasonic vibration intensities in the experiments using powder. A small decrease in mean energy consumption was observed when increasing intensity from 25% to 50%, after which the mean remained nearly unchanged at higher intensities. Overall, the differences in mean energy consumption were negligible, suggesting that ultrasonic vibration intensity had little influence on the mean energy consumption when powder was used. The median energy consumption values were very close to the corresponding means, ranging between 3.738 and 3.760 kJ. This strong alignment between median and mean indicated symmetric distributions. The consistency of median values across intensities further highlighted that ultrasonic vibration intensity did not significantly affect energy consumption in the presence of powder in the hopper. At an intensity of 25%, energy consumption values ranged from 3.745 to 3.778 kJ, with a narrow IQR (3.751–3.768 kJ) and low standard deviation (0.0112 kJ), again indicating consistent energy consumption. Increasing the intensity to 50% slightly reduced the mean energy consumption, with values spanning from 3.719 to 3.753 kJ. The IQR (3.726–3.748 kJ) remained small, although the standard deviation increased slightly (0.0126 kJ), suggesting modestly higher variability compared with that at a vibration intensity of 25%. At a vibration intensity of 75%, energy consumption ranged from 3.724 to 3.754 kJ, with a similarly narrow IQR (3.733–3.748 kJ) and low standard deviation (0.0104 kJ), indicating stable energy consumption across layers. At an intensity of 100%, energy consumption values ranged from 3.720 to 3.760 kJ, and this condition exhibited the largest standard deviation among the four intensities (0.0131 kJ), though the IQR (3.727–3.747 kJ) remained narrow.
The fact that energy consumption remained relatively stable, exhibiting minimal variation across different ultrasonic vibration intensities, contrasted with the intuitive assumption that higher ultrasonic vibration intensities would result in increased energy consumption. This minimal variation was attributed to the operational characteristics of the ultrasonic hopper, which is powered by a piezoelectric actuator. Piezoelectric devices function at high frequencies (typically in the tens of kilohertz) and draw very little current. They predominantly behave as capacitive loads, mainly storing and releasing electrical energy rather than consuming it. As a result, even as ultrasonic vibration intensity increased, the printer’s energy consumption remained low and stable [11,30].
When comparing the results of the two sets of experiments—without and with powder in the ultrasonic hopper—it was evident that the presence of powder had a negligible effect on the overall energy consumption of the ultrasonic hopper. This indicated that the ultrasonic hopper’s energy consumption was independent of the mechanical load caused by the presence of powder. To confirm this, the Two One-Sided Test (TOST) procedure was applied to the energy consumption measurements across all vibration intensities for the two sets of experiments—without and with powder in the ultrasonic hopper. Unlike conventional hypothesis testing, which assesses whether a difference exists, the TOST procedure evaluates whether any observed difference is sufficiently small to be considered practically negligible [31,32]. In this study, differences smaller than 1% of the mean energy consumption were considered practically negligible. The resulting p-value was less than 0.001, indicating that any difference between the energy consumption measurements across all vibration intensities for the two sets of experiments fell within this range. This supported the conclusion that the presence of powder in the hopper had a practically negligible effect on energy consumption under the controlled operating conditions.
This behavior can be explained by the operating principle of the ultrasonic hopper. The ultrasonic hopper is driven by an electrical transducer oscillating at a controlled frequency and amplitude. The presence of powder inside the hopper introduced only a relatively small additional mechanical load compared with the stiffness and mass of the vibrating structure itself. As a result, the electrical power required to maintain the ultrasonic vibration remained nearly constant, resulting in energy consumption largely independent of the powder load under the investigated conditions.
3.3. Results on the Effects of Target Powder Bed Temperature on Energy Consumption
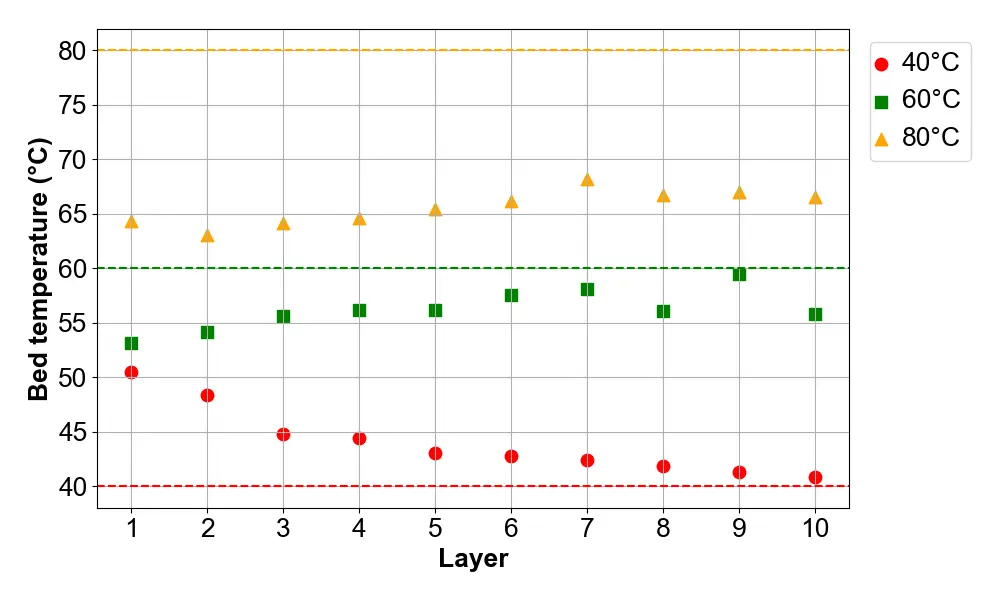
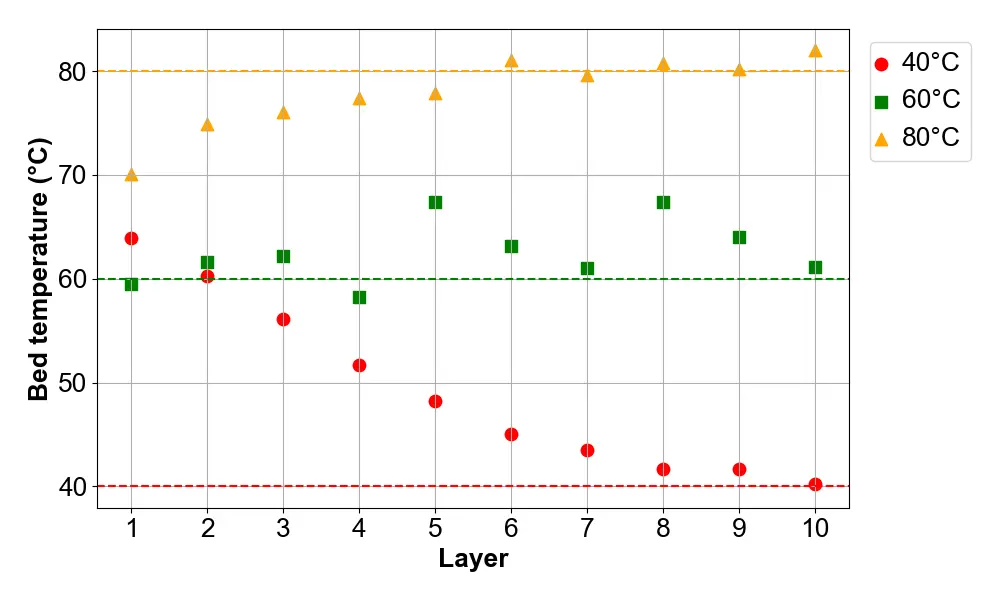
Figure 10 presents the measured powder bed temperature at each layer and different target powder bed temperatures, at drying times of 30 s (Figure 10a) and 60 s (Figure 10b), respectively. Dashed lines represent the target powder bed temperatures. At a drying time of 30 s, the measured powder bed temperature slowly approached the target powder bed temperature when the latter was set at 40 °C. However, the powder bed failed to reach the target powder bed temperatures, with the deviation most pronounced in the 80 °C experiment. This behavior reflected the thermal response of the printer, where the drying time was insufficient for the powder bed to reach the target powder bed temperature. Therefore, the experiments at a drying time of 30 s were interpreted as representing the transient thermal response of the printer while attempting to reach the target powder bed temperatures, rather than steady-state operation. In contrast, at a drying time of 60 s, the measured powder bed temperature reached the target powder bed temperature for the first layer when the target powder bed temperature was set to 60 °C, although it exhibited inconsistency from layer to layer. The measured powder bed temperature gradually reached the target powder bed temperatures of 40 and 80 °C after a few layers. However, in the first case, it initially reached a much higher temperature (about 63 °C) than the target powder bed temperature and gradually decreased to 40 °C; in the second case, it gradually increased from temperatures below 80 °C to the target powder bed temperature of 80 °C. Results at a drying time of 60 s provided a clearer representation of the relationship between target powder bed temperature and energy consumption under quasi-steady-state thermal conditions, because the measured powder bed temperature approached the target powder bed temperature after several initial layers.
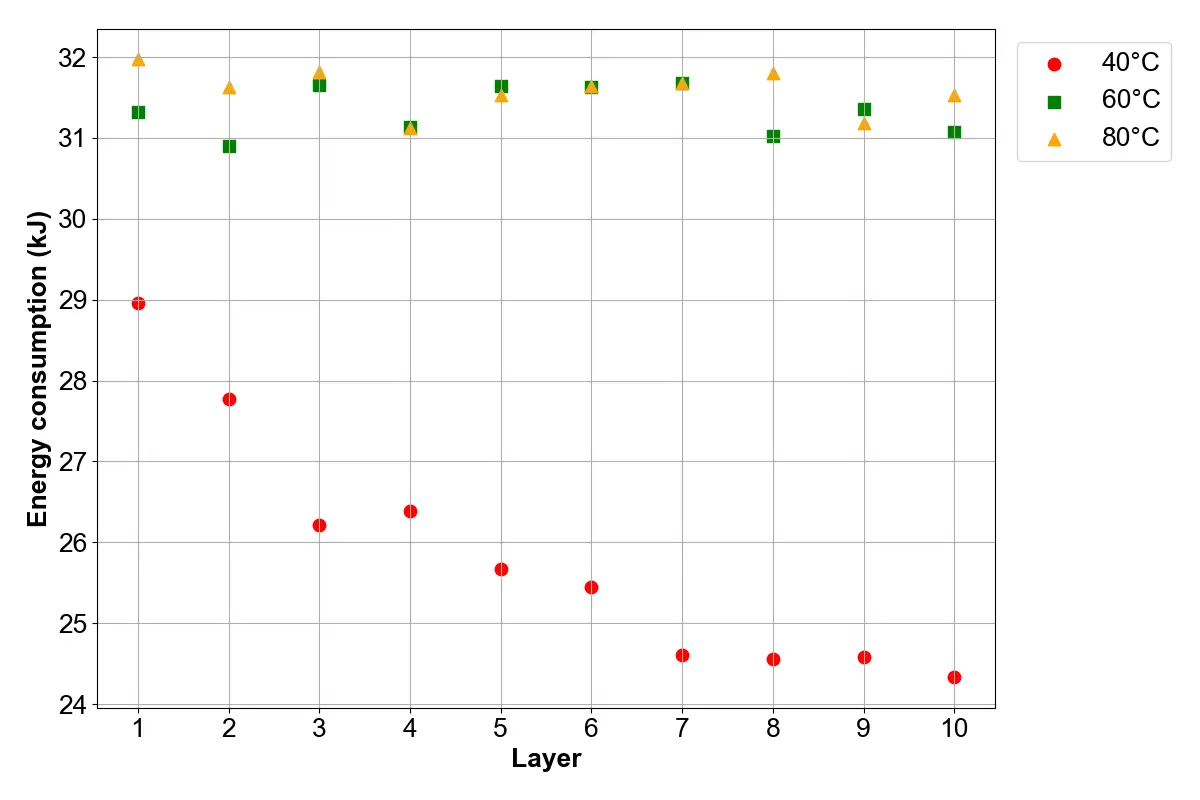
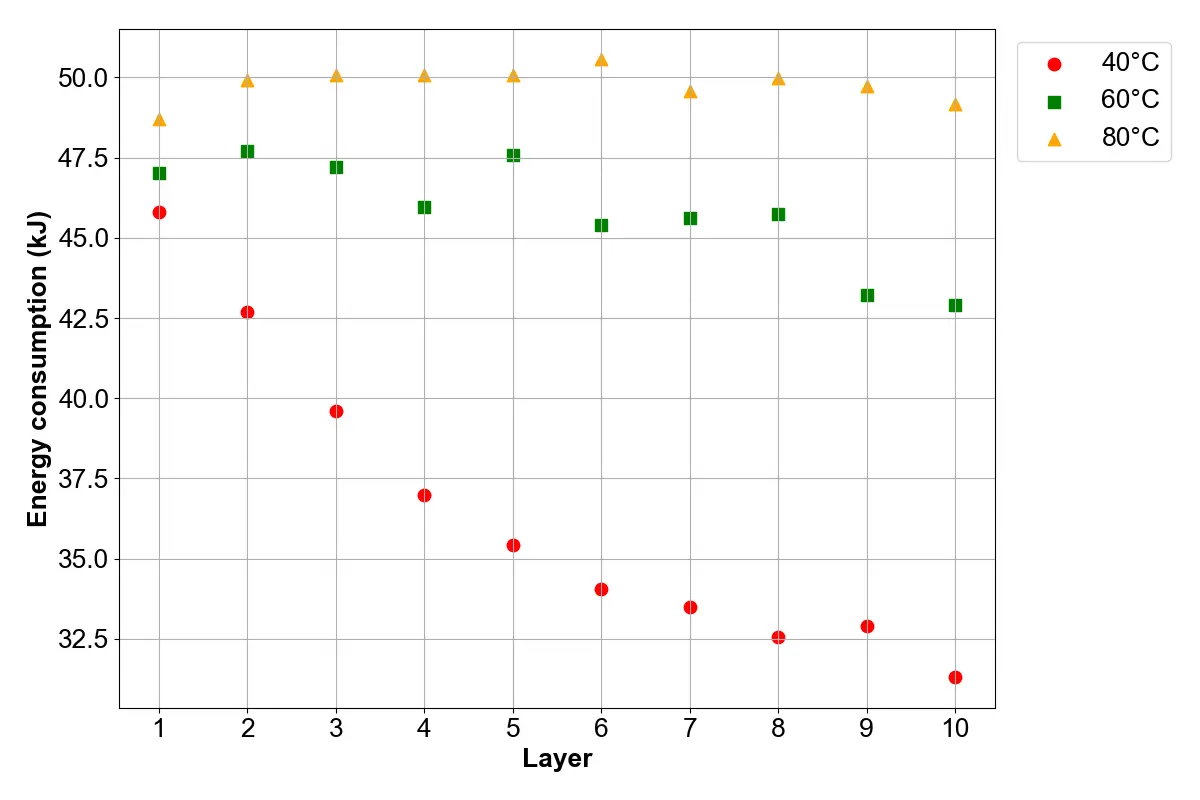
Figure 11 shows the energy consumption at each layer for different target powder bed temperatures, with drying times of 30 s (Figure 11a) and 60 s (Figure 11b), respectively. The results showed that energy consumption increased with target powder bed temperature. This outcome aligned with expectations, as achieving higher bed temperatures necessitated greater thermal energy input, thereby increasing energy consumption. An interesting observation was made at a target powder bed temperature of 40 °C, where the drying unit initially seemed to overshoot, consistent with Figure 10a,b. Subsequently, the system gradually reduced heat output to stabilize at the target powder bed temperature of 40 °C. This progressive reduction in heat output accounted for the observed decrease in energy consumption over time. Comparing Figure 11a with Figure 11b further revealed that longer drying times increased energy consumption across all target powder bed temperatures, as the drying unit remained active for longer.
The observed overshoot and instability in powder bed temperature, particularly at shorter drying times, can be interpreted in terms of the transient response of the printer’s thermal control system. The system operated under feedback control, where the drying unit adjusted its power output based on temperature measurements from the infrared sensor. However, potentially due to thermal inertia of the powder bed and delays in heat transfer and sensing, the system did not respond instantaneously to target powder bed temperature [33,34]. As a result, at shorter drying times, the control system exhibited delayed behavior, leading to overshoot or failure to reach the target temperature within a single layer. In contrast, at longer drying times, the system had sufficient time to approach steady-state conditions, resulting in improved temperature control.
 |
|
(a) |
 |
|
(b) |
Figure 10. Measured powder bed temperature at each layer, for different target temperatures (40, 60, and 80 °C). At shorter drying times, target powder bed temperatures were not reached, while at longer drying times, improved temperature control was observed. (a) Drying time of 30 s; (b) Drying time of 60 s.
 |
|
(a) |
 |
|
(b) |
Figure 11. Energy consumption at each layer, for different target powder bed temperatures (40, 60, and 80 °C). Energy consumption increased with target powder bed temperature, with higher and more stable energy consumption observed at longer drying times due to improved temperature control of the powder bed temperature. (a) Drying time of 30 s; (b) Drying time of 60 s.
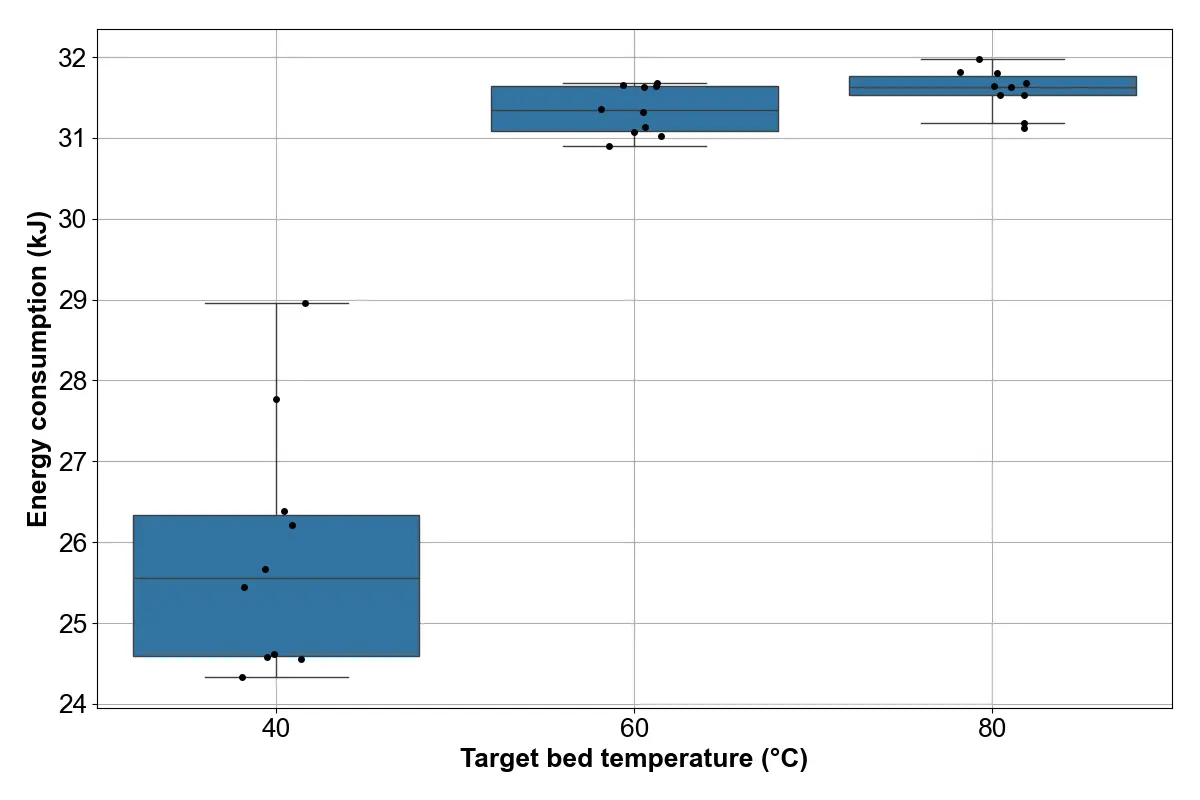
The descriptive statistics for the effects of target powder bed temperature on energy consumption are summarized in Table 6 and Table 7. Notably, the differences in mean energy consumption between the examined target powder bed temperatures were substantially larger than the corresponding standard deviations within each condition, particularly for longer drying times. This indicated a clear separation between the distributions of energy consumption values associated with different target powder bed temperatures. One-way Analysis of Variance (ANOVA) confirmed that target powder bed temperature had a statistically significant effect on energy consumption at both drying times (30 s: F = 22.99, p < 0.001; 60 s: F = 22.73, p < 0.001), providing statistical support for the separation between the energy consumption distributions associated with different target powder bed temperatures.
Figure 12 presents box plots of energy consumption across different layers at each of the three target powder bed temperatures (40, 60, and 80 °C) for drying times of 30 s (Figure 12a) and 60 s (Figure 12b), respectively.
Table 6. Descriptive statistics for the effects of target powder bed temperature on energy consumption, at drying time of 30 s.
|
Target Powder Bed Temperature (°C) |
Mean (kJ) |
Median (kJ) |
Minimum (kJ) |
Maximum (kJ) |
Q1 (kJ) |
Q3 (kJ) |
Standard Deviation (kJ) |
|---|---|---|---|---|---|---|---|
|
40 |
25.851 |
25.558 |
24.330 |
28.958 |
24.587 |
26.338 |
1.5314 |
|
60 |
31.343 |
31.340 |
30.904 |
31.679 |
31.090 |
31.637 |
0.2959 |
|
80 |
31.590 |
31.631 |
31.121 |
31.971 |
31.532 |
31.771 |
0.2686 |
Table 7. Descriptive statistics for the effects of target powder bed temperature on energy consumption, at drying time of 60 s.
|
Target Powder Bed Temperature (°C) |
Mean (kJ) |
Median (kJ) |
Minimum (kJ) |
Maximum (kJ) |
Q1 (kJ) |
Q3 (kJ) |
Standard Deviation (kJ) |
|---|---|---|---|---|---|---|---|
|
40 |
36.482 |
34.746 |
31.298 |
45.818 |
33.041 |
38.950 |
4.7961 |
|
60 |
45.839 |
45.860 |
42.917 |
47.701 |
45.466 |
47.152 |
1.6773 |
|
80 |
49.790 |
49.954 |
48.713 |
50.564 |
49.617 |
50.070 |
0.5233 |
 |
|
(a) |
 |
|
(b) |
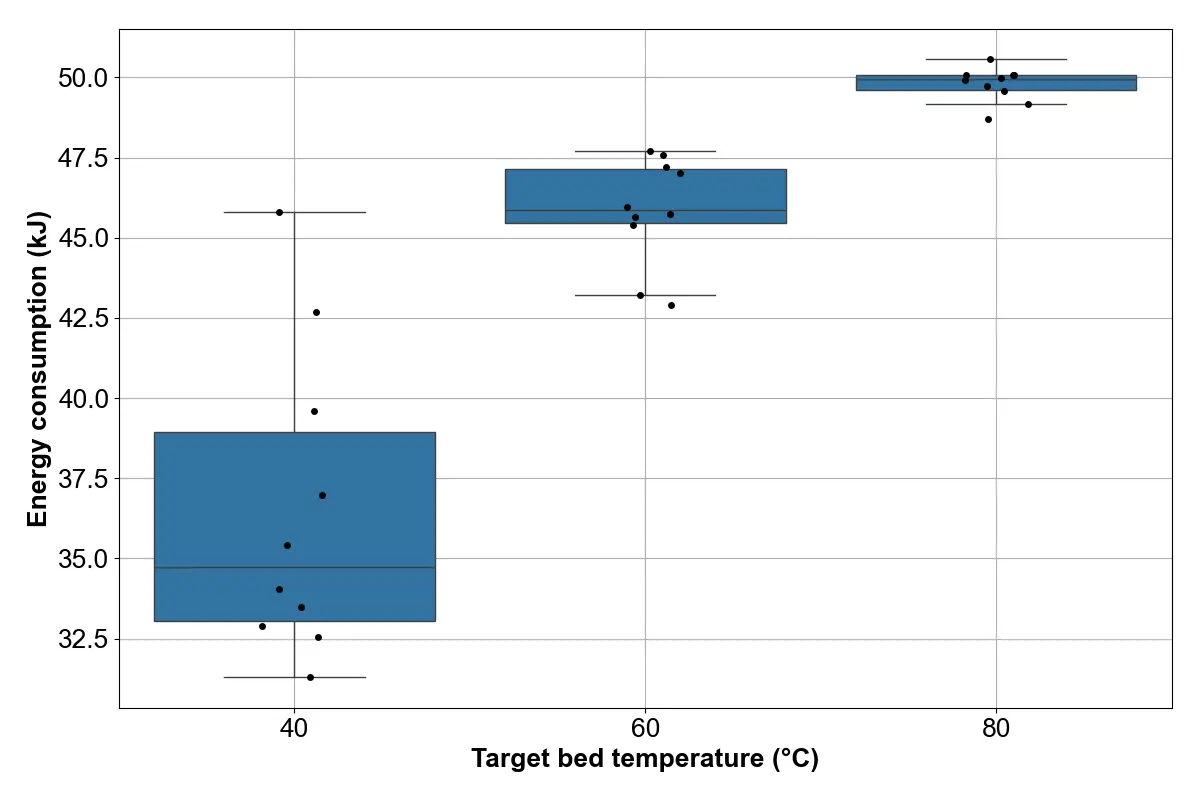
Figure 12. Box plots of energy consumption across layers, for different target powder bed temperatures (40, 60, and 80 °C). The energy consumption distributions shifted toward higher energy consumption with increasing target powder bed temperature, with clearer separation and reduced variability at longer drying times due to improved temperature control. (a) Drying time of 30 s; (b) Drying time of 60 s.
At a drying time of 30 s, the mean energy consumption increased noticeably with increasing target powder bed temperature. At a target powder bed temperature of 40 °C, the mean energy consumption was the lowest (25.851 kJ). Increasing the target powder bed temperature to 60 °C resulted in a substantial increase in mean energy consumption to 31.343 kJ, while a further increase in the target powder bed temperature to 80 °C led to only a modest additional increase in energy consumption to 31.590 kJ. The median energy consumption showed a similar trend, increasing from 25.558 kJ at a target temperature of 40 °C to 31.340 kJ at 60 °C and 31.631 kJ at 80 °C. At a target temperature of 40 °C, the median was slightly lower than the mean, suggesting a mild skewness to higher energy consumption values (positive skewness). The close agreement between the mean and median at target temperatures of 60 °C (also 80 °C) suggested an approximately symmetric distribution of energy consumption. At a target temperature of 40 °C, energy consumption values exhibited the widest spread, ranging from 24.330 to 28.958 kJ. This condition showed the largest IQR (24.587–26.338 kJ) and the highest standard deviation (1.5314 kJ), indicating significant variability across layers. Increasing the target powder bed temperature to 60 °C resulted in a pronounced increase in mean energy consumption, with values confined to a much narrower range of 30.904–31.679 kJ. The IQR (31.090–31.637 kJ) and the markedly lower standard deviation (0.2959 kJ) reflected significantly improved consistency in energy consumption among layers. At 80 °C, the mean energy consumption increased slightly further, spanning from 31.121 to 31.971 kJ. This condition maintained a narrow IQR (31.532–31.771 kJ) and low standard deviation (0.2686 kJ), indicating relatively uniform energy consumption across layers. Overall, increasing the target powder bed temperature from 40 °C to 60 °C led to both higher and more stable energy consumption, while further increasing the target powder bed temperature to 80 °C resulted in only minor additional changes because the printer needed longer time (more layers) to reach this target powder bed temperature.
At a drying time of 60 s, the mean energy consumption increased with target powder bed temperature. At a target powder bed temperature of 40 °C, the mean energy consumption was 36.482 kJ. Increasing the target powder bed temperature to 60 °C led to a substantial increase in mean energy consumption to 45.839 kJ, while a further increase to 80 °C resulted in the highest mean value of 49.790 kJ. Unlike with a 30 s drying time, the increase in mean energy consumption was more pronounced across the target powder bed temperature range, highlighting the combined effect of longer drying time and higher target powder bed temperature on energy consumption. The median energy consumption exhibited a similar increasing trend, rising from 34.746 kJ at 40 °C to 45.860 kJ at 60 °C and 49.954 kJ at 80 °C. At a target temperature of 40 °C, the median was notably lower than the mean, indicating a mild skewness to lower energy consumption values (negative skewness). At higher target powder bed temperatures, the median and mean were closer to each other, suggesting more symmetric energy consumption distributions. At a target powder bed temperature of 40 °C, energy consumption values ranged widely from 31.298 to 45.818 kJ, resulting in the largest IQR (33.041–38.950 kJ) and the highest standard deviation (4.7961 kJ) among the three target powder bed temperatures. This indicated substantial variability in energy consumption across layers. Increasing the target powder bed temperature to 60 °C led to a marked increase in mean energy consumption, with values of 42.917–47.701 kJ. The small IQR (45.466–47.152 kJ) and reduced standard deviation (1.6773 kJ) indicated improved consistency in energy consumption among layers comparing with when the target temperature was 40 °C. At a target powder bed temperature of 80 °C, energy consumption reached its highest values, ranging from 48.713 to 50.564 kJ. This condition exhibited the narrowest spread of the dataset, with a small IQR (49.617–50.070 kJ) and the lowest standard deviation (0.5233 kJ), indicating highly consistent energy consumption across layers. Overall, at longer drying times, higher target powder bed temperatures resulted not only in increased energy consumption but also reduced variability in energy consumption among layers.
4. Conclusions
This study systematically investigated the subsystem-level energy consumption of the ExOne Innovent+ binder jetting 3D printer. The experiments were conducted by analyzing the effects of three key process parameters: drying time, ultrasonic vibration intensity, and target powder bed temperature.
The results demonstrated that drying time and target powder bed temperature were primary drivers of energy consumption. Extended drying times led to prolonged use of the drying unit, significantly increasing energy consumption. Similarly, higher target powder bed temperatures, especially under long drying times, led to increased energy consumption. In contrast, ultrasonic vibration intensity exhibited a negligible effect on energy consumption. Additionally, the energy consumption of the ultrasonic vibration actuator did not change significantly whether the hopper contained powder or not under the tested conditions.
The trends observed in this study were consistent with those obtained from a model-based investigation regarding energy consumption in binder jetting [10]. Meteyer et al. identified thermal processes in binder jetting as significant contributors to overall energy consumption [10]. The findings of this study complement the work by Meteyer et al. by offering empirical insight into how specific process parameters affect energy consumption at the subsystem level.
The underlying physical mechanisms governing energy consumption, such as thermal energy required for drying and heating of the powder bed, are similar across many binder jetting printers. By relating process parameter selection to energy consumption, this study provides a foundation for addressing challenges related to energy-aware parameter selection, energy-efficient optimization, and sustainable design of binder jet additive manufacturing printers that employ infrared drying and ultrasonic hoppers to dispense the powder. Drying time can be minimized to the extent permitted by process and material requirements. To minimize drying time, binder formulations can be optimized. In contrast, ultrasonic vibration intensity may be selected primarily based on powder dispensing performance, and ultrasonic vibration subsystems can be optimized for better material handling rather than energy considerations. Higher target powder bed temperatures should be selected by balancing thermal requirements and energy efficiency, particularly during extended operation. Moreover, powder bed insulation may be improved to minimize heat loss.
The significant effects of drying time and target powder bed temperature on energy consumption could indicate a potential trade-off between energy efficiency and part quality. Increasing drying time and powder bed temperature can enhance solvent evaporation, improve layer stability, and promote powder bonding, thereby improving part integrity and dimensional accuracy [3]. However, these benefits could come at the cost of increased energy consumption. Conversely, reducing drying time or operating at lower target powder bed temperatures may decrease energy consumption but could lead to insufficient powder bonding, increased binder spreading, and reduced mechanical strength of the printed parts [35].
Several limitations of this study should be noted. Drying time, ultrasonic vibration intensity, and target powder bed temperature were varied independently to isolate their individual effects on energy consumption. Because the study used a one-factor-at-a-time (OFAT) experimental design, interaction effects between process parameters were not revealed. Future studies should extend this study by employing the factorial design or response surface methodologies to investigate the interaction effects of the process parameters on energy consumption. The present study provided foundational insight to guide such future studies, as parameters exhibiting negligible effect on energy consumption may be excluded, thereby enabling a more efficient and targeted multivariate analysis. Furthermore, experiments regarding the effects of drying time were performed under no-powder mock printing conditions to isolate the contribution of the drying unit to energy consumption, and therefore did not capture additional effects present in printing, such as binder evaporation and heat transfer within the powder bed. Additionally, the ultrasonic vibration experiments were conducted without any powder in the hopper, so the results characterized the effects of ultrasonic vibration intensity on the energy consumption of the vibrating empty hopper. Therefore, the findings do not represent the total energy consumption of the full binder jetting process during part fabrication. Another limitation of the study was that energy consumption was estimated from RMS current measurements assuming a constant voltage and a unity power factor; therefore, the reported values represented approximate measurements of energy consumption. Furthermore, at a drying time of 30 s, the powder bed temperature did not always reach the target powder bed temperature, reflecting the heating effort required by the printer to approach the target powder bed temperature, rather than steady-state conditions.
Author Contributions
Conceptualization, E.D. and J.S.; Methodology, J.S., A.B. and C.F.; Validation, A.B. and C.F.; Formal Analysis, A.B. and C.F.; Investigation, A.B. and C.F.; Resources, Z.P.; Data Curation, A.B. and C.F.; Writing—Original Draft Preparation, E.D. and J.S.; Writing—Review & Editing, E.D., J.S., A.B., C.F. and Z.P.; Visualization, J.S., A.B. and C.F.; Supervision, Z.P.; Project Administration, Z.P.
Ethics Statement
Not applicable.
Informed Consent Statement
Not applicable.
Data Availability Statement
The data that support the findings of this study are available from the corresponding author, E.D., upon reasonable request.
Funding
This research received no external funding.
Declaration of Competing Interest
The authors declare that they have no known competing financial interests or personal relationships that could have appeared to influence the work reported in this paper.
References
-
Aboulkhair NT, Bosio F, Gilani N, Phutela C, Hague RJM, Tuck CJ. Additive manufacturing processes for metals. In Quality Analysis of Additively Manufactured Metals; Elsevier: Amsterdam, The Netherlands, 2023; pp. 201–258. DOI:10.1016/B978-0-323-88664-2.00016-6 [Google Scholar]
-
Mostafaei A, Elliott AM, Barnes JE, Li F, Tan W, Cramer CL, et al. Binder jet 3D printing—Process parameters, materials, properties, modeling, and challenges. Prog. Mater. Sci. 2021, 119, 100707. DOI:10.1016/j.pmatsci.2020.100707 [Google Scholar]
-
Ziaee M, Crane NB. Binder jetting: A review of process, materials, and methods. Addit. Manuf. 2019, 28, 781–801. DOI:10.1016/j.addma.2019.05.031 [Google Scholar]
-
Oh J-W, Park J, Nahm S, Choi H. SiC-Si composite part fabrication via SiC powder binder jetting additive manufacturing and molten-Si infiltration. Int. J. Refract. Met. Hard Mater. 2021, 101, 105686. DOI:10.1016/j.ijrmhm.2021.105686 [Google Scholar]
-
Wang Y, Hou Y, Zhang L, Song Z, Wen G. Silicon carbide ceramics formed by binder jetting: A study focusing on the printing layer thickness and the PIP densification process. Ceram. Int. 2024, 50, 30894–30905. DOI:10.1016/j.ceramint.2024.05.395 [Google Scholar]
-
Du W, Singh M, Singh D. Binder jetting additive manufacturing of silicon carbide ceramics: Development of bimodal powder feedstocks by modeling and experimental methods. Ceram. Int. 2020, 46, 19701–19707. DOI:10.1016/j.ceramint.2020.04.098 [Google Scholar]
-
Cramer CL, Elliott AM, Lara-Curzio E, Flores-Betancourt A, Lance MJ, Han L, et al. Properties of SiC-Si made via binder jet 3D printing of SiC powder, carbon addition, and silicon melt infiltration. J. Am. Ceram. Soc. 2021, 104, 5467–5478. DOI:10.1111/jace.17933 [Google Scholar]
-
Khan F, Sanders J, Arman MS, Pasha MM, Kachur S, Pei Z. Fabrication of SiC–Aluminum Composites via Binder Jetting 3D Printing and Infiltration: A Feasibility Study. J. Compos. Sci. 2025, 9, 111. DOI:10.3390/jcs9030111 [Google Scholar]
-
Cheny T, Colin C, Gailliègue S, Calves P, Verquin B. Understanding drying dynamics in Binder Jetting: Development of a physical model for improved selection of drying parameters and better control of binder saturation. Addit. Manuf. 2025, 106, 104798. DOI:10.1016/j.addma.2025.104798 [Google Scholar]
-
Meteyer S, Xu X, Perry N, Zhao YF. Energy and Material Flow Analysis of Binder-jetting Additive Manufacturing Processes. Procedia CIRP 2014, 15, 19–25. DOI:10.1016/j.procir.2014.06.030 [Google Scholar]
-
Wei X, Moghadasi M, Du W, Ma C, Pei Z. Experimental investigation on ultrasonic hopper dispensing system in powder bed additive manufacturing. J. Manuf. Process. 2021, 71, 106–112. DOI:10.1016/j.jmapro.2021.08.040 [Google Scholar]
-
Fang X, Zu Y, Ma Q, Hu J. State of the art of metal powder bonded binder jetting printing technology. Discov. Mater. 2023, 3, 15. DOI:10.1007/s43939-023-00050-w [Google Scholar]
-
Oropeza D, Hart AJ. A laboratory-scale binder jet additive manufacturing testbed for process exploration and material development. Int. J. Adv. Manuf. Technol. 2021, 114, 3459–3473. DOI:10.1007/s00170-021-07123-1 [Google Scholar]
-
Persson G. Process Development for H13 Tool Steel Powder in Binder Jetting; Högskolan i Gävle: Gävle, Sweden, 2020. [Google Scholar]
-
Miyanaji H, Rahman KM, Da M, Williams CB. Effect of fine powder particles on quality of binder jetting parts. Addit. Manuf. 2020, 36, 101587. DOI:10.1016/j.addma.2020.101587 [Google Scholar]
-
Mostafaei A, De Vecchis PR, Kimes KA, Elhassid D, Chmielus M. Effect of binder saturation and drying time on microstructure and resulting properties of sinter-HIP binder-jet 3D-printed WC-Co composites. Addit. Manuf. 2021, 46, 102128. DOI:10.1016/j.addma.2021.102128 [Google Scholar]
-
Pasha MM, Pei Z, Kao Y-T, Dubovick K. Effects of Ultrasonic Vibration Intensity and Initial Powder Amount in the Hopper on Powder Dispensing Rate in Binder Jetting Additive Manufacturing. J. Manuf. Mater. Process. 2025, 9, 268. DOI:10.3390/jmmp9080268 [Google Scholar]
-
Xu X, Meteyer S, Perry N, Zhao YF. Energy consumption model of Binder-jetting additive manufacturing processes. Int. J. Prod. Res. 2015, 53, 7005–7015. DOI:10.1080/00207543.2014.937013 [Google Scholar]
-
Pasha MM, Arman MS, Khan F, Pei Z, Kachur S. Effects of Layer Thickness and Compaction Thickness on Green Part Density in Binder Jetting Additive Manufacturing of Silicon Carbide: Designed Experiments. J. Manuf. Mater. Process. 2024, 8, 148. DOI:10.3390/jmmp8040148 [Google Scholar]
-
Farzadi A, Solati-Hashjin M, Asadi-Eydivand M, Abu Osman NA. Effect of Layer Thickness and Printing Orientation on Mechanical Properties and Dimensional Accuracy of 3D Printed Porous Samples for Bone Tissue Engineering. PLoS ONE 2014, 9, e108252. DOI:10.1371/journal.pone.0108252 [Google Scholar]
-
Gaytan SM, Cadena MA, Karim H, Delfin D, Lin Y, Espalin D, et al. Fabrication of barium titanate by binder jetting additive manufacturing technology. Ceram. Int. 2015, 41, 6610–6619. DOI:10.1016/j.ceramint.2015.01.108 [Google Scholar]
-
Khan F, Pei Z, Arman MS, Kuntzendorf S, Kao Y-T. Effects of Dispense Delay and Recoat Speed on Green Part Density and Powder Bed Density in Binder Jetting Additive Manufacturing. J. Manuf. Mater. Process. 2026, 10, 80. DOI:10.3390/jmmp10030080 [Google Scholar]
-
Pasha MM, Pei Z, Arman MS, Kachur S. Effects of Binder Saturation and Drying Time in Binder Jetting Additive Manufacturing on Dimensional Deviation and Density of SiC Green Parts. J. Manuf. Mater. Process. 2026, 10, 26. DOI:10.3390/jmmp10010026 [Google Scholar]
-
Pasha MM, Arman MS, Pei Z, Khan F, Sanders J, Kachur S. Effects of Compaction Thickness on Density, Integrity, and Microstructure of Green Parts in Binder Jetting Additive Manufacturing of Silicon Carbide. J. Manuf. Mater. Process. 2025, 9, 136. DOI:10.3390/jmmp9040136 [Google Scholar]
-
Polozov I, Razumov N, Masaylo D, Silin A, Lebedeva Y, Popovich A. Fabrication of Silicon Carbide Fiber-Reinforced Silicon Carbide Matrix Composites Using Binder Jetting Additive Manufacturing from Irregularly-Shaped and Spherical Powders. Materials 2020, 13, 1766. DOI:10.3390/ma13071766 [Google Scholar]
-
Isakhani Zakaria M, Levänen E, Zakeri S. Effects of shell printing and directional infiltration in binder jetting and reaction sintering of silicon carbide. Ceram. Int. 2025, 51, 15215–15231. DOI:10.1016/j.ceramint.2025.01.358 [Google Scholar]
-
Choudhari A, Elder J, Mugale M, Karki S, Digole S, Omeike S, et al. Enhancing Quality Control: Image-Based Quantification of Carbides and Defect Remediation in Binder Jetting Additive Manufacturing. Materials 2024, 17, 2174. DOI:10.3390/ma17102174 [Google Scholar]
-
Ripka P. Electric current sensors: A review. Meas. Sci. Technol. 2010, 21, 112001. DOI:10.1088/0957-0233/21/11/112001 [Google Scholar]
-
Yeh S-T. Using trapezoidal rule for the area under a curve calculation. In Proceedings of the 27th Annual SAS User Group International (SUGI’27), Orlando, FL, USA, 14–17 April 2002. [Google Scholar]
-
Flick J, McCoy MJ, Bolt JJ, Hydock A, Inks TM, Dugan AS, et al. Powder Distribution System for Three-Dimensional Printer. US20200147884A1, 14 May 2019. [Google Scholar]
-
Schuirmann DJ. A comparison of the Two One-Sided Tests Procedure and the Power Approach for assessing the equivalence of average bioavailability. J. Pharmacokinet. Biopharm. 1987, 15, 657–680. DOI:10.1007/BF01068419 [Google Scholar]
-
Lakens D. Equivalence Tests. Soc. Psychol. Pers. Sci. 2017, 8, 355–362. DOI:10.1177/1948550617697177 [Google Scholar]
-
Almachi JC, Vicente R, Bone E, Montenegro J, Cando E, Reina S. Implementation of a Neural Network for Adaptive PID Tuning in a High-Temperature Thermal System. Energies 2025, 18, 3113. DOI:10.3390/en18123113 [Google Scholar]
-
Kuzmin A, Pinchuk V, Khudoliy S, Garcia Arango DA, Echeverri Gutiérrez CA, Echeverri Gutiérrez MS. Feasibility of proportional–integral–derivative control for high-inertia heating systems: Energy use and dynamic response. Appl. Therm. Eng. 2025, 272, 126784. DOI:10.1016/j.applthermaleng.2025.126784 [Google Scholar]
-
Miyanaji H, Zhang S, Yang L. A new physics-based model for equilibrium saturation determination in binder jetting additive manufacturing process. Int. J. Mach. Tools Manuf. 2018, 124, 1–11. DOI:10.1016/j.ijmachtools.2017.09.001 [Google Scholar]