Influence and Analysis of a Viscosity-Velocity Combined Prediction Model on the Dynamic Thermodynamic Performance of Shell-and-Tube Heat Exchangers in Offshore/Coastal Marine Energy Systems

Influence and Analysis of a Viscosity-Velocity Combined Prediction Model on the Dynamic Thermodynamic Performance of Shell-and-Tube Heat Exchangers in Offshore/Coastal Marine Energy Systems
Wenzhi Han 1,2 Na Qin 1,2,* Chengyao Liu 1,2 Shiwen Qin 1,2
Received: 17 March 2026 Revised: 21 April 2026 Accepted: 13 May 2026 Published: 25 May 2026

© 2026 The authors. This is an open access article under the Creative Commons Attribution 4.0 International License (https://creativecommons.org/licenses/by/4.0/).
Graphical Abstract
1. Introduction
Offshore wind power, coastal floating photovoltaics, and tidal energy are typical intermittent marine renewable energy sources [1]. Although they offer substantial decarbonisation potential, their fluctuating output makes it difficult to continuously satisfy the heating and cooling demands of offshore platforms, ports, and coastal facilities. To improve system reliability and overall utilization efficiency, these intermittent power sources need to be integrated with relatively stable thermal resources and heat recovery technologies [2]. Among the available options, the seawater- and sewage-source heat pump systems shown in Figure 1 are promising solutions because they can recover and upgrade low-grade thermal energy from seawater, coastal sewage, and platform wastewater [3,4]. In such systems, renewable electricity drives the heat pump unit, while the source-side heat exchanger provides a relatively stable thermal source or sink [5,6]. This complementary power-heat configuration offers a practical pathway for meeting the heating and cooling demands of offshore platforms, port facilities, and marine energy stations [7,8], while also improving energy efficiency and reducing carbon emissions [9,10]. For example, wave-induced oscillatory flows and tidal current variations can cause time-dependent velocity fluctuations at the seawater intake, which our viscosity-velocity combined model can potentially capture by treating flow velocity as a time-varying input. This connection directly links the present work to marine energy systems.
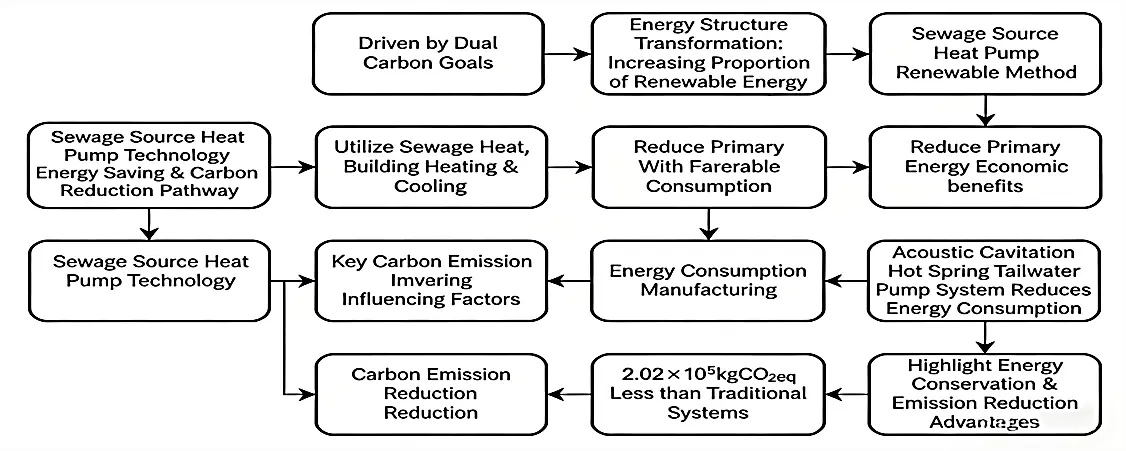
Previous studies have shown that seawater/sewage-source heat pump systems can improve energy efficiency [11], reduce pollutant emissions [12], lower operating costs, and decrease dependence on fossil fuels in marine and coastal energy applications [13,14]. For example, Huang [15] used a life cycle assessment shown in Figure 2 to evaluate the carbon performance of a heat pump system combined with offshore wind power and reported a substantial reduction in carbon emissions compared with a conventional system. In addition, optimization studies have demonstrated that suitable operational strategies can further improve system performance. Li [16] developed a variable-condition energy consumption model for a seawater/sewage-source heat pump system and reported that a variable-flow control strategy reduced annual operating costs by 5.8% relative to a conventional operating mode. Lu [17] proposed a hierarchical regulation strategy for seawater-source heat pump systems in coastal marine energy projects, achieving a 12% improvement in the system energy efficiency ratio through coordinated load-side and source-side control.
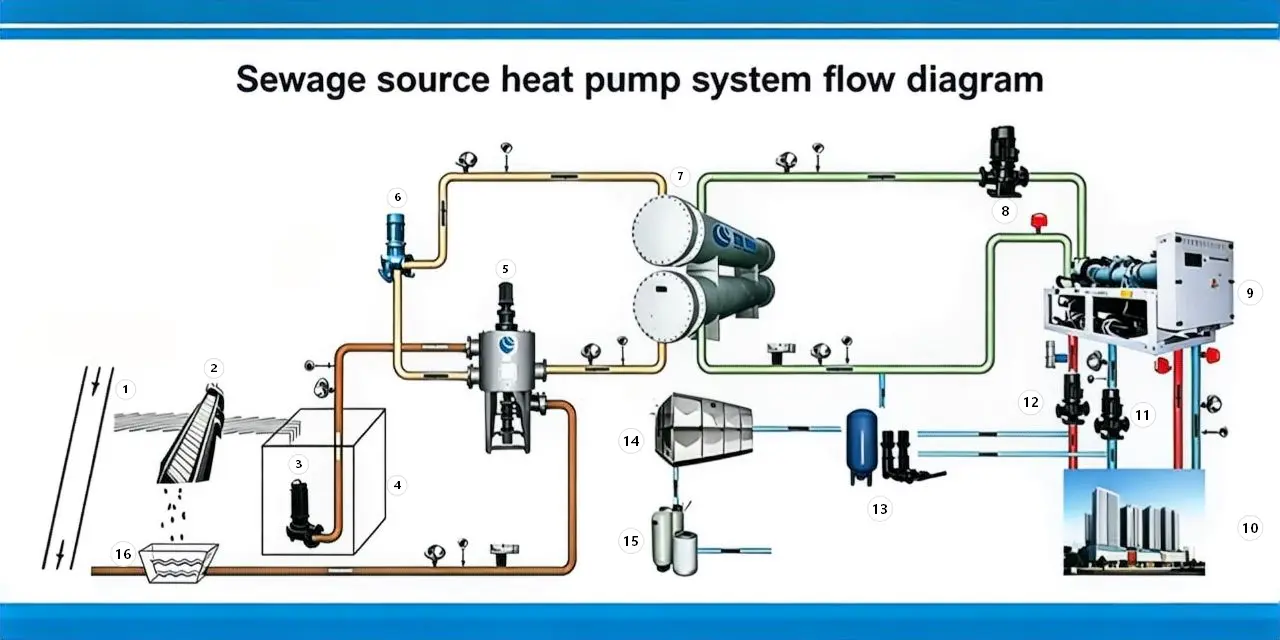
Figure 1. Flowchart of the Wastewater Source Heat Pump System. 1. Wastewater inlet; 2. Automatic Drille Machine; 3. Primary sewage submersible pump; 4. Sewage intake tank; 5. Fully automatic water intake and decontamination machine; 6. Secondary sewage circulating pump; 7. Sewage dedicated heat exchanger; 8. Intermediate water circulating pump; 9. Heat pump unit; 10. User terminal; 11. Refrigeration circulating pump; 12. Heating circulating pump; 13. Water replenishment and pressure stabilization device; 14. Make-up water tank; 15. Sodium-ion exchanger; 16. Wastewater discharge.
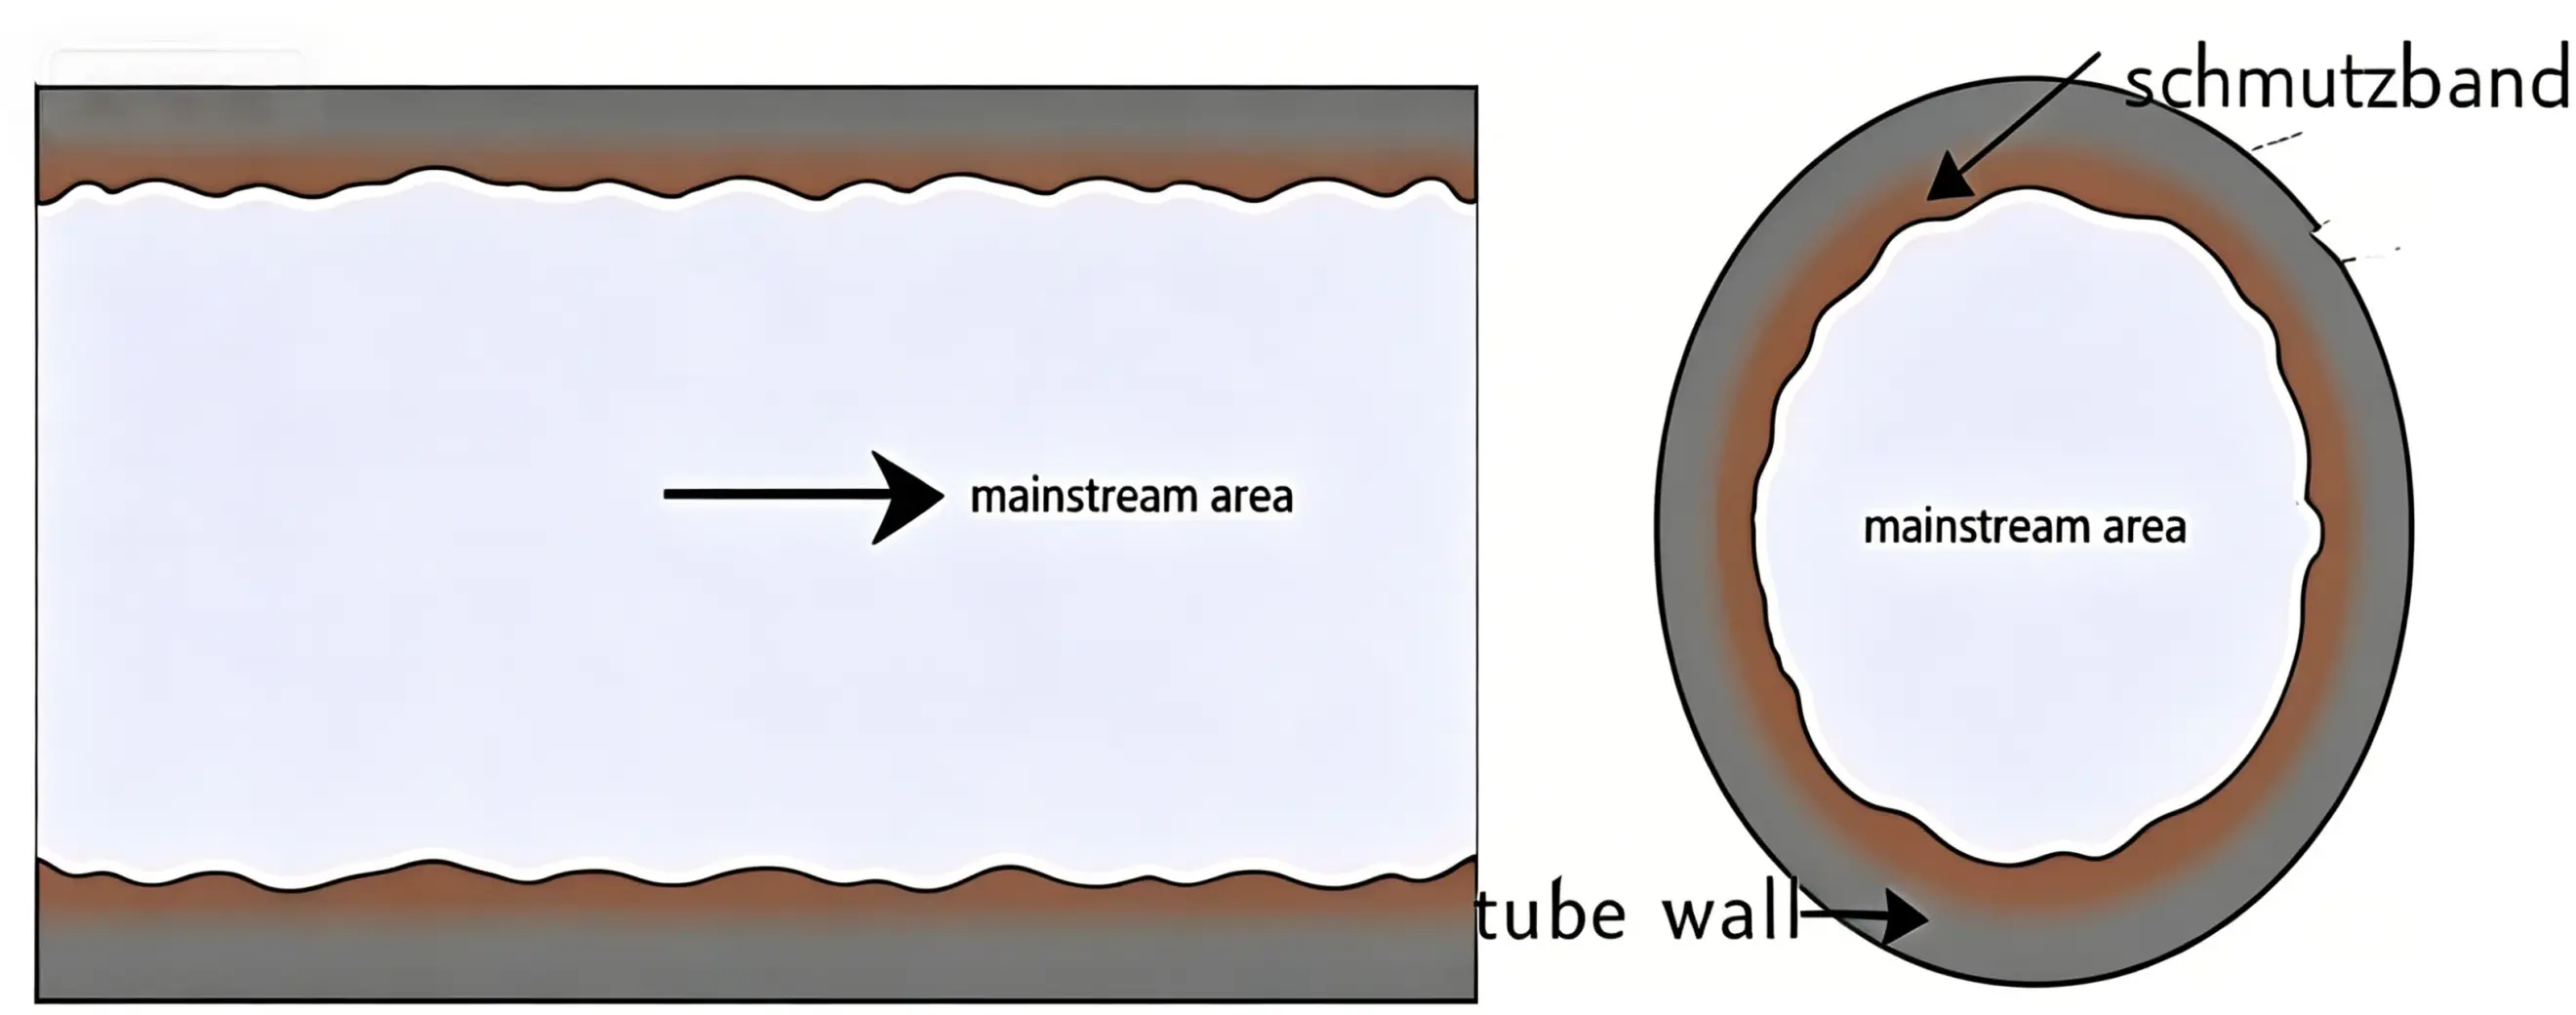
The source-side heat exchanger is one of the most important components in these systems because it directly determines thermal recovery performance, system stability, and long-term operating cost [18]. In marine and coastal applications, shell-and-tube heat exchangers (STHEs) are widely used owing to their structural robustness, operational reliability, and adaptability to complex service conditions. However, the long-term operation of sewage- and seawater-side STHEs is strongly constrained by fouling, corrosion, and transport degradation. During operation, suspended solids, microorganisms, colloids, inorganic salts, and other impurities may deposit on heat transfer surfaces and gradually form fouling layers, as shown in Figure 3 [19,20]. The resulting additional thermal resistance reduces heat transfer efficiency, increases energy consumption, and may eventually lead to partial blockage, unstable operation, and higher maintenance costs [21]. These problems are often more severe in marine environments, where salinity, biological activity, and fluctuating hydrodynamic conditions can accelerate both fouling and corrosion [22,23].
In seawater and sewage heat exchangers, fouling is frequently a mixed process involving both particulate and microbial components [24,25]. Such mixed fouling is particularly difficult to control [26,27] because particulate matter and microbial growth can reinforce each other during deposition and ageing [28,29,30]. For this reason, a wide range of mitigation strategies has been investigated, including fluidized descaling [31], internal flow-guiding structures [32], ultrasonic cavitation cleaning [33,34,35,36], electromagnetic treatment and surface modification [37,38,39]. At the same time, advances in numerical simulation and multiphysics modelling have improved the understanding of deposition, erosion, and thermal resistance growth in complex fouling systems [40,41,42]. Hydrodynamic and thermal conditions have been identified as especially important because they influence both transport behavior and fouling development. Reduced flow velocity has been shown to increase fouling resistance [43], while viscosity-flow combined can alter particle distribution and flow resistance in heat exchanger channels [44]. Other studies have shown that fouling resistance is also sensitive to particle concentration [45,46,47], operating temperature [48,49,50], wall roughness [51,52,53], and flow velocity [54,55].
Among the relevant parameters, wall temperature is particularly important because it reflects the combined state of flow, heat transfer, and fouling development within the STHE. Wall temperature directly affects the local temperature difference available for heat transfer between the source fluid and the secondary working fluid, and its transient variation can lead to nonlinear changes in the heat transfer coefficient. It is also closely linked to fouling initiation and evolution. Excessively high wall temperatures may accelerate the deposition of organic matter, whereas lower wall temperatures may favor crystallization under certain conditions. In addition, dynamic wall-temperature fluctuations may destabilize the fouling layer, leading to repeated detachment and redeposition and thereby increasing overall thermal resistance. Once fouling has developed, the added thermal resistance further delays the wall-temperature response and aggravates temperature non-uniformity, creating a feedback relationship between heat transfer deterioration and fouling growth.
Despite this progress, several issues remain unresolved for STHEs operating in seawater/sewage-source heat pump systems. First, existing studies have mainly focused on clean water, treated wastewater, or single-factor effects, while the combined influence of viscosity and flow velocity under fouling-prone sewage conditions has received less attention. Second, although wall temperature is a measurable and practically meaningful variable, dynamic prediction models that describe its response over a representative range of flow velocity and viscosity conditions are still limited. Third, the mechanisms governing nonlinear wall-temperature behavior under variable-viscosity conditions, especially the transition from strong fluctuation at low viscosity to a more stable response at high viscosity, remain insufficiently understood. These limitations hinder the design, operation, and performance assessment of STHEs for long-term marine and coastal thermal energy recovery.
To address these issues, the present study develops a dynamic wall-temperature prediction model for a shell-and-tube heat exchanger operating under variable-flow and variable-viscosity conditions relevant to seawater/sewage-source heat pump applications in marine energy systems. The investigated range covers flow velocities of 0.8–1.5 m/s and kinematic viscosities of 1.45 × 10⁻⁶–1.45 × 10⁻⁵ m2/s. Raw sewage is adopted as the working fluid, not as a substitute for seawater, but as a representative high-risk medium characterized by strong viscosity variation, suspended contaminants, and fouling tendency. The objective is to clarify how viscosity and flow velocity jointly affect the evolution of wall temperature and the dynamic thermal response under fouling-prone conditions. The resulting mechanism-level insight is expected to support the analysis and operation of STHEs used in seawater/sewage heat recovery systems and, more broadly, to facilitate the integration of relatively stable marine thermal resources with intermittent renewable electricity.
The main contributions of this study are as follows. First, a dynamic wall-temperature prediction model is developed for an STHE under combined viscosity-flow conditions. Second, the effects of viscosity and flow velocity on wall-temperature response are quantified over a representative operating range relevant to seawater/sewage-source heat pump systems. Third, the study provides mechanism-based insight into fouling-sensitive thermal behavior that may support exchanger operation in marine integrated energy systems.
2. Model Establishment
2.1. Calculated Operating Conditions
The system parameters are: heat load Q = 1080 kW, inlet sewage temperature $$\text{(}{\text{t}}_{\text{s1}}$$ = 15 °C), outlet temperature ($${\text{t}}_{\text{s2}}$$ = 10 °C), refrigerant water inlet temperature $$\text{(}{\text{t}}_{\text{w1}}$$ = 7 °C), outlet temperature ($${\text{t}}_{\text{w2}}$$ = 12 °C). The heat exchanger tube bundle features inner tubes (di = 20 mm)and outer tubes(do = 25 mm). The selected materials are seamless steel-nickel steel, which offers excellent machinability, cost-effectiveness, corrosion resistance to salt-laden sewage in marine environments, and structural stability. The wall thickness of the heat transfer tubes is determined by their thermal conductivity (ω ≈ 3.5%, thermal conductivity: λb = 14.4 W/(m·K), wall thickness: $${\text{δ}}_{\text{b}}\text{ }\text{=}\text{ }\text{2.5}\text{ }\text{×}\text{ }\text{1}{\text{0}}^{-\text{3}}\text{ }\text{m}$$).
Notably, the viscosity range (1.45 × 10⁻⁶–1.45 × 10⁻⁵ m2/s) covers the characteristics of coastal sewage (mixed with seawater) and offshore platform wastewater, ensuring the model’s applicability in marine energy complementarity scenarios.
|
```latex\Delta t_{\mathrm{m}} = \dfrac{\Delta t_{\max} - \Delta t_{\min}}{2}``` |
(1) |
|
```latex\mathrm{Q=c_w\dot{m}_w(t_{w2}~-~t_{w1})=c_s\dot{m}_s(t_{s1}~-~t_{s2})}``` |
(2) |
|
```latex\mathrm{Re_w=\frac{v_w\rho_wd_i}{\mu_w}}``` |
(3) |
$$\text{δ}$$—wall thickness, [m]; ω—structural stability characteristic; Δt—temperature difference, [℃]
Q—heat exchange capacity, [kW]; t—temperature, [℃]; c—specific heat capacity, [kJ/(kg·℃)]
ṁ—mass flow rate, [kg/s]; d—tube diameter, [mm]; Re—Reynolds number
v—flow velocity, [m/s]; ρ—density, [kg/m3]; μ—dynamic viscosity, [kg/(m·s)]; i—inner diameter
s—sewage water side; w—water side; s1—sewage water inlet; s2—sewage water outlet
w1—water inlet; w2—water outlet.
The cross-sectional area of fluid flow in the tube row near the center of the heat exchanger is:
|
```latex\mathrm{A}_0=\mathrm{e}\mathrm{D}(1-\frac{\mathrm{d}_0}{\mathrm{t}^{\prime}})``` |
(4) |
0—flow area; A—heat transfer area, [m2]; D—shell diameter, [mm]; e—baffle spacing, [mm]; o—outer diameter; t'—tube pitch, [mm]
Arranged in a regular triangle:
|
```latex\mathrm{d_i=\frac{4(\frac{\sqrt{3}}{2}t^{\prime2}-\frac{\pi d_o^2}{4})}{\pi d_o}}``` |
(5) |
The Prandtl numbers for the water side and wastewater side can be obtained from tables and calculated separately based on their temperatures and viscosities. As Rew ranges from 2 × 10³ to 1 × 10⁶. Set $$\Phi_{\mu}$$ = 1.05.
|
```latex\mathrm{h_w=0.36\cdot\frac{\lambda_w}{d_i}(Re_w)^{0.55}(Pr_w)^{\frac{1}{3}}\Phi_\mu}``` |
(6) |
|
```latex\mathrm{Re_s=\frac{\rho_sd_iv_s}{\mu_s}}``` |
(7) |
|
```latex\mathrm{h_s=0.36\cdot\frac{\lambda_s}{d_i}(Re_s)^{0.55}(Pr_s)^{\frac{1}{3}}\Phi_\mu}``` |
(8) |
|
```latex\mathrm{K=\frac{1}{\frac{1}{h_s}+r_s+r_w\frac{d_o}{d_i}+\frac{d_o}{h_wd_i}}}``` |
(9) |
|
```latex\mathrm{A_w=\frac{Q}{h_w(t_{w2}-t_{w1})}}``` |
(10) |
|
```latex\mathrm{A_s=\frac{Q}{h_s(t_{s1}-t_{s2})}}``` |
(11) |
|
```latex\mathrm{A=\frac{1.2Q}{K\cdot\Delta t_m}}``` |
(12) |
h—heat transfer coefficient, [W/(m2·℃)]; Pr—Prandtl number; λ—thermal conductivity, [W/(m·℃)]; r—fouling resistance, [(m²·℃)/W]; K—overall heat transfer coefficient of heat exchanger, [W/(m2·℃)].
2.2. Transfer Function Model
In the previous section, Equation (1), Equation (2), Equation (3), Equation (4), Equation (5), Equation (6), Equation (7), Equation (8), Equation (9), Equation (10), Equation (11) and Equation (12) describe the steady-state thermal calculation and the determination of the basic parameters for the shell-and-tube heat exchanger, including the heat transfer area, convective heat transfer coefficients, and overall heat transfer coefficient. These parameters provide the basis for the subsequent dynamic modelling.
It should be noted that the present study focuses on the combined effects of viscosity and flow velocity rather than on a simple superposition of independent steady-state influences. Although viscosity and flow velocity are introduced as separate input variables, they jointly govern the Reynolds number, turbulence intensity, boundary-layer development, and overall thermal resistance. In this work, their interactive influence on the dynamic wall-temperature response is referred to as the viscosity-flow coupling effect.
Based on the lumped-parameter method and transient energy balance, a dynamic transfer-function model is developed to characterize the time-domain response of the heat exchanger under different combinations of viscosity and flow velocity. The governing equations are derived as follows:
|
```latex\mathrm{c_w\dot{m}_w(t_{w2}-t_{w1})=h_wA_w(t_b-\frac{t_{w2}+t_{w1}}{2})}``` |
(13) |
|
```latex\mathrm{c_s\dot{m}_s(t_{s1}-t_{s2})=h_sA_s(\frac{t_{s2}+t_{s1}}{2}-t_b)}``` |
(14) |
By rearranging Equation (13) and Equation (14), we obtain Equation (15) and Equation (16), where the values of a and b are determined by Equation (17). Assume a linear temperature distribution approximation for heat exchange. Where a, b are distribution coefficients determined by heat transfer conditions.
|
```latex{\text{t}}_{\text{w2}}\text{= }\frac{\text{2a}}{\text{2}\text{ }\text{+}\text{ }\text{a}}{\text{t}}_{\text{b}}\text{+}\frac{\text{2}\text{ }-\text{ }\text{a}}{\text{2}\text{ }\text{+}\text{ }\text{a}}{\text{t}}_{\text{w1}}``` |
(15) |
|
```latex{\text{t}}_{\text{s2}}\text{= }\frac{\text{2b}}{\text{2}\text{ }\text{+}\text{ }\text{b}}{\text{t}}_{\text{b}}\text{+}\frac{\text{2}\text{ }-\text{ }\text{b}}{\text{2}\text{ }\text{+}\text{ }\text{b}}{\text{t}}_{\text{s1}}``` |
(16) |
|
```latex\mathrm{a=\frac{h_{w}A_{w}}{c_{w}m_{w}},b=\frac{h_{s}A_{s}}{c_{s}m_{s}}}``` |
(17) |
The net heat flow into the wall equals the rate of change of internal energy storage:
|
```latex\mathrm{c_bm_b\frac{dt_b}{d\tau}=h_sA_s(\frac{t_{s2}+t_{s1}}{2}-t_b)-h_wA_w(t_b-\frac{t_{w2}+t_{w1}}{2})}``` |
(18) |
b—heat exchanger tube bundle; τ—time constant, [s]; m—mass, [kg].
Substitute Equation (15) and Equation (16) into Equation (18) and rearrange. Take the Laplace transform with zero initial conditions:
|
```latex{\text{c}}_{\text{b}}{\text{m}}_{\text{b}}\frac{\text{d}{\text{t}}_{\text{b}}}{\text{dt}}\text{ }\text{=}\text{ }\left({\text{h}}_{\text{s}}{\text{A}}_{\text{s}}\frac{\text{2b}}{\text{2}\text{ }\text{+}\text{ }\text{b}}\text{ }-\text{ }{\text{h}}_{\text{w}}{\text{A}}_{\text{w}}\frac{\text{2a}}{\text{2}\text{ }\text{+}\text{ }\text{a}}\right){\text{t}}_{\text{b}} + {\text{h}}_{\text{s}}{\text{A}}_{\text{s}}\left(\frac{\text{2}\text{ }-\text{ }\text{b}}{\text{2}\text{ }\text{+}\text{ }\text{b}}\text{ }\text{+}\text{ }\text{1}\right){\text{t}}_{\text{s1}}\text{ }\text{+}\text{ }{\text{h}}_{\text{w}}{\text{A}}_{\text{w}}\left(\frac{\text{2a}}{\text{2}\text{ }\text{+}\text{ }\text{a}}\text{ }\text{+}\text{ }\text{1}\right){\text{t}}_{\text{w1}}``` |
(19) |
|
```latex{\text{c}}_{\text{b}}{\text{m}}_{\text{b}} \cdotp\text{s}\text{ }\text{=}\text{ }\left({\text{h}}_{\text{s}}{\text{A}}_{\text{s}}\frac{\text{2b}}{\text{2}\text{ }\text{+}\text{ }\text{b}}\text{ }-\text{ }{\text{h}}_{\text{w}}{\text{A}}_{\text{w}}\frac{\text{2a}}{\text{2}\text{ }\text{+}\text{ }\text{a}}\right){\text{t}}_{\text{b}}\left(\mathrm{s}\right) + {\text{h}}_{\text{s}}{\text{A}}_{\text{s}}\left(\frac{\text{2}\text{ }-\text{ }\text{b}}{\text{2}\text{ }\text{+}\text{ }\text{b}}\text{ }\text{+}\text{ }\text{1}\right){\text{t}}_{\text{s1}}\text{(s)}\text{ }\text{+}{\text{ }\text{h}}_{\text{w}}{\text{A}}_{\text{w}}\left(\frac{\text{2a}}{\text{2}\text{ }\text{+}\text{ }\text{a}}\text{ }\text{+}\text{ }\text{1}\right){\text{t}}_{\text{w1}}\left(\mathrm{s}\right)``` |
(20) |
The wall temperature transfer function (input: ts1, tw1; output: tb) is:
|
```latex{\text{t}}_{\text{b}}=\frac{{\text{h}}_{\text{s}}{\text{A}}_{\text{s}}\left(\frac{\text{2}\text{ }-\text{ }\text{b}}{\text{2}\text{ }+\text{ }\text{b}}\text{ }+\text{ }\text{1}\right){\text{t}}_{\text{s1}}+{\text{h}}_{\text{w}}{\text{A}}_{\text{w}}\left(\frac{\text{2a}}{\text{2}\text{ }+\text{ }\text{a}}\text{ }+\text{ }\text{1}\right){\text{t}}_{\text{w1}}}{\text{2}{\text{c}}_{\text{b}}{\text{m}}_{\text{b}}\text{s}\text{ }-\text{ }\text{(}{\text{h}}_{\text{s}}{\text{A}}_{\text{s}}\frac{\text{2b}}{\text{2}\text{ }+\text{ }\text{b}}\text{ }-\text{ }\text{2)}\text{ }-{\text{h}}_{\text{w}}{\text{A}}_{\text{w}}\left(\frac{\text{2a}}{\text{2}\text{ }+\text{ }\text{a}}-\text{ }\text{2}\right)}``` |
(21) |
In this model, viscosity directly affects the heat transfer coefficients, hs and hw, while flow velocity simultaneously influences the Reynolds number and turbulence intensity, thereby further affecting both the magnitude and response rate of wall temperature. These two parameters act together to determine the dynamic thermal behavior of the exchanger, forming the internal coupling relationship represented in the model. The proposed framework should therefore be understood as a dynamic prediction model that accounts for viscosity-flow coupling, rather than as a simple steady-state calculation. It is capable of describing the dynamic wall-temperature response under different coupling conditions and provides the basis for the subsequent analysis of dynamic thermal characteristics.
Under the condition of a fixed heat transfer area, A = 432 m2, the calculated parameters hs, hw, and cb and mb were substituted into the governing equations to obtain the numerical transfer functions. The corresponding data are listed in Table 1.
Table 1. Heat exchanger design parameters (sewage viscosity of 1.45 × 10⁻⁵ m2/s).
|
Flow Velocity (m/s) |
Sewage-Side Heat Transfer Coefficient W/(m2·°C) |
Water-Side Heat Transfer Coefficient W/(m2·°C) |
Overall Heat Transfer Coefficient W/(m2·°C) |
cb |
mb |
a |
b |
tb |
|---|---|---|---|---|---|---|---|---|
|
$${u}_{s}=0.8$$ |
2423.59 |
7131.83 |
992.18 |
0.469 |
3952.5 |
14.15 |
4.81 |
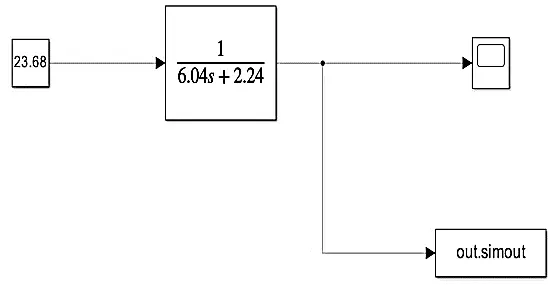
$${t}_{b}=\frac{{t}_{s1}+1.24{t}_{w1}}{6.04s+2.24}$$ |
|
$${u}_{s}=1.2$$ |
3029.06 |
8913.57 |
1123.13 |
0.469 |
3952.5 |
17.69 |
6.01 |
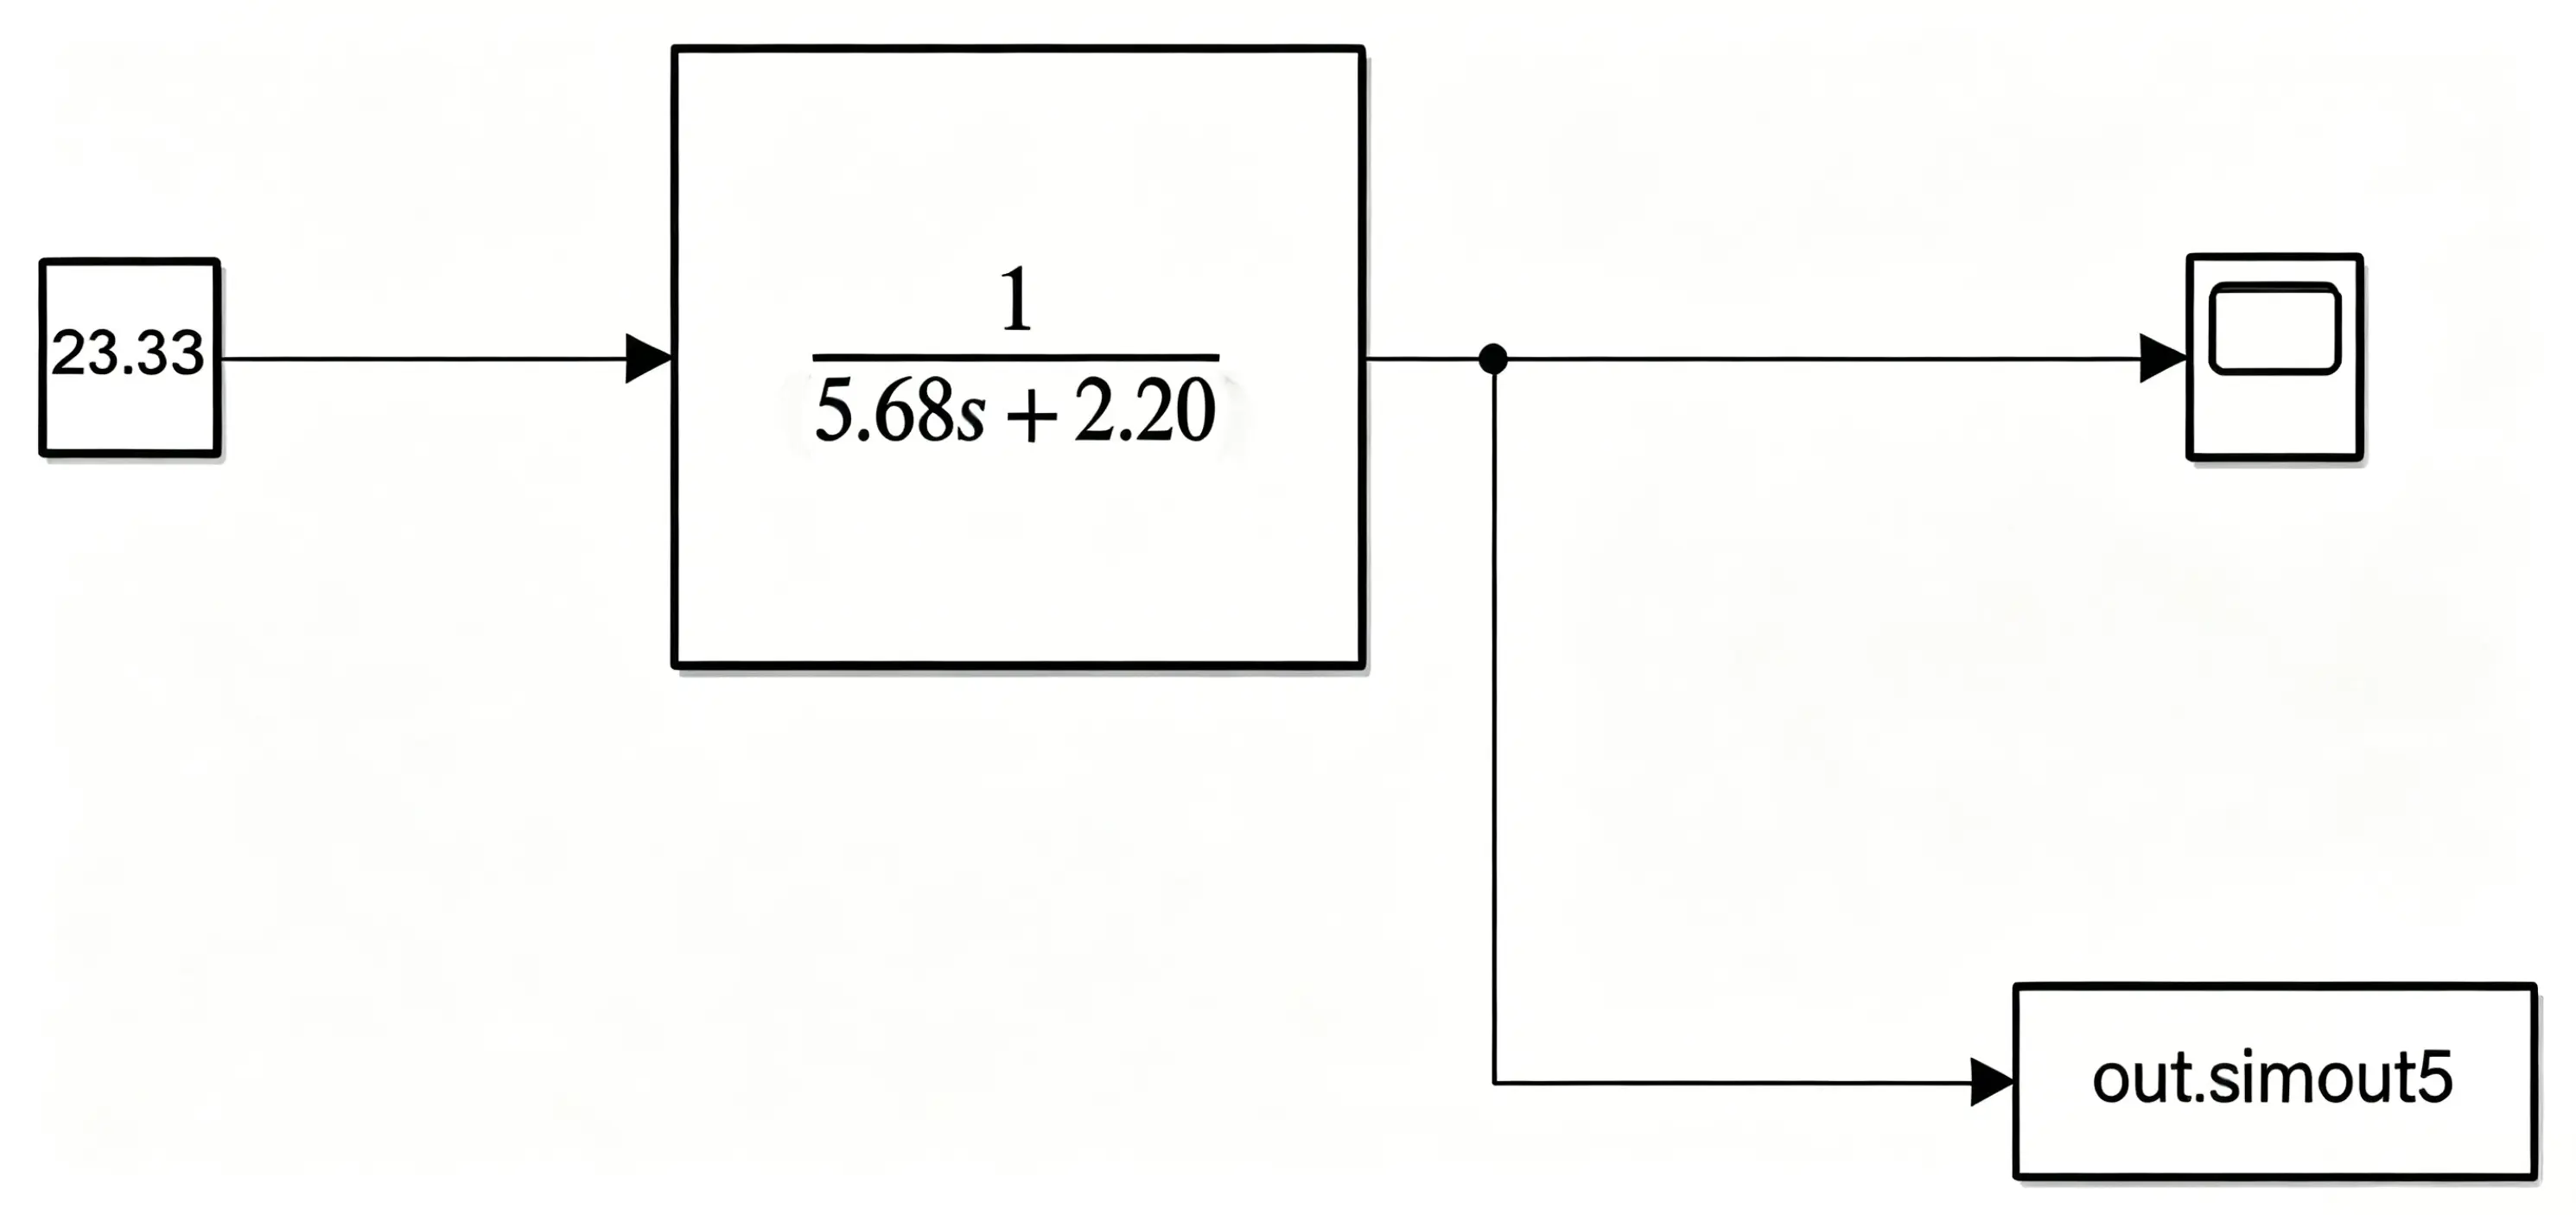
$${t}_{b}=\frac{{t}_{s1}+1.20{t}_{w1}}{5.68s+2.20}$$ |
|
$${u}_{s}=1.5$$ |
3424.59 |
10,077.48 |
1196.11 |
0.469 |
3952.5 |
20.00 |
6.79 |
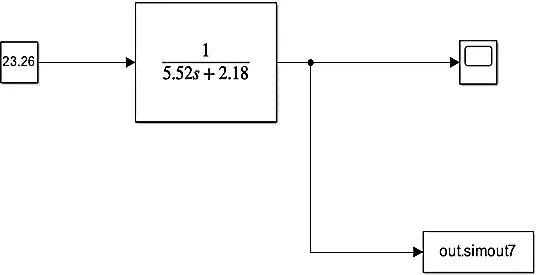
$${t}_{b}=\frac{{t}_{s1}+1.18{t}_{w1}}{5.52s+2.18}$$ |
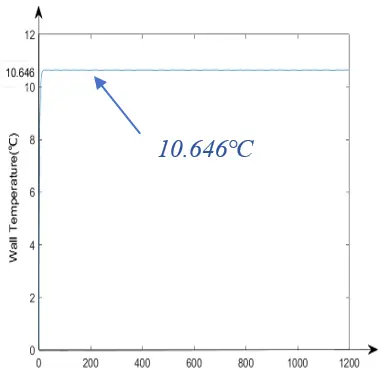
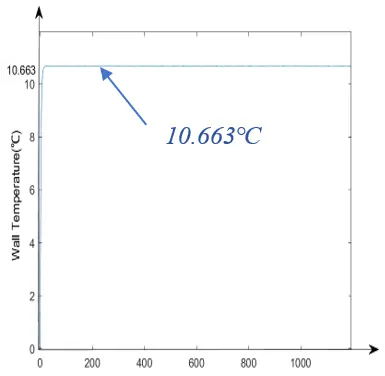
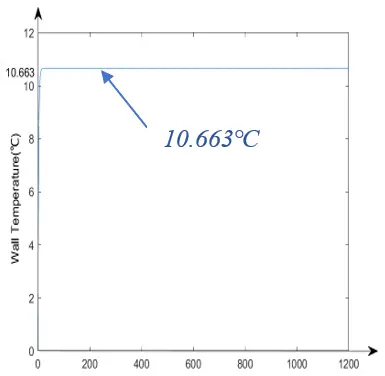
The transfer function model for wastewater with viscosity 1.45 × 10⁻⁵ m2/s under three typical velocity (low-speed to high-speed) models is illustrated in the Figure 4.
 |
|
(a) |
 |
|
(b) |
 |
|
(c) |
Figure 4. Dynamic Transfer Function Model. (a) Sewage velocity of 0.8 m/s; (b) Sewage velocity of 1.2 m/s; (c) Sewage velocity of 1.5 m/s.
3. Results and Discussion
3.1. Effect of Wall Temperature Change Under High Viscosity
In this study, the wall temperature variation curves under different flow velocities were observed for sewage with extreme viscosity. First, the wall temperature changes at response times of 100 s, 600 s, and 1200 s were verified for each velocity, as shown in Table 2. For comparative analysis, dynamic simulation results for plate heat exchangers under identical operating conditions were added. A time-step independence test was further performed to evaluate the numerical stability of the transient calculation. The results indicate that the predicted wall temperature gradually approached a stable state and became effectively steady after 1200 s. The deviation between the tested time-step cases was less than 1.8%, indicating that the selected temporal discretization provides sufficient numerical accuracy and stability for the present dynamic simulations. These results support the reliability of the proposed dynamic simulation framework.
Table 2. Time-step independence verification (sewage viscosity of 1.45 × 10⁻⁵ m2/s).
|
Response Time (s) |
Wall Temperature of Shell and Tube Heat Exchanger (°C) |
Velocity (m/s) |
Wall Temperature of Plate Heat Exchanger (°C) |
Velocity (m/s) |
||||
|
0.8 |
1.2 |
1.5 |
0.8 |
1.2 |
1.5 |
|||
|
100 |
10.570 |
10.635 |
10.668 |
10.697 |
10.721 |
10.732 |
||
|
600 |
10.568 |
10.634 |
10.667 |
10.697 |
10.721 |
10.727 |
||
|
1200 |
10.567 |
10.636 |
10.664 |
10.697 |
10.721 |
10.733 |
||
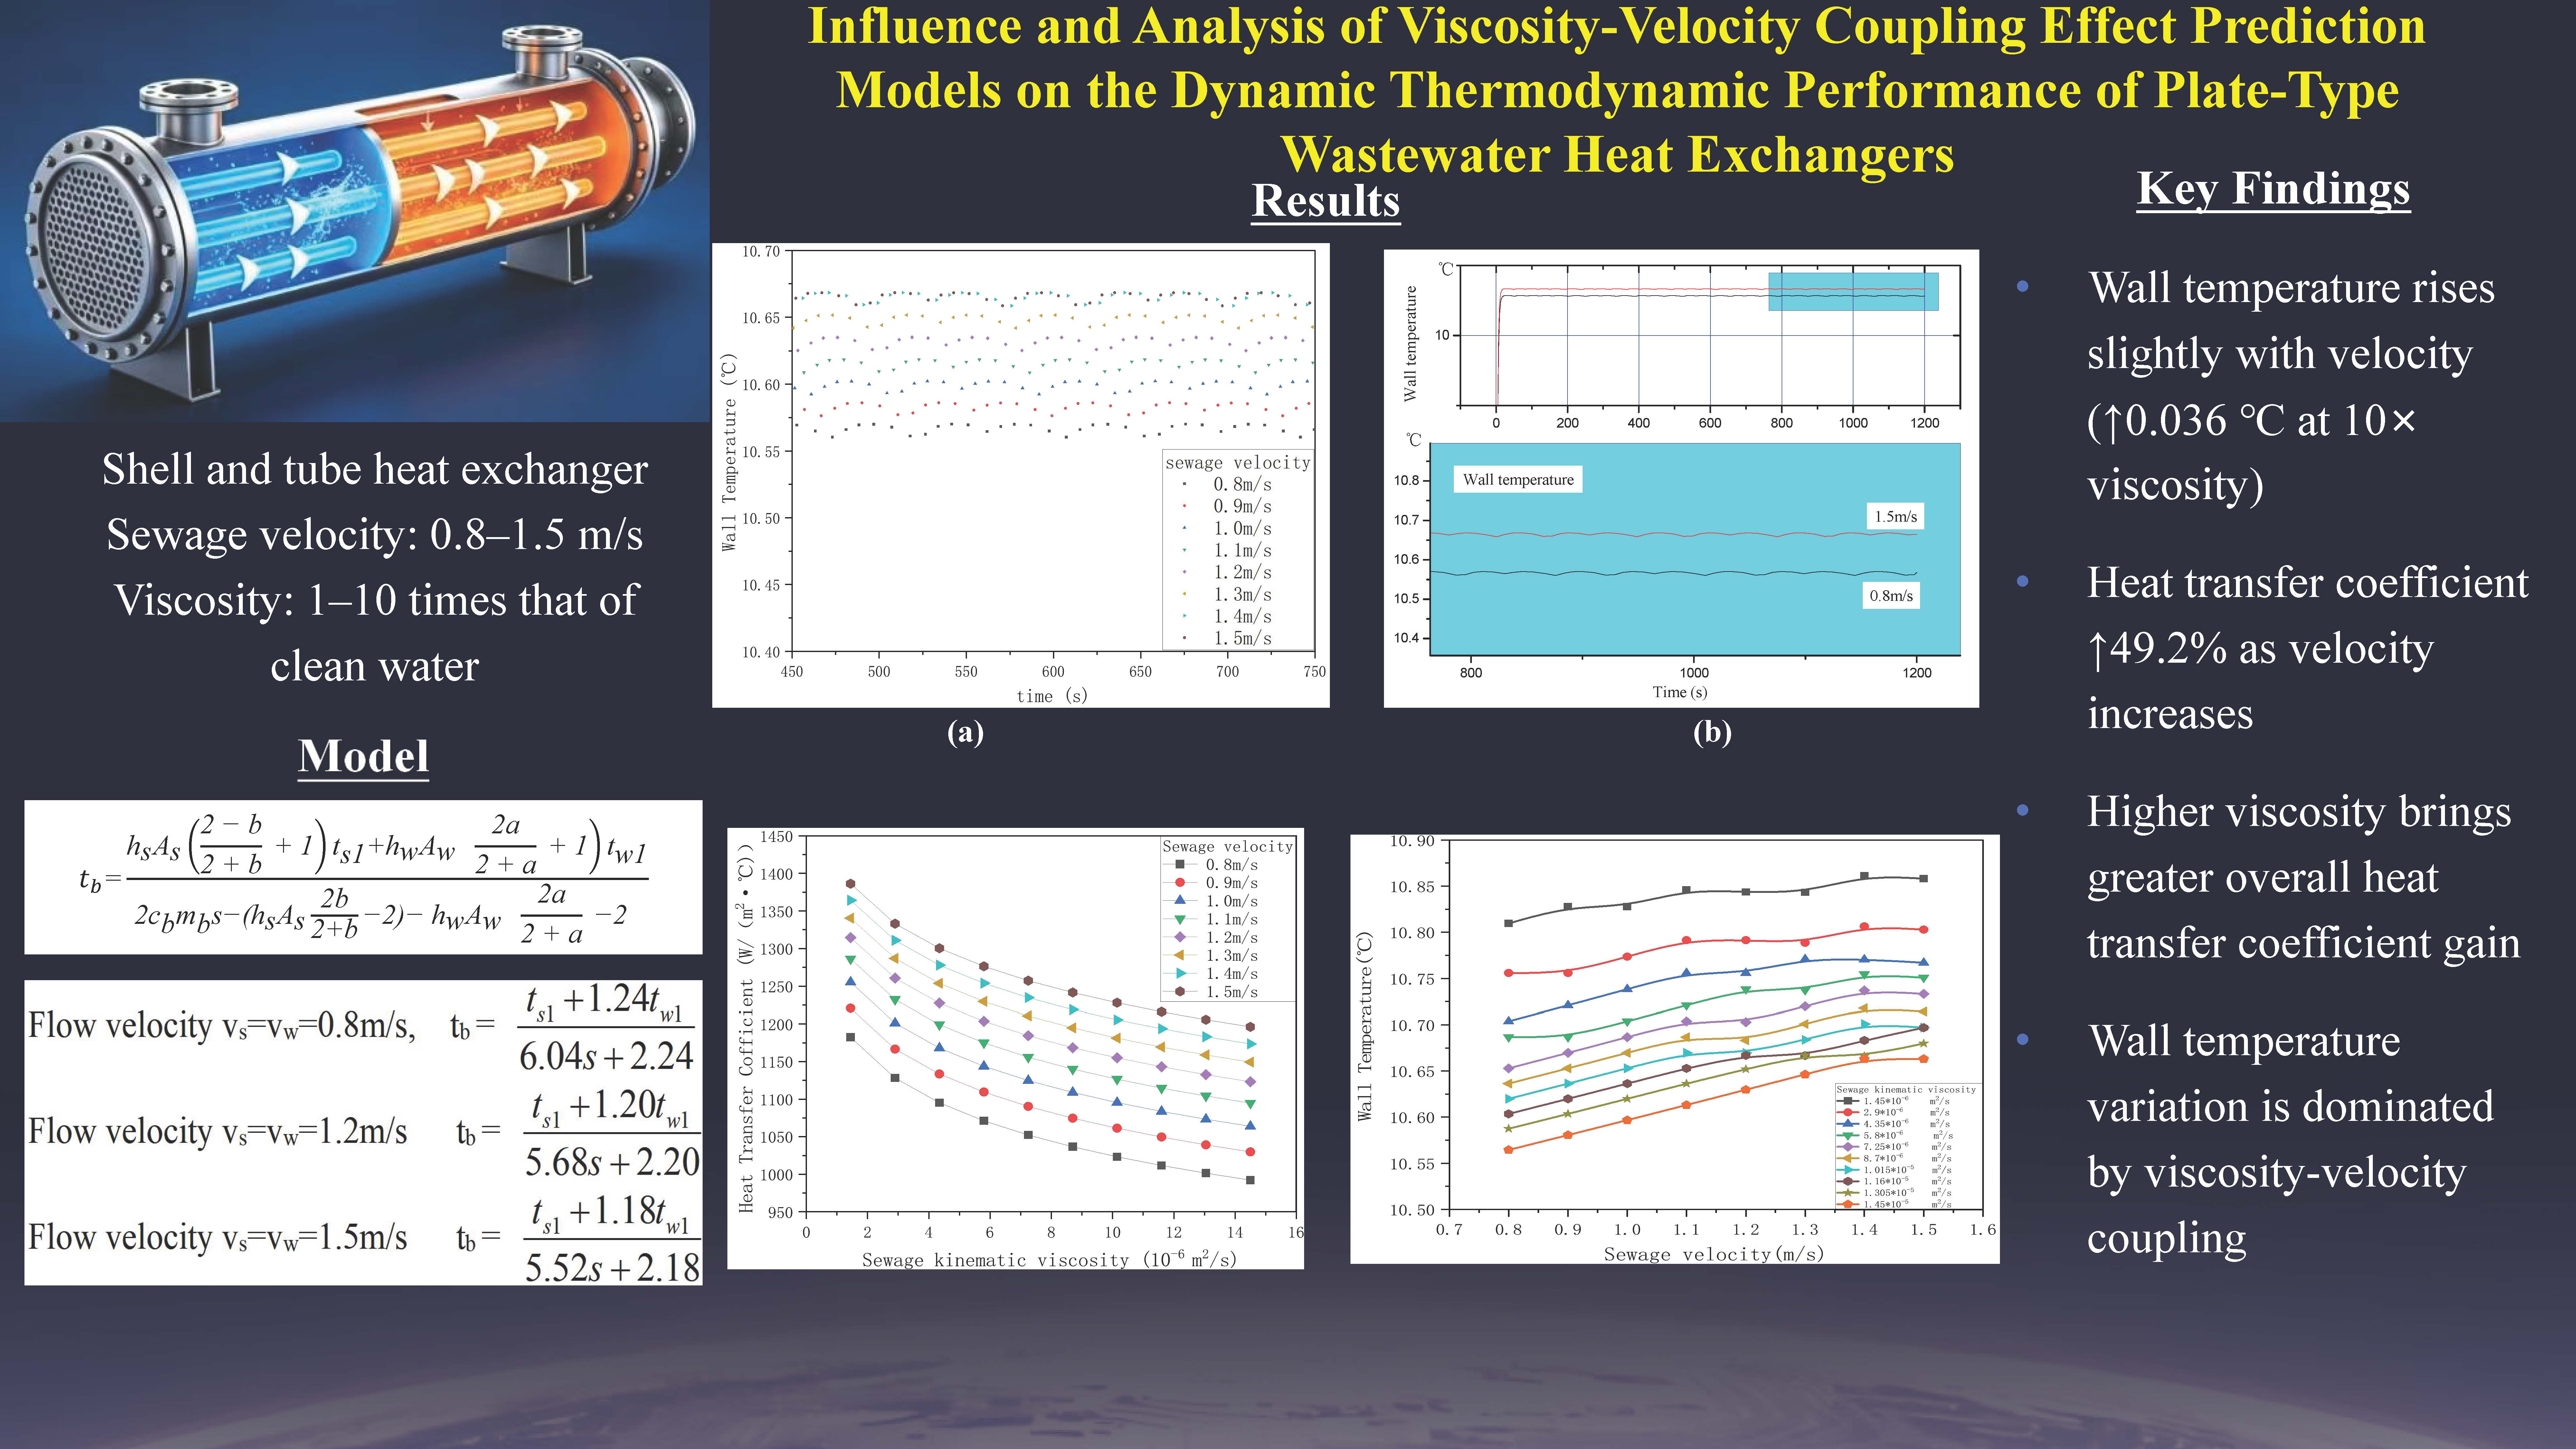
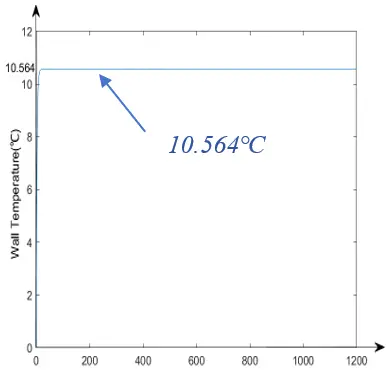
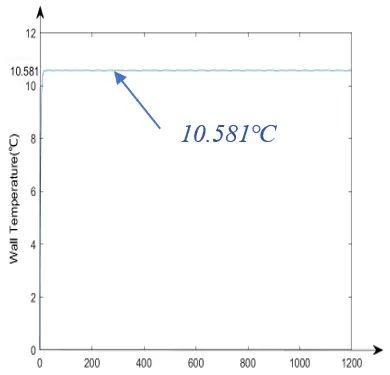
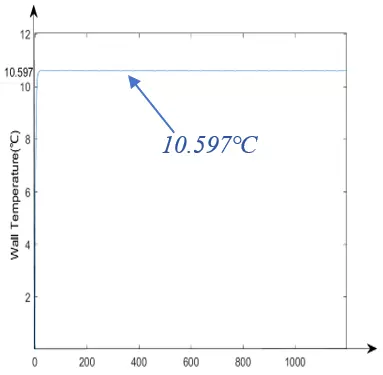
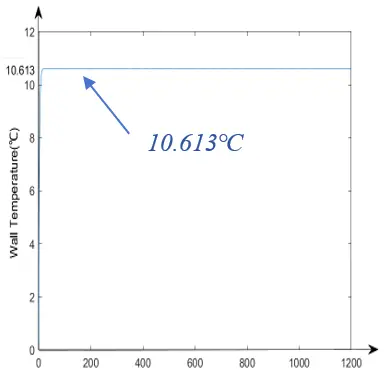
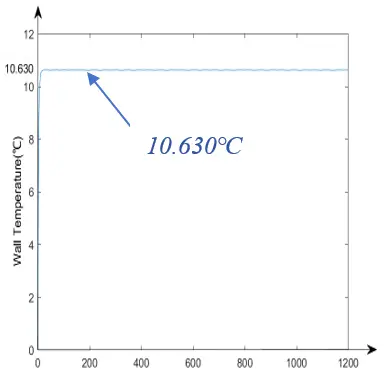
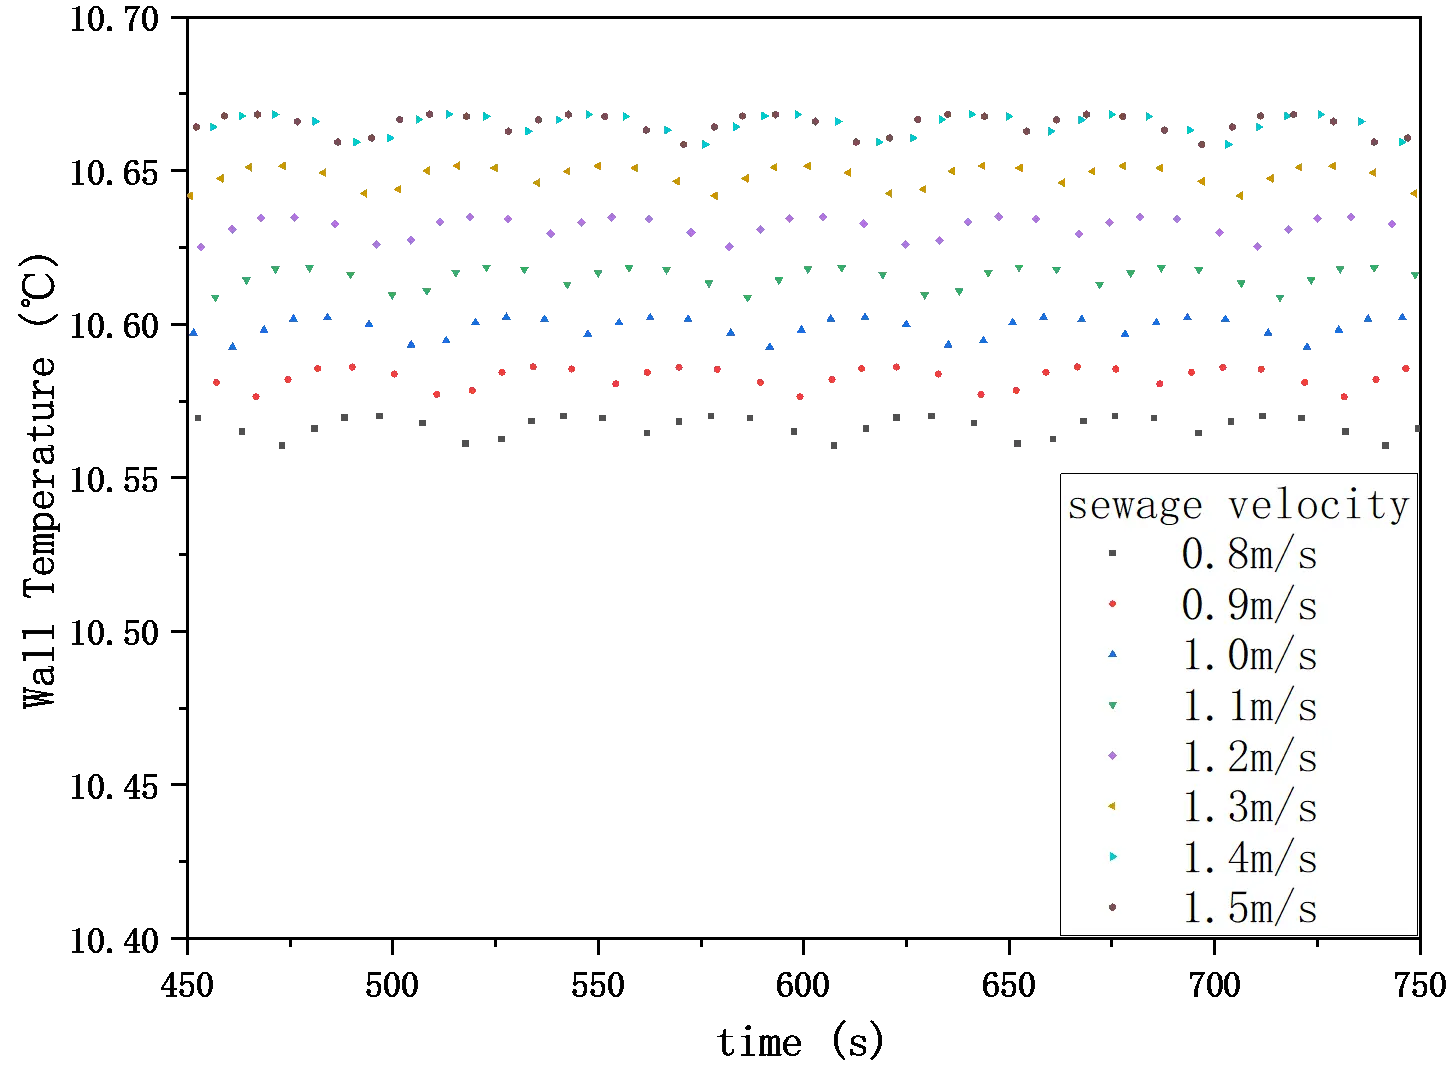
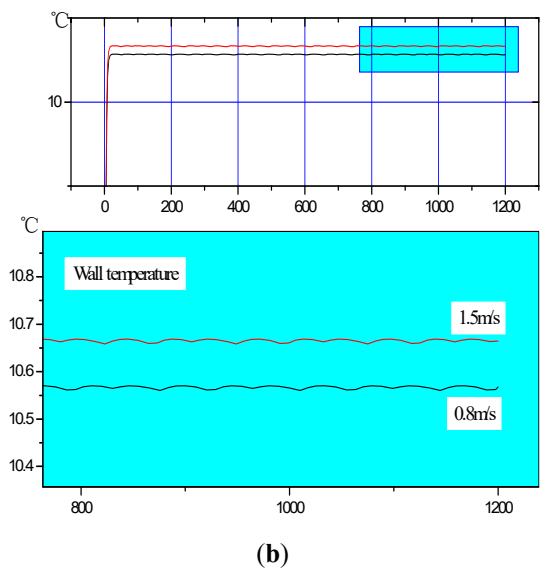
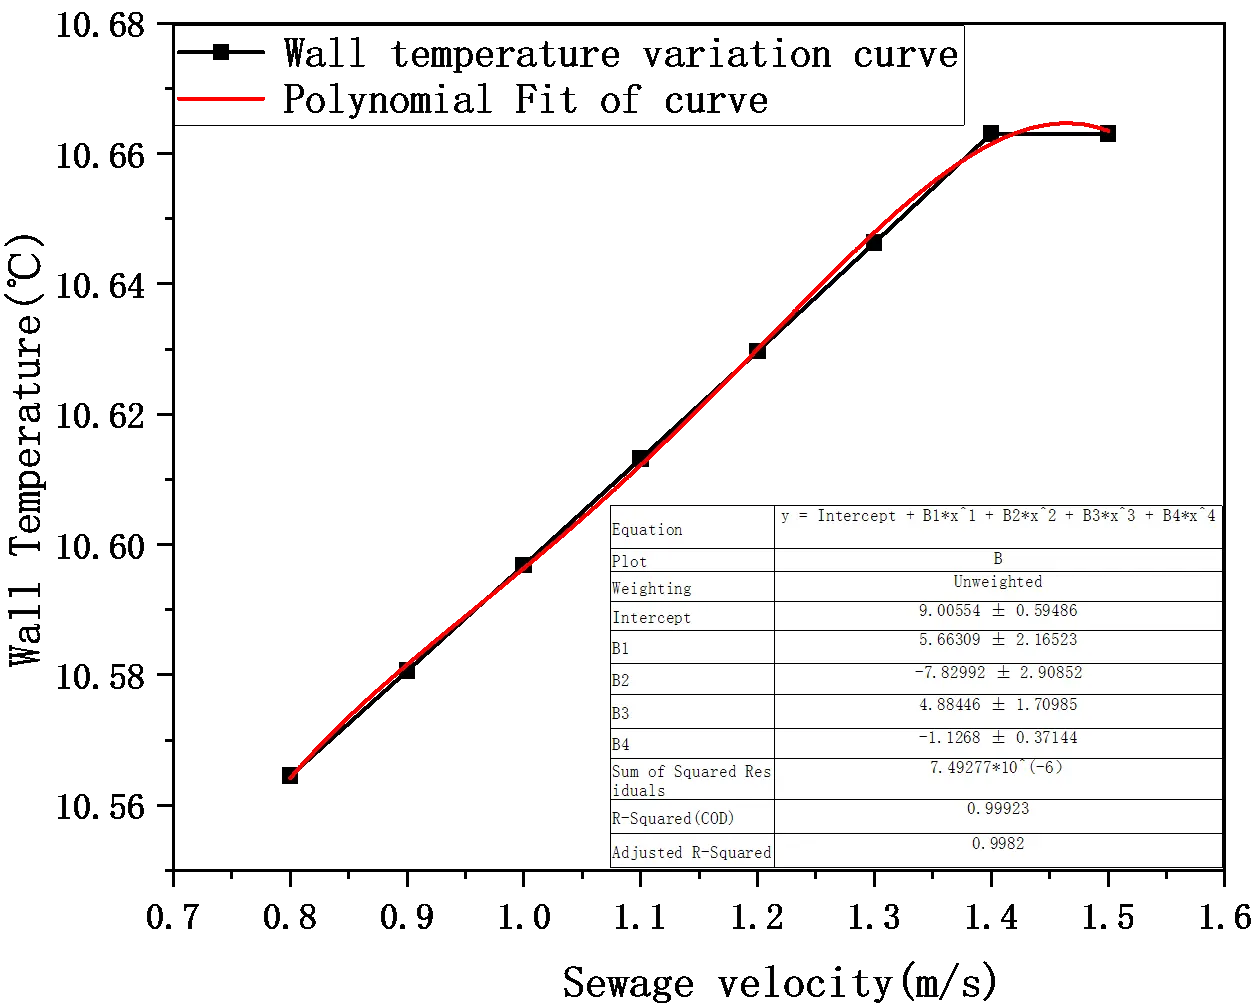
When the sewage viscosity is measured at 10 times the water intake rate, the wall temperature-sewage velocity curves are shown in Figure 5 and Figure 6 and Table 3. The data indicate that wall temperature increases with higher sewage velocities, reaching 10.57 °C at 0.8 m/s and 10.66 °C at 1.5 m/s. Figure 7 presents an enlarged comparison between 0.8 m/s and 1.5 m/s velocities. Although the temperature rise is only 0.09 °C for a 0.7 m/s increase, the slight elevation persists as the sewage temperature rises. The fitting results in Figure 8 yield the following curve: y = 9.00554 + 5.66309x − 7.82992x2 + 4.88446x3 − 1.1268x4.
 |
 |
|
(a) |
(b) |
 |
 |
|
(c) |
(d) |
 |
 |
|
(e) |
(f) |
 |
 |
|
(g) |
(h) |
Figure 5. Dynamic simulation curve of wall temperature. (a) Sewage velocity of 0.8 m/s; (b) Sewage velocity of 0.9 m/s; (c) Sewage velocity of 1.0 m/s; (d) Sewage velocity of 1.1 m/s; (e) Sewage velocity of 1.2 m/s; (f) Sewage velocity of 1.3 m/s; (g) Sewage velocity of 1.4 m/s; (h) Sewage velocity of 1.5 m/s.
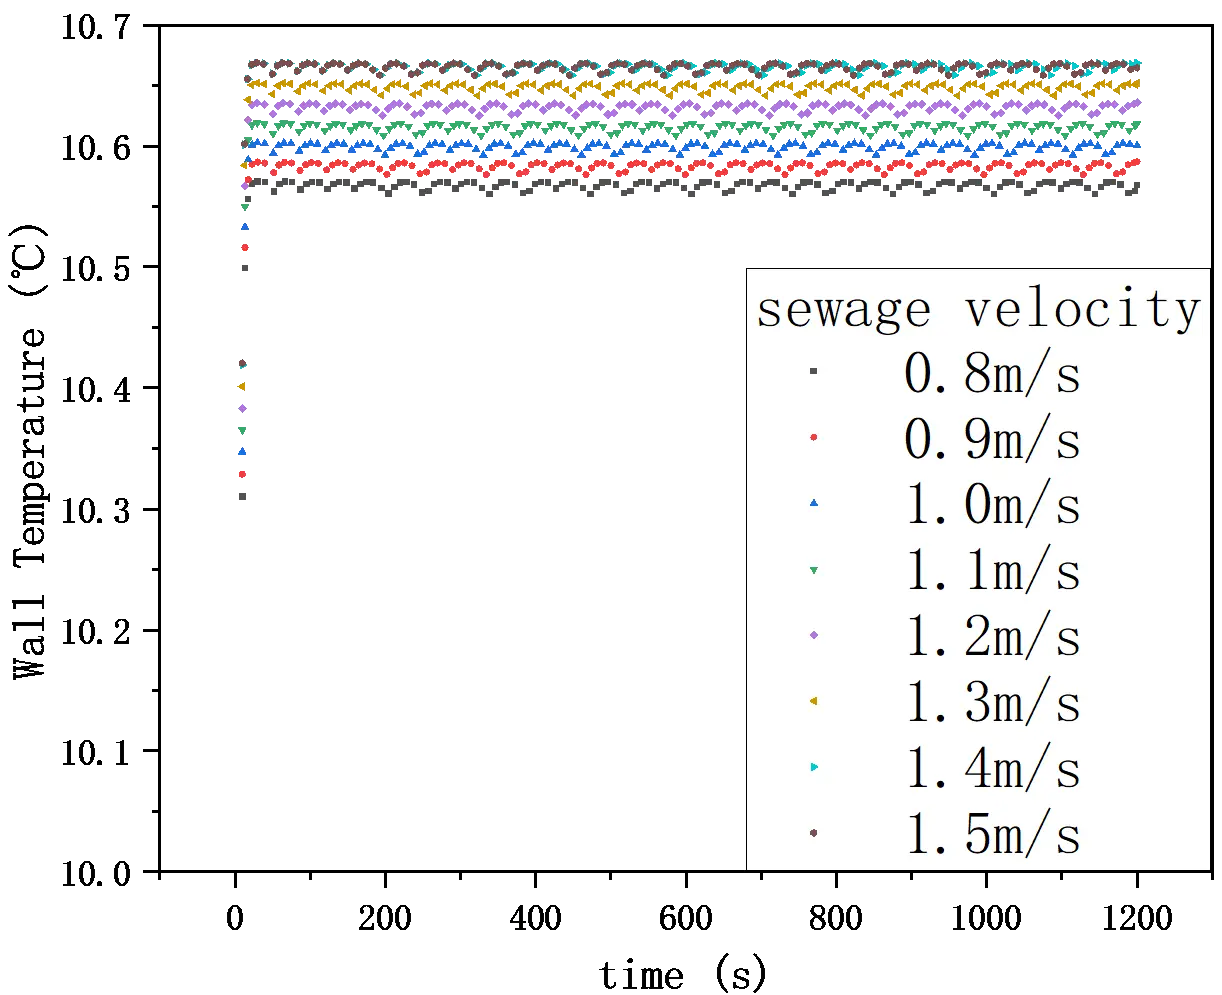
Table 3. Wall temperature variation.
|
Sewage Velocity (m/s) |
Wall Temperature (°C) |
|---|---|
|
0.8 |
10.564 |
|
0.9 |
10.581 |
|
1.0 |
10.597 |
|
1.1 |
10.613 |
|
1.2 |
10.630 |
|
1.3 |
10.646 |
|
1.4 |
10.663 |
|
1.5 |
10.663 |
 |
 |
|
(a) |
(b) |
Figure 7. Amplified comparison of wall temperature. (a) Variation of sewage velocity from 0.8 to 1.5 m/s; (b) Comparison between the two flow velocities.
At higher flow velocity, the convective heat transfer intensity is significantly enhanced, leading to more heat being transferred from the sewage to the tube wall. Meanwhile, the increased turbulence suppresses the formation of a low-conductivity boundary layer near the wall. As a result, the wall temperature rises slightly with increasing velocity. The slight nonlinear increase in wall temperature with velocity (rise from 0.8 to 1.5 m/s) is particularly important for offshore applications: stable wall temperature fluctuations (<0.1 °C) can reduce salt crystallization and microbial fouling induced by marine salt-laden sewage, extending the maintenance cycle of heat exchangers in offshore wind power complementation systems.
3.2. Effect of Viscosity–Velocity Combined on Heat Transfer Performance
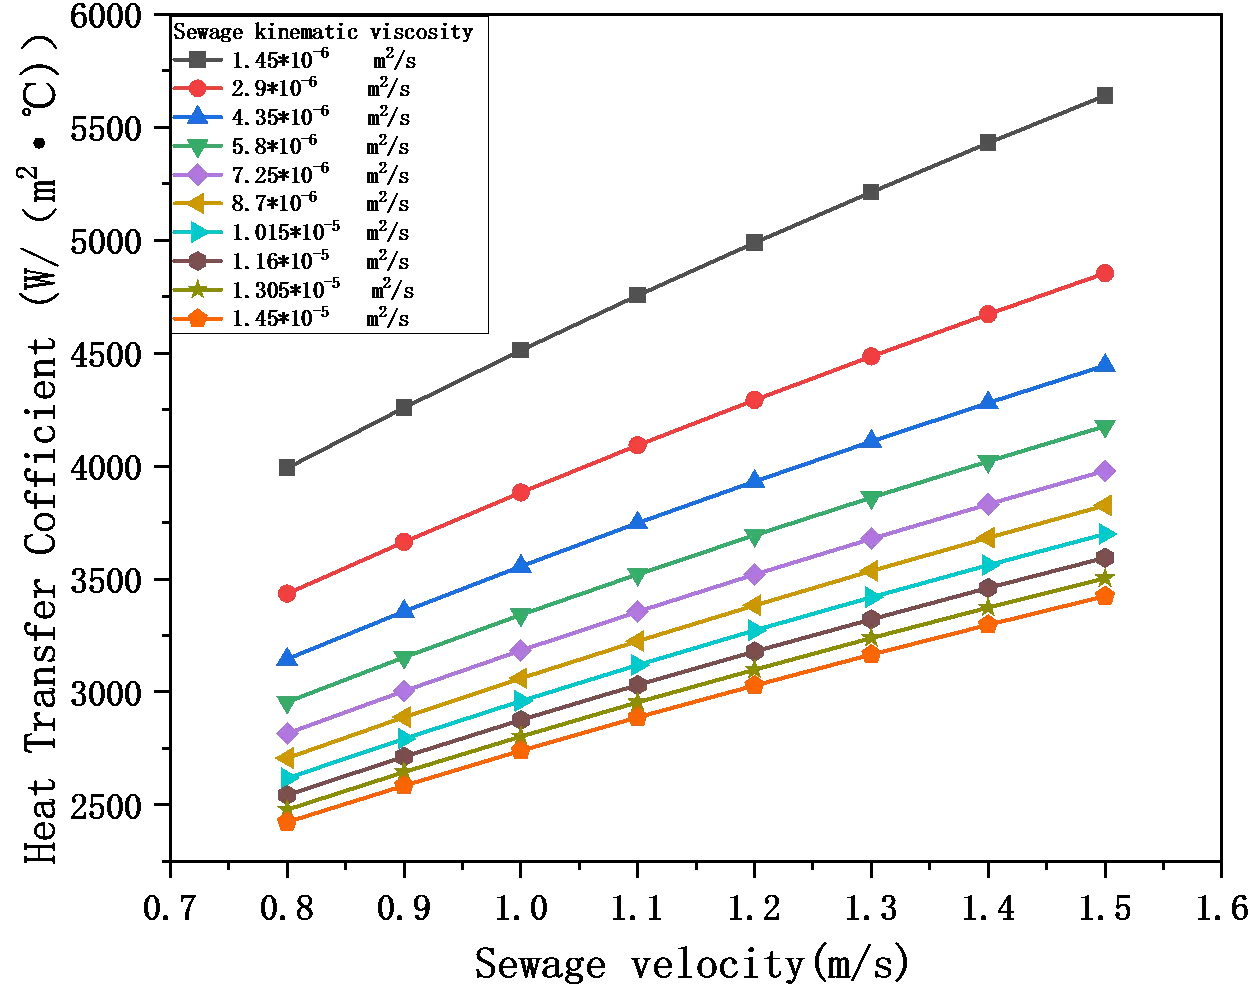
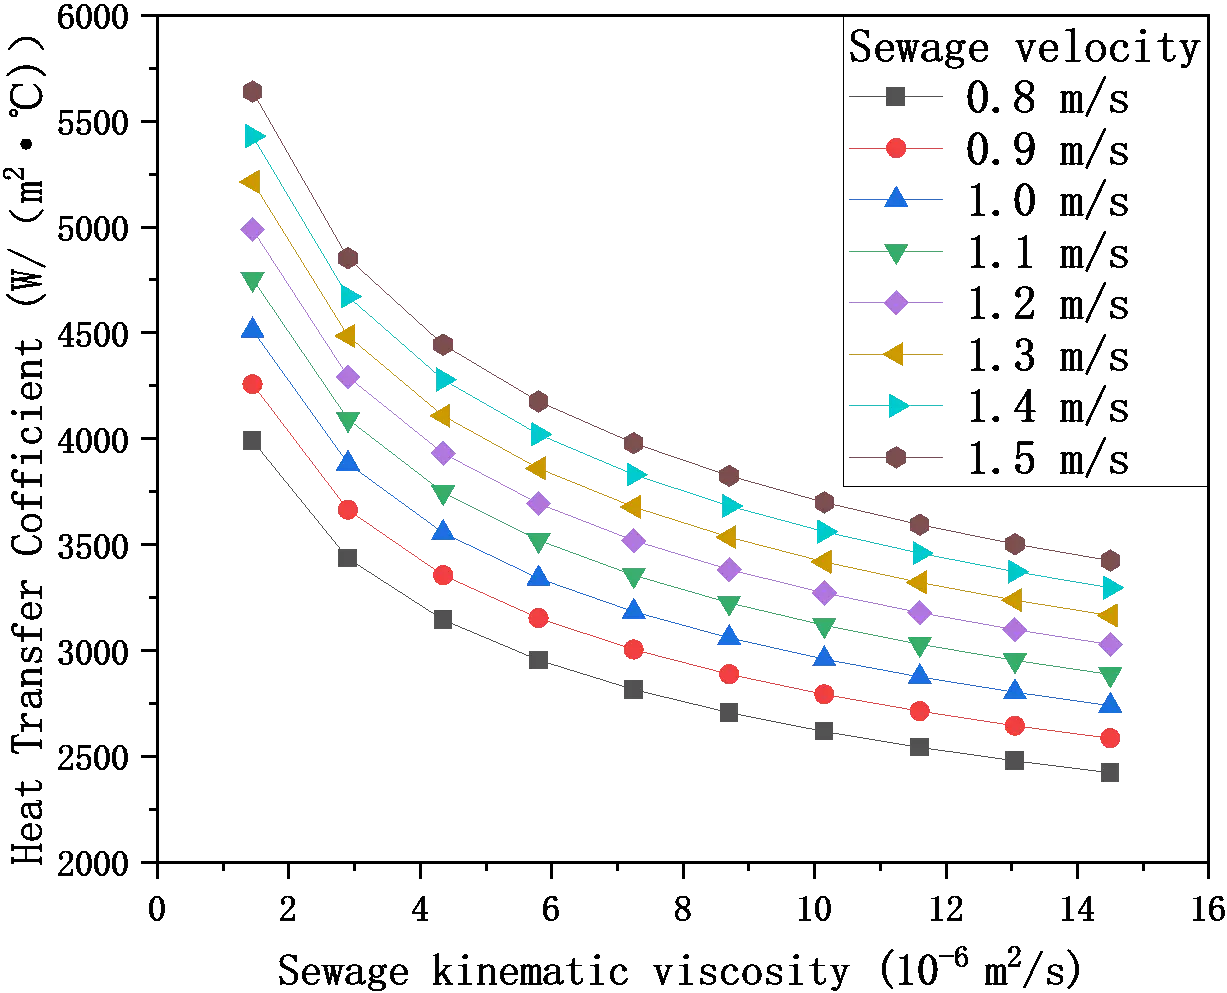
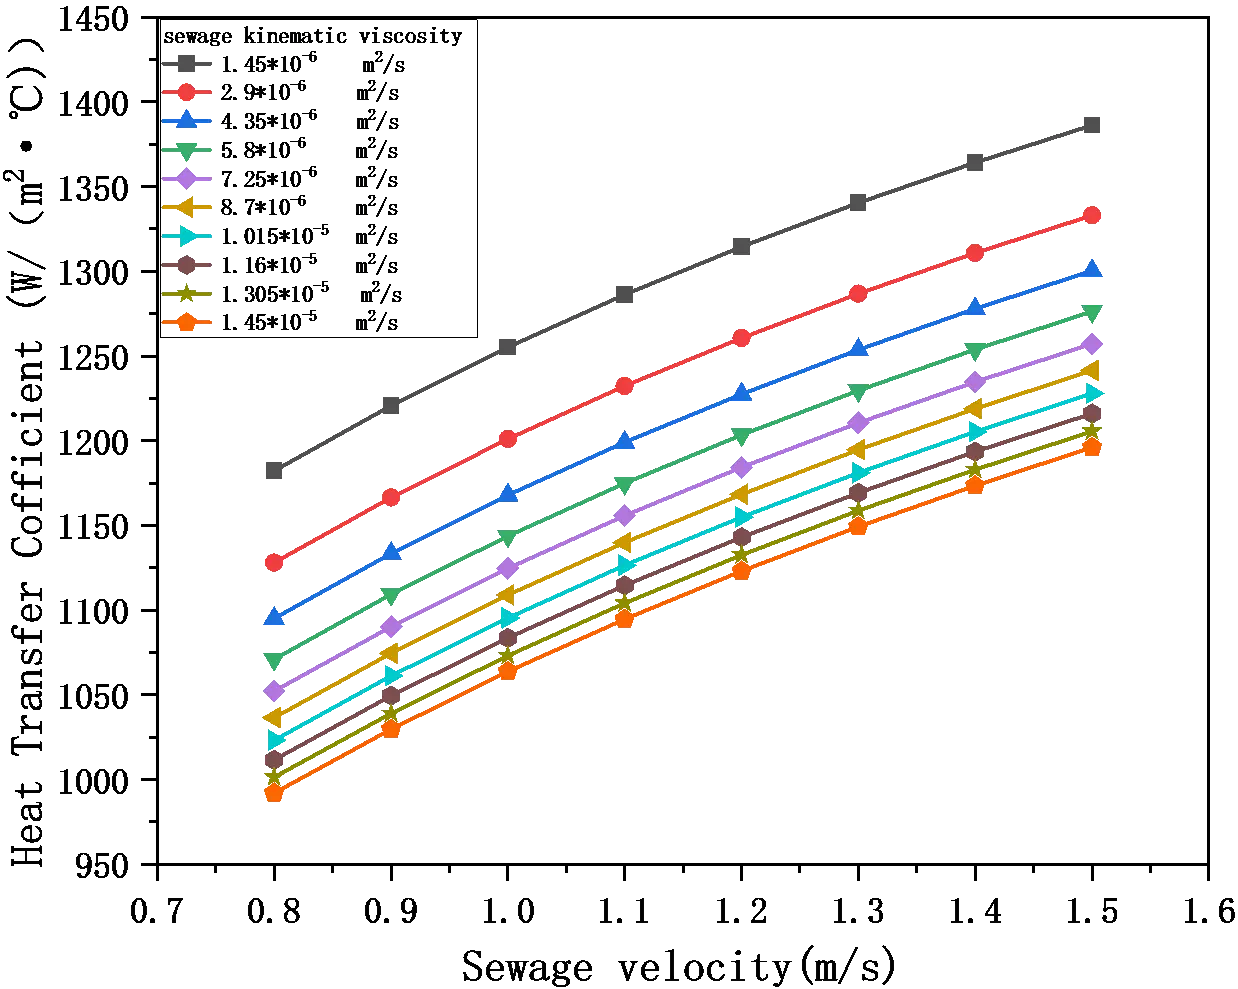
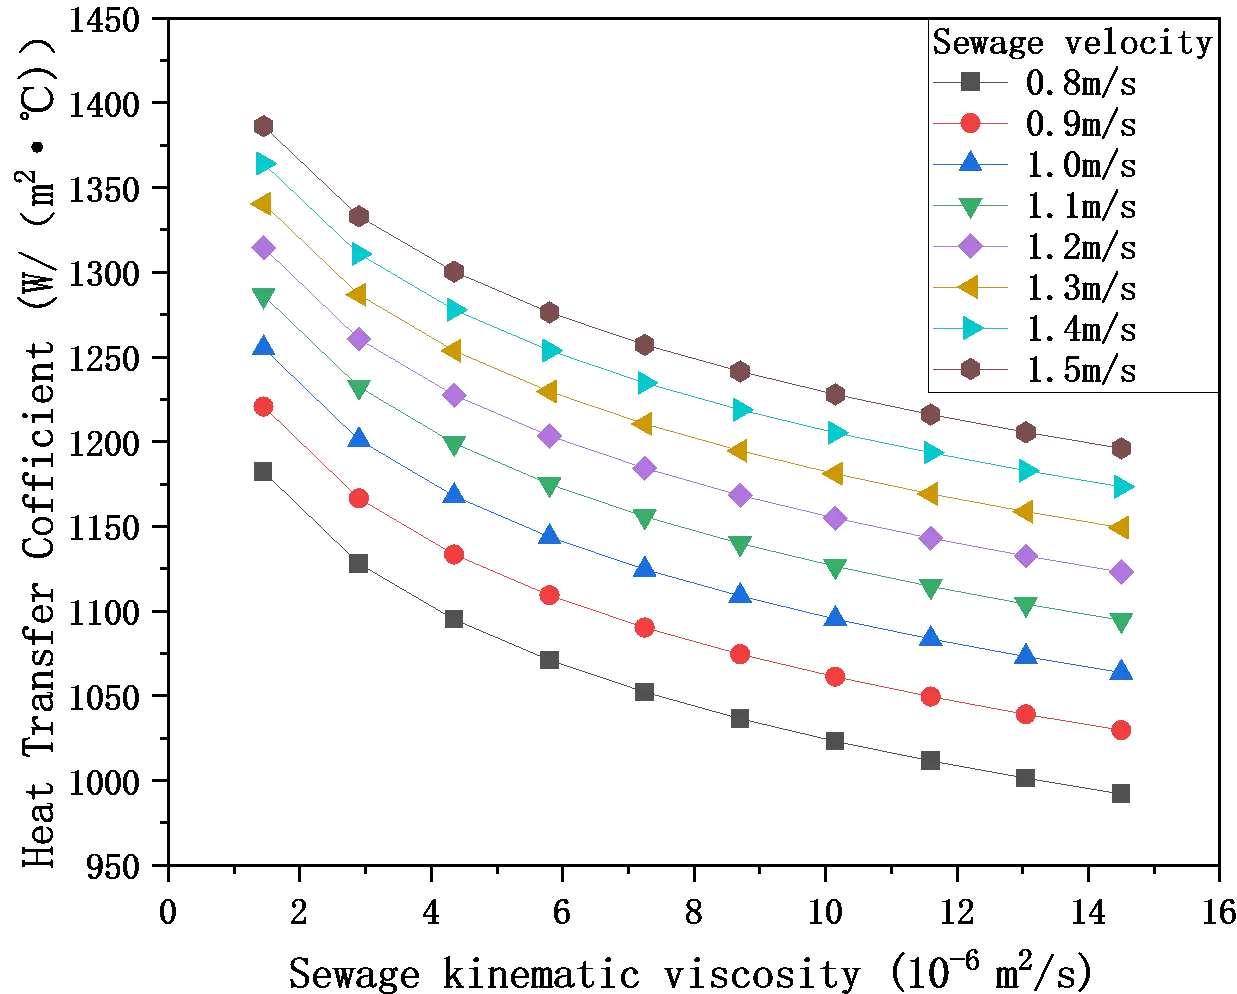
This study investigates the effects of wastewater viscosity and velocity combined on heat transfer performance under varying conditions. The heat transfer coefficients of wastewater (Figure 9 and Figure 10) and heat exchangers (Figure 11 and Figure 12) are presented. The data demonstrate that both coefficients increase with rising wastewater flow velocity and decrease with increasing viscosity.
When the wastewater flow velocity varies between 0.8–1.5 m/s, the heat transfer coefficient increases from 3434.8 (W/(m2·°C)) to 4853.47 (W/(m2·°C)) at 2 times the clear water viscosity, representing a 41.3% improvement. The heat exchanger’s coefficient rises from 1128.15 (W/(m2·°C)) to 1333.2 (W/(m2·°C)), showing a 18.2% increase. At 5 times the clear water viscosity, the wastewater’s heat transfer coefficient grows from 2816.32 (W/(m2·°C)) to 3979.63 (W/(m2·°C)), a 41.3% rise, while the heat exchanger’s coefficient increases from 1052.25 (W/(m2·°C)) to 1257.35 (W/(m2·°C)), a 19.5% improvement. At 10 times the clear water viscosity, the wastewater’s heat transfer coefficient rises from 2423.59 (W/(m2·°C)) to 3424.59 (W/(m2·°C)), a 41.3% increase, and the heat exchanger’s coefficient grows from 992.18 (W/(m2·°C)) to 1196.11 (W/(m2·°C)), a 20.6% rise. These results demonstrate that as wastewater flow velocity increases, the improvement in the overall heat transfer coefficient of the heat exchanger follows this order: 10 times viscosity > 5 times viscosity > 2 times viscosity.
This section examines the heat transfer behavior under combined viscosity-flow conditions. Viscosity influences the Reynolds number and flow regime, whereas flow velocity affects turbulence intensity and convective heat transfer capacity. Together, these two parameters determine the resulting heat transfer coefficient.
The results show that both the sewage-side heat transfer coefficient and the overall heat transfer coefficient increase significantly with increasing flow velocity and decrease with increasing viscosity. Under combined conditions, the improvement in heat transfer performance becomes more pronounced at higher viscosity, indicating that flow regulation can partly compensate for the deterioration in heat transfer associated with increased viscosity.
This coupling mechanism is relevant to seawater/sewage-source heat pump operation, where heat exchangers may encounter variable-property and fouling-prone working fluids. The results suggest that increasing flow velocity may help maintain heat recovery performance under high-viscosity conditions and may support more stable thermal matching with intermittent marine renewable energy systems.
3.3. Dynamic Wall Temperature Characteristics Under Viscosity–Velocity Combined
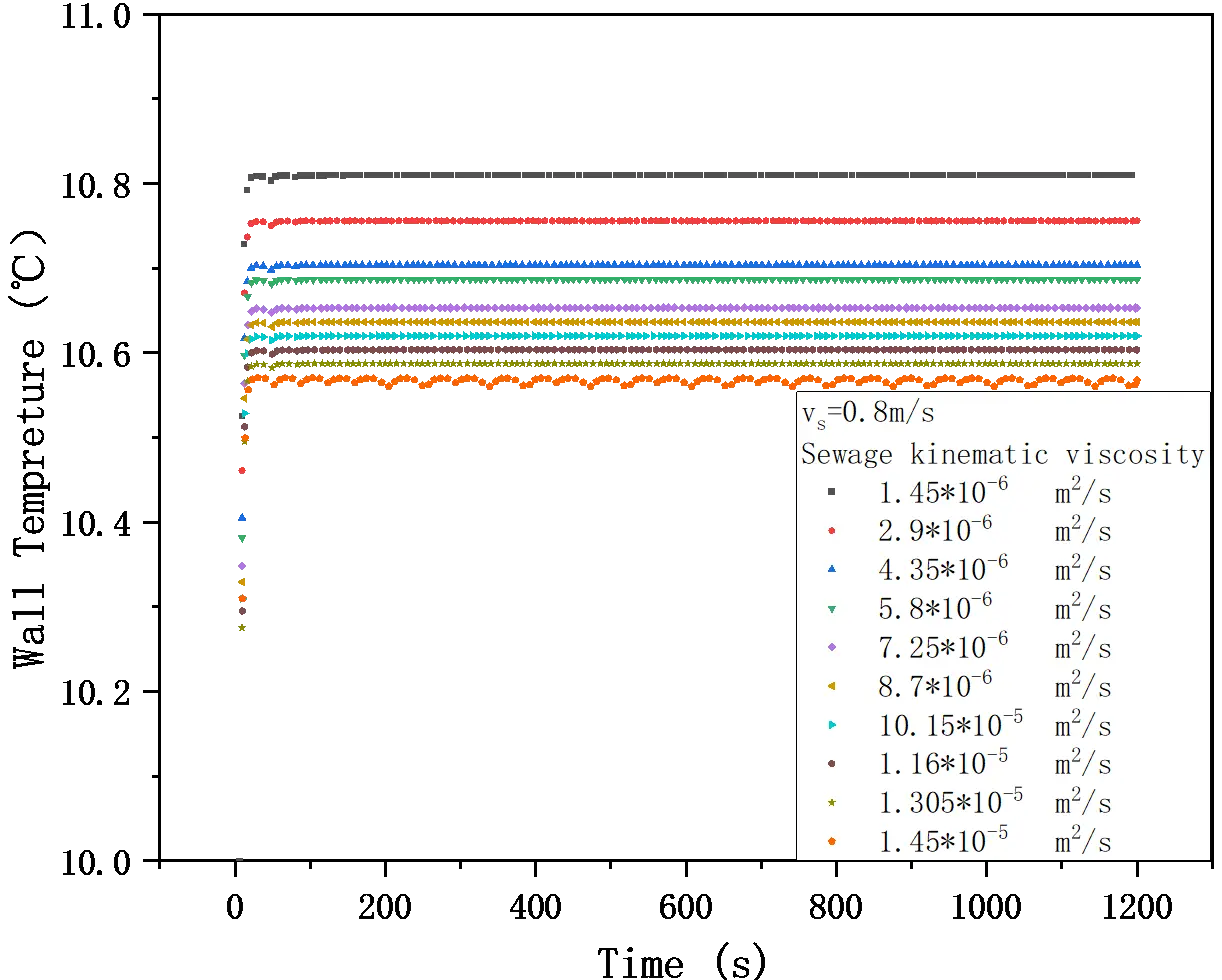
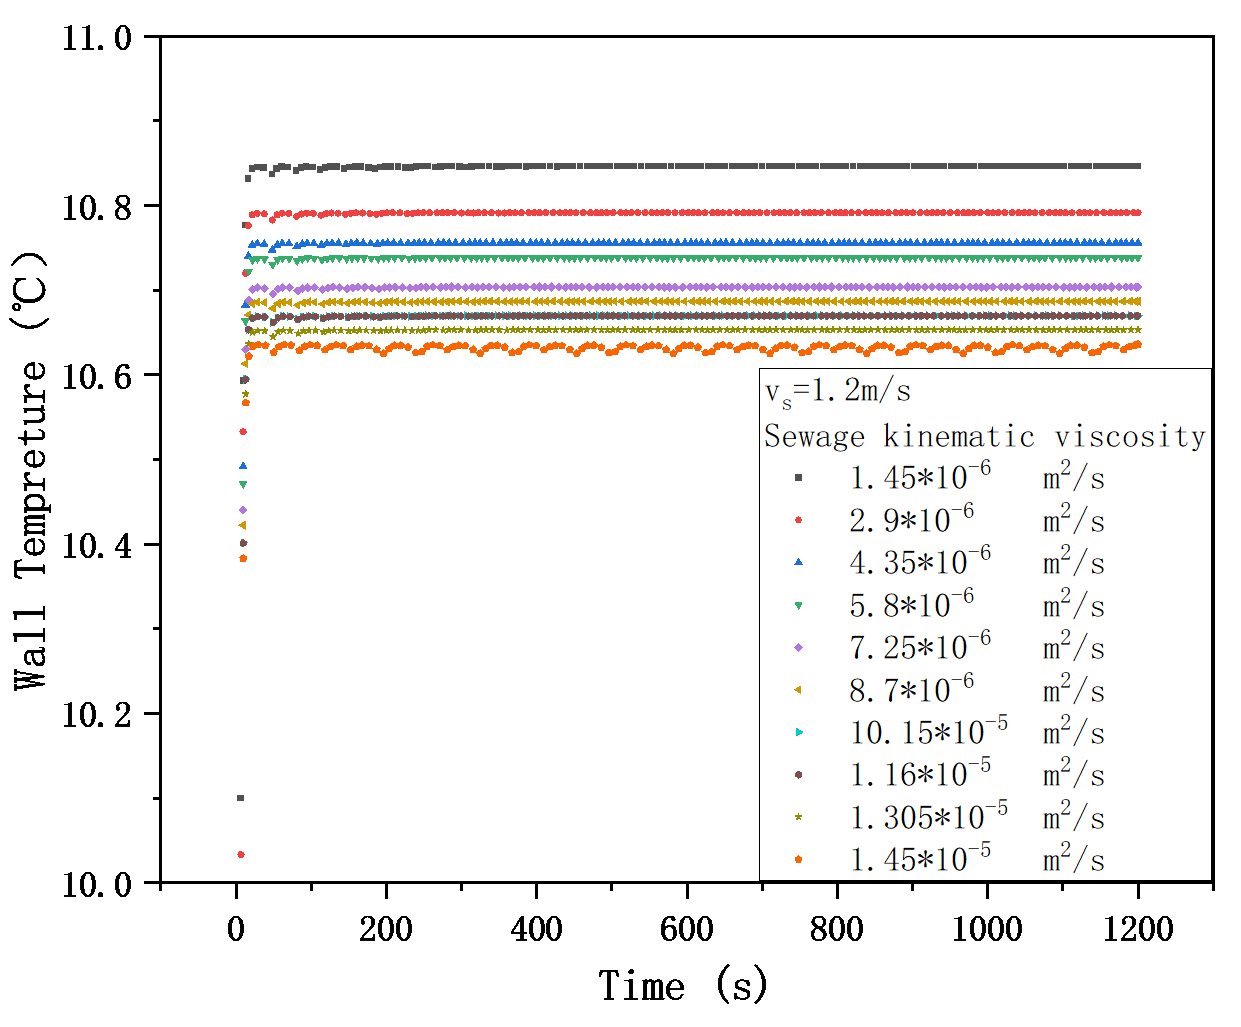
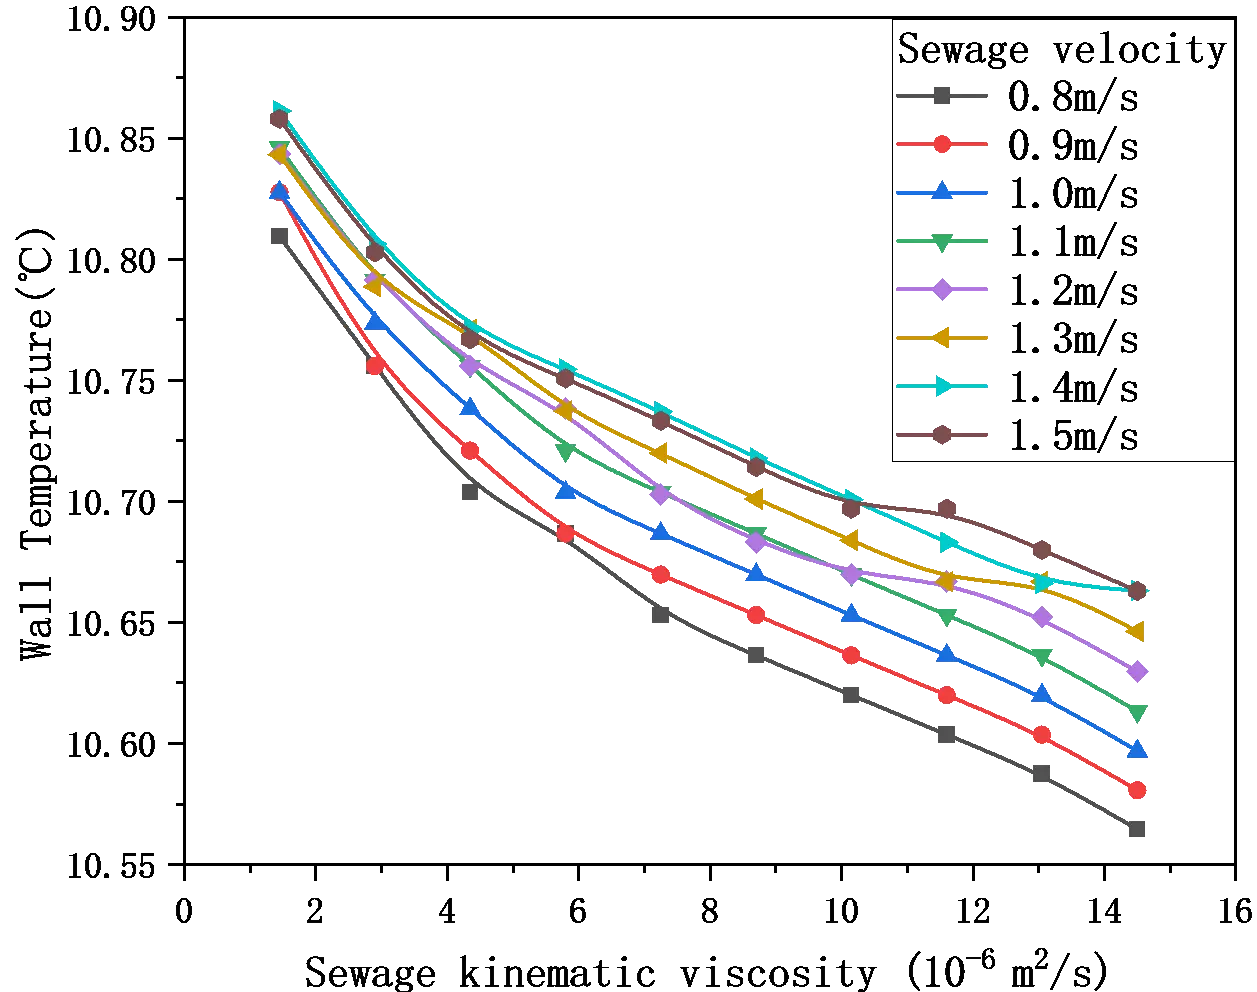
Figure 13, Figure 14 and Figure 15 shows the wall temperature curves over time and viscosity for sewage velocities of 0.8, 1.2, and 1.5 m/s. The graph demonstrates that wall temperature decreases as sewage viscosity increases.
 |
 |
|
(a) |
(b) |
Figure 13. Wall temperature variation (sewage velocity 0.8 m/s). (a) Dynamic variations under different viscosities; (b) Wall temperature versus viscosity fitting curve.
 |
 |
|
(a) |
(b) |
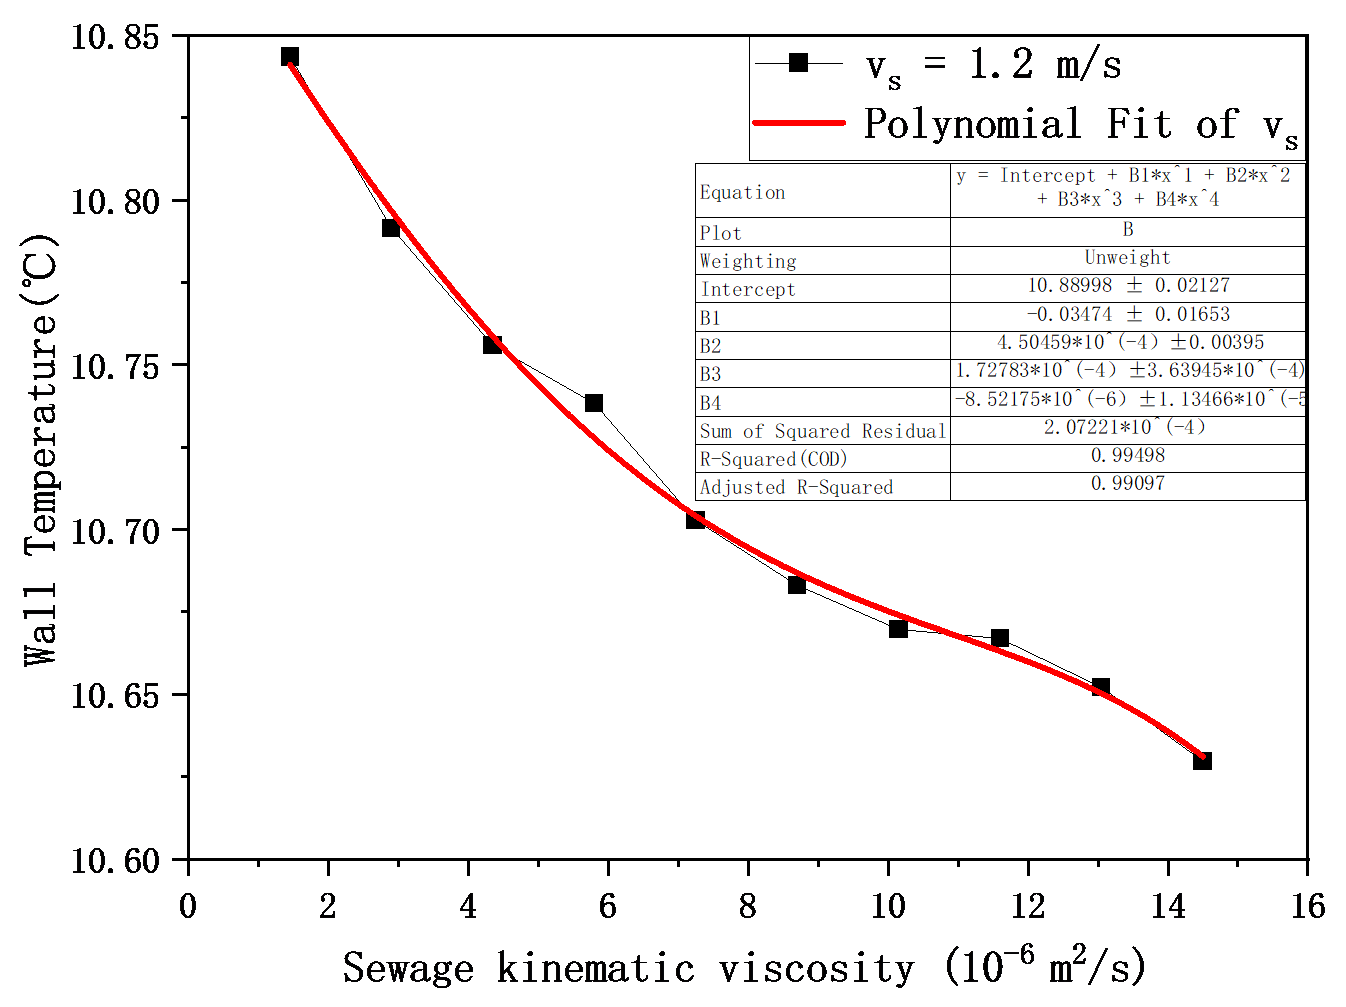
Figure 14. Wall temperature variation (sewage velocity 1.2 m/s). (a) Dynamic variations under different viscosities; (b) Wall temperature versus viscosity fitting curve.
 |
 |
|
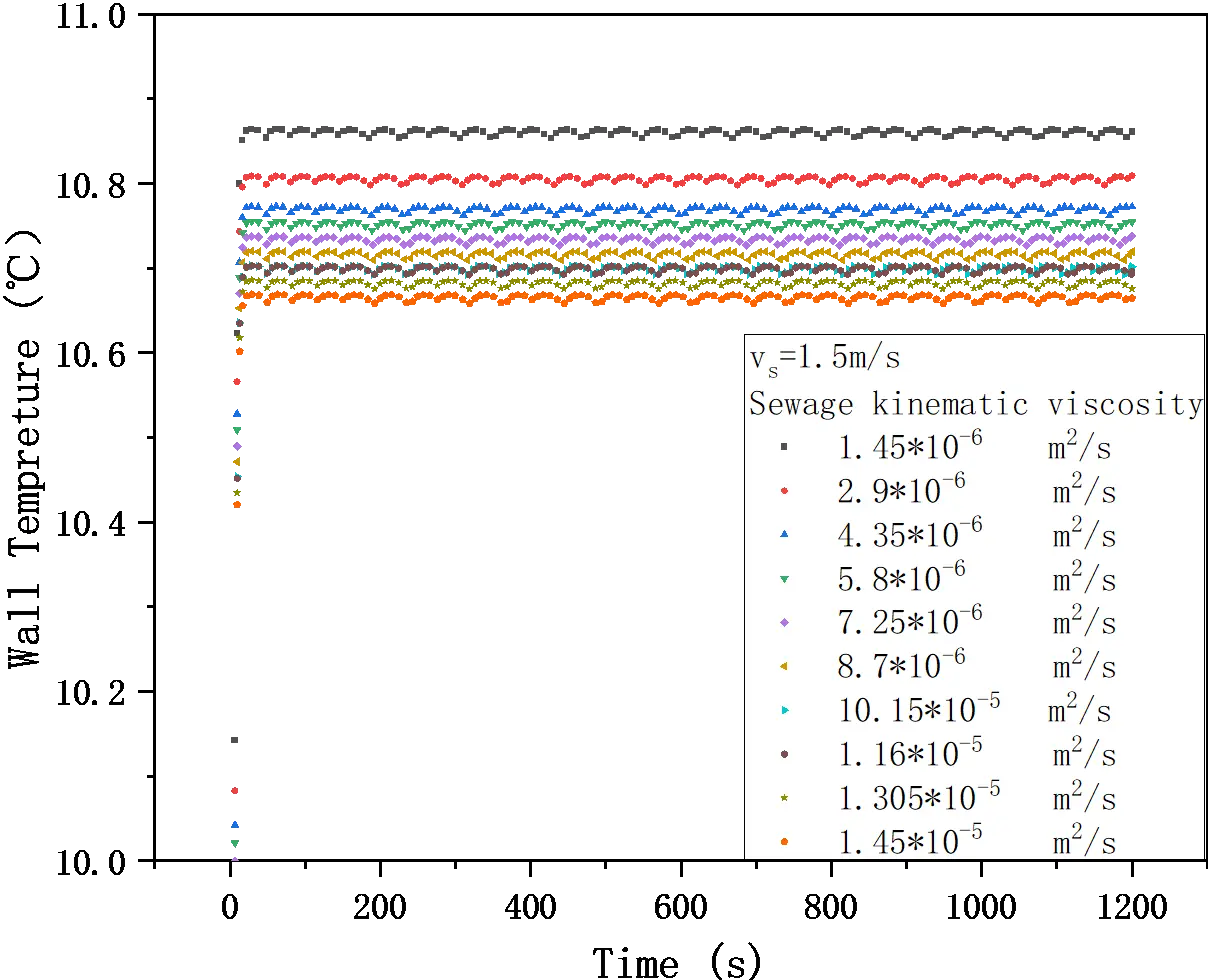
(a) |
(b) |
Figure 15. Wall temperature variation (sewage velocity 1.5 m/s). (a) Dynamic variations under different viscosities; (b) Wall temperature versus viscosity fitting curve.
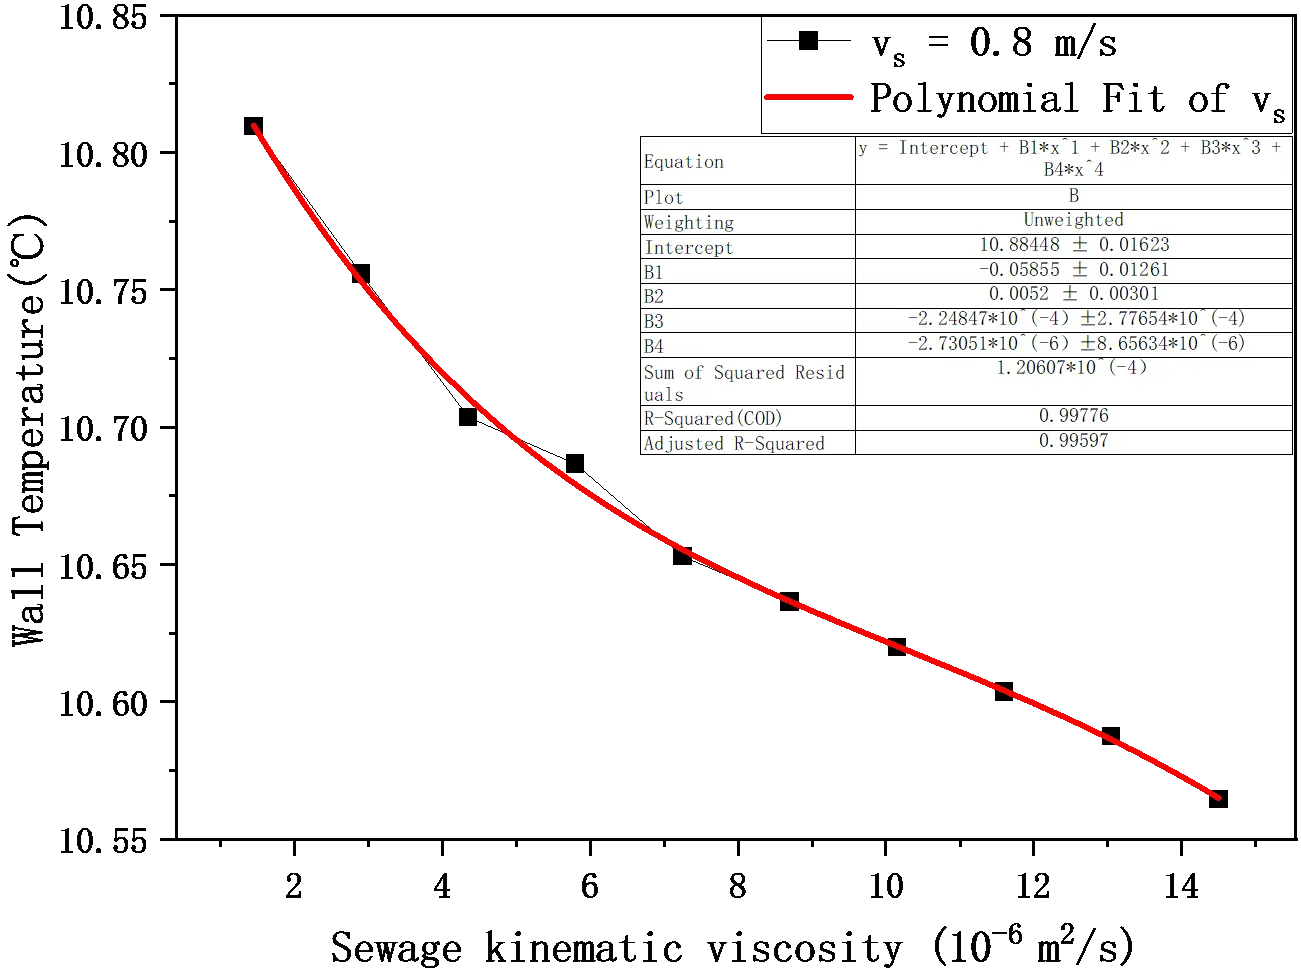
At a sewage velocity of 0.8 m/s, the wall temperature decreases from 10.81 °C to 10.57 °C as viscosity increases from 1 to 10 times that of water, a reduction of 2.3%. For this velocity and viscosity range, an approximate curve is obtained by fitting:
|
```latex\mathrm{y=10.88448-0.05855x+0.0052x^2-2.24847\times10^{-4}x^3+2.73051\times10^{-6}x^4}``` |
The wall temperature decreases from 10.84 °C to 10.63 °C, decreasing by 1.9% when the sewage velocity is 1.2 m/s and the viscosity is 1 to 10 times. The approximate curve is obtained by fitting:
|
```latex\mathrm{y=10.88998-0.03474x+4.50459\times10^{-4}x^2+1.72783\times10^{-4}x^3-8.52175\times10^{-6}x^4}``` |
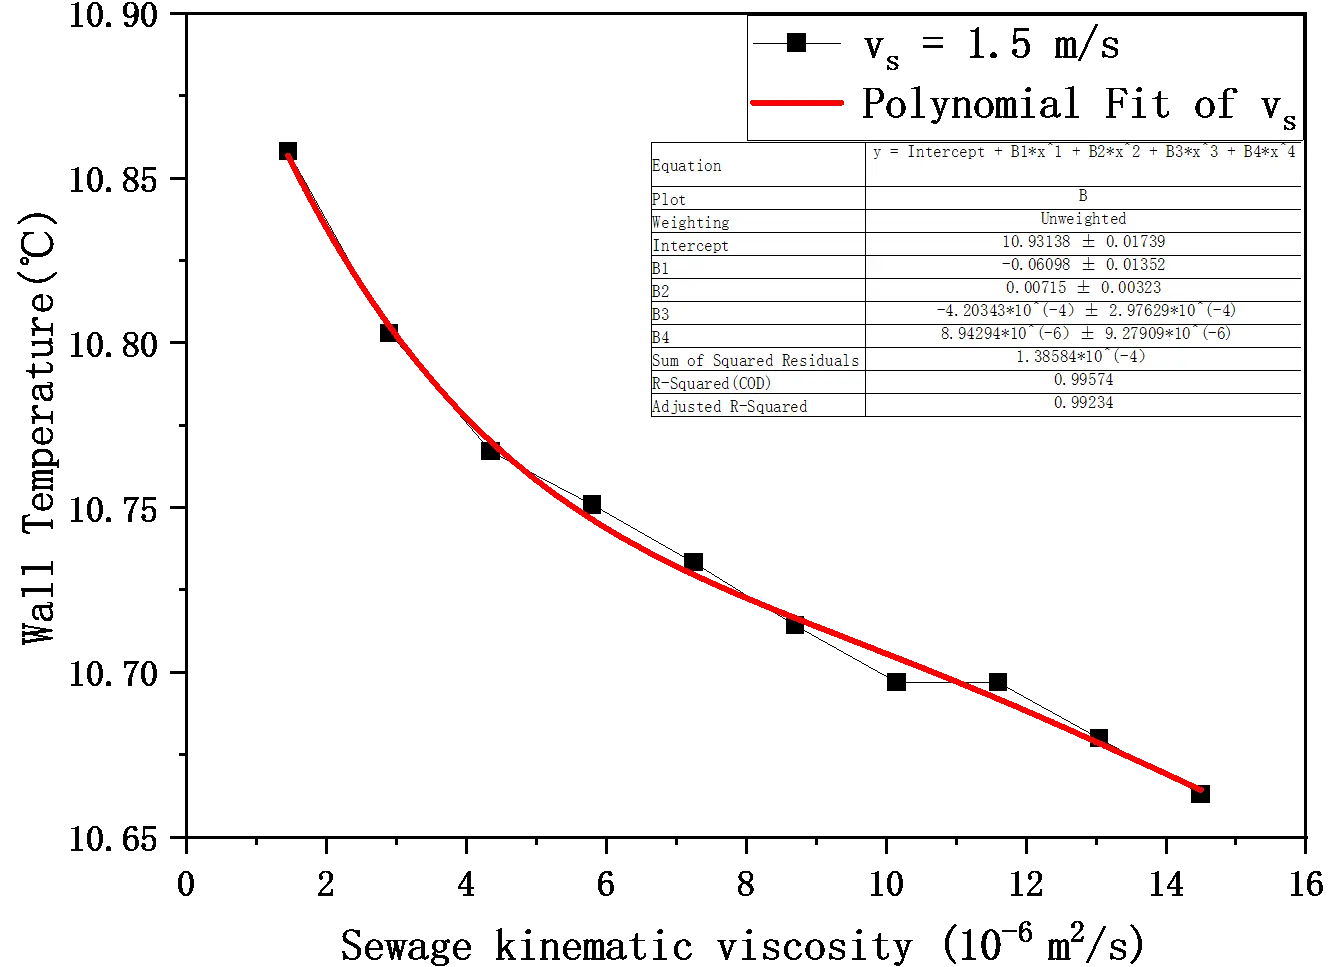
The wall temperature decreases from 10.86 °C to 10.66 °C, decreasing by 1.8% when the velocity of sewage is 1.5 m/s and the viscosity of sewage is 1 to 10 times. The approximate curve is obtained by fitting:
|
```latex\mathrm{y=10.93138-0.06098x+0.00715x^{2}-4.20343\times10^{-4}x^{3}+8.94294\times10^{-6}x^{4}}``` |
The decrease of wall temperature with the increase of the viscosity of sewage is: 1.5 m/s < 1.2 m/s < 0.8 m/s. Higher velocity strengthens the overall heat transfer and makes the temperature field more uniform. The wall temperature becomes more stable and less sensitive to changes in viscosity. Therefore, the temperature drop rate (cooling rate) caused by rising viscosity gradually decreases as velocity increases.
This section clarifies the dynamic fluctuation behavior of wall temperature under combined viscosity-flow conditions. Viscosity mainly governs flow stability, whereas flow velocity primarily affects turbulence intensity and convective heat transfer. Their interaction gives rise to distinct nonlinear dynamic characteristics in wall-temperature response. As viscosity increases, wall temperature decreases gradually, while the rate of decrease becomes smaller at higher flow velocity. This trend suggests that higher velocity promotes temperature uniformity and weakens the sensitivity of wall temperature to viscosity variation, which is a characteristic feature of viscosity-flow coupling.
In addition, low-viscosity conditions are associated with less stable boundary-layer development and more frequent flow separation and reattachment, leading to multi-peak wall-temperature fluctuations. By contrast, higher viscosity tends to stabilize the flow field and suppress strong temperature oscillations. The observed transition from fluctuating to more stable behavior reflects the combined influence of viscosity and flow velocity on thermal response. These dynamic characteristics are relevant to the operation of seawater/sewage heat exchangers in coastal and offshore environments, where variable fluid conditions may affect thermal stability in seawater-source heat pump systems.
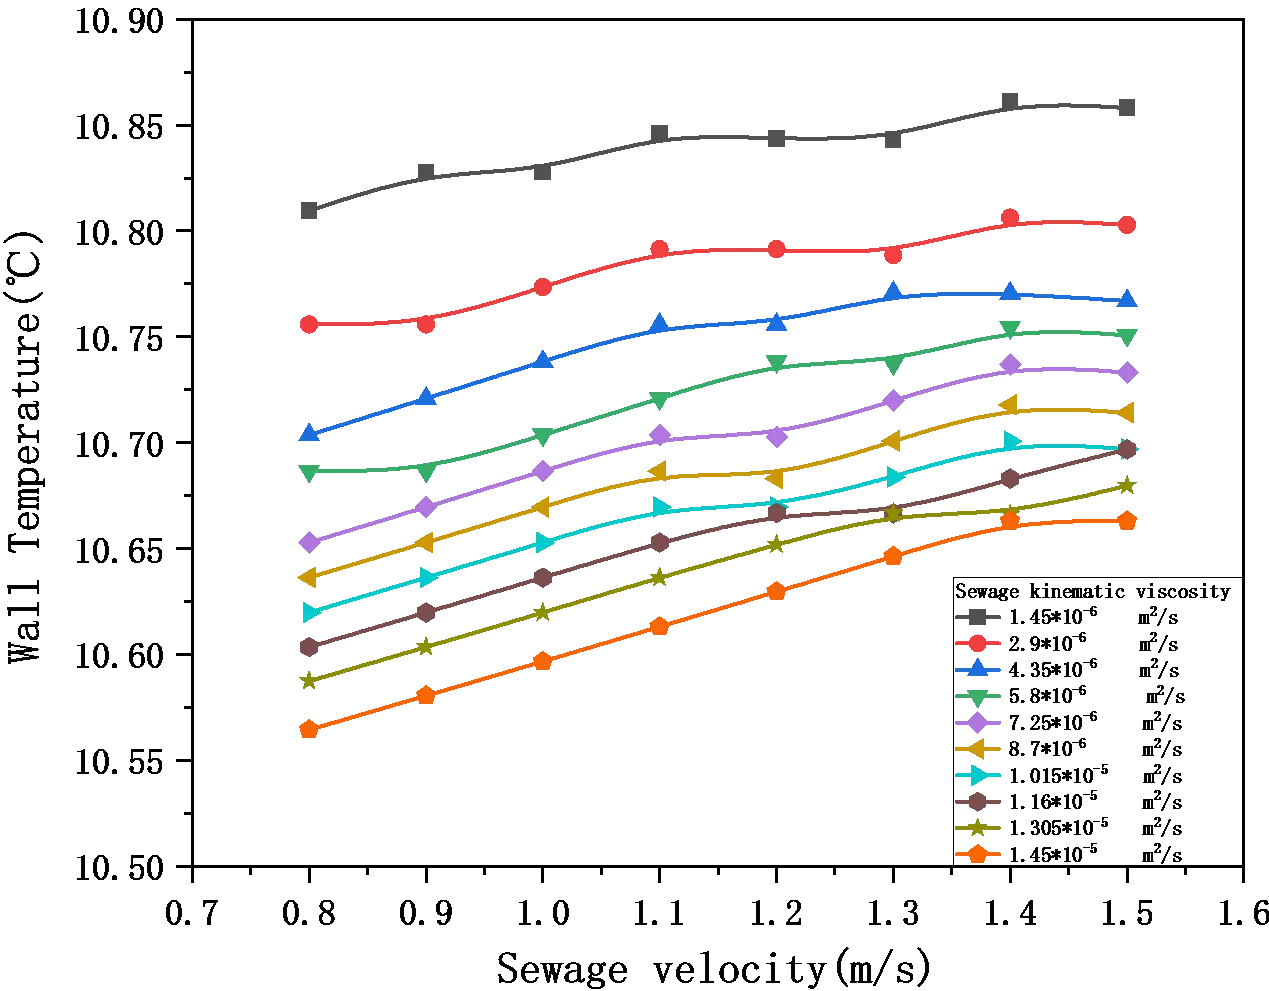
Figure 16 and Figure 17 present all test curves of wall temperature variations with different sewage velocities (0.8–1.5 m/s) and viscosity levels (1.45 × 10⁻⁶ m2/s to 1.45 × 10⁻⁵ m2/s). Figure 18 shows the gradient variation curve of wall temperature with sewage flow velocity. The data reveals that at a viscosity of 1.45 × 10⁻⁶ m2/s, the wall temperature exhibits a “three-peak” fluctuation pattern. For viscosities of 2.9 × 10⁻⁶ m2/s, 4.35 × 10⁻⁶ m2/s, 5.8 × 10⁻⁶ m2/s, 7.25 × 10⁻⁶ m2/s, 8.7 × 10⁻⁶ m2/s, 10.15 × 10⁻⁶ m2/s, 11.6 × 10⁻⁶ m2/s, and 13.05 × 10⁻⁶ m2/s, the wall temperature follows a nonlinear “fluctuating rise and fall” pattern, though the specific fluctuation morphology varies by operational conditions. At a viscosity of 1.45 × 10⁻⁵ m2/s, the temperature shows a single-peak trend characterized by “initial rise followed by gradual decline”, with no significant fluctuations during the high-speed phase and a more gradual downward trend.
 |
 |
 |
|
(a) |
(b) |
(c) |
 |
 |
 |
|
(d) |
(e) |
(f) |
 |
 |
|
|
(g) |
(h) |
|
 |
 |
|
|
(i) |
(j) |
Figure 18. Gradient variation curve of wall temperature with sewage flow velocity. (a) Sewage kinematic viscosity of 1.45 × 10⁻⁶ m2/s; (b) Sewage kinematic viscosity of 2.9 × 10⁻⁶ m2/s; (c) The Sewage kinematic of 4.35 × 10⁻⁶ m2/s; (d) The Sewage kinematic viscosity of 5.8 × 10⁻⁶ m2/s; (e) The Sewage kinematic viscosity of 7.25 × 10⁻⁶ m2/s; (f) The Sewage kinematic viscosity of 8.7 × 10⁻⁶ m2/s; (g) The Sewage kinematic viscosity of 1.015 × 10⁻⁵ m2/s; (h) The Sewage kinematic viscosity of 1.16 × 10⁻⁵ m2/s; (i) The Sewage kinematic viscosity of 1.305 × 10⁻⁵ m2/s; (j) The Sewage kinematic viscosity of 1.45 × 10⁻⁵ m2/s.
Figure 19 presents the gradient variation curve of wall temperature versus wastewater viscosity. The graph reveals a nonlinear pattern: within the 0.8–1.2 m/s flow rate range, wall temperature exhibits “initial sharp fluctuations followed by gradual stabilization” as viscosity changes. In low-viscosity zones, temperature experiences dramatic fluctuations, while beyond a critical viscosity threshold, the amplitude of fluctuations significantly decreases, leading to overall stabilization. For flow rates of 1.2–1.5 m/s, the relationship between viscosity and wall temperature follows a common pattern of “intense fluctuations in low-viscosity zones and gradual stabilization in high-viscosity zones”, though the fluctuation patterns in low-viscosity zones vary across different operating conditions.
 |
 |
 |
|
(a) |
(b) |
(c) |
 |
 |
 |
|
(d) |
(e) |
(f) |
 |
 |
|
|
(g) |
(h) |
Figure 19. Gradient variation curve of wall temperature with sewage viscosity. (a) Sewage velocity of 0.8 m/s; (b) Sewage velocity of 0.9 m/s; (c) Sewage velocity of 1.0 m/s; (d) Sewage velocity of 1.1 m/s; (e) Sewage velocity of 1.2 m/s; (f) Sewage velocity of 1.3 m/s; (g) Sewage velocity of 1.4 m/s; (h) Sewage velocity of 1.5 m/s.
Under low-viscosity conditions, the fluid flow is more sensitive to velocity variations, and the boundary layer near the wall is prone to repeated development, separation, and reattachment, leading to unstable multi-peak fluctuations in wall temperature. In contrast, high viscosity increases the momentum diffusion and flow stability. The flow and temperature fields tend to be steady, so the wall temperature shows a gentle single peak or a stable trend without drastic fluctuations. The “multi-peak fluctuation in low viscosity and stabilization in high viscosity” pattern reflects the adaptability of the exchanger to marine environmental changes: low viscosity corresponds to rainy season (diluted coastal sewage), while high viscosity corresponds to dry season (concentrated sewage with high salt content). This dynamic behavior may contribute to more stable heat exchanger operation under variable marine conditions. In addition, the weaker temperature reduction observed at higher flow velocity is consistent with fluctuating sewage-flow conditions in coastal and offshore environments, suggesting potential benefits for operational stability in marine integrated energy systems.
4. Conclusions
The dynamic thermal behavior of a shell-and-tube heat exchanger was investigated under the combined effects of wastewater viscosity and flow velocity. The main conclusions are as follows.
- (1)
-
At a wastewater viscosity of 10 times that of water, the wall temperature increases slightly and nonlinearly with increasing wastewater velocity. As the velocity rises from 0.8 m/s to 1.5 m/s, the wall temperature increases by only 0.09 °C. Although the absolute variation is small, the overall trend indicates a gradual rise in wall temperature with increasing wastewater-side thermal transport. The fitted results further show that the relationship between wall temperature and wastewater velocity can be described by a nonlinear polynomial correlation within the investigated range. This relatively stable wall-temperature response suggests that flow regulation may be used to adjust thermal performance without causing large temperature disturbances.
- (2)
-
The wastewater-side heat transfer coefficient shows the same general trend as the overall heat transfer coefficient: both increase with increasing sewage flow velocity and decrease with increasing viscosity. Within the investigated velocity range of 0.8–1.5 m/s, the wastewater-side heat transfer coefficient increases by 41.3% under all viscosity conditions. The improvement in the overall heat transfer coefficient is also more pronounced at higher viscosity, following the order: 10 times clear-water viscosity > 5 times clear-water viscosity > 2 times clear-water viscosity, with enhancement ranges of 18.2–20.6%. These results indicate that increasing flow velocity is an effective operational approach for compensating, at least partly, for heat transfer deterioration under high-viscosity conditions.
- (3)
-
This indicates that higher flow velocity weakens the sensitivity of wall temperature to viscosity variation. The fitted results further suggest that the relationship between wall temperature and wastewater viscosity follows a nonlinear quartic polynomial within the investigated range. Wall temperature increases nonlinearly with flow velocity under high viscosity; the absolute increase is small (<0.1%), suggesting that flow regulation can adjust thermal performance without causing large temperature disturbances.
- (4)
-
The dynamic fluctuation pattern of wall temperature changes significantly with both flow velocity and viscosity. When wastewater flow velocity varies, different viscosity levels show distinct response characteristics. At a viscosity of 1.45 × 10⁻⁶ m2/s, the wall temperature exhibits a three-peak fluctuation pattern, whereas at 1.45 × 10⁻⁵ m2/s it shows a single-peak trend characterized by an initial rise followed by a gradual decline. When viscosity varies, all flow-velocity cases exhibit a common transition from stronger fluctuations in the low-viscosity range to a more stable response in the high-viscosity range, although the detailed fluctuation pattern differs between the velocity intervals of 0.8–1.2 m/s and 1.2–1.5 m/s. These results highlight the nonlinear nature of viscosity-flow combined in dynamic wall-temperature behavior.
Overall, the proposed model is intended as a dynamic trend prediction tool for clarifying the combined roles of viscosity and flow velocity, rather than as a high-precision measurement model. The results provide mechanism-level insight into the thermal response of fouling-prone heat exchangers and may inform the analysis and operation of seawater/sewage-source heat pump systems in marine integrated energy applications. Further work is needed to validate the model under actual seawater conditions, including the effects of salinity, corrosion, and marine biofouling.
5. Limitations and Future Work
Several limitations of the present study should be acknowledged. First, the dynamic model is established under idealized boundary conditions and relies on a lumped-parameter formulation assuming uniform wall temperature. Second, the heat transfer analysis is based on steady-state correlations and does not explicitly account for the real-time evolution of fouling. Third, the conclusions are restricted to the investigated operating ranges of flow velocity (0.8–1.5 m/s) and kinematic viscosity (1.45 × 10⁻⁶–1.45 × 10⁻⁵ m2/s). Moreover, seawater-specific effects such as salinity variation, corrosion, and marine biofouling were not explicitly modelled in the present work. Future studies should incorporate more realistic marine operating conditions, including flow distortion caused by waves and tides, and further evaluate the applicability of advanced shell-and-tube heat exchangers in seawater-source heat pump systems.
Statement of the Use of Generative AI and AI-Assisted Technologies in the Writing Process
During the preparation of this manuscript, the authors used ChatGPT in order to refine sentence structure, enhance clarity, and ensure grammatical accuracy, without altering the core arguments or original ideas presented in the paper. After using this tool/service, the authors reviewed and edited the content as needed and take full responsibility for the content of the published article.
Acknowledgements
The authors would like to thank the financial support of Tianjin Municipal Science and Technology Bureau.
Author Contributions
Methodology, N.Q.; Software, W.H., N.Q., C.L. and S.Q.; Validation, C.L. and S.Q.; Investigation W.H., N.Q., C.L. and S.Q.; Writing Original Draft Preparation, W.H.; Review & Editing, N.Q.; Supervision, N.Q.; Project Administration, N.Q.; Funding Acquisition, N.Q.
Ethics Statement
Not applicable.
Informed Consent Statement
Not applicable.
Data Availability Statement
Data will be made available on request.
Funding
This work was supported by the Tianjin Youth Fund Project [grant number 15JCQNJC06800], the University-level College Students’ Innovation and Entrepreneurship Training Program of Tianjin University of Technology [grant number 202510060172].
Declaration of Competing Interest
The authors declare that they have no known competing financial interests or personal relationships that could have appeared to influence the work reported in this paper.
References
- Lian JJ, Cui L, Fu Q. Offshore Renewable Energy Advance. Mar. Energy Res. 2024, 1, 10006. DOI:10.70322/mer.2024.10006 [Google Scholar]
- Liu M, Jin Z, Zhang J, Yuan Y, Ma Q, Mo X, et al. Large-Scale Language Model Assisted Construction of Multi-Source Heterogeneous Knowledge Graphs for Marine Renewable Energy. Mar. Energy Res. 2026, 3, 10002. DOI:10.70322/mer.2026.10002 [Google Scholar]
- Qian L, Yi HM, Shen MY, Wang M. Combined coordination and spatio-temporal evolution of land-use benefits under the dual carbon goal: A case study in Anhui, China. Sci. Total Environ. 2023, 903, 166123. DOI:10.1016/j.scitotenv.2023.166123 [Google Scholar]
- Zheng J, Qin Q, Yu H, Wang P, Hu S, Ji Y, et al. Structural parameter optimization of capillary heat exchanger for a novel seawater source heat pump system using subsea tunnel seepage seawater. Appl. Therm. Eng. 2026, 294, 130602. DOI:10.1016/j.applthermaleng.2026.130602 [Google Scholar]
- Wang L, Wang L, Wang C, Xu C, Yin Y, Su H. Sustainability-driven techno-economic assessment of a seawater source heat pump system with heat recovery for mariculture. Renew. Energy 2025, 252, 123470. DOI:10.1016/j.renene.2025.123470 [Google Scholar]
- Jia X, Chen H, Yang Y, Xu C, Duanmu L, Wang Z. Research on integrative optimization operation of seawater heat pump, photovoltaic, and cross-seasonal heat storage systems. Renew. Energy 2025, 246, 122864. DOI:10.1016/j.renene.2025.122864 [Google Scholar]
- Wang L, Xu C, Wang C, Zhang L, Xu H, Su H, et al. Prospects and challenges of seawater source heat pump utilization in China: A systematic review. Renew. Sustain. Energy Rev. 2025, 210, 115247. DOI:10.1016/j.rser.2024.115247 [Google Scholar]
- Jia X, Yang Y, Xu C, Duanmu L, Wang Z. New criterion number correlation and similarity theory application on the seepage and heat transfer of a beach well intake system of seawater source heat pump. Sustain. Energy Technol. Assess. 2024, 64, 103718. DOI:10.1016/j.seta.2024.103718 [Google Scholar]
- Yu H, Tian Y, Zhao X, Hu S. Numerical investigation on operational performance of seawater-source heat pump system coupled with capillary-box heat exchangers. Case Stud. Therm. Eng. 2023, 52, 103724. DOI:10.1016/j.csite.2023.103724 [Google Scholar]
- Wang P, Liu Q, Xu D, Peng W, Liu F, Hou J, et al. Investigation of fouling development and kinetics in titanium alloy seawater heat exchanger tubes. Int. J. Heat Fluid Flow 2026, 117, 110107. DOI:10.1016/j.ijheatfluidflow.2025.110107 [Google Scholar]
- Lin W, Dong Z, Ning Z, Sun S, Cao Y. Numerical study on the flow and heat transfer characteristics of a marine seawater heat exchanger based on triply periodic minimal surface (TPMS). Appl. Therm. Eng. 2025, 281, 128765. DOI:10.1016/j.applthermaleng.2025.128765 [Google Scholar]
- Lin W, Dong Z, Ning Z, Sun S, Cao Y. N, S-carbon quantum dots as inhibitors in the pickling process of heat exchangers for enhanced performance in multi-stage flash seawater desalination. Desalination 2024, 589, 117969. DOI:10.1016/j.desal.2024.117969 [Google Scholar]
- Yoo YH, Jeong HK, Park W, Kim SH, Jeong YH. Study on the seawater cooled PRHRS of a nuclear propulsion ship with the upper heat exchanger for driving force and the seawater heat exchanger as an ultimate heat sink. Int. J. Nav. Archit. Ocean. Eng. 2024, 16, 100588. DOI:10.1016/j.ijnaoe.2024.100588 [Google Scholar]
- Cao YS, Chen YW, Ren PQ, Wang DJ, Zhuang ZB, Zhou WH. Modeling and performance analysis of solar energy and biogas complementary heating system in rural areas. Appl. Therm. Eng. 2025, 271, 126283. DOI:10.1016/j.applthermaleng.2025.126283 [Google Scholar]
- Huang CC. Characteristics and Operation Strategy Analysis of Sewage Heat Exchanger in Hot Spring Tail Water Source Heat Pump System Based on Sonocavitation. Master’s Thesis, Harbin University of Commerce, Harbin, China, 2025. DOI:10.27787/d.cnki.ghrbs.2025.000235 [Google Scholar]
- Li XY, Wang Y, Zhang L, Liu H, Zhao J, Sun W, et al. Operation Optimization Control Strategy of Sewage Source Heat Pump Heating System. Build. Energy Eff. 2023, 51, 48–54. DOI:10.3969/j.issn.2096-9422.2023.09.008 [Google Scholar]
- Lu GL. Energy-Saving Operation Strategy of Seawater Source Heat Pump System in Fujian Province. Fujian Constr. Sci. Technol. 2022, 36, 100–102. Available online: https://qikan.cqvip.com/Qikan/Article/Detail?id=7106757376 (accessed on 1 March 2022.).
-
Meng SS, Wang YT, Qin BY, He ZH, He TB, Mao N. An experimental study on influence of particles on falling film flow and heat transfer over horizontal tubes of spray heat exchanger of sewage source heat pump. Int. Commun. Heat Mass Transf. 2025, 167, 109370. DOI:10.1016/j.icheatmasstransfer.2025.109370 [Google Scholar]
- Steinhagen R, Smith J, Johnson A, Williams B, Brown C, Davis E, et al. Problems and Costs due to Heat Exchange Fouling in New Zealand Industries. Heat Transf. Eng. 1993, 14, 19–30. DOI:10.1080/01457639308939791 [Google Scholar]
-
Tang J, Zhang Y, Lu X. Heat Transfer Analysis of Droplets Impinging on the Rough Curved Surface. Heat Transf. Eng. 2025, 1–15. DOI:10.1080/01457632.2025.2521601 [Google Scholar]
- Meng SS, He ZH, He TB, Mao N. Improvement in heat transfer and flow pattern of sprayed falling on horizontal tubes with rib structure for a sewage source heat pump. Int. J. Therm. Sci. 2025, 208, 109431. DOI:10.1016/j.ijthermalsci.2024.109431 [Google Scholar]
- Benoît G, Philippe D, Grégory G. Wave Effects on Large-Scale Turbulent Flow Structures Propagating in the Water Column. Mar. Energy Res. 2025, 2, 10020. DOI:10.70322/mer.2025.10020 [Google Scholar]
- Zhang BH, Peng W, Li YD. State of the Art in Wave Energy Conversion Technologies in China. Mar. Energy Res. 2025, 2, 10004. DOI:10.70322/mer.2025.10004 [Google Scholar]
- Wang X, Li T, Yu YY, Liu XY, Liu YJ, Wang SD, et al. Energy saving and economic analysis of a novel PV/T combined multi-source heat pump heating system with phase change storage: A case study in cold zone in China. Energy Convers. Manag. 2024, 312, 118574. DOI:10.1016/j.enconman.2024.118574 [Google Scholar]
- Khan F, Raza A, Mahmoud M, Patil S, Al Shafloot T. A Comprehensive Review of Geothermal Reservoirs: Current Understanding and Future Outlook. Arab. J. Sci. Eng. 2025, 50, 14415–14439. DOI:10.1007/s13369-025-10246-2 [Google Scholar]
- Liu ZD, Li W, Zhang H, Wang Q, Chen J, Yang L, et al. Study of a Novel Ni-P-TiO2-PTFE Composite Surface for Inhibiting Microbial Fouling and Corrosion in Heat Exchanger. Case Stud. Therm. Eng. 2025, 74, 106993. DOI:10.1016/j.csite.2025.106993 [Google Scholar]
- Dong JY, Zhang TT, Fu YP, Zheng BM, Chai YS. Study on connection and properties of green assembled building steel structures. Results Phys. 2019, 12, 1126–1132. DOI:10.1016/j.rinp.2018.12.088 [Google Scholar]
- Epstein N. Fouling in Heat Exchangers. In International Heat Transfer Conference Digital Library; Begel House Inc.: Danbury, CT, USA, 1978. [Google Scholar]
- Li N, Yang Q, Yao E, Zhang N. Synergism between Particulate and Microbial Fouling on a Heat Transfer Surface using Treated Sewage Water. Appl. Therm. Eng. 2019, 150, 791–802. DOI:10.1016/j.applthermaleng.2018.12.157 [Google Scholar]
- Shen C, Wang Y, Tang Z, Yao Y, Huang Y, Wang X. Experimental Study on the Interaction between Particulate Fouling and Precipitation Fouling in the Fouling Process on Heat Transfer Tubes. Int. J. Heat Mass Transf. 2019, 138, 1238–1250. DOI:10.1016/j.ijheatmasstransfer.2019.04.136 [Google Scholar]
- Wang Y. Study on Particulate Fluidization Descaling of Non-Clean Water Heat Transfer Surface. Master’s Thesis, Qingdao University, Qingdao, China, 2016. Available online: https://kns.cnki.net/kcms2/article/abstract?v=mDcNmAOuO1Mye1B6v5ArRMB6KmkczerA4Jps4o3wgN61rk7NTHX4qaysMijk6oR8Q2Pw4KUM82RWNsCaaU6Ink5Ww_stl8Cl33rG4gBCSBQKyHEwG_vhmXXHD3UXYAsXt2ret5UYELWRc7oXaVeDnBetJQch5v3ysKfzGTu4AuNT98F_-TILjrvRGVOr_FV3&uniplatform=NZKPT&language=CHS (accessed on 4 June 2016).
- Wang YM. Numerical Simulation and Experimental Study on Enhanced Heat Transfer of Sewage Heat Exchanger in Sewage Source Heat Pump System. Master’s Thesis, Chang’an University, Xi’an, China, 2018. Available online: https://kns.cnki.net/kcms2/article/abstract?v=mDcNmAOuO1NTc7AgXvcMFqp03lTpL7mhaivfUuEuR3-54ergqmoIRXqxwSN56862cqWzGwbay34AMsAkN0tvNCs8E4BibNbvAMRzfcJFAfOqu1OLZzoh65eZNeltKFBeIpOsZqfcgRGWtBg9rwldGQL9d09zSCYXoL3yVb7XZBSs-eBjliST-xatMEfLziUf&uniplatform=NZKPT&language=CHS (accessed on 9 May 2018).
- Zhu JY, Lin G, Hu T, Gao YH, Wang SX, Li SW, et al. Recent development in numerical simulation of ultrasonic process enhancement. Chem. Eng. Sci. 2026, 319, 122302. DOI:10.1016/j.ces.2025.122302 [Google Scholar]
- Maeno T, Mori KI, Ogihara T, Fujita T. Removal of Thin Oxide Scale by Ultrasonic Cleaning with Diluted Hydrochloric Acid in Hot Stamping of Bare 22MnB5 Sheet using Resistance Heating. Procedia Manuf. 2019, 29, 225–231. DOI:10.1016/j.promfg.2019.02.130 [Google Scholar]
- Wang GB. Study on the Effect of Ultrasonic Descaling Technology on Fouling in Sewage Heat Exchange Tubes. Master’s Thesis, Shandong Jianzhu University, Jinan, China, 2022. DOI:10.27273/d.cnki.gsajc.2022.000677 [Google Scholar]
- Zhang AP, Xu ZQ, Yang Z, Xia RT, Ding Q. Experimental Study on the Effect of Enhanced Tube Type on Ultrasonic Descaling. Appl. Acoust. 2017, 36, 129–134. DOI:10.11684/j.issn.1000-310X.2017.02.006 [Google Scholar]
- Jia Y, Guan K, Mai Z, Fang S, Li Z, Zhang P, et al. Thin continuous membrane coating with high surface energy for comprehensive antifouling seawater distillation. Water Res. 2023, 244, 120439. DOI:10.1016/j.watres.2023.120439 [Google Scholar]
- Abedin MZ, Kim N. An Experimental Study on Accelerated Fouling of Aluminum Oxide and Ferric Oxide Particles in Internally Enhanced Tubes. J. Mech. Sci. Technol. 2016, 30, 5707–5714. DOI:10.1007/s12206-016-1141-2 [Google Scholar]
- Varnaseri M, Peyghambarzadeh SM. Interference effect of suspended particles on the crystallization fouling: A critical review. Heat Mass Transf. 2023, 59, 655–680. DOI:10.1007/s00231-022-03285-0 [Google Scholar]
- Wang CZ, Yang H, Liu EH, Zhao KZ, Liu SQ. Water Quality Treatment for Shell-and-Tube Heat Exchanger Inlet Water. Guangzhou Chem. Ind. 2016, 23, 75–76+83. Available online: https://qikan.cqvip.com/Qikan/Article/Detail?id=670818476 (accessed on 22 December 2016).
- Lin L, Jiang W, Xu X, Xu P. A Critical Review of the Application of Electromagnetic Fields for Scaling Control in Water Systems: Mechanisms, Characterization, and Operation. NPJ Clean Water 2020, 3, 25. DOI:10.1038/s41545-020-0071-9 [Google Scholar]
- Zong F. Formation of Fouling and Its Influencing Factors on Shell-and-Tube Heat Exchanger Design. Chem. Eng. Des. Commun. 2023, 5, 69–71+151. Available online: https://qikan.cqvip.com/Qikan/Article/Detail?id=7109714971 (accessed on 28 May 2023).
- Wang Y, Shen C, Wan Z, Luo Z, Yao Y. Investigation on the Fouling Mechanism at Different Water Velocities in Internally Enhanced Tubes. Heat Mass Transf. 2022, 58, 1485–1506. DOI:10.1007/s00231-022-03177-3 [Google Scholar]
- Niezgoda-Żelasko B, Kuchmacz J. CFD Modelling of the Flow of Ice Slurry in Plate Heat Exchanger Channels. Energy 2025, 317, 134700. DOI:10.1016/j.energy.2025.134700 [Google Scholar]
- Li N. Sewage Treatment Degradation Thermal Energy Management System of Sewage Treatment Plant. Therm. Sci. 2020, 24, 3149–3156. DOI:10.2298/TSCI191110105L [Google Scholar]
- Prabakaran R, Mohanraj T, Dhamodharan P, Kim SC. Comparative Condensation Analysis of Low-GWP Refrigerants in a Plate Heat Exchanger with Response Surface Methodology Optimization. Int. Commun. Heat Mass Transf. 2025, 169, 109653. DOI:10.1016/j.icheatmasstransfer.2025.109653 [Google Scholar]
- Zhang N, Wei X, Yang QR, Li N, Yao ER. Numerical simulation and experimental study of the growth characteristics of particulate fouling on pipe heat transfer surface. Heat Mass Transf. 2019, 55, 687–698. DOI:10.1007/s00231-018-2451-y [Google Scholar]
- Xu ZM, Wang JT, Jia YT, Han ZM. Experimental Study on Mixed Microbial Fouling Characteristics of Plate Heat Exchanger. Chem. Ind. Eng. Prog. 2016, 35, 3447–3453. DOI:10.16085/j.issn.1000-6613.2016.11.009 [Google Scholar]
- Karimi Shoar Z, Pourpasha H, Zeinali Heris S, Mousavi SB, Mohammadpourfard M. The Effect of Heat Transfer Characteristics of Macromolecule Fouling on Heat Exchanger Surface: A Dynamic Simulation Study. Can. J. Chem. Eng. 2023, 101, 5802–5817. DOI:10.1002/cjce.24832 [Google Scholar]
- Liu LS, Li JF, Lian TC, Liu XC, Liu HL. Experimental study on the effect of fouling in tubes on pool boiling heat transfer characteristics. Int. Commun. Heat Mass 2025, 163, 108710. DOI:10.1016/j.icheatmasstransfer.2025.108710 [Google Scholar]
- Arsenyeva O, Kenig EY. Heat exchangers with wavy-like structure: A review of applications for phase transition systems. Therm. Sci. Eng. Prog. 2025, 62, 103580. DOI:10.1016/j.tsep.2025.103580 [Google Scholar]
- Francolle de Almeida C, Saget M, Delaplace G, Jimenez M, Fierro V, Celzard A. Innovative Fouling-Resistant Materials for Industrial Heat Exchangers: A Review. Rev. Chem. Eng. 2023, 39, 71–104. Available online: https://www.degruyterbrill.com/document/doi/10.1515/revce-2020-0094/html (accessed on 22 July 2022).
- Xu ZM, Zheng WC, Wang JT, Wang YH. Experimental Study on Mixed Fouling Characteristics of Microorganism and Particulate in Circular Tube. J. Northeast Electr. Power Univ. 2017, 37, 44–50. DOI:10.3969/j.issn.1005-2992.2017.05.009 [Google Scholar]
- Zhuang ZY, Nan KY, Zhao J, Zhang CX, Yin HY. Numerical simulation of deposition characteristics of microorganisms and particles mixed fouling in sewage heat exchange tubes. J. Mech. Sci. Technol. 2026, 40, 683–697. DOI:10.1007/s12206-025-1257-3 [Google Scholar]
- Hu J, Wen J. Modelling the Correlation Between Water Resources Carbon Emission and Water Consumption. Therm. Sci. 2022, 26, 3559–3569. DOI:10.2298/TSCI220113082H [Google Scholar]