Deadline for manuscript submissions: 05 October 2025.


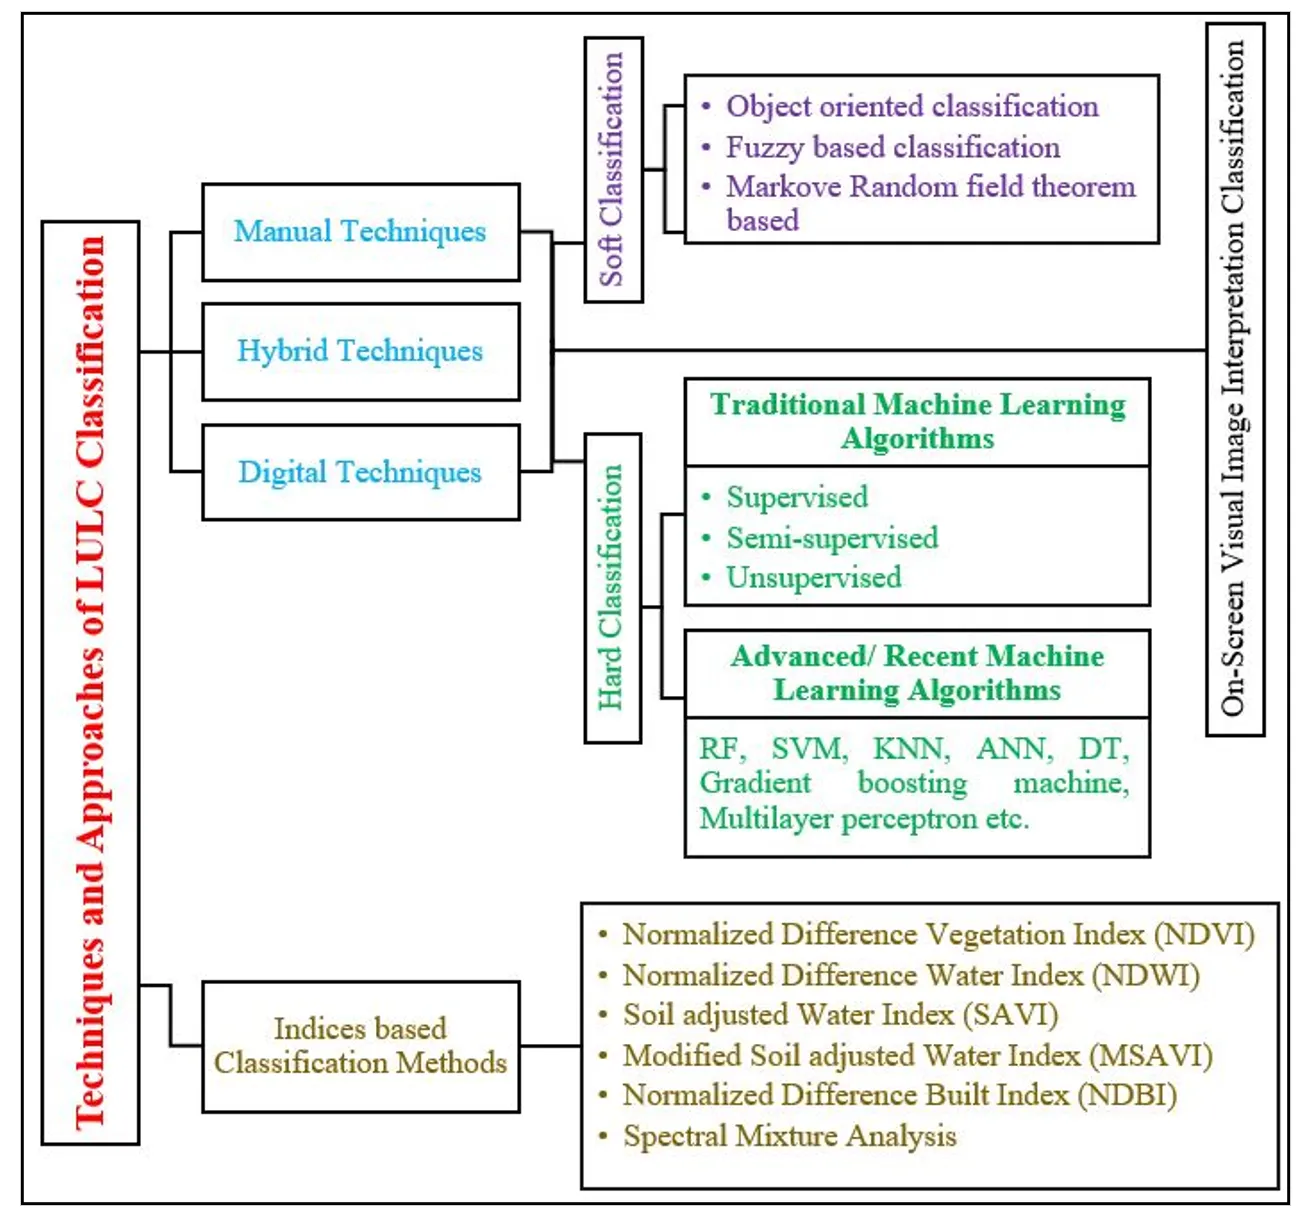
For the sustainable management of natural resources and to understand how the climate affects the landscape, accurate land use and land cover (LULC) classification is essential. Robust classification techniques and high-quality datasets are necessary for precise and effective LULC classification. The effectiveness of various combinations of satellite data and classification techniques must be carefully evaluated to help choose the optimal strategy for LULC classification, given the growing availability of satellite data, geospatial analysis tools, and classification techniques. This study focuses on the LULC classification of Jalandhar, Punjab, India, using machine learning (ML) algorithms and visual image interpretation. Sentinel-2 satellite data, with its high spatial and spectral resolution, has been utilized for feature extraction and classification. Python was employed for implementing various ML algorithms, including Random Forest (RF), Support Vector Machine (SVM), K-Nearest Neighbor (KNN), Gradient Boosting (GB), Multi-Layer Perceptron (MLP), and Decision Tree (DT), while ArcGIS was used to classify LULC using visual image interpretation and for maps preparation. Agriculture was the dominant class across all methods, with GB estimating 1774.26 sq.km, followed by plantation (268.13 sq.km) and built-up areas (171.76 sq.km). Waterbodies were mapped with high precision due to their distinct spectral features, with estimates ranging from 18.34 sq.km (GB) to 26.05 sq.km (Visual interpretation). Among all models, GB outperformed others with the highest overall accuracy (95.0%) and a kappa value of 0.94, followed by RF (94.2%), and SVM (93.8%). Visual interpretation achieved a comparative accuracy of 90.1%, though it showed limitations in distinguishing spectrally mixed classes like plantation and built-up. This study concludes that while Visual interpretation remains a useful and accessible method, especially for real-time interpretation, ML-based approaches, particularly GB and RF, offer superior accuracy and reliability. The study highlights the importance of visual interpretation for a better accurate LULC at a regional level; meanwhile, leveraging advancements in ML algorithms in a hybrid approach will enhance the accuracy in many-fold.
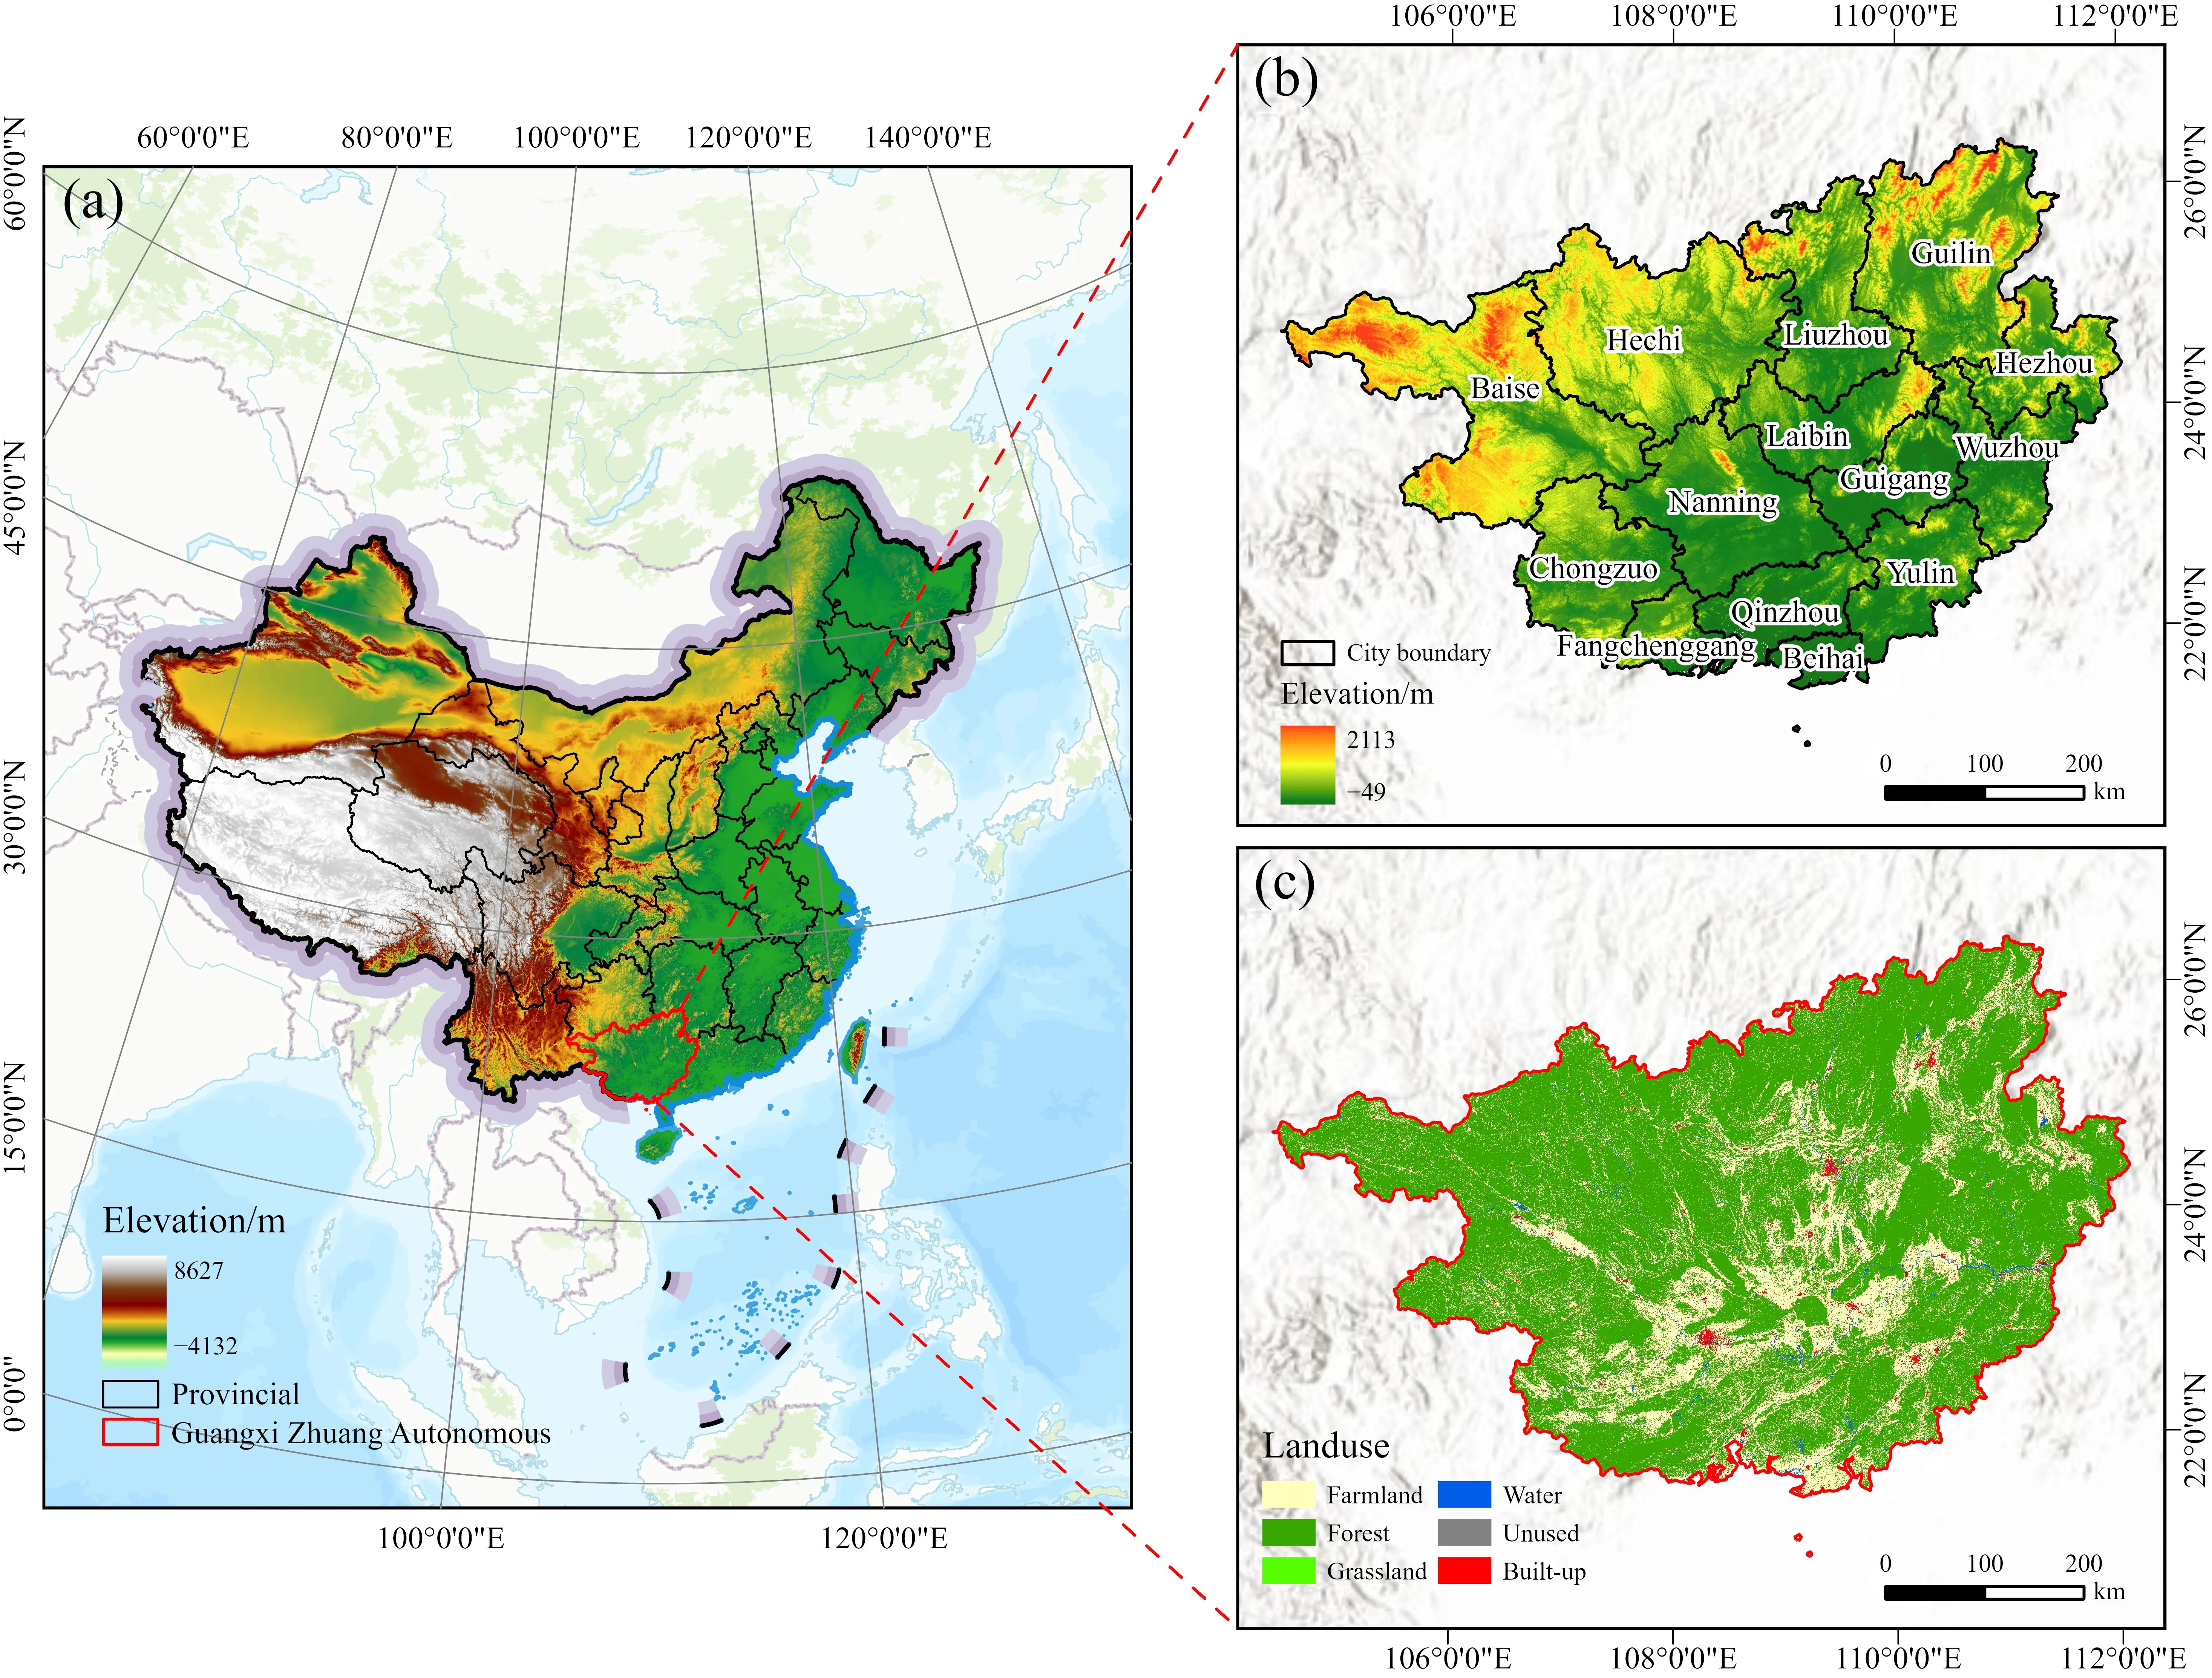
In the context of global climate change, enhancing ecosystem carbon storage (CS) capacity and reducing ecological risk have become essential pathways toward achieving carbon neutrality. Land use/land cover change (LUCC), as a key factor influencing both CS and ecological security, has garnered widespread attention in recent years. However, most existing studies have focused on small-scale regions, lacking comprehensive assessments at the provincial level under multiple scenarios. To address this gap, this study takes the ecologically fragile karst region of Guangxi as a case study. Based on the PLUS-InVEST model, this study construct three land use scenarios (natural development, economic development, and ecological protection) to simulate land use changes by 2030, and then conduct an integrated assessment of the dynamics of ecosystem CS and the spatial distribution of landscape ecological risk under different scenarios. The results show that: (1) From 2000 to 2020, land use in Guangxi has shown a general trend of decreasing farmland area and increasing construction land. CS has exhibited notable spatial heterogeneity over time, with an overall upward trend, particularly in forest-rich areas where CS has increased significantly. (2) By 2030, CS will be jointly driven by land use patterns, climate change, and socioeconomic factors under different scenarios, with the ecological conservation scenario leading to the greatest increase in CS. (3) Spatial auto-correlation and LISA cluster analyses reveal a spatial coupling pattern of high carbon–low risk and low carbon–high risk, suggesting that ecological conservation measures can effectively enhance carbon sequestration. These findings provide scientific support for land use optimization, ecological protection and CS management in Guangxi under the carbon neutrality goal, and offer valuable insights for land use planning and ecological risk regulation in ecologically fragile karst regions.
This paper investigates whether climate-related preferences and risks constitute a systematically priced factor in financial markets and whether the observed greenium provides evidence of such pricing across sovereign bonds, corporate bonds, and equity markets. The development of green finance has been an important financial breakthrough in the domain of sustainable finance. Green bonds and green equities constitute the two primary categories of environmentally oriented investment instruments that have gained significant traction in financial markets. They constitute a financial market response to the challenges and risks brought about by climate change and are an important driver in accelerating the transition of the planet toward a more sustainable economic development model and carbon neutrality. An important question, from the investors and issuers (including sovereign) standpoint, is the extent to which climate change risk is (systematically) priced in financial markets. Establishing the size of the implied green risk premium is relevant for all market participants (investors and issuers) and policymakers alike. We review the evidence of green risk premium (greenium) in asset markets across jurisdictions in developed and (some) emerging markets. All in all, the estimated greenium is more often than not statistically significant, albeit relatively small in its size. Based on evidence from (mostly) academic and institutional literature, we present key insights into how investors’ environmental concerns can drive green asset prices. We report that over time the greenium can widen from 0 up to nearly 20 basis points; its impact on asset prices is tangible, especially for long duration assets. This does indicate that the greenium exists, and it is relevant. Also, it suggests that (at least some) investors appear to be willing to “subsidise” green projects by paying a premium on holding green assets. Moreover, greenium can have a persistent, albeit time-varying, impact on asset prices. Green bonds issued by the public sector display a more consistent pattern in the estimated greenium level across different markets, possibly with a greater size for emerging market debt.
