
Anthropology of Undernutrition Among Indian Tribal Adults: A Comprehensive Review
Anthropology of Undernutrition Among Indian Tribal Adults: A Comprehensive Review
Kaushik Bose
1
Saheli Biswas
1,*
 Mahua Chanak
1
Pijush Kanti Roy
1
Sarabjit Mastana
2,*
Mahua Chanak
1
Pijush Kanti Roy
1
Sarabjit Mastana
2,*
Received: 22 January 2026 Revised: 31 March 2026 Accepted: 16 April 2026 Published: 08 May 2026

© 2026 The authors. This is an open access article under the Creative Commons Attribution 4.0 International License (https://creativecommons.org/licenses/by/4.0/).
1. Introduction
India, often described as a ‘melting pot’ of races, is home to a vast diversity of tribal populations. These groups exhibit remarkable diversity in territorial distribution, linguistic affiliations, racial backgrounds, religious beliefs, and cultural heritage [1]. They also represent various levels of political, economic, and educational development. Historically, during the pre-independence era, the aboriginal tribes of India faced significant oppression under British rule, as the imperialists viewed them as potential threats to the national movement. British policies aimed to isolate the tribes, declaring their regions as restricted areas, thus curbing their interaction with the rest of Indian society. This exclusionist approach hindered the socio-economic development of tribal communities [2].
Following India’s independence in 1947, the Government of India recognized the special status of the tribal populations under Article 342 of the Indian Constitution (1950), designating them as ‘Scheduled Tribes’ (ST) [3]. Several constitutional provisions were implemented to protect them from social and economic exploitation and to promote their cultural, economic, and political interests. To ensure adequate representation, seats were reserved for STs in political institutions and various public services. Moreover, special administrative measures were instituted, such as the creation of the 5th and 6th Schedules of the Constitution, which provide governance frameworks specific to tribal areas. Numerous initiatives have since been introduced to integrate the tribal populations into mainstream society and facilitate their development [3].
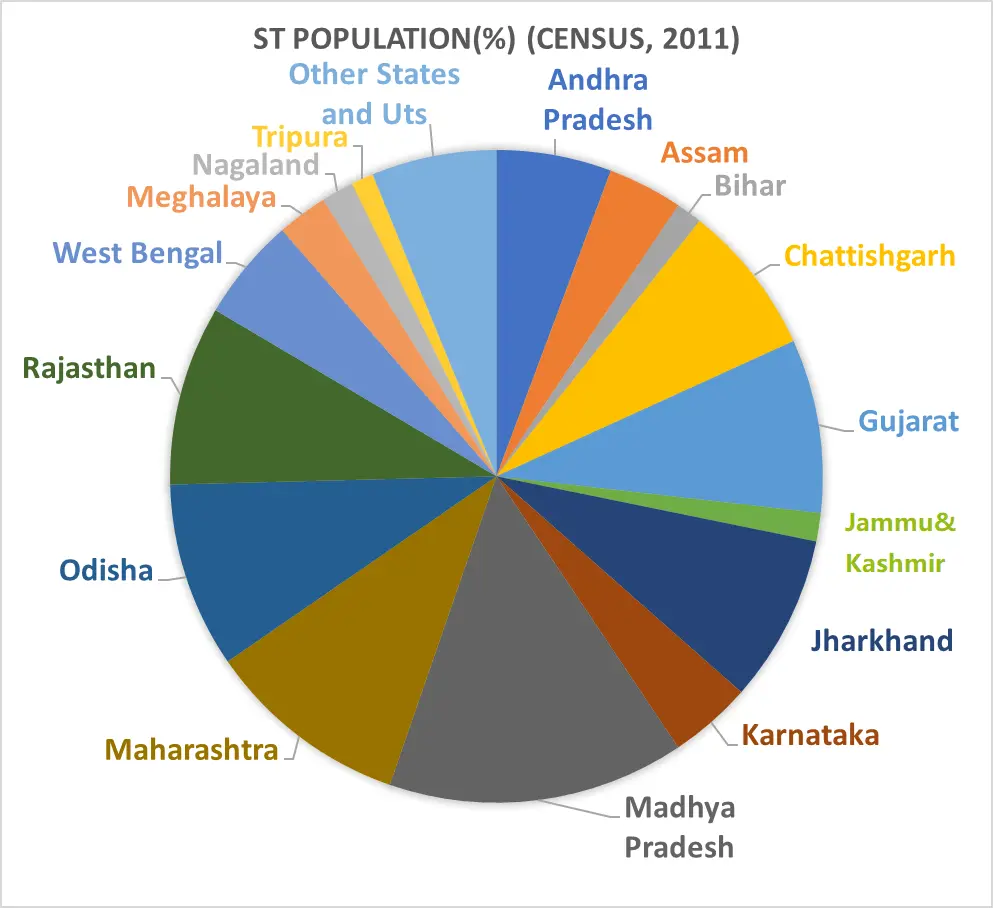
In support of these efforts, the Ministry of Tribal Affairs (MoTA) and the National Commission for Scheduled Tribes (NCST) were established to oversee the implementation of policies and programs for the advancement of STs [4]. According to the 2011 Census of India, the nation is home to 705 officially recognized ethnic groups, 75 of which are classified as ‘Particularly Vulnerable Tribal Groups’ (PVTGs), spread across 26 states and 4 union territories. India, as one of the largest low- and middle-income countries (LMICs), has the world’s largest tribal population, with 104.3 million individuals, constituting approximately 8.6% of the country’s total population (Figure 1).
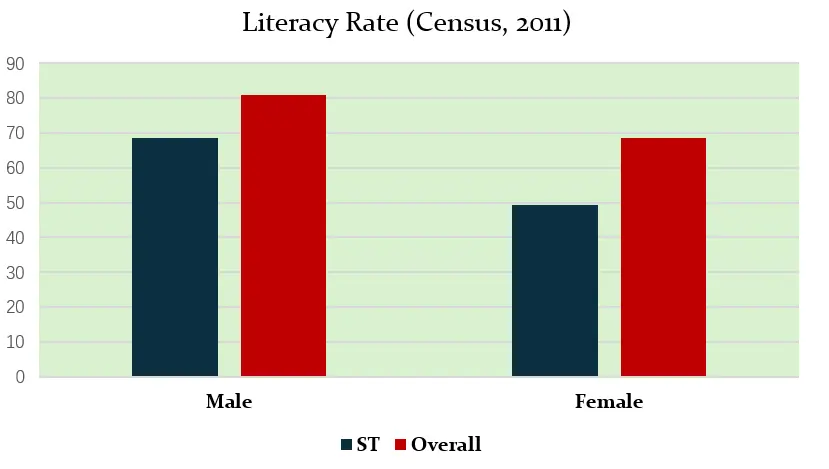
The tribal populations have traditionally lived in close harmony with various elements of nature, and their shyness in contact with the public at large is one of their distinct characteristics, which the Lokur committee also acknowledged as a criterion for a community to be identified as a Scheduled Tribe [5,6]. STs have a lower literacy rate than the general population as per the last census of India [7] (Figure 2).
India has made significant strides since gaining independence more than seven decades ago. It has emerged as the world’s largest democracy and now ranks as the 5th largest economy globally. However, despite this commendable progress, a substantial segment of the population, particularly the tribal communities, remains excluded from this success. Tribes in India continue to grapple with poverty and social inequality and exhibit some of the poorest social and developmental indicators [8]. While 20.5% of the non-tribal population lives below the poverty line, this figure rises to 40.6% for the tribal population. Despite ongoing efforts by the government to close the gap between Scheduled Tribes (STs) and non-STs, the fifth Indian National Family Health Survey [9]. revealed that tribal populations still lag behind on most health indicators.
Body Mass Index (BMI), a cost-effective and non-invasive measure, has become the most widely used indicator for assessing chronic energy deficiency (CED) in large-scale surveys (Table 1).
Table 1. WHO (1995) [10] expert committee suggested classification system to identify the population with a public health problem on the basis of low BMI (<18.5 kg/m2), based on BMI distribution in adult population Worldwide.
|
Situation |
% of Population with BMI < 18.5 kg/m2 |
|---|---|
|
Low prevalence (Warning Sign, monitoring required) |
5–9 |
|
Medium Prevalence (Poor Situation) |
10–19 |
|
High Prevalence (Serious Situation) |
20–39 |
|
Very High Prevalence (Critical Situation) |
>40 |
It provides a useful estimate of an individual’s risk of developing conditions like diabetes, malnutrition, and hypertension. Originally conceptualized by Belgian statistician Adolphe Quetelet, the Quetelet Index was later refined by Ancel Keys during his analysis of data from the Seven Countries Study, leading to its modern name, “Body Mass Index” (BMI) in 1972 [11]. Chronic energy deficiency (CED) is characterized by a weight-stable state of energy imbalance, caused by long-term inadequate energy intake, and has been linked to reduced productivity, higher morbidity, and increased mortality [12]. For over two decades, researchers across India have assessed the extent of CED in tribal populations using BMI as a key measure (see Table 2, Table 3 and Table 4). According to NFHS-5 (2019–2021) [9], children born to mothers with a BMI < 18.5 kg/m2 were more likely to be stunted, wasted, and underweight compared to those born to mothers with normal or higher BMI.
Table 2. Prevalence of CED (based on BMI) among adult tribal population residing in various states of India as revealed in NFHS-5, 2019–2021.
|
Zones |
States of India |
CED (%) |
Nutritional Condition |
|
|---|---|---|---|---|
|
Male |
Female |
|||
|
North |
Himachal Pradesh |
5.9 |
13.7 |
Poor |
|
Jammu and Kashmir |
3.6 |
6.5 |
Warning |
|
|
Rajasthan |
16.7 |
24.8 |
Serious |
|
|
North-East |
Arunachal Pradesh |
3.2 |
4.2 |
Warning |
|
Assam |
7.4 |
11.8 |
Warning |
|
|
Manipur |
3.8 |
6.2 |
Warning |
|
|
Meghalaya |
9.4 |
10.9 |
Poor |
|
|
Mizoram |
5.2 |
5.4 |
Warning |
|
|
Nagaland |
7.2 |
10.9 |
Warning |
|
|
Sikkim |
2.8 |
4.1 |
Warning |
|
|
Tripura |
10.7 |
12.4 |
Poor |
|
|
East |
Bihar |
23.5 |
29.6 |
Serious |
|
Jharkhand |
17.9 |
28.0 |
Serious |
|
|
Odisha |
18.2 |
30.6 |
Serious |
|
|
West |
Gujarat |
25.1 |
35.1 |
Serious |
|
Maharashtra |
23.0 |
30.2 |
Serious |
|
|
Goa |
9.7 |
17.1 |
Poor |
|
|
Central |
Chattishgarh |
20.5 |
29.3 |
Serious |
|
Madhya Pradesh |
19.6 |
27.4 |
Serious |
|
|
Uttar Pradesh |
17.5 |
22.4 |
Serious |
|
|
South |
Andhra Pradesh |
28.1 |
21.1 |
Serious |
|
Karnataka |
20.1 |
21.4 |
Serious |
|
|
Kerala |
13.6 |
18.9 |
Poor |
|
|
Tamil Nadu |
13.3 |
19.6 |
Poor |
|
|
Telengana |
19.7 |
21.5 |
Poor |
|
|
India |
Overall |
18.4 |
25.5 |
Serious |
Table 3. Reviewed Studies assessing nutritional status of Tribal population of India based on BMI.
|
Regions |
States |
Tribe |
Mean BMI (kg/m2) |
References |
|
|---|---|---|---|---|---|
|
Male |
Female |
||||
|
North & Northeastern region |
Uttarakhand |
Bhotia |
19.5 |
- |
[13] |
|
Rajasthan |
Mina |
17.6 |
- |
||
|
Udham Singh Nagar, Uttarakhand |
Tharu |
21.2 |
21.5 |
[14] |
|
|
Arunachal Pradesh |
Apatani |
23.5 |
22.8 |
[15] |
|
|
Baran, Rajasthan |
Saharia |
- |
17.4 |
[16] |
|
|
Meena |
- |
20.5 |
|||
|
Eastern India |
Baleswar, Mayurbhanj, Sundergarh,Keonjhar Orissa |
Bhumijia |
18.9 |
18.5 |
[17] |
|
Purulia, West Bengal |
Santals |
19.5 |
18.1 |
[18] |
|
|
West Midnapore, West Bengal |
Munda |
19.4 |
- |
[19] |
|
|
Oraon |
19.5 |
||||
|
Gamla, Jharkhand |
Oraon |
18.0 |
- |
[20] |
|
|
Orissa |
Desi Kond |
17.6 |
- |
[13] |
|
|
West Bengal, Orissa |
Seven tribal groups |
19.2 |
18.7 |
[21] |
|
|
Jalpaiguri, West Bengal |
Oraon |
18.3 |
18.1 |
[22] |
|
|
Mayurbhanj, Orissa |
Lodha |
19.6 |
- |
[23] |
|
|
Kheria |
19.1 |
- |
|||
|
West Midnapore, West Bengal |
Bhumij |
18.6 |
- |
[24] |
|
|
Purulia, West Bengal |
Sabar |
18.9 |
- |
[25] |
|
|
Mayurbhanj, Orissa |
Lodha |
- |
17.6 |
[26] |
|
|
West Midnapore, West Bengal |
Ho |
21.4 |
20.6 |
[27] |
|
|
West Midnapore, West Bengal |
Oraon |
17.9 |
19.9 |
[28] |
|
|
Purulia, West Bengal |
Birhor |
20.9 |
20.2 |
[29] |
|
|
West Bengal |
Sabar |
19.3 |
18.6 |
[29] |
|
|
Santhal |
20.1 |
19.4 |
|||
|
Bhumij |
20.4 |
19.4 |
|||
|
East Singhbhum, Jharkhand |
Santal |
22.7 |
22.9 |
[30] |
|
|
Sundarban, West Bengal |
Munda |
19.0 |
18.1 |
[31] |
|
|
Central India |
Madhya Pradesh |
Saharia |
19.1 |
- |
[13] |
|
Varanashi-Mirzapur, Uttar Pradesh |
Kharwar |
21.5 |
20.5 |
[32] |
|
|
Bilaspur, Chattishgarh |
Gond |
16.9 |
20.3 |
[33] |
|
|
Chandauli, Uttar Pradesh |
Tribal women |
- |
18.7 |
[34] |
|
|
Satna, Madhya Pradesh |
Mawasi |
- |
19.5 |
[35] |
|
|
Western India |
Gujarat |
Tadvi |
18.1 |
- |
[13] |
|
Sabarkantha, Gujarat |
Tribal women |
- |
19.8 |
[36] |
|
|
Southern India |
Vishakhapatnam. Andhra Pradesh |
Tribal women |
- |
22.9 |
[37] |
|
Kainatty, Wayanad, Kerala |
Tribal women |
- |
18.9 |
[38] |
|
|
Mysore, Karnataka |
Jane Kuruba |
18.7 |
- |
[39] |
|
|
Island Communities |
Nicobar, Great Nicobar Island |
Shompens |
22.6 |
22.3 |
[40] |
|
Nicober Island |
Car Nicobarase |
21.9 |
- |
[13] |
|
Table 4. Prevalence of Undernutrition among tribal people as yielded from reviewed studies.
|
Regions |
States |
Tribe |
Prevalence of CED (%) |
References |
|
|---|---|---|---|---|---|
|
Male |
Female |
||||
|
North & Northeastern region |
Udham Singh Nagar, Uttarakhand |
Tharu |
26.2 |
18.9 |
[14] |
|
Arunachal Pradesh |
Apatani |
2.3 |
0.7 |
[15] |
|
|
Meghalaya |
Khasi |
- |
19 |
[41] |
|
|
Kashmir |
Gujjar, Bakerwal |
- |
90.7 |
[42] |
|
|
Baran, Rajasthan |
Saharia |
- |
68 |
[16] |
|
|
Meena |
- |
24 |
|||
|
Manipur |
Meitei |
- |
1.9 |
[43] |
|
|
Eastern India |
Baleswar, Mayurbhanj, Sundergarh, Keonjhar Orissa |
Bhumijia |
48.5 |
54.8 |
[17] |
|
Purulia, West Bengal |
Santals |
30.6 |
63.4 |
[18] |
|
|
West Midnapore, West Bengal |
Munda |
35.8 |
- |
[19] |
|
|
Oraon |
37.5 |
||||
|
Gamla, Jharkhand |
Oraon |
63.9 |
- |
[20] |
|
|
West Bengal & Orissa |
Seven tribal groups |
40.7 |
51.8 |
[21] |
|
|
Purulia, West Bengal |
Birhor |
19.5 |
33.3 |
[29] |
|
|
Jalpaiguri, West Bengal |
Oraon |
18.3 |
18.1 |
[22] |
|
|
Mayurbhanj, Orissa |
Lodha |
48.5 |
- |
[23] |
|
|
Kheria |
50.3 |
- |
|||
|
Bankura, West Bengal |
Santal |
44.4 |
50.0 |
[44] |
|
|
West Midnapore, West Bengal |
Bhumij |
52.3 |
- |
[24] |
|
|
Purulia, West Bengal |
Sabar |
47.2 |
- |
[25] |
|
|
West Midnapore, West Bengal |
Ho |
16.8 |
27.5 |
[27] |
|
|
Mayurbhanj, Orissa |
Lodha |
- |
68.7 |
[26] |
|
|
West Midnapore, West Bengal |
Oraon |
72 |
40 |
[28] |
|
|
Purulia, West Bengal |
Birhor |
9.5 |
36.4 |
[29] |
|
|
West Bengal |
Sabar |
59.1 |
18.6 |
[45] |
|
|
Santhal |
20.1 |
19.4 |
|||
|
Bhumij |
20.4 |
19.4 |
|||
|
East Singhbhum, Jharkhand |
Santal |
5.9 |
8.1 |
[30] |
|
|
Sundarban, West Bengal |
Munda |
37.0 |
43.0 |
[31] |
|
|
Central India |
Varanashi-Mirzapur, Uttar Pradesh |
Kharwar |
21.6 |
32.5 |
[32] |
|
Bilaspur, Chattishgarh |
Gond |
17 |
45 |
[33] |
|
|
Chandauli, Uttar Pradesh |
Tribal women |
- |
56.7 |
[34] |
|
|
Satna, Madhya Pradesh |
Mawasi |
- |
51 |
[35] |
|
|
Western India |
Sabarkantha, Gujarat |
Tribal women |
- |
42 |
[36] |
|
Southern India |
Telengana and Andhra Pradesh |
Chenchu |
41 |
42 |
[46] |
|
Kodagu, Karnataka |
Jenu Kuruba |
100 |
96.5 |
[47] |
|
|
Vishakhapatnam. Andhra Pradesh |
Tribal women |
- |
18.2 |
[37] |
|
|
Udupi, Karnataka |
Koraga |
93.4 |
88.3 |
[48] |
|
|
Kainatty, Wayanad, Kerala |
Tribal women |
- |
53.8 |
[38] |
|
|
Mysore, Karnataka |
Jane Kuruba |
53.8 |
- |
[39] |
|
|
Island Communities |
Nicobar, Great Nicobar Island |
Shompens |
5.3 |
8.3 |
[40] |
NFHS-5 highlights the unacceptably high infant mortality rate (41.6%) and under-5 mortality rate (50.3%) among tribal groups. Furthermore, tribal children exhibit disproportionately high rates of stunting (40.2%), wasting (23.1%), and underweight prevalence (39.4%). In terms of nutritional status, both tribal adult males (19.2%) and females (25.5%) were found to be thinner (BMI ≤ 18.5 kg/m2) than their non-tribal counterparts. Chronic Energy Deficiency (CED) remains a significant health issue among tribal populations across most Indian states (Table 2). Additionally, the prevalence of anaemia is notably higher among STs, with 64.6% of tribal women affected compared to 32.7% of tribal men [9]. A global study examining the health of indigenous and tribal populations across 23 countries and 28 populations found that stunting is 8% more common among tribal groups than non-tribal populations [49].
Several factors contribute to the poor health outcomes observed among tribal communities, including inadequate healthcare facilities, limited access to services, malnutrition, high disease prevalence, entrenched superstitions, and widespread tobacco addiction [35,38,50].
The objective of this study was to conduct a systematic review of the available literature published between 2010 and 2024 on the nutritional status of adult tribal populations in India, with a focus on Chronic Energy Deficiency (CED). The study used Body Mass Index (BMI) as an indicator of nutritional status, based on the World Health Organization [10]. classification of low BMI. This review sought to highlight trends in CED prevalence among tribal groups, who represent a vulnerable segment of the Indian population. The analysis further utilized national demographic and health data sources to contextualize the findings.
2. Materials and Methods
2.1. Data Sources
To acquire relevant data for the review, two major national reports were consulted:
-
The Census of India (2011) [7], was used to obtain statistical profiles of the tribal population, including demographic distribution, population size, sex ratio, literacy levels, and rural–urban composition.
-
The report of 5th round of National Family Health Survey [9] was used to collect information on health and nutritional indicators of tribal populations at the national and state levels, including body mass index (BMI), prevalence of underweight (BMI < 18.5 kg/m2), anaemia, and other relevant health outcomes.
Additionally, a comprehensive literature search was conducted using the following electronic databases:
-
-
Google Scholar
-
-
PubMed
-
-
JSTOR
The search focused on peer-reviewed studies published in English between 2010 and 2024. The search keywords included: India, tribe, adults, undernutrition, nutritional status, BMI, chronic energy deficiency (CED), and anthropometry. These keywords were applied primarily to titles and abstracts, followed by full-text screening of relevant articles to assess eligibility. Reference lists of selected studies were also examined to identify additional relevant publications.
2.2. Inclusion Criteria
Studies were included if they:
-
-
Reported on the nutritional status of adult tribal populations in India.
-
-
Used BMI as a measure of nutritional status, as classified by WHO guidelines (BMI < 18.5 kg/m2).
-
-
Included assessments of CED prevalence.
2.3. Nutritional Status Assessment
Nutritional status was assessed using BMI, calculated as follows:
|
```latex\mathrm{B}\mathrm{M}\mathrm{I}=\frac{\mathrm{W}\mathrm{e}\mathrm{i}\mathrm{g}\mathrm{h}\mathrm{t}\mathrm{ }\left(\mathrm{k}\mathrm{g}\right)}{\mathrm{H}\mathrm{e}\mathrm{i}\mathrm{g}\mathrm{h}\mathrm{t}\mathrm{ }{\left(\mathrm{m}\right)}^{2}}``` |
The WHO (1995) [10] classification system for adult BMI was employed to assess the prevalence of undernutrition. This classification defines underweight as BMI < 18.5 kg/m2, which indicates the presence of CED, and is globally recognized for identifying populations with public health issues related to malnutrition. BMI data were categorized according to the cut-off values provided by the WHO for the world population. These cut-offs are widely used in anthropometric studies of undernutrition and have been adopted to maintain consistency across the studies reviewed.
2.4. Study Selection and Data Extraction
A total of 44 studies met the inclusion criteria and were included in the review. The initial search yielded 75 records, of which 68 studies remained after removal of duplicates. Following title and abstract screening, 50 studies were selected for full-text review, and 44 studies were ultimately included based on the predefined inclusion criteria. Each study was carefully screened for relevance to the research question. The screening process involved a two-step review:
-
Title and abstract screening to exclude irrelevant or duplicate studies.
-
Full-text review to ensure that the study met the inclusion criteria and reported on tribal populations in India.
Data from the selected studies were extracted and synthesized to identify patterns in CED prevalence over time, geographic distribution, and demographic correlates such as age, sex, and socio-economic status.
3. Results and Discussion
3.1. Nutritional Status and Disease Burden Among Tribes of Northern and Northeastern India
Northern and Northeastern India, regions known for their cultural diversity, house over 200 ethnic groups, including the Tharu and Bhotia of Uttarakhand, Mina and Saharia of Rajasthan, and Apatani of Arunachal Pradesh. Studies on these communities (Table 3 and Table 4) have revealed alarming levels of Chronic Energy Deficiency (CED). The Gujjar and Bakerwal women of Kashmir exhibited the highest CED prevalence (90.7%). Khan and Khan [51] attribute this critical condition to the socio-cultural marginalization and extreme physical demands of a nomadic lifestyle. These women also endure early marriages, domestic violence, and entrenched superstitions, all of which exacerbate their nutritional deprivation [51]. Similarly, Saharia women from the Kisanganj block of Baran District, Rajasthan, face severe nutritional stress, with 68% suffering from undernutrition. Contributing factors include inadequate intake of micro- and macronutrients, compounded by poverty, lack of education, and geographic isolation [16,42,43].
In contrast, the Apatani of Subansari district, Arunachal Pradesh, were found to be in a relatively favourable nutritional condition. Their traditional diet, rich in essential nutrients, including rice, roots, seeds, green leafy vegetables, and mushrooms, appears to safeguard their health [15]. Data from the National Family Health Survey (NFHS, 2019–2021) corroborate these findings, with low CED prevalence among tribal populations in Northeastern states, except for Rajasthan (Table 2) [9].
Vungneilchoi & Sachdeva [52] studied the Kuki and Paiti tribes of Churachandpur district of Manipur, where both groups exhibited a high prevalence of anaemia, with women being more severely affected than men. Underweight individuals in both tribes were found to have a higher likelihood of anaemia. Among women, anaemia prevalence was higher in younger age groups and declined with increasing age, while the opposite trend was observed among men. In addition, women in both communities were characterized by higher parity and lower literacy levels, factors that may contribute to the observed patterns of anaemia through their influence on nutritional status and health-seeking behaviour. Studies from Assam have also reported the presence of haemoglobinopathies such as sickle cell anaemia and β-thalassemia among tribal tea garden populations, indicating an additional genetic contribution to the burden of anaemia in these communities. The Meitei tribe of Manipur also exhibited a high allele frequency of Sickle cell disease (SCD) [43].
3.2. Nutritional Trends and Disease Burden Among Tribes of Eastern India
Eastern India, home to a large concentration of tribal populations, also shows a concerning pattern of CED. Odisha has the highest number of tribal communities in India, with 62 distinct groups, while tribal people constitute 5.80% of the population in West Bengal. NFHS (2019–2021) [9] data reveal a high prevalence of CED, particularly among tribal women in this region. Studies on tribes such as the Bhumij, Lodha, and Kheria of Odisha and West Bengal found particularly high rates of undernutrition, with Bhumij women exhibiting more severe CED [17,21]. Bhuyan et al. (2021) reported 68.7% of Lodha women in Odisha’s Mayurbhanj District had CED, with a mean BMI of 17.6 kg/m2 [26].
Kanrar et al. (2023) identified several underlying factors, including food insecurity, displacement from traditional habitats, acculturation associated with a shift from nutrient-rich indigenous diets to market-based foods, and seasonal migration for wage labour, all of which have significantly altered the lifestyle and subsistence patterns of tribal communities [53]. These changes have rendered them more vulnerable to malnutrition, as their diets and health are intimately tied to the local ecosystem. In West Bengal’s Purulia district, where agricultural productivity is low and poverty is rampant, Santals showed a very high prevalence of CED, with 30.6% of males and 63.4% of females affected indicating a critical nutritional situation according to the WHO classification [18]. Similarly, the Particularly Vulnerable Tribal Groups (PVTGs) like the Birhors of Purulia and the Hos of West Midnapore exhibit high rates of CED, with females bearing the brunt of this crisis [25,29].
SCD is found to be a heavy burden among the tribal population of the nation. Balgir (2005) highlighted the Bhuyan and Kharia tribe of Orissa to be burdened with a high prevalence of SCD [54]. Another study also reported a critical situation in the Gajapati district of Orissa, where 16.55% of the tribal children were found to be suffering from SCD [55].
3.3. Nutritional Challenges and Disease Burden Among Tribes of Central and Western India
Central India is home to some of the country’s largest tribal groups, including the Bhils, Baigas, Gonds, and Mundas. These groups primarily engage in agriculture, often practicing shifting cultivation. However, studies reveal that many of these communities are facing critical levels of nutritional stress. For instance, the Kharwar people of Uttar Pradesh showed high CED prevalence, with elderly individuals particularly affected [32]. In Bilaspur, Chhattisgarh, the Gond tribe also exhibited high levels of CED, with women again being disproportionately affected [33]. The primary contributors to this widespread malnutrition include food insecurity, low socio-economic status, and erratic income sources.
Further studies on Mawasi women in Madhya Pradesh and tribal women in Sabarkantha, Gujarat, pointed to deep-seated gender inequalities and social discrimination as additional factors exacerbating undernutrition [35,36]. The authors noted that women who grew their own food were less likely to suffer from CED, emphasizing the protective role of food sovereignty in maintaining nutritional health. A study by Kshatriya & Acharya (2016) revealed that undernutrition is highly prevalent among the tribal women (Dhodia, Kukna, and Chaudhari) of Gujarat because of the shifting of workplaces and unavailability of proper wages, which may be leading to insecurity of food and chronic poverty [56]. Therefore, higher proportions are suffering from undernutrition. Morbidity increases with the co-existence of undernutrition and hypertension among tribals. Bhumia tribal population of Madhya Pradesh showed a very high prevalence of undernutrition among both adult males and females, exploring some responsible factors such as poverty, lack of health awareness, poor literacy level, and poor health care and transport facilities [57]. Kapoor et al. (2012) explored the prevalence of undernutrition of Saharia (Madhya Pradesh) and Tadvi (Gujarat) tribal male population [13]. Their study found that a higher number of Saharia tribes of Madhya Pradhesh and Tadvi tribes of Gujarat are undernourished. They also revealed that the increase in morbidity is due to the co-existence of undernutrition and hypertension among this tribal group. 27% of the female Bhaina tribal population of Chhattisgarh are suffering from undernutrition [58]. Females of this tribal group have a low literacy level; hence, they are not aware of the medical facilities. As a result, both they and their children are getting malnourished.
Tribals of Chhattisgarh and Madhya Pradesh showed a higher proportion of tuberculosis, cancer, and leprosy than the non-tribal populations. However, rheumatic heart disease and epilepsy showed similar prevalence among the non-tribals. All tuberculosis and Plasmodium falciparum malaria were found to be more frequent among tribals. Overall, the health status of the tribals (vulnerable section) of Madhya Pradesh is unsatisfactory [59]. A study by the National Institute for Research in Tribal Health (NIRTH), Jabalpur, showed the burden of tuberculosis is higher among the Saharia tribes of Madhya Pradesh (1518/10,000).
In the southern part of Rajasthan, there is a paucity of data regarding the diseases among the tribals. Mohanty et al. (2022) found that the prevalence of sickle cell disease is higher among the Garasia tribe (13.81%) of Rajasthan [60]. Further studies need to be carried out among these tribal groups to understand the patterns of diseases in central as well as western India.
3.4. Nutritional Status and Disease Burden Among Tribes of Southern India
Tribal populations in Southern India are concentrated in the states of Andhra Pradesh, Karnataka, Kerala, and Tamil Nadu. In Andhra Pradesh, tribes constitute 6.3% of the population, the highest among southern states. Rao et al. (2015) conducted an extensive study on the Chenchu people, revealing critical levels of undernutrition among both men and women, exacerbated by poor dietary intake and excessive alcohol consumption [46]. Another study on tribal women in the Vishakhapatnam district found that 18.2% were undernourished, with older women being particularly vulnerable.
Tribes in Karnataka present a similarly dire scenario. Among the Jenu Kuruba community, a shepherd group in Kodagu district, all males and 96.5% of females were found to have CED [47]. A similar trend was observed in the Koraga community in Udupi district [48]. In Kerala, high levels of CED were found among women from five tribal groups in Wayanad, with a significant association between undernutrition and the use of smokeless tobacco [38]. Tribal adults in South India, residing across Andhra Pradesh, Telangana, Karnataka, Kerala, and Tamil Nadu, experience a disease burden shaped by geographic isolation, forest-based livelihoods, and persistent socio-economic marginalisation. While region-specific adult data remain limited, national-level analyses and selected regional studies provide insight into the dominant disease patterns affecting tribal adults in the southern states.
Tuberculosis represents one of the most significant health challenges among tribal adults. A national systematic review reported that tuberculosis prevalence among tribal populations ranges approximately from 432 to 703 per 100,000 population, compared with about 211 to 256 per 100,000 in the general population, indicating a substantially higher burden among tribal groups, with delayed diagnosis and treatment interruption commonly reported [61]. Although adult-specific prevalence estimates for South Indian tribal groups are not routinely reported, these findings strongly suggest that tribal adults in the southern states experience a similarly elevated tuberculosis burden. Inherited haemoglobin disorders, particularly sickle cell disease, contribute to morbidity among tribal adults in South India. A large post-2010 review documented wide variation in sickle cell trait prevalence across tribal populations in India, with southern tribal regions—including Wayanad district in Kerala—reporting HbS carrier frequencies exceeding 18% in some screened adult populations [62]. Although clinically manifest sickle cell disease is less common than the carrier state, affected tribal adults experience chronic anaemia, pain crises, and increased susceptibility to infections. Leprosy continues to affect tribal populations in India in the post-elimination era disproportionately. Recent reviews indicate that tribal communities contribute a disproportionate share of new leprosy cases nationally, with delayed presentation and higher multibacillary disease burden among adults, reflecting barriers to early diagnosis and care [63]. While South-India-specific adult prevalence figures remain unavailable, these patterns are likely to extend to tribal adults in the southern states. Vector-borne diseases such as malaria persist in tribal-dominated forested regions of southern India. National analyses indicate that malaria remains a persistent public health concern in tribal areas of India, particularly in forested regions, where ecological and occupational factors increase exposure risk among adults engaged in forest and agriculture-based livelihoods [64]. Taken together, the available evidence suggests that tribal adults in South India face a sustained burden of infectious diseases and inherited disorders, with tuberculosis, sickle cell disease, leprosy, and malaria representing key contributors. The limited availability of adult-specific regional data underscores the urgent need for systematic surveillance and focused research among tribal adults in southern India.
3.5. Nutritional Status and Disease Burden Among Tribes of Andaman and Nicobar Islands
The Andaman and Nicobar Islands are home to several indigenous groups, including the Jarwas, Onges, Sentineles, Shompens, and Great Andamanese. The Sentineles remain isolated, resisting external contact, and thus, no nutritional studies are available on this group. However, Vijayachari et al. (2024) conducted a rare study on the Shompen people, revealing a relatively low prevalence of CED but alarmingly high rates of anemia, affecting 54% of men and 43.8% of women [40]. Available, population-level and field surveillance data indicate a consistently higher burden of infectious disease among adult tribal populations in the Andaman & Nicobar Islands compared with national averages. Self-reported tuberculosis (household-survey based) in the islands declined between NFHS-IV and NFHS-V, but remains elevated in tribal groups: the NFHS-based point prevalence of self-reported TB for the islands was 615 per 100,000 (95% CI 418–873) in NFHS-IV and 221 per 100,000 (95% CI 122–367) in NFHS-V, and separate analysis shows that tribal people in the islands have an estimated TB prevalence of about 703 per 100,000 compared with a national average near 312 per 100,000 [65].
Arboviral infections have emerged as important causes of adult febrile illness. Hospital and outbreak surveillance document the introduction and establishment of chikungunya (outbreak in 2006 with laboratory confirmation in 15 of 17 suspect cases) and the later emergence of dengue: in 2010, 516 suspected febrile cases were reported in the islands of which 80 (15.5%) were seropositive for dengue antibodies, and more recent hospital-based surveillance from South Andaman (2018–2021) screened 10,313 suspected febrile patients and identified 679 confirmed dengue infections (6.6%), of which ~10% were dengue haemorrhagic fever. These data indicate an increasing but still episodic arboviral burden among adults. [66,67,68]. Smaller community surveys among island tribal groups document substantial burdens of other infectious morbidities in adults. The comprehensive Shompen tribe survey (Great Nicobar) found anaemia in ~48.3% of adults (54.0% of females; 43.8% of males), hypertension in 13.2% with a further 28.9% pre-hypertensive, widespread fungal skin infection and intestinal parasitic infestation, and low but detectable chikungunya seroprevalence (≈10.5% IgG positivity in the tested sample)—while no active pulmonary TB or dengue was detected in that small screening cohort [40].
Overall, the best available evidence for tribal adults in the Andaman & Nicobar Islands supports three clear points: (1) tuberculosis prevalence among tribal adults is substantially higher than national averages, (2) arboviral infections (chikungunya, dengue) have emerged and contribute measurable adult morbidity during outbreak and inter-epidemic periods, and (3) other infectious morbidities (anaemia, dermatologic and parasitic infections) remain common in tribal adult populations, although community surveys are small and geographically limited—all of which underline the urgent need for larger, population-based adult surveillance in the islands.
4. Conclusions
This review highlights the critical need for large-scale, region-specific studies to better understand the disproportionate prevalence of malnutrition among India’s indigenous tribal communities. The evidence from various tribal populations suggests that malnutrition is influenced by a complex interplay of factors, including occupational patterns, dietary habits, belief systems, cultural taboos, and socio-economic conditions. These communities, often geographically isolated and marginalized, require more focused attention in both research and policy development to address the specific challenges they face.
There are existing schemes of the Indian government under the umbrella of National Rural Health Mission, the reproductive and child health programs like Janani Suraksha Yojana (JSK), Janani Shishu Suraksha Kryakram (JSSK), Rashtriya Bal Sukraksha Karyakram (RBSK), etc., which encourage institutional delivery, exclusive breastfeeding, and provide antenatal, intra-natal, and post-natal care facilities, and nutritional supplementation and monetary assistance to the mother and child living below the poverty line.
Addressing malnutrition within tribal populations demands a multi-pronged approach that includes not only government intervention but also active community involvement. Government health policies must adopt a bottom-up approach, ensuring that programs are developed in consultation with local communities to make them more inclusive and culturally sensitive. Extensive awareness campaigns in remote areas are essential to inform tribal populations of their rights and access to healthcare services. Additionally, efforts must be made to promote existing government schemes that can directly benefit these vulnerable groups.
Improving healthcare delivery for tribal populations requires a concerted effort to make services more approachable, accessible, acceptable, and appropriate, tailored specifically to the unique needs of these communities. Equally important is the need for continuous monitoring and evaluation of health programs to ensure their effectiveness. This will be crucial for achieving the Sustainable Development Goals (SDGs) by 2030, with a particular focus on fulfilling the SDG principle of “Leaving no one behind”. By prioritizing tribal health and well-being, India can take a significant step toward reducing health disparities and promoting equity among its most vulnerable populations.
Acknowledgments
We extend our gratitude to all the researchers and institutions cited in this paper for their invaluable contributions to understanding the health and nutritional challenges faced by marginalized tribal communities in India. Their work has been instrumental in shaping the discourse on tribal health and nutrition.
Author Contributions
K.B. conceptualized and designed the study. S.B. conducted the literature review and drafted the manuscript. P.K.R., S.M., M.C. and K.B. critically revised and edited the manuscript. All authors contributed to the finalization of the manuscript and approved the final version.
Ethics Statement
Not applicable as the present study includes existing publications only. No direct data collection was performed.
Informed Consent Statement
Not applicable as the present study includes existing publications only. No direct data collection was performed.
Data Availability Statement
The present study reviews existing literature. No new data has been generated.
Funding
This research no external funding from any funding agencies.
Declaration of Competing Interest
The authors declare that they have no known competing financial interests or personal relationships that could have appeared to influence the work reported in this paper”.
References
-
Singh KS. People of India: India’s Communities; National Volume, Volume 5, Part 2, H-M; Seagull Books: Kolkata, India, 1998. [Google Scholar]
-
Renke BS. National Commission for Denotified, Nomadic and Semi-Nomadic Tribes Report. Volume I. 2008. Available online: https://dwbdnc.dosje.gov.in/public/uploads/news/82701715669482.pdf (accessed on 15 April 2026).
-
Wahi N, Bhatia A. The Legal Regime and Political Economy of Land Rights of Scheduled Tribes in the Scheduled Areas of India; Centre for Policy Research: New Delhi, India, 2018. [Google Scholar]
-
Hasnain N. Tribal India, 6th ed.; Palaka Prakashan: Cuttack, India, 1991. [Google Scholar]
-
Philip CE, Sweta SR. A Study on the Role of Tribals in Preserving the Biodiversity of India. Int. J. Law Manag. Humanit. 2025, 8, 729–774. DOI:10.10000/IJLMH.1110485 [Google Scholar]
-
GOI. Annual Report Ministry of Tribal Affairs; Government of India: New Delhi, India, 2007. [Google Scholar]
-
Government of India. Census of India. 2011. Available online: http://censusindia.gov.in/ (accessed on 17 August 2024).
-
Kumar MM, Pathak VK, Ruikar M. Tribal population in India: A public health challenge and road to future. J. Fam. Med. Prim. Care 2020, 9, 508–512. DOI:10.4103/jfmpc.jfmpc_992_19 [Google Scholar]
-
International Institute for Population Sciences (IIPS), ICF. National Family Health Survey (NFHS-5), 2019–2021. 2021. Available online: https://dhsprogram.com/pubs/pdf/FR375/FR375.pdf (accessed on 17 August 2024).
-
WHO. Physical Status: The Use and Interpretation of Anthropometry; Technical Report Series no. 854; World Health Organization: Geneva, Switzerland, 1995. [Google Scholar]
-
Pray R, Riskin S. The History and Faults of the Body Mass Index and Where to Look Next: A Literature Review. Cureus 2023, 15, e48230. DOI:10.7759/cureus.48230 [Google Scholar]
-
Kurpad AV, Muthayya S, Vaz M. Consequences of inadequate food energy and negative energy balance in humans. Public Health Nutr. 2005, 8, 1053–1076. DOI:10.1079/PHN2005796 [Google Scholar]
-
Kapoor AK, Saluja K, Verma D, Kapoor S. Predictors of Hypertension among Adult Tribal Males of India. Int. J. Trop. Dis. Health 2012, 2, 241–256. DOI:10.9734/IJTDH/2012/1750 [Google Scholar]
-
Mukherjee K, Harihar H, Pulamaghatta VN, Alam A, Rawat B. Body Mass Index and Chronic Energy Deficiency among Adults of Tharu Population, Uttarakhand, India. Int. J. Biomed. Res. 2015, 6, 475. DOI:10.7439/ijbr.v6i7.2218 [Google Scholar]
-
Bam Y, Malagi U. Nutritional status based on body mass index of adult Apatanis: A tribal population of lower Subansiri district Arunahcal Pradesh, India. Int. J. Res. Appl. Nat. Soc. Sci. 2016, 4, 31–36. Available online: https://oaji.net/articles/2016/491-1479903539.pdf (accessed on 12 October 2024).
-
Monika M, Chishty S, Singh NV. Nutritional status of tribal women (Saharia and Meena), Baran district of Rajasthan, India. Nutr. Food Sci. 2018, 48, 922–939. DOI:10.1108/NFS-01-2018-0018 [Google Scholar]
-
Goswami M, Dash B, Dash NC. Nutritional status of the Bhumijia of Baleswar, Orissa. Indian Anthropol. 2010, 40, 55–70. Available online: https://www.jstor.org/stable/41920110 (accessed on 12 October 2024).
-
Das S, Bose K. Body Mass Index and Chronic Energy Deficiency among Adult Santals of Purulia District, West Bengal, India. J. Hum. Sci. 2011, 7, 488–503. Available online: https://www.j-humansciences.com/index.php/IJHS/article/view/1123 (accessed on 12 October 2024).
-
Bose K, Debsharma B, Das S. Is body adiposity index a good measure of nutritional status study among two adult tribal populations of Paschim Medinipur, West Bengal, India. Sci. J. Sociol. Anthropol. 2011, 7, 488–503. Available online: http://www.sjpub.org/sjsa/abstract/bose-abstract.html (accessed on 19 August 2024).
-
Chakraborty D, Bose K, Koziel S. Use of mid-upper arm circumference in determining undernutrition and illness in rural adult Oraon men of Gumla District, Jharkhand, India. Rural Remote Health 2011, 11, 118–129. DOI:10.22605/RRH1754 [Google Scholar]
-
Bisai S, Bose K. Critical nutritional stress among adult tribal populations of West Bengal and Orissa, India. Nat. Preced. 2012, 9, 1–14. DOI:10.1038/npre.2012.7068.2 [Google Scholar]
-
Roy S, Chowdhury T. Differences in Selected Health Traits between Occupational Groups among Oraons of Jalpaiguri District, West Bengal. J. Anthropol. 2013, 2013, 582036. DOI:10.1155/2013/582036 [Google Scholar]
-
Goswami M. Body Mass Index and Chronic Energy Deficiency among Adult Male Lodhas and Kharias of Mayurbhanj, Odisha. Comparison with other tribal populations of Eastern India. Antrocom Online J. Anthropol. 2014, 10, 359–364. Available online: https://www.antrocom.net/wp/wp-content/uploads/2024/05/goswami-body-mass-index-lodhas-kharias-odisha.pdf (accessed on 29 May 2026).
-
Ghosh M, Bose K. Assessment of undernutrition among male Bhumijs of West Bengal, India: A comparison of body mass index and mid-upper arm circumference. Hum. Biol. Rev. 2015, 4, 140–149. Available online: http://beta.humanbiologyjournal.com/wp-content/uploads/2015/08/Volume4-Number2-Article3.pdf (accessed on 20 September 2024).
-
Das K, Mukherjee K, Chanak M, Pal S, Ganguli S, Bagchi SS, et al. Age Trends in Under-nutrition among Sabar Males of Purulia, West Bengal, India. J. Hum. Ecol. 2020, 70, 110–117. Available online: https://www.academia.edu/download/63477540/Published_JHE-70-1-3-110-20-3232-Das-K20200530-118688-90k59d.pdf (accessed on 12 October 2024).
-
Bhuyan J, Behera S, Mohanty DK. Assessment of nutritional status based on BMI of Lodha tribal women in Mayurbhanj district of Odisha. J. Res. ANGRAU 2021, 49, 45–57. Available online: https://angrau.ac.in/downloads/Publications/JORANGRAU_JULY_SEPT_2021.pdf#page=49 (accessed on 12 October 2024).
-
Bhandari S, Chanak M, Bose K. Assessment of nutritional status among adult Hos of Paschim Medinipur District, West Bengal, India. Int. J. Sci. Res. Updates 2021, 2, 22–28. DOI:10.53430/ijsru.2021.2.1.0034. [Google Scholar]
-
Mahapatra B, Dey J, Ray S. Sexual dimorphism of Socio-economic status, Nutritional status and hypertension among the Oraon tribe of Paschim Medinipur, West Bengal, India. Antrocom J. Anthropol. 2021, 17, 125–141. Available online: https://www.researchgate.net/profile/Biswajit-Mahapatra-3/publication/366463012_Sexual_dimorphism_of_Socio-economic_status_Nutritional_status_and_hypertension_among_the_Oraon_tribe_of_Paschim_Medinipur_West_Bengal_India/links/63a27e0141663a23c0717ad6/Sexual-dimorphism-of-Socio-economic-status-Nutritional-status-and-hypertension-among-the-Oraon-tribe-of-Paschim-Medinipur-West-Bengal-India.pdf (accessed on 16 September 2025).
-
Dhibor T, Mostafa G, Saha J. Nutritional status of aged tribal people: A study of Birhor community in Purulia District, West Bengal. Int. J. Food Nutr. Status 2022, 11, 618–621. Available online: https://www.ijfans.org/uploads/paper/475340e3ee2afa591bae9c8005c9f549.pdf (accessed on 15 April 2026).
-
Dash SS. Nutritional status assessment among adult Santals of East Singhbhum district in Jharkhand state, India. Indian J. Pure Appl. Biosci. 2023, 11, 53–61. DOI: 10.18782/2582-2845.8994 [Google Scholar]
-
Mridha S, Halder UC, Ray BC, Karmokar B. Nutritional status according to body mass index among the adult Munda population of Sundarban, West Bengal, India. Int. J. Health Sci. 2023, 7, 2350–2361. Available online: https://sciencescholar.us/journal/index.php/ijhs/article/view/14496 (accessed on 29 October 2025).
-
Jaiswal A. A Study on Body Mass Index and Prevalence of Chronic Energy Deficiency among Adult Kharwar Tribes of India. Glob. J. Anthropol. Res. 2015, 2, 50–55. DOI:10.15379/2410-2806.2015.02.01.05 [Google Scholar]
-
Das S, Bharathi K, Singh HS. Nutritional and Socio-demographic profile among Gond tribe of Binouri village, Bilaspur Chhattisgarh (India). Indian J. Res. Anthropol. 2016, 2, 115–120. DOI:10.21088/ ijra.2454.9118.2216.6 [Google Scholar]
-
Singh N. Nutritional Status of Tribal Women of Reproductive Age Group in Naugarh Block, Chandauli District. Int. J. Curr. Microbiol. Appl. Sci. 2019, 8, 953–966. DOI:10.20546/ijcmas.2019.807.115 [Google Scholar]
-
Negi S, Jagre A, Negi R. A Study on the Health and Nutritional Status of Mawasi Tribal Women in Villages of Chitrakoot Region in Madhya Pradesh, India. Adv. Res. 2024, 25, 81–92. DOI:10.9734/air/2024/v25i21035 [Google Scholar]
-
Dave PH, Mistry JJ, Chaudhary MK. Nutritional Status and Food Consumption Pattern of Tribal Farm Women of Sabarkantha. Int. J. Curr. Microbiol. Appl. Sci. 2019, 8, 2239–2245. DOI:10.20546/ijcmas.2019.803.267 [Google Scholar]
-
Nayak MSDP, Sreegiri S. A study on nutritional status of tribal women in Visakhapatnam district, Andhra Pradesh, India. Int. J. Community Med. Public Health 2016, 3, 2049–2053. DOI:10.18203/2394-6040.ijcmph20162544 [Google Scholar]
-
Mohandas S, Amritesh K, Lais H, Vasudevan S, Ajithakumari S. Nutritional assessment of tribal women in Kainatty, Wayanad: A cross-sectional study. Indian J. Community Med. 2019, 44, 50–53. DOI:10.4103/ijcm.IJCM_39_19 [Google Scholar]
-
Jaiswal A. Nutritional assessment: Comparison of the two useful anthropometric measures of chronic energy deficiency in adult male Jene Kuruba tribe, Karnataka. İmgelem 2023, 7, 269–280. DOI:10.53791/imgelem.1300995 [Google Scholar]
-
Vijayachari P, Awaradi S, Siddaraju HM, Nithin K, Veerendra SS, Babu US, et al. Survey of the present health & nutritional status of Shompen tribe of Great Nicobar Island. Indian J. Med. Res. 2024, 159, 35–42. DOI:10.4103/ijmr.ijmr_3193_21 [Google Scholar]
-
Chyne DAL, Meshram II, Rajendran A, Kodali V, Getti N, Roy P, et al. Nutritional status, food insecurity, and biodiversity among the Khasi in Meghalaya, North-East India. Matern. Child Nutr. 2017, 13, 47–65. DOI:10.1111/mcn.12557 [Google Scholar]
-
Hamid T, Vaida N. A Study on Nutritional Status of Scheduled Tribe (Gujjar and Bakerwal) Women of Kashmir. Int. J. Home Sci. 2017, 3, 203–205. Available online: https://www.academia.edu/download/93238209/3-3-71-778.pdf (accessed on 8 October 2024).
-
Loukrakpam B, Rajendran A, Madhari RS, Boiroju NK, Longvah T. Dietary adequacy and nutritional status of Meitei community of Manipur, Northeast India. Matern. Child Nutr. 2020, 16, 6–12. DOI:10.1111/mcn.13046 [Google Scholar]
-
Ghosh S. Deficiency and sources of nutrition among an Indian tribal population. Coll. Antropol. 2014, 38, 847–853. Available online: https://hrcak.srce.hr/128182 (accessed on 19 June 2025).
-
Chowdhury B, Sharma S. Assessment of nutritional status of adult tribals in the Western Plateau fringe of West Bengal—An anthropometric analysis. Int. J. Food Nutr. Sci. 2022, 11, 3132–3141. Available online: https://orionjournals.com/ijsru/sites/default/files/IJSRU-2021-0034.pdf (accessed on 9 October 2024)
-
Rao KM, Kumar RH, Krishna KS, Bhaskar V, Laxmaiah A. Diet & nutrition profile of Chenchu population—A vulnerable tribe in Telangana & Andhra Pradesh, India. Indian J. Med. Res. 2015, 141, 688–696. DOI:10.4103/0971-5916.159588 [Google Scholar]
-
Pujar A, Hoogar P, Basavanagouda TT. An Assessment of Nutritional Status among Jenu kuruba Tribe of Kodagu District. J. Community Med. Health Educ. 2016, 6, 468. DOI:10.4172/2161-0711.1000468 [Google Scholar]
-
Pujar A, Hoogar P, Basavanagouda TT. An anthropometric profile among the Koraga tribe of Udupi district, Karnataka state. Int. J. Adv. Res. 2017, 5, 685–689. DOI:10.21474/IJAR01/3202 [Google Scholar]
-
Anderson I, Robson B, Connolly M, Al-Yaman F, Bjertness E, King A, et al. Indigenous and tribal peoples’ health (The Lancet–Lowitja Institute Global Collaboration): A population study. Lancet 2016, 388, 131–157. DOI:10.1016/S0140-6736(16)00345-7 [Google Scholar]
-
The Expert Committee on Tribal Health. Tribal Health Report, India—First Comprehensive Report on Tribal Health in India. 2023. Available online: https://tribalhealthreport.in (accessed on 13 September 2024).
-
Khan S, Khan D. Health Status of Tribal Women in Jammu and Kashmir. Int. J. Res. Cult. Soc. 2020, 4, 30–35. Available online: https://www.researchgate.net/profile/Dr-Sanya-Khan/publication/347841741_INTERNATIONAL_JOURNAL_OF_RESEARCH_CULTURE_SOCIETY_Health_Status_of_Tribal_Women_in/links/5fe4b559299bf140883f2f2d/INTERNATIONAL-JOURNAL-OF-RESEARCH-CULTURE-SOCIETY-Health-Status-of-Tribal-Women-in.pdf (accessed on 13 September 2024).
-
Vungneihchoi J, Sachdeva M. High burden of anemia and malnutrition in two tribal populations of Northeast India. medRxiv 2023, 1–24. DOI:10.1101/2023.01.27.23285091 [Google Scholar]
-
Kanrar P, Goswami M, Roy S. Health issues of the indigenous communities with special reference to the Particularly Vulnerable Tribal Groups (PVTGs) of Odisha: A review. Pap. Anthropol. 2023, 32, 45–80. DOI:10.12697/poa.2023.32.1.05 [Google Scholar]
-
Balgir RS. The spectrum of haemoglobin variants in two scheduled tribes of Sundargarh district in north-western Orissa, India. Ann. Hum. Biol. 2005, 32, 560–573. DOI:10.1080/03014460500228741 [Google Scholar]
-
Sahu T, Sahani NC, Das S, Sahu SK. Sickle Cell Anaemia in Tribal Children of Gajapati District in South Orissa. Indian J. Community Med. 2003, 28, 180–183. Available online: https://journals.lww.com/ijcm/abstract/2003/28040/SICKLE_CELL_ANAEMIA_IN_TRIBAL_CHILDREN_OF_GAJAPATI.7.aspx (accessed on 9 October 2024).
-
Kshatriya GK, Acharya SK. Gender Disparities in the Prevalence of Undernutrition and the Higher Risk among the Young Women of Indian Tribes. PLoS ONE 2016, 11, e0158308. DOI:10.1371/journal.pone.0158308. [Google Scholar]
-
Jaiswal A. Health and Nutritional Status of a Primitive Tribe of Madhya Pradesh: Bhumia. Glob. J. Hum. Soc. Sci. Hist. Archaeol. Anthropol. 2013, 13, 14–19. [Google Scholar]
-
Singh HS, Ghritlahre M, Das S. Nutritional Status among Females of Bhaina Tribe of Bilaspur, Chhattisgarh, India: An Anthropological Insight. J. Anthropol. 2014, 2014, 897893. DOI:10.1155/2014/897893 [Google Scholar]
-
Jain Y, Kataria R, Patil S, Kadam S, Kataria A, Jain R, et al. Burden & pattern of illnesses among the tribal communities in Cental India: A report from a community health programme. Indian J. Med. Res. 2015, 141, 663–672. DOI:10.4103/0971-5916.159582 [Google Scholar]
-
Mohanty SS, Purohit A, Anand PK, Huda RK. Burden of sickle cell disease in tribal students in Maa-Baadi institutions in southern Rajasthan—A pilot study. Indian J. Med. Res. 2022, 156, 269–274. DOI:10.4103/ijmr.ijmr_3195_21 [Google Scholar]
-
Rao VG, Muniyandi M, Bhat J, Yadav R, Sharma R. Tuberculosis in tribal populations of India: A systematic review. Indian J. Med. Res. 2018, 65, 8–14. DOI:10.1016/j.ijtb.2017.06.001 [Google Scholar]
-
Colah RB, Mukherjee MB, Martin S, Ghosh K. Sickle cell disease in tribal populations in India. Indian J. Med. Res. 2015, 141, 509–515. DOI:10.4103/0971-5916.159492 [Google Scholar]
-
Sharma M, Dwivedi P, Singh P. Current situation of leprosy in tribal areas of India in the post-elimination era. Indian J. Dermatol. Venereol. Leprol. 2022, 88, 450–451. DOI:10.25259/IJDVL_1380_20 [Google Scholar]
-
Sharma RK, Thakor HG, Saha KB, Sonal GS, Dhariwal AC, Singh N. Malaria situation in India with special reference to tribal areas. Indian J. Med. Res. 2015, 141, 537–545. DOI:10.4103/0971-5916.159510. [Google Scholar]
-
Thiruvengadam K, Krishnan R, Muniyandi M. The prevalence of self-reported tuberculosis in the Andaman and Nicobar Islands, India: Evidence from the NFHS-IV and V. Trop. Med. Infect. Dis. 2023, 8, 464. DOI:10.3390/tropicalmed8100464 [Google Scholar]
-
Manimunda SP, Singh SS, Sugunan AP, Singh O, Roy S, Shriram AN, et al. Chikungunya fever, Andaman and Nicobar Islands, India. Emerg. Infect. Dis. 2007, 13, 1259–1260. DOI:10.3201/eid1308.070193 [Google Scholar]
-
Chaaithanya IK, Bhattacharya D, Muruganandam N, Thamizhmani R, Babu BVS, Sundaram SG, et al. Dengue: A newly emerging viral infection in Andaman and Nicobar Islands, India. Epidemiol. Infect. 2012, 140, 1920–1924. DOI:10.1017/S0950268811002500 [Google Scholar]
-
Rajamani M, Samson R, Punnam Chander M, Sunish IP, Vijayachari P. Epidemiological characterization of dengue in South Andaman Islands, India: An update. J. Community Med. Public Health Care 2023, 10, 135–142. DOI:10.24966/CMPH-1978/1000135 [Google Scholar]