Spatiotemporal Evolution of Extreme Rainstorm Events in China and Corresponding Population Exposure

Spatiotemporal Evolution of Extreme Rainstorm Events in China and Corresponding Population Exposure
Received: 24 December 2025 Revised: 26 January 2026 Accepted: 26 March 2026 Published: 31 March 2026

© 2026 The authors. This is an open access article under the Creative Commons Attribution 4.0 International License (https://creativecommons.org/licenses/by/4.0/).
1. Introduction
Climate change, as a major global environmental issue, is a common challenge facing the sustainable development of human society [1]. According to the Sixth Assessment Report of the Intergovernmental Panel on Climate Change (IPCC), the global climate system is undergoing unprecedented changes, characterized by an increase in the frequency, intensity, and scope of extreme weather events [2,3,4]. In recent years, extreme events such as heat waves, droughts, rainstorms, floods, and strong typhoons have occurred frequently worldwide, posing a serious threat to the social economy, ecological environment, and human life safety [5]. For example, deadly summer heat waves in Europe, ongoing forest fires in Australia, and increasingly intense tropical cyclones in Southeast Asia and the Caribbean have all caused significant casualties and economic losses [6]. These events clearly indicate that the evolution patterns and risks of extreme weather are undergoing profound changes in the context of global warming [7]. Therefore, in-depth exploration of the spatio-temporal distribution, evolution trends, and disaster mechanisms of extreme climate events has become an indispensable and urgent topic in the fields of climate science, disaster science, and public policy research, which is of crucial significance for enhancing social resilience and adaptability [8,9].
In many extreme weather events, extreme rainstorm has become one of the most representative disaster types due to its strong suddenness, complex disaster chain and wide impact range [10,11,12,13]. Its harm is not only reflected in direct flooding, but also in a series of secondary disasters such as urban waterlogging, flash floods, landslides, and mudslides, causing chain damage to infrastructure, agricultural production, water resource systems, and ecosystems [14,15]. China is located in the East Asian monsoon region, with complex geographical and climatic conditions, and is a sensitive and significantly affected area of global climate change. Observation records show that extreme precipitation events in China have increased significantly in recent years, such as the “July 21” extremely heavy rainstorm in Beijing in 2012, the basin wide flood in the middle and lower reaches of the Yangtze River in 2016, the super long heavy rainfall in the Meiyu period in the Yangtze River basin in 2020, and the “July 20” extreme rainstorm in Henan in 2021, all of which have caused heavy casualties and hundreds of billions of yuan of direct economic losses. These shocking cases warn us that systematically revealing the spatiotemporal dynamic evolution of extreme rainstorm events in China is not only a key scientific issue to understand the regional climate response mechanism, but also an urgent practical need to scientifically assess disaster risks, optimize the spatial layout of land, formulate effective disaster prevention and mitigation strategies, and ensure sustainable socio-economic development.
The danger of extreme rainstorm events is finally manifested through its role in disaster bearing bodies, of which population is the core [3,16]. The degree of exposure of the population to disasters directly determines the scale of casualties and socio-economic losses that an event may cause. Under the background of the acceleration of the global urbanization process and the superposition of population agglomeration effect, the life safety threats and property loss risks faced by the highly exposed population caused by extreme rainstorms have been dramatically amplified [17]. Therefore, the accurate quantification of population exposure in extreme rainstorm events has become a key bridge connecting the physical characteristics of disasters and social vulnerability. It has irreplaceable decision support value for identifying high-risk areas, optimizing emergency resource allocation, formulating refined population evacuation and resettlement policies, and promoting the construction of climate adaptive cities and resilient societies. Based on the above background, this paper focuses on China, aiming to systematically analyze the spatio-temporal evolution of extreme rainstorm events from 2000 to 2020, and to simulate and evaluate the exposure change of the Chinese population to extreme rainstorm events during the same period (focusing on 2000 and 2020 as representative years). This study distinguishes itself from previous research by offering a holistic assessment that integrates four complementary rainstorm indicators rather than relying on a single metric, by coupling high-resolution gridded hazard data with population datasets to explicitly link physical processes with societal impacts, and by employing robust spatial statistics to identify not only temporal trends but also evolving cluster patterns that reveal shifting risk hotspots often obscured in conventional analyses. These integrated perspectives provide a scientific basis for an in-depth understanding of the evolution trend of China’s rainstorm flood risk under climate change and serve the national comprehensive disaster prevention and mitigation strategy.
The chapter arrangement of this study is as follows: Section 2 introduces the data used in the study (including data processing flow) and research methods. The Section 3 mainly introduces the temporal and spatial evolution characteristics of extreme rainstorm events and the exposure of the population in different periods under extreme rainstorm events. At the same time, this chapter also discusses the experimental results. The final conclusion of this study is arranged in Section 4.
2. Data and Methods
2.1. Data Source
The GPM data used in this article is sourced from the website of the National Aeronautics and Space Administration (NASA) in the United States (https://www.nasa.gov/, accessed on 1 October 2025). The GPM satellite program is a satellite monitoring system mainly used for meteorological forecasting, implemented by NASA and jointly built by Japan, the European Union, and other international organizations. Its purpose is to improve measurement accuracy and sampling frequency, and achieve more accurate and earlier meteorological forecasting. Compared with traditional Tropical Rainfall Measuring Mission (TRMM) satellite data, GPM satellite data has improved its detection capability for weak precipitation (<0.5 mm/h) and solid precipitation, and has greatly enhanced its spatiotemporal resolution, observation accuracy, and precision, truly realizing the function of global precipitation (including rain and snow) products.
The GPM data used in this study include the final operational product IMERG (Integrated Multi-satellite Retrievals for GPM), covering the time series from January 2000 to December 2020 with a spatial resolution of 0.1° × 0.1°, encompassing the entire territory of China and surrounding areas. The total size of the dataset is approximately daily near-real-time precipitation estimates, with an annual data volume of about 2.3 TB. This data product possesses high spatiotemporal resolution and global coverage capabilities, effectively capturing the spatiotemporal evolution characteristics of extreme precipitation events. By statistically extracting daily precipitation values from this dataset, this study further calculated four indicators for extreme rainstorm events: frequency, duration, peak intensity, and cumulative amount, providing reliable data support for subsequent analysis.
2.2. Selection of Extreme Rainstorm Index
The meanings and units of the extreme rainstorm index selected in this study are shown in Table 1. To clarify the quantitative criteria for “extreme rainstorm events”, this study refers to the “Standard for Classification of Precipitation Intensity” (GB/T 28592-2012, https://openstd.samr.gov.cn/bzgk/gb/newGbInfo?hcno=B4A00E4ABCF80F8C6A048C1D0121A97D&refer=outter, accessed on 1 October 2025) issued by the China Meteorological Administration, defining a “rainstorm day” as a day with daily precipitation ≥50 mm. Based on this, an extreme rainstorm event is further defined as a process involving one or more consecutive days of rainstorms or higher intensity precipitation. Specific indicators include: (1) frequency of rainstorms: the total number of rainstorm days occurring within a year; (2) duration of rainstorms: the total number of hours in a single rainstorm process; (3) peak rainstorm: the maximum daily precipitation (unit: mm/d) in a single process; (4) cumulative rainstorm amount: the total precipitation (unit: mm) in a single process. All indicators are extracted based on GPM daily precipitation data, achieved through spatiotemporal matching and process identification algorithms.
Table 1. The extreme rainstorm index selected in this study.
|
Name |
Meaning |
Unit |
|---|---|---|
|
Storm Count |
Number of rainstorms in a year |
times |
|
Storm Duration |
Duration of rainstorm |
h |
|
Storm Peak |
The highest value of rainstorm |
mm/d |
|
Storm Volume |
Cumulative amount of rainstorm |
mm |
2.3. Analysis of Extreme Rainstorm Event Change Trend
This study uses Theil-Sen slope estimation to analyze the change trend of the extreme rainstorm index. This method is a robust trend estimation method, which can avoid the influence of abnormal values in the data. The calculation formula is as follows:
In the formula, Median is the median function; $${x}_{i}$$ and $${x}_{j}$$ are the values of the i-th and j-th year of the time series data; $$\beta$$ is the changing trend of the time series. When $$\beta$$ < 0, it shows a decreasing trend; when $$\beta$$ > 0, it shows an increasing trend; when $$\beta$$ = 0, it remains unchanged.
2.4. Spatial Heterogeneity Analysis of Extreme Rainstorm Events
In this study, the local Moran index is used to analyze the spatial heterogeneity of extreme rainstorm events. Firstly, conducting spatial autocorrelation analysis requires constructing a spatial weight matrix to define different grid spatial relationships. This study selected room adjacency to construct spatial weight files, and the construction rules are as follows:
In the formula, $$n$$ represents the number of spatial units. $${w}_{ij}$$ represents the adjacency relationship between region $$i$$ and $$j$$. If they have a common boundary, it is assigned a value of 1, while in other cases, it is assigned a value of 0.
The local Moran’s index can characterize the degree of correlation between the attribute values of a unit and its neighboring units [18,19]. Based on the z-test, plot the LISA distribution chart using the following formula:
In the formula: $${x}_{i}$$ and $${x}_{j}$$ represent the observed values of unit i and unit j, respectively, and $${w}_{ij}$$ is the spatial adjacency relationship between region i and j; $${S}^{2}$$ represents the variance of the observed values in this study; the extreme rainstorm index is used as the input data; and the LISA cluster diagram of extreme rainstorm events is obtained through spatial local autocorrelation analysis.
2.5. Calculation of Population Exposure Under Extreme Rainstorm Events
This study calculated the exposure of the Chinese population to four extreme rainstorm events in different periods. Exposure is defined as the product of the number of extreme weather events occurring in a region and the population of that region [20]. In this study, we use the product of the extreme rainstorm index and population in corresponding years to simulate population exposure in different periods.
The population data set of this study is from the population data set developed by the Oak Ridge National Laboratory (ORNL) of the US Department of Energy (https://landscan.ornl.gov/, accessed on 1 October 2025), with a resolution of 1 km, which is the highest resolution global population distribution data available at present. This study uses ArcGIS (10.7) software to cut out the population data set of China and resample to the resolution consistent with the extreme rainstorm index for calculation.
2.6. Description of Research Steps
The process of this study mainly includes five core steps: data preprocessing, indicator extraction, trend analysis, spatial clustering analysis, and exposure assessment. Firstly, based on the Global Precipitation Monitoring (GPM) satellite precipitation data (2000–2020, spatial resolution of 0.1° × 0.1°), four extreme rainstorm indicators are extracted for each year: extreme rainstorm frequency, duration, peak intensity, and cumulative amount. By synthesizing these indicators across years, a nationwide dataset of extreme rainstorm events is constructed. Secondly, the Theil-Sen trend analysis method is employed to calculate the trend of each extreme rainstorm indicator pixel by pixel, revealing its evolution pattern in the temporal dimension. Meanwhile, the Local Moran’s I index is used to perform spatial autocorrelation analysis on the extreme rainstorm indicators for 2000 and 2020, identifying the spatial distribution and migration characteristics of high-value and low-value clusters. In terms of population exposure assessment, this paper utilizes the LandScan global population distribution dataset (resolution of 1 km), resamples it to the same 0.1° resolution as the extreme rainstorm indicators, and calculates the exposure value of “extreme rainstorm indicators × population size” through a product model, simulating the exposure level of the Chinese population to extreme rainstorm events in 2000 and 2020 respectively. Finally, a coupled analysis is conducted on the spatiotemporal evolution characteristics of extreme rainstorm events and the spatial distribution of population exposure, exploring the driving effects of population migration and changes in extreme rainstorm events on exposure variations, and providing a scientific basis for regional disaster risk assessment and the formulation of disaster prevention and mitigation policies.
3. Results
3.1. Temporal and Spatial Evolution Characteristics of Extreme Rainstorm Events
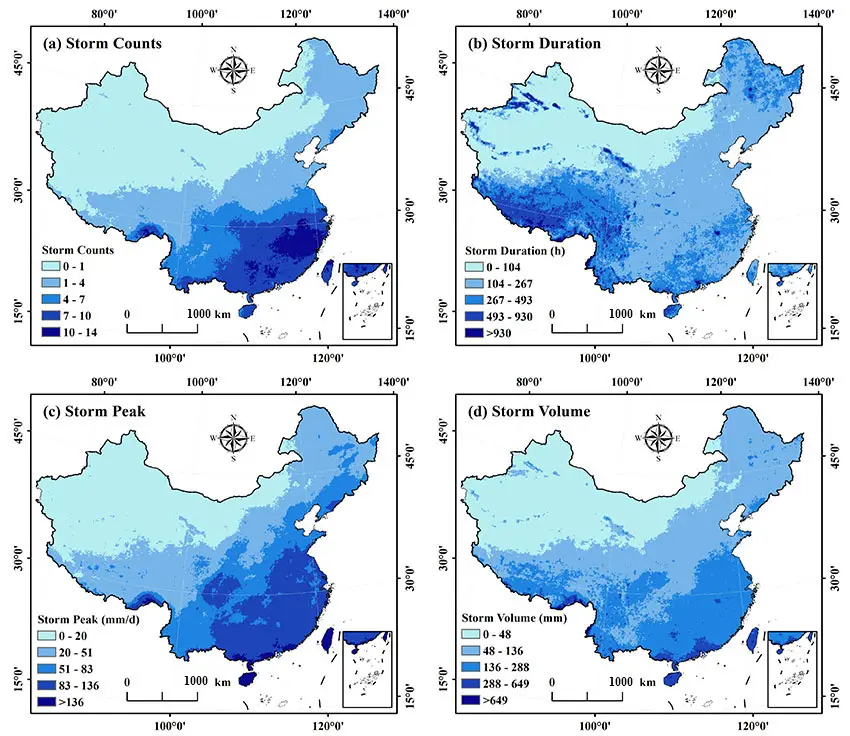
Figure 1 shows the average values of four extreme rainstorm events in China from 2000 to 2020. Figure 1a shows the spatial distribution of extreme rainstorm frequency. We find that the frequency of extreme rainstorms shows a spatial distribution pattern of increasing from northwest to southeast. There have been almost no extreme rainstorm events in the northwest arid region of China, while the frequency of extreme rainstorms in the southeast coastal region can reach 14 times. Looking at Figure 1c,d, we can find that the spatial distribution pattern of extreme rainstorm peak and extreme rainstorm cumulative amount is generally consistent with the spatial distribution pattern of extreme rainstorm frequency. The peak value of extreme rainstorm occurs in Hainan Province, exceeding 136 mm per day, while the maximum cumulative amount of extreme rainstorm is nearly 650 mm.
By observing Figure 1b, we can observe that. Duration of rainstorm. The highest distribution is in. The Northeast region of China. The Southwest region, especially the Qinghai Tibet Plateau region, has the longest duration. The rainstorm lasted the longest, more than 930 h. China’s terrain is stepped, with higher elevations in the west and lower elevations in the east. The Qinghai-Tibet Plateau has an average elevation of over 4000 m, while the southeastern coast is mostly low mountains, hills, and plains. This topographical pattern significantly affects water vapor transport and precipitation processes: the northwest inland, situated deep in the hinterland of Eurasia, is blocked by high mountains, making it difficult for water vapor to reach, resulting in a climate characterized by drought and low rainfall; the southeastern coast, influenced by the East Asian summer monsoon and typhoons, has abundant water vapor and heavy precipitation.
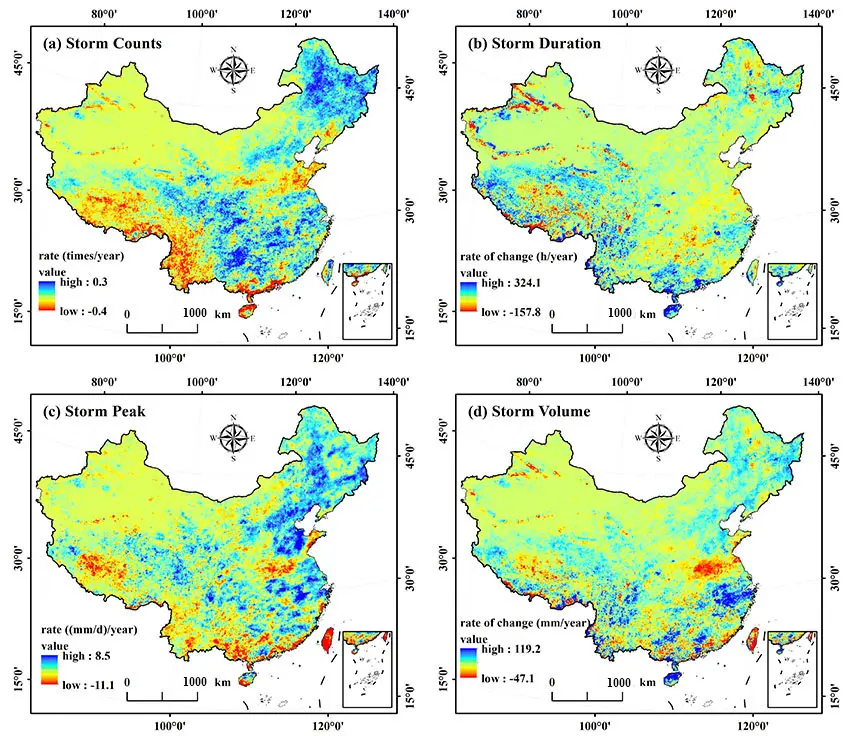
In order to understand the trend of extreme rainstorm events in China in the past 20 years. We have drawn the change trend of four extreme rainstorm events as shown in Figure 2. The frequency of extreme rainstorm increases in northeast China at a rate of up to 0.3 times per year, while it decreases in the south of the Qinghai Tibet Plateau, most of Yunnan Province and the north of Hainan Province at a rate of up to 0.4 times per year. The duration of rainstorm shows an increasing trend in Hainan Province, while within the Tibetan Plateau, the duration of rainstorm shows a strong spatial heterogeneity.
For the peak value of rainstorm, the northeast region, North China Plain and eastern coastal areas of China have shown an increasing trend. However, there has been a decreasing trend in Taiwan Province, with the largest decreasing trend, reaching an absolute value of −11.1. For the change rate of rainstorm cumulative amount. The degree of change in southern China is greater than that in northern China, and there is an increasing trend in the southeastern coastal areas and Hainan Province, with the fastest growth rate reaching about 120 mm per year.
As the water tower of Asia, the southern edge of the Qinghai-Tibet Plateau is influenced by the Indian monsoon, resulting in complex water vapor transport paths. Precipitation processes often accompany topographic uplift, leading to prolonged precipitation. The Northeast region, located at mid-to-high latitudes, is influenced by temperate cyclones and the edge of the summer monsoon. The precipitation system moves slowly, making it prone to sustained precipitation.
To understand the spatial distribution pattern and spatial clustering characteristics of extreme rainstorm events in China. We have mapped the local Moran index for four extreme rainstorm events in China in 2000 and 2020, as shown in Figure 3 and Figure 4.
In 2000, the frequency of extreme rainstorms showed a spatial distribution feature of high concentration in the southeast coastal areas of China, while in northwest China and most northern regions, it showed a spatial distribution feature of low concentration, which is generally consistent with the spatial distribution pattern of the average number of extreme rainstorm in the past 20 years that we have drawn. The frequency of extreme rainstorm does not show obvious spatial clustering characteristics in other regions of China. For the duration of rainstorm. The Xizang Autonomous Region shows a spatial distribution characteristic of being high in itself but surrounded by low values. However, Inner Mongolia Autonomous Region, Gansu, Ningxia, Shaanxi, Shanxi, and Liaoning provinces in northern China exhibit spatial distribution characteristics of low and low clustering. Fujian Province, on the other hand, exhibits a spatial distribution characteristic of being low value but surrounded by higher vocational provinces.
The spatial distribution pattern of rainstorm peak value and rainstorm cumulative amount is roughly similar to the spatial distribution pattern of rainstorm frequency. The only difference is that Hunan Province shows the spatial distribution characteristics of low value, but is surrounded by high value.
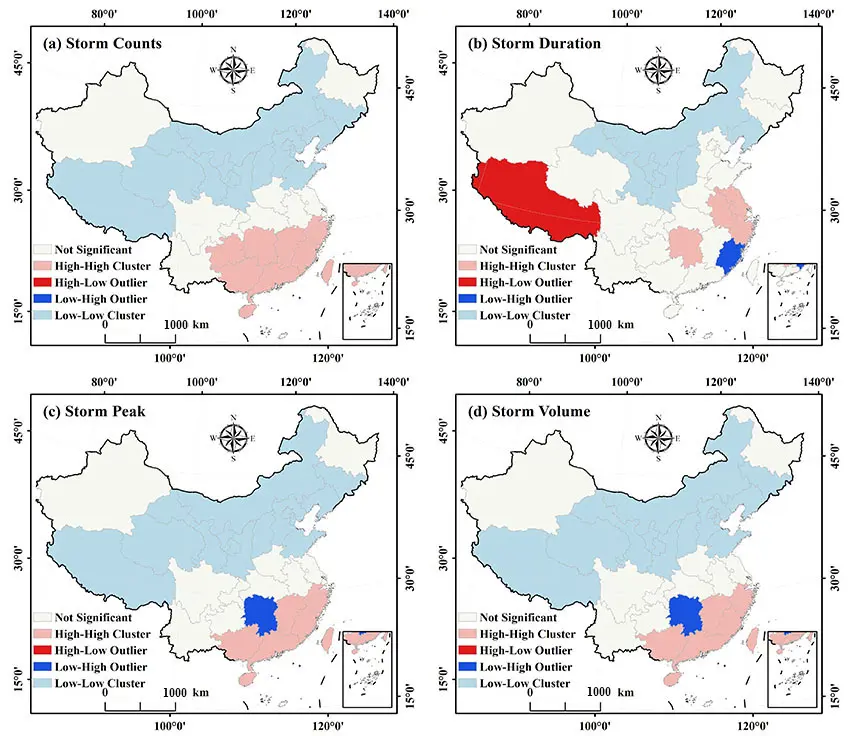
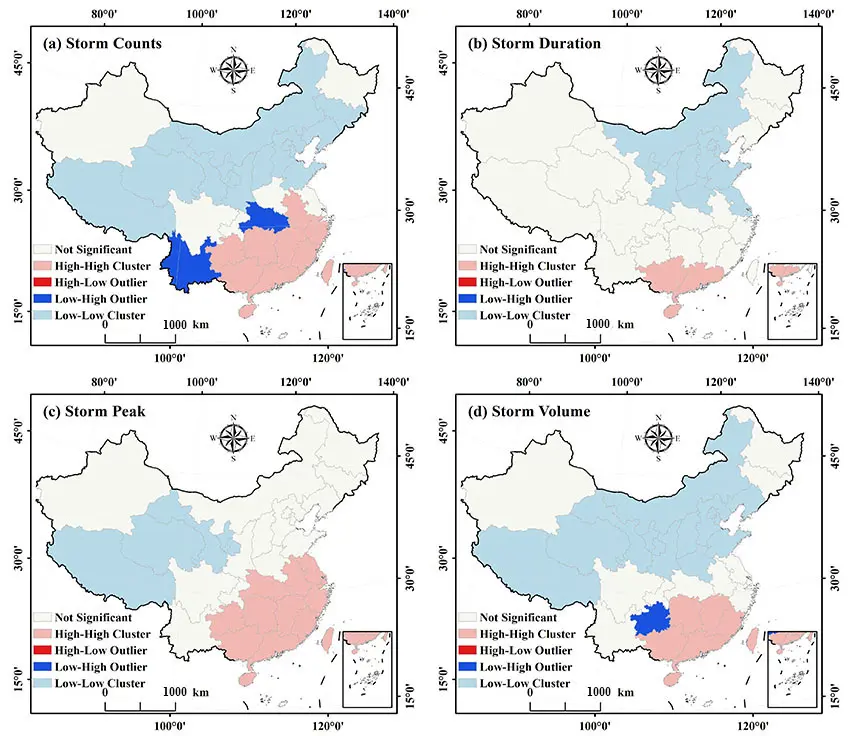
Figure 4 shows the distribution characteristics of the spatial clustering of four extreme rainstorm events in China in 2020. Observing the spatial distribution characteristics of extreme rainstorm frequency clustering, we can find that the spatial distribution pattern of 2020 and 2000 is generally similar, but the difference is that in 2020. Yunnan and Hubei provinces have shown spatial distribution characteristics that are low in value but surrounded by surrounding vocational colleges. In the spatial clustering characteristics of rainstorm duration in 2020, we can see that there are fewer provinces showing high and high clustering, namely Guangxi, Guangdong and Yunnan. The provinces with low and low clustering are still distributed in northern China, and the number of provinces has increased. We can see that the areas with high and high clustering are moving towards southern China.
For the peak value of rainstorm, the number of provinces with high and high concentration becomes more, and they are concentrated in Southeast China, while the number of provinces with low and low concentration becomes less, mainly Xizang Autonomous Region, Qinghai Autonomous Region, Gansu Province, and Ningxia Autonomous Region. In terms of rainstorm accumulation, the provinces with low concentration are the same as those in 2000, which are concentrated in northern China, showing that the provinces with high concentration move to the south, while Guizhou Province shows the spatial distribution characteristics that it is low in itself but surrounded by high value areas.
3.2. Exposure of Populations to Extreme Climate Events at Different Times
In order to explore the exposure of China’s population to extreme rainstorm events in different periods, based on the extreme rainstorm index and the grid data of China’s population distribution, we drew the spatial distribution maps of China’s population exposure to extreme rainstorm events in 2000 and 2020, as shown in Figure 5 and Figure 6.
By observing Figure 5, we found that in 2000, areas with high levels of population exposure were distributed in the southeastern region of China, which is related to the spatial distribution of the Chinese population itself. Further observation shows that in the capital cities of provinces in Southeast China, the population exposure in extreme rainstorm events is higher than that in other regions of provinces. The population exposure to extreme rainstorms is more significant in the southeast coastal area, in an area with a high level of extreme rainstorm frequency, while for the three extreme rainstorm indexes of extreme rainstorm duration, extreme rainstorm peak, and extreme rainstorm accumulation, the population exposure is more significant in the Central Plains.
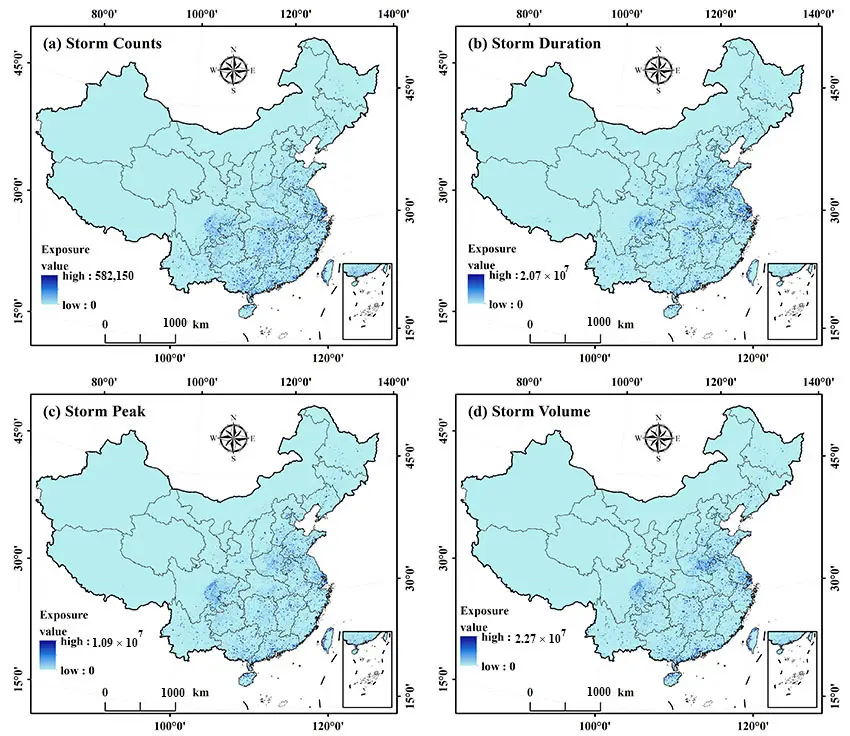
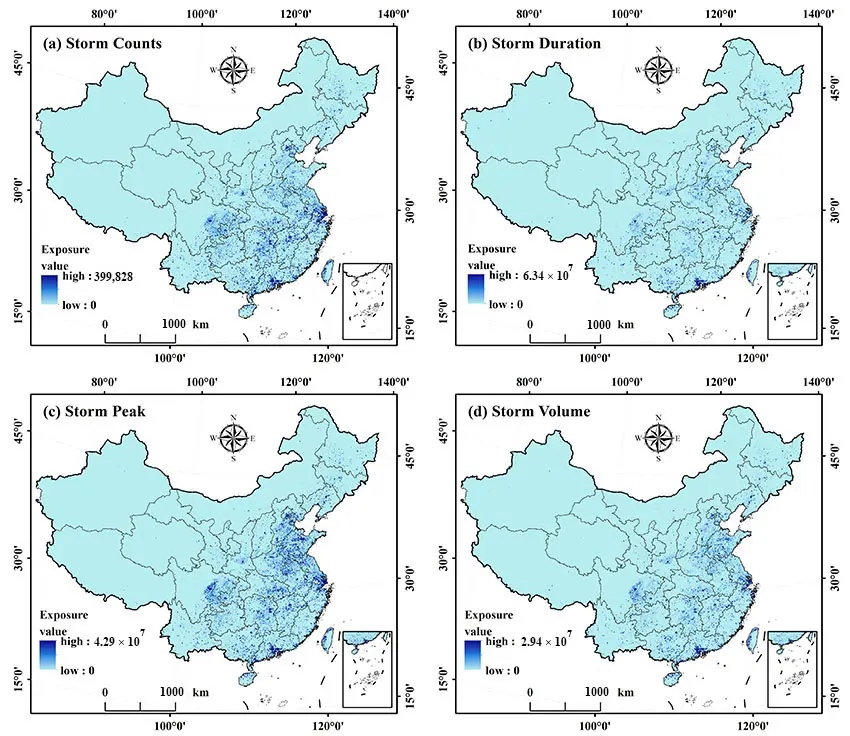
Figure 6 shows the exposure of the Chinese population to four extreme rainstorm events in 2020. The spatial distribution pattern of China’s population exposure under the four extreme rainstorms is the same as that of 2000, still showing a spatial distribution pattern of low in the northwest and high in the southeast. In 2020, China’s population will be exposed to more significant levels of extreme rainstorm frequency and extreme rainstorm peak, compared with the duration of extreme rainstorm and the cumulative amount of extreme rainstorm. Compared with 2000, population exposure in provincial capitals in southeastern China has significantly increased, possibly due to population migration.
4. Discussion
The study found that the frequency of extreme rainstorm in China from 2000 to 2020 showed a spatial distribution characteristic of increasing from northwest to southeast, which was highly consistent with the regional climate background and geographical environment characteristics of China. The arid areas in northwest China are located in the inland, far away from the sea, and the water vapor transport is insufficient, leading to the almost extinction of extreme rainstorm events; However, due to the frequent influence of summer monsoon, typhoon and other weather systems, the southeast coastal area has abundant water vapor and strong upward movement, which provides favorable conditions for the formation of extreme rainstorm, making the frequency of extreme rainstorm up to 14 times (Figure 1a). The spatial distribution of extreme rainstorm peaks and cumulative amount is roughly consistent with their frequency, further confirming the key roles of water vapor conditions and dynamic uplift in the formation of extreme rainstorms. Among them, Hainan Province, with its unique tropical marine climate and abundant water vapor supply, has become a high value area (Figure 1c) of extreme rainstorm peak (over 136 mm/day) and cumulative amount (From Figure 1d, its absolute value is close to 650 mm), which is consistent with the climate characteristics of high temperature and rain throughout the year and frequent typhoon activities. It is worth noting that the spatial distribution of the duration of extreme rainstorm shows different characteristics from other indicators. The Qinghai Tibet Plateau and Northeast China (Figure 1b) have become the regions with the longest duration (over 930 h). As the “Roof of the World”, the Qinghai Tibet Plateau has complex terrain and a high altitude. Influenced by the South Asian monsoon, water vapor slowly climbs under the obstruction of the terrain, forming sustained precipitation; Northeast China is affected by the advance and retreat of summer monsoon and local topography, and the precipitation process lasts for a long time. This distribution feature highlights the important role of topographic factors in the evolution of extreme rainstorm duration.
The time variation trend of extreme rainstorm events in China from 2000 to 2020 has significant regional heterogeneity. The frequency of extreme rainstorm in Northeast China increases at a rate of 0.3 times per year, and the peak value of rainstorm in the North China Plain and eastern coastal areas shows an upward trend, which may be related to the strengthening of the East Asian summer monsoon and the increase of water vapor transport in northern China under the background of global warming [21,22]. Climate change has increased atmospheric water-holding capacity, providing more water vapor reserves for extreme precipitation events, while altering atmospheric circulation patterns, resulting in increased precipitation extremes in northern regions. On the contrary, the frequency of extreme rainstorms in the southern Qinghai Tibet Plateau, most of Yunnan, and northern Hainan (Figure 2a) has a decreasing trend (up to 0.4 times/year), and the peak value of rainstorms in Taiwan Province (Figure 2c) has a significant decrease (absolute value of −11.1). This phenomenon may be related to adjustments in regional circulation. For example, changes in the circulation system around the Qinghai Tibet Plateau lead to the reduction of water vapor transport, the stability of precipitation in Yunnan is reduced due to the fluctuation of the South Asian monsoon, and Taiwan may be affected by factors such as typhoon path deviation, and the intensity of extreme rainstorms is weakened. In addition, the change rate of rainstorm accumulation is strong in the south and weak in the north. The southeast coast and Hainan area increase at a rate of 120 mm/year (Figure 2d), which reflects that the trend of precipitation extremes in the south is more obvious under the background of global warming.
The spatial agglomeration characteristics of extreme rainstorm events from 2000 to 2020 show a certain evolution law. In 2000, the frequency of extreme rainstorms showed a pattern of high value concentration in the southeast coast and low value concentration in most parts of the northwest and north, which is consistent with the basic characteristics of China’s climate division and water vapor distribution. In 2020, this basic pattern remained stable, but there were local adjustments: Yunnan and Hubei provinces showed a clustering feature of “low values surrounded by high values”, which may be related to regional terrain differences and subtle changes in water vapor transport pathways; The high-high concentration area of rainstorm duration shrinks to South China (only Guangxi, Guangdong and Yunnan), while the number of low-low concentration provinces in the north increases, reflecting the increased regional consistency of extreme rainstorm duration in the north. The evolution of the concentration characteristics of rainstorm peak and cumulative amount shows that the high value concentration area shifts to South China, which is consistent with the trend of improving water vapor conditions and increasing extreme precipitation events in South China. The Qinghai Tibet Plateau, Qinghai, Gansu, Ningxia, and other northwest provinces have always maintained the low value concentration characteristics, which further confirms that the climate background of drought and little rain in these regions has limited the extreme rainstorm. In general, the evolution of the spatial agglomeration characteristics of extreme rainstorms results from the joint action of climate system changes and regional geographical environments, reflecting differences in the responses of different regions to global climate change.
The population exposure of extreme rainstorm events in China in 2000 and 2020 shows a spatial distribution characteristic of low in the northwest and high in the southeast, which is highly coupled with the population distribution pattern of “dense population in the southeast and sparse population in the northwest” in China. Southeast China is not only a high incidence area of extreme rainstorm, but also a core agglomeration area of China’s population and economy. The high population density and high urbanization level lead to a significantly higher population exposure in this region than in the northwest arid region. Further analysis reveals that in 2000, the population exposure of provincial capitals in southeastern coastal provinces was higher than that of other regions within the province, which is closely related to the population agglomeration effect and urbanization process of provincial capitals. In the area with a high frequency of extreme rainstorm, the population exposure in the southeast coastal area is more prominent; In the area with high rainstorm duration, peak value and cumulative amount, the population exposure in the Central Plains is more significant. This difference may be related to the high population density, flat terrain, and relatively weak disaster bearing capacity in the Central Plains. Although the frequency of extreme rainstorm is high in the southeast coastal areas, the population exposure in some areas is different due to the undulating terrain or relatively complete flood control facilities.
Compared with the frequency and peak values of extreme rainstorms experienced by the Chinese population in 2000, the exposure of residents to these two extreme events significantly increased in 2020, especially in the provincial capitals of southeast coastal provinces. This change is mainly driven by two factors: first, population migration. From 2000 to 2020, China’s urbanization process accelerated, and a large number of rural population gathered in southeast coastal cities and provincial capital cities, leading to a further increase in population density in these areas, thus increasing the probability of population contact with extreme rainstorm events; The second is the change of extreme rainstorm event itself. The increasing trend of extreme rainstorm frequency and peak value in the southeast coastal area further increases the risk of extreme rainstorm faced by the population. In addition, population exposure changes under different extreme rainstorm indicators differ. Compared with the duration and cumulative amount of rainstorm, the changes of population exposure to rainstorm frequency and peak are more significant. This may be because the frequency and peak value of rainstorm directly affect the frequency and intensity of extreme rainstorm events, which have a more direct impact on human production and life, while the impact of duration and cumulative amount is relatively indirect and can be mitigated by flood control facilities. In general, the change of population exposure is the result of the joint action of population distribution changes and the spatial-temporal evolution of extreme rainstorm events, reflecting the interaction between human factors and natural factors.
The temporal and spatial variation characteristics of population exposure provide an important reference for the risk prevention and control of extreme rainstorm disasters in China. Given the high-value population exposure area and the high-incidence extreme rainstorm area, the southeast coast and central plains should strengthen the construction of flood control and waterlogging drainage facilities, improve the warning and forecasting systems for extreme rainstorms, and enhance urban disaster prevention and mitigation capacity. The provincial capital city and other densely populated areas need to focus on optimizing urban flood control planning, reasonably layout the urban spatial structure, and reduce the concentration of population and economic activities in high-risk areas of extreme rainstorm. In addition, the trend of population migration to Southeast coastal cities from 2000 to 2020 has increased population exposure. Therefore, extreme rainstorm disaster risk should be fully considered in the process of urbanization, and the overall coordination of regional population development planning and disaster prevention and mitigation planning should be strengthened. Although the population exposure in low value exposure areas in northwest China is low, it is still necessary to pay attention to the suddenness of extreme rainstorm events in some areas, improve the grassroots disaster prevention and mitigation system, and ensure the safety of life and property of a small number of people living in concentrated communities.
5. Conclusions
Based on the relevant data of extreme rainstorm events and population distribution grid data in China from 2000 to 2020, this study systematically analyzed the spatio-temporal evolution of extreme rainstorm events and the change characteristics of population exposure in different periods, and reached the following main conclusions:
- (1)
-
Extreme rainstorm frequency, peak intensity, and cumulative volume exhibit a consistent southeastward increasing gradient, while duration shows a unique pattern with prolonged events concentrated on the Qinghai-Tibet Plateau and Northeast China, underscoring the differential control of monsoon dynamics versus topographic forcing.
- (2)
-
Over the two decades, extreme rainstorm indicators display pronounced regional disparities—northeastern China experienced increasing frequency, the southeastern coast saw rising intensity and accumulation, whereas the southern Plateau and Taiwan Province exhibited significant declines—highlighting the non-uniform response of regional hydroclimate to global warming.
- (3)
-
Population exposure to extreme rainstorms mirrors China’s demographic divide (low northwest, high southeast) and has intensified by 2020, particularly for frequency and peak intensity in southeast coastal capitals. This increase is jointly driven by population migration toward high-risk areas and the concomitant strengthening of extreme rainstorm events themselves.
Author Contributions
Conceptualization, Y.Y.; Methodology, Y.Y.; Software, Y.Y.; Validation, Y.Y.; Formal Analysis, Y.Y.; Data Curation, Y.Y.; Writing—Original Draft Preparation, Y.Y.; Writing—Review & Editing, Y.Y., X.Y. and S.Z; Visualization, Y.Y., X.Y. and S.Z.; Supervision, L.T.; Project Administration, L.T.
Ethics Statement
Not applicable.
Informed Consent Statement
Not applicable.
Data Availability Statement
Allow data to be obtained upon reasonable request.
Funding
This research received no external funding.
Declaration of Competing Interest
The authors declare that they have no known competing financial interests or personal relationships that could have appeared to influence the work reported in this paper.
References
-
IPCC. Technical summary: Climate Change and Land. In IPCC Special Report on Climate Change, Desertification, Land Degradation, Sustainable Land Management, Food Security, and Greenhouse Gas Fluxes in Terrestrial Ecosystems; Cambridge University Press: Cambridge, UK, 2022; pp. 37–74. DOI:10.1017/9781009157988.002 [Google Scholar]
-
Bastos A, Sippel S, Frank D, Mahecha MD, Zaehle S, Zscheischler J, et al. A joint framework for studying compound ecoclimatic events. Nat. Rev. Earth Environ. 2023, 4, 333–350. DOI:10.1038/s43017-023-00410-3 [Google Scholar]
-
Murali G, Iwamura T, Meiri S, Roll U. Future temperature extremes threaten land vertebrates. Nature 2023, 615, 461–467. DOI:10.1038/s41586-022-05606-z [Google Scholar]
-
Rodell M, Li B. Changing intensity of hydroclimatic extreme events revealed by GRACE and GRACE-FO. Nat. Water 2023, 1, 241–248. DOI:10.1038/s44221-023-00040-5 [Google Scholar]
-
Zscheischler J, Westra S, van den Hurk BJJM. Future climate risk from compound events. Nat. Clim. Change 2018, 8, 469–477. DOI:10.1038/s41558-018-0156-3 [Google Scholar]
-
Fouillet A, Rey G, Laurent F, Pavillon G. Excess mortality related to the August 2003 heat wave in France. Int. Arch. Occup. Environ. Health 2006, 80, 16–24. DOI:10.1007/s00420-006-0089-4 [Google Scholar]
-
Grimm NB, Faeth SH, Golubiewski NE. Global change and the ecology of cities. Science 2008, 319, 756–760. DOI:10.1126/science.1150195 [Google Scholar]
-
Ren Y, Zhang H, Wei W. Effects of turbulence structure and urbanization on the heavy haze pollution process. Atmos. Chem. Phys. 2019, 19, 1041–1057. DOI:10.5194/acp-19-1041-2019 [Google Scholar]
-
Turner SWD, Voisin N, Fazio J. Compound climate events transform electrical power shortfall risk in the Pacific northwest. Nat. Commun. 2019, 10, 8. DOI:10.1038/s41467-018-07894-4 [Google Scholar]
-
Chen Y, Wang X, Huang L, Luo Y. Spatial and temporal characteristics of abrupt heavy rainfall events over Southwest China during 1981–2017. Int. J. Climatol. 2021, 41, 3286–3299. DOI:10.1002/joc.7019 [Google Scholar]
-
Guo H, He X, Lv X, Wu Y. Risk analysis of rainstorm-urban lifeline system disaster chain based on the PageRank-risk matrix and complex network. Nat. Hazard. 2024, 120, 10583–10606. DOI:10.1007/s11069-024-06613-1 [Google Scholar]
-
Rahmani V, Hutchinson S, Harrington J, Hutchinson J. Analysis of frequency and magnitude of extreme rainfall events with potential impacts on flooding: A case study from the central United States. Int. J. Climatol. 2016, 36, 3578–3587. DOI:10.1002/joc.4577 [Google Scholar]
-
Zhao X, Qu Z, Zhang J, Sha Y. Risk Assessment and Mitigation Strategies for Rainstorm-Induced Disaster Chains in Northwest China. Nat. Hazard. Rev. 2025, 26, 04024050. DOI:10.1061/NHREFO.NHENG-2163 [Google Scholar]
-
Wang Y, Gao G, Zhai J, Liu Q, Song L. Evolution characteristics of the rainstorm disaster chains in the Guangdong-Hong Kong-Macao Greater Bay Area, China. Nat. Hazard. 2023, 119, 2011–2032. DOI:10.1007/s11069-023-06108-5 [Google Scholar]
-
Ye Z, Jia X, Liu H, Zhou G, Wang L. Flood disaster chain deduction based on cascading failures in urban critical infrastructure. Reliab. Eng. Syst. Saf. 2025, 261, 110723. DOI:10.1016/j.ress.2025.111160 [Google Scholar]
-
Jones B, Tebaldi C, O’Neill BC, Oleson K, Gao J. Avoiding population exposure to heat-related extremes: Demographic change vs. climate change. Clim. Change 2018, 146, 423–437. DOI:10.1007/s10584-017-2133-7 [Google Scholar]
-
Chen H, Sun J, Li H. Increased population exposure to precipitation extremesunder future warmer climates. Environ. Res. Lett. 2020, 15, 034048. DOI:10.1088/1748-9326/ab751f [Google Scholar]
-
Cliff AD, Ord JK. Spatial Processes: Models and Applications; Pion Limited: London, UK, 1981. [Google Scholar]
-
Anselin L. Local indicators of spatial association—LISA. Geogr. Anal. 1995, 27, 93–115. DOI:10.1111/j.1538-4632.1995.tb00338.x [Google Scholar]
-
Jones B, O’Neill BC, McDaniel L. Future population exposure to US heat extremes. Nat. Clim. Change 2015, 5, 652–655. DOI:10.1038/nclimate2631 [Google Scholar]
-
Wang T, Miao J, Sun J, Fu Y. Intensified East Asian summer monsoon and associated precipitation mode shift under the 1.5 °C global warming target. Adv. Clim. Change Res. 2018, 9, 102–111. DOI:10.1016/j.accre.2017.12.002 [Google Scholar]
-
IPCC. Climate Change 2021: The Physical Science Basis. In Contribution of Working Group I to the Sixth Assessment Report of the Intergovernmental Panel on Climate Change; Cambridge University Press: Cambridge, UK, 2021. [Google Scholar]