
Daily Variability of Climatic Projection Extremes Indices of Precipitation and Temperature in the Koliba-Corubal Watershed (Guinea and Guinea-Bissau)
Daily Variability of Climatic Projection Extremes Indices of Precipitation and Temperature in the Koliba-Corubal Watershed (Guinea and Guinea-Bissau)

Received: 17 March 2026 Revised: 01 April 2026 Accepted: 17 April 2026 Published: 08 May 2026

© 2026 The authors. This is an open access article under the Creative Commons Attribution 4.0 International License (https://creativecommons.org/licenses/by/4.0/).
1. Introduction
Climate change is one of the major environmental challenges of the 21st century, with particularly pronounced consequences for tropical and subtropical regions. Observations gathered on a global scale confirm an unprecedented acceleration of climate disruption, and its consequences are multiplying worldwide. In West Africa, a region particularly vulnerable to climate hazards, populations are facing a resurgence of extreme events, including recurring droughts and devastating floods, exacerbated by rapid urbanization in floodplains. This increased vulnerability results from a combination of factors, including a strong dependence on rain-fed agricultural activities, limited adaptive capacities, and natural exposure to climate variations [1].
The scientific community now agrees on the predominant role of human activities in the observed warming of the oceans and land [2]. This warming has led to significant and rapid changes in the atmosphere and biosphere, most notably the spatiotemporal disruption of climatic parameters [3]. Climate projections from global models indicate that West Africa will experience a significant increase in temperatures, accompanied by high rainfall variability [4]. More specifically, the CMIP6 (Coupled Model Intercomparison Project Phase 6) models project continued temperature warming across the region, with marked zonal contrasts and significant disparities between models regarding future rainfall patterns [5].
The study of extreme weather events is particularly important because they, rather than average changes, have the greatest impact on societies and ecosystems [6]. Extreme climate indices, defined using daily temperature and precipitation data, allow us to quantify these rare events and assess their potential evolution in a changing climate. In West Africa, several recent studies have highlighted a trend toward intensification of extreme rainfall events, although the signals vary across sub-regions and scenarios [7,8]. At the same time, heatwaves and tropical nights are showing a marked increase in their frequency and intensity [9,10].
Water resources, particularly vulnerable to climate change, are a major challenge for West African countries [11]. Transboundary watersheds, such as the Koliba-Corubal River basin, are of particular concern because they represent vital sources of freshwater for riverine populations. Previous studies have shown that future runoff variations will generally follow rainfall patterns, with projected decreases for some basins, such as those of Senegal and The Gambia, and increases for others, such as the Sassandra [11,12]. In this context, a detailed understanding of future daily variability in rainfall and temperatures is essential for anticipating hydrological risks and adapting management strategies.
The advent of new generations of climate models, within the framework of CMIP Phase 6, offers unprecedented opportunities to refine regional climate projections [13]. Unlike previous versions, CMIP6 models incorporate shared socio-economic pathways (SSPs) that combine greenhouse gas emission trajectories with socio-economic development assumptions [14]. Among these scenarios, SSP1 represents a low-carbon future with minimal mitigation and adaptation challenges, while SSP5 corresponds to rapid technological development coupled with intensive fossil fuel use, resulting in high emissions and significant global warming [4]. The use of multiple models and scenarios allows for a better understanding of the uncertainties associated with future projections [15,16].
Several recent studies have evaluated the performance of CMIP6 models in simulating the West African climate. Faye and Akinsanola [7] showed that these models reproduce extreme rainfall indices for the region reasonably well, although biases persist, particularly in the representation of the West African monsoon. Similarly, Saley and Salack [17] analyzed the future evolution of intense rainfall events in the Sahel and West Africa, highlighting increases in their frequency and intensity driven by climate change. However, projections diverge across sub-regions: eastern West Africa could experience an increase in rainfall, while the western part, including the Koliba-Corubal basin, could face a decrease [5,8].
The Koliba-Corubal River basin, shared between Guinea and Guinea-Bissau, provides a particularly relevant case study for analyzing these future climate changes. As described by Sambou et al. [18], this basin exhibits remarkable climatic and ecological diversity, with a rainfall gradient decreasing from south to north and temperatures with significant seasonal variations. Despite its modest size, this river represents the main freshwater resource for Guinea-Bissau, thus justifying the importance of anticipating future changes in its hydrological regime [19]. Previous work conducted in similar contexts, such as that of Gnangouin et al. [3] on the N’zi basin in Côte d’Ivoire or Dione et al. [4] on the Aga-Foua-Djilas basin in Senegal, has demonstrated the usefulness of climate index approaches for characterizing future changes in seasonal regimes.
Analysis of extreme precipitation indices, such as total annual rainfall above the 99th percentile (R99p), maximum consecutive rainfall over 3 and 5 days (Rx3day, Rx5day), the daily rainfall intensity index (SDII), and the maximum number of consecutive wet days (CWD), allows for a detailed characterization of future rainfall patterns [20,21]. Concurrently, extreme temperature indices, such as the percentage of warm nights (TN90p), the maximum value of minimum temperatures (TNx), the percentage of hot days (TX90p), and the maximum value of maximum temperatures (TXx), provide information on the evolution of thermal extremes [22,23]. These indices, recommended by the Expert Team on Climate Change Detection and Indices (ETCCDI), provide a standardized framework for comparing results across regions and models.
Several recent studies have highlighted the importance of integrating these indices into climate change adaptation strategies. Neglo [24] emphasize the need to translate climate projections into actionable information for public development policies in West Africa. Similarly, Hansen et al. [25] propose climate risk management tools tailored to the needs of the agricultural and pastoral sectors in Senegal. In the area of water resources, Sadio [26] characterized the hydrological variability of the Casamance and Kayanga-Géva basins, highlighting contrasting signals depending on the sub-basins and the time horizons considered.
However, despite the abundance of regional studies, few have specifically focused on the future daily variability of rainfall and temperature in non-Sahelian watersheds of West Africa, and even fewer in the transboundary Koliba-Corubal context. Yet, as Fotso-Nguemo et al. [27] point out, a detailed characterization of climatic extremes at the local scale is essential for assessing potential impacts on populations and ecosystems. Studies conducted in similar contexts, such as those by Dogiso et al. [28] in Ethiopia and Abubakar et al. [29] in Niger, demonstrate the relevance of multi-model approaches for assessing the future impacts of climate change on socio-ecological systems.
This study aims to address this gap by analyzing future daily precipitation and temperature variability in the Koliba-Corubal watershed using an extreme index approach. Based on projections from four CMIP6 climate models (GFDL-ESM4, MPI-ESM1-2-HR, UKESM1-0-LL, and IPSL-CM6A-LR) under the SSP1-2.6 and SSP5-8.5 scenarios, this research examines the evolution of six extreme precipitation indices and four extreme temperature indices for three time horizons (2021–2050, 2051–2080, and 2071–2100) relative to the 1985–2014 reference period. The analysis combines statistical approaches, including Mann-Kendall trend tests and break detection using the Pettitt test, with spatial mapping of projected changes. The results will help identify the areas and periods most vulnerable to climate extremes, thus providing key elements for developing adaptation strategies tailored to local realities.
2. Study Area
The Koliba-Corubal River basin extends between 11° and 12°30′ north latitude and 12° and 14°30′ west longitude. This transboundary territory is shared between the Republic of Guinea, which occupies 84.5% of its area, and Guinea-Bissau, which holds 15.5%. At the Tché-Tché hydrometric station, the basin covers a total area of 20,876.4 km2 (Figure 1).
The river originates west of the Fouta Djallon massif, in Middle Guinea, more specifically in the Labé region. It is formed by the confluence of two major watercourses: the Tomine, whose source is located in Sangale, and the Komba, which originates in Madina Wora. These two rivers meet near the town of Gaoual to form the Koliba. After a winding course of approximately 200 km westward, the river forms the border between Guinea and Guinea-Bissau for a few kilometers before entering Guinea-Bissau territory, where it takes the name Corubal. It then joins the Kayanga-Geba estuary near the town of Xime, in a flat, marshy area subject to the influence of tides that penetrate deep inland [18,19]. Although its drainage basin is modest in size, this river constitutes the main source of freshwater for Guinea-Bissau.
Environmentally, the basin exhibits a diversity of vegetation formations, including dense forests, degraded montane forests, dry forests frequently affected by bushfires, wooded savannas, forested areas, as well as cultivated land and fallow fields [18,30]. The climate is tropical, characterized by a single rainy season lasting from five months in the north to six months in the south, and a pronounced dry season from November to April. Rainfall follows a decreasing gradient from south to north, linked to the dynamics of the West African monsoon. Average monthly maximum temperatures range from 26.0 to 33.4 °C in Labé, and from 31.1 to 40.2 °C in Koundara, observed in August and April, respectively. Average minimum temperatures vary from 10.2 to 18.3 °C in Labé and from 15.0 to 24.2 °C in Koundara between December and May [18].
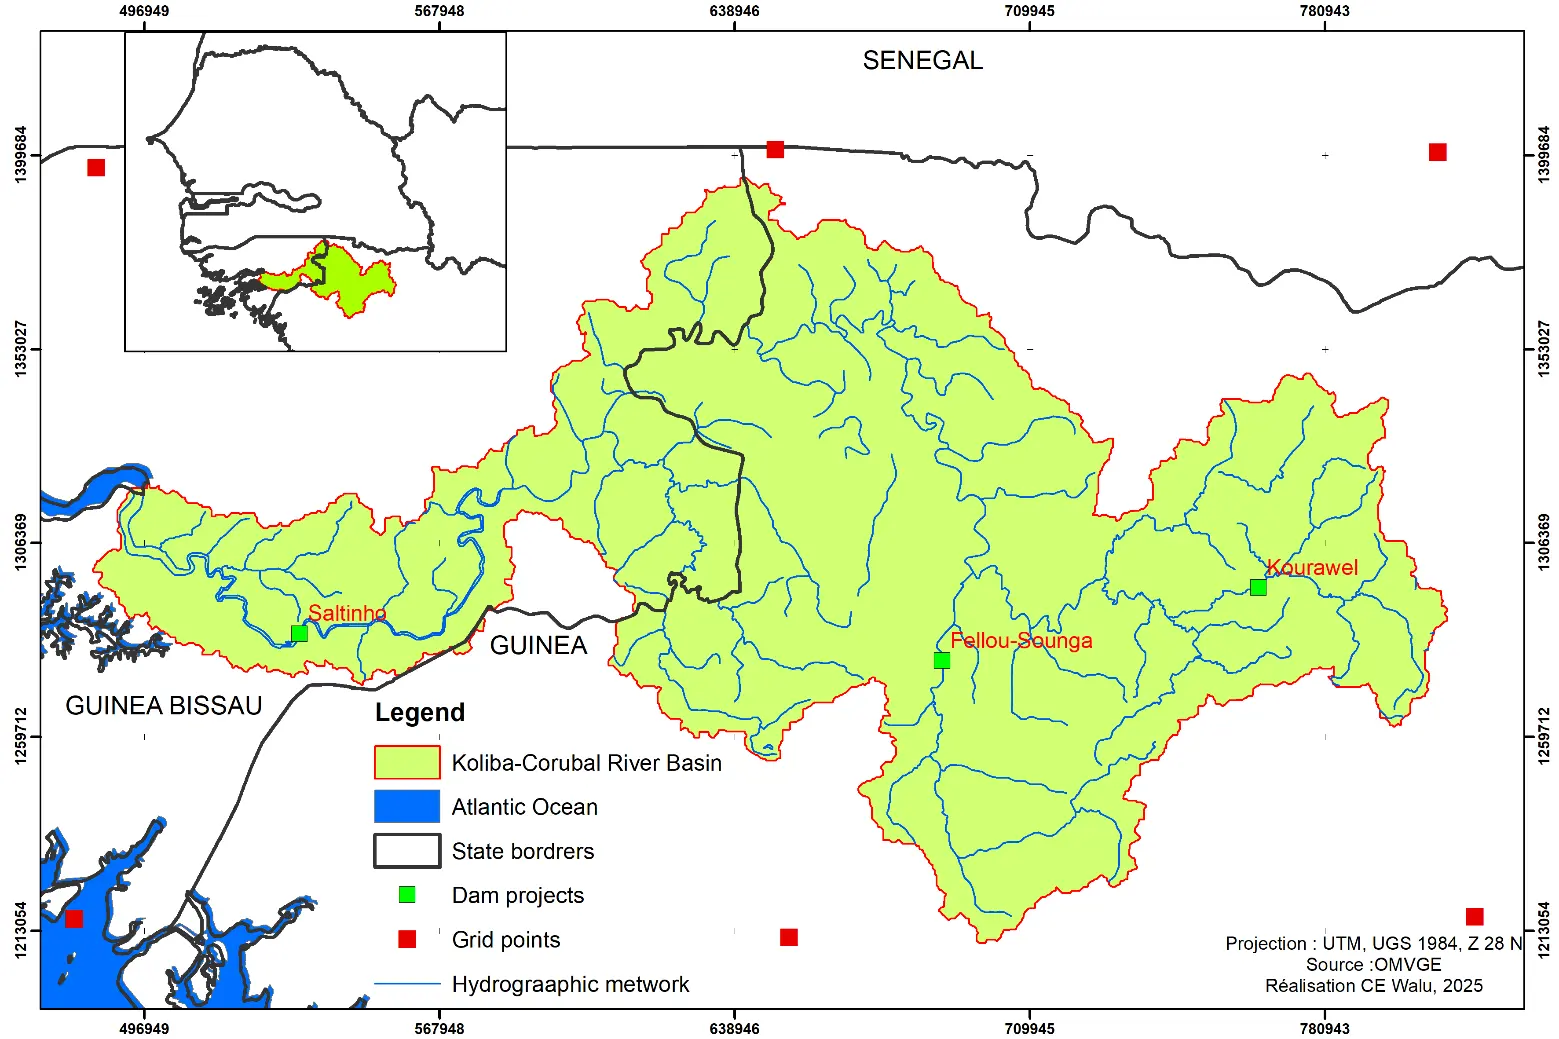
Figure 1. Location of the Koliba-Corubal watershed showing the Tché-Tché, Cade, Gaoual_Koliba, and Gaoual_Tomine stations.
3. Materials and Methods
3.1. Future Precipitation and Temperature Data
The study of future climate is crucial for governments, particularly for the development of public policies. Understanding future climate change enables anticipation of its negative effects and associated risks, facilitating the implementation of adaptation strategies and informed decision-making. This knowledge is especially important for developing countries, where agricultural activities are heavily dependent on rainfall. Agricultural development planning therefore, requires a precise analysis of short-, medium-, and long-term rainfall trends. Furthermore, water resource management, which is largely dependent on rainfall, also requires a rigorous assessment of climate forecasts.
As part of the assessment of the impact of climate change on future rainfall and temperatures in the Koliba-Corubal basin, two climate change scenarios were used to model different socio-economic futures. These scenarios include SSP1-2.6, which combines low mitigation and adaptation challenges with low greenhouse gas emissions, and SSP5-8.5, characterized by low population growth and rapid technological development, accompanied by intensive use of fossil fuels, leading to high emissions and significant global warming [4].
The climate projections used are derived from the latest CMIP6 simulations, presented in the IPCC’s Sixth Assessment Report. Four climate models, frequently used for Africa, were selected to represent both global and regional climate. These models have demonstrated a good capacity to simulate climate change in Africa, and the scenarios were downloaded from the ISIMIP platform (https://www.isimip.org, accessed on 20 November 2025), notably for the ISIMIP3b simulation cycle. Historical data from 1985–2014 served as a baseline for validating future simulations.
To ensure the reliability of the projections, the CMIP6 simulation results were compared with observational data from the Koliba-Corubal basin. Four models (GFDL-ESM4, MPI-ESM1-2-HR, UKESM1-0-LL, and IPSL-CM6A-LR), which accurately reproduced past rainfall [20,21], were used to estimate future rainfall and temperatures in the region (Table 1). The mean values of these models were calculated to reduce natural variability and systematic biases, thus ensuring greater accuracy. Daily data, including mean maximum and minimum temperatures and cumulative daily rainfall, were downloaded from the platform in CSV format.
The data were corrected using the modified quantile method, which yields good results compared to other methods. For temperatures, the quantile method applied is the difference method. For precipitation, the quantile method applied is the multiplicative method Delta. The model data are used and individually corrected using quantile methods before the ensemble means are used. In the basins, compared to observed data, the correlation coefficient of the bias-corrected multi-model ensemble outputs should be “>0.95” for temperature and “>0.60” for precipitation. Beyond bias correction, the single use of the average ensemble allowed for circumventing the divergence of climate models for future horizons.
Table 1. Some characteristics of the four selected climate models.
|
GCM Name |
Institute/Country |
Variant-ID |
Horizontal Resolution |
Country |
|---|---|---|---|---|
|
IPSL-CM6A-LR |
Pierre Simon Laplace Institute, France |
r1i1p1f1 |
2.50° × 1.26° |
France |
|
MPI-ESM1-2-HR |
Max Planck Institute for Meteorology, Germany |
r1i1p1f1 |
0.94° × 0.94° |
Germany |
|
GFDL-ESM4 |
Geophysical Fluid Dynamics Laboratory, USA |
r1i1p1f1 |
1.25° × 1.00° |
USA |
|
UKESM1-0-LL |
National Institute of Meteorological Sciences/Korea Meteorological Administration, UK/Korea |
r1i1p1f2 |
1.875° × 1.25° |
UK/Korea |
3.2. Breakdown and Indices of Precipitation and Extreme Temperatures Calculated Over the Future Period
Using precipitation and temperature data from the historical period (1985–2014) and the future period (2015–2100), the data was divided into sub-periods, for which several statistics were calculated. The two SSP scenarios were evaluated for the periods 2021–2050, 2051–2080, and 2071–2100. This division into time horizons was chosen because three horizons (near, medium, and far) are generally required to study and compare hydroclimatic trends. These projections were processed using ArcGIS 10.8 software to map the results and analyze climate evolution over the 2021–2100 period. These simulations thus allow for a better understanding of future climate trends and the adaptation of public policies and strategies in the Koliba-Corubal basin.
Using data from the SSP1-2.6 and SSP5-8.5 scenarios, a set of extreme precipitation indices used in numerous studies [26,31,32,33] was calculated. These include:
-
-
R99p: Total annual precipitation in days > the 99th percentile (mm)
-
-
Rx3day: Maximum annual consecutive 3-day precipitation (mm)
-
-
Rx5day: Maximum annual consecutive 5-day precipitation (mm)
-
-
SDII: Daily Rainfall Intensity Index (mm/wet day)
-
-
CWD: Maximum number of consecutive days with precipitation ≥ 1 mm (days)
-
-
R20mm: Annual number of days with precipitation ≥ 20 mm (days)
Based on future data from the SSP1-2.6 and SSP5-8.5 scenarios, a set of extreme temperature indices was calculated. These include:
-
-
TN90p: Annual percentage of days where TN > 90th percentile (%)
-
-
TNx: Annual maximum value of daily minimum temperatures (°C)
-
-
TX90p: Annual percentage of days where TX > 90th percentile (%)
-
-
TXx: Annual maximum value of daily maximum temperatures (°C)
The processing of precipitation and temperature data for the future period was carried out using computational tools that combined statistical and cartographic (spatial) methods. The analysis of the distribution of precipitation and temperature indices in the Koliba-Corubal basin is conducted over different future periods relative to the base period (1985–2014).
Statistical analyses were performed using Excel, XLSTAT, and R-Studio, while mapping was carried out using ArcGIS 10.5. The statistics calculated for climatic elements in the basins included, among others, the mean, standard deviation, coefficient of variation, maximum and minimum values of the series, and the difference between these extremes. Inferential analyses included statistical tests (Mann-Kendall) to assess trends in the data series, as well as Pettitt’s test to identify breakpoints in these time series.
Spatial interpolation of precipitation indices and extreme temperatures over the future period was carried out using the inverse distance-weighted (IDW) surface method. This method is widely applied in spatial interpolation applications of precipitation data and has given satisfactory results [34].
For precipitation, the relative seasonal (or interannual) rates of change were calculated by taking the difference between the future periods (2021–2050, 2051–2080, 2071–2100) and that of the 1985–2014 baseline for precipitation, expressed as a percentage.
For temperatures, absolute seasonal (or interannual) changes were calculated by taking the difference between future periods (2021–2050, 2051–2080, 2071–2100) and that of the 1985–2014 baseline for temperature, expressed in degrees Celsius or percentage where appropriate.
4. Results
4.1. Daily Variability of Future Rainfall in the Basins
Analysis of extreme precipitation indices for the Koliba-Corubal basin shows a general downward trend in these indices in the future compared to the reference period (1985–2014), under the SSP1-2.6 and SSP5-8.5 scenarios (Figure 2, Figure 3, Figure 4 and Figure 5). Table 2 and Table 3 present significant variations in these precipitation indices, including R99p, Rx3day, Rx5day, SDII, CWD, and R20mm.
Table 2. Average annual values of the six extreme precipitation indices selected for the reference period and the future period in the Koliba-Corubal basin.
|
SSP1-2.6 |
R99p |
Rx3day |
Rx5day |
SDII |
CWD |
R20mm |
|---|---|---|---|---|---|---|
|
1985–2014 |
8.1 |
150.9 |
178.5 |
10.79 |
35.6 |
17.0 |
|
2021–2100 |
4.4 |
88 |
122 |
9.4 |
131.24 |
14.7 |
|
2021–2050 |
4.5 |
89.0 |
121.7 |
9.3 |
129.1 |
14.0 |
|
2051–2080 |
4.7 |
86.3 |
120.7 |
9.3 |
131.3 |
13.9 |
|
2071–2100 |
4.6 |
87.0 |
122.4 |
9.6 |
131.7 |
15.8 |
|
SSP5-8.5 |
R99p |
Rx3day |
Rx5day |
SDII |
CWD |
R20mm |
|
1985–2014 |
8.1 |
150.9 |
178.5 |
10.79 |
35.6 |
17.0 |
|
2021–2100 |
5.1 |
120 |
120 |
8.6 |
116.94 |
12.3 |
|
2021–2050 |
3.8 |
118.8 |
118.8 |
9.1 |
127.4 |
13.1 |
|
2051–2080 |
5.1 |
116.3 |
116.3 |
8.4 |
110.6 |
11.7 |
|
2071–2100 |
6.5 |
126.4 |
126.4 |
8.3 |
108.6 |
12.4 |
Table 3. Percentage change in the six selected extreme precipitation indices for the future period compared to the reference period in the Koliba-Corubal basin.
|
SSP1-2.6 |
R99p |
Rx3day |
Rx5day |
SDII |
CWD |
|---|---|---|---|---|---|
|
2021–2100 |
−45.46 |
−42.0 |
−31.8 |
−12.4 |
268.6 |
|
2021–2050 |
−44.5 |
−41.0 |
−31.8 |
−13.7 |
262.7 |
|
2051–2080 |
−42.3 |
−42.8 |
−32.4 |
−14.0 |
268.8 |
|
2071–2100 |
−43.5 |
−42.3 |
−31.4 |
−10.6 |
269.9 |
|
SSP5-8.5 |
R99p |
Rx3day |
Rx5day |
SDII |
CWD |
|
2021–2100 |
−37.4 |
−20.2 |
−32.6 |
−20.5 |
228.5 |
|
2021–2050 |
−53.2 |
−21.3 |
−33.4 |
−16.1 |
258.0 |
|
2051–2080 |
−37.1 |
−22.9 |
−34.8 |
−22.4 |
210.6 |
|
2071–2100 |
−20.3 |
−16.2 |
−29.2 |
−23.5 |
205.0 |
Under the SSP1-2.6 scenario, R99p values (extreme precipitation on 99% of days) decrease by 45.4% between 2021–2100 and the reference period, while the SSP5-8.5, this decrease is 37.4%. Furthermore, the Rx3day (maximum 3-day precipitation) and Rx5day (maximum 5-day precipitation) indices show a decrease of 42.0% and 31.8%, respectively, under SSP1-2.6, and of 20.2% and 32.6% under SSP5-8.5 for the period 2021–2100.
The SDII (rainfall intensity) index, CWD (consecutive wet days), and R20mm (number of days with more than 20 mm of rainfall) also follow a downward trend under both scenarios, with a marked reduction towards the end of the century, indicating a decrease in the intensity of extreme rainfall in the Koliba-Corubal basin. It is worth noting that CWD shows a positive percentage change, which may indicate an increase in the maximum number of consecutive wet days despite decreases in other indices.
The increase in the consecutive wet days (CWD) index, with a notable rise of +268.6% under the SSP1-2.6 scenario and 228.5% under the SSP5-8.5 scenario, appears to contradict the overall downward trend in extreme precipitation. This discrepancy can be attributed to changes in precipitation distribution rather than total amounts. Specifically, while total extreme rainfall may decrease, the frequency and duration of consecutive wet days could increase, indicating a shift in rainfall patterns. This suggests that although extreme precipitation events become less intense, the region may experience prolonged wet periods, increasing the risk of flooding and altering hydrological cycles.
Table 4 presents the results of the Mann-Kendall test applied to extreme precipitation indices in the Koliba-Corubal basin for the SSP1-2.6 and SSP5-8.5 scenarios. By analyzing these indices, several trends emerge, particularly depending on the projection scenarios.
For the R99p index (amount of extreme precipitation), under the SSP1-2.6 scenario, the results show a very weak trend (Kendall’s tau = −0.010) and a high p-value (0.897), indicating that extreme precipitation does not exhibit a significant trend over this period. However, under the SSP5-8.5 scenario, a more pronounced positive trend is observed, with a Kendall’s tau of 0.244 and a p-value of 0.002, suggesting a significant increase in extreme precipitation in the basin, which could have important impacts on extreme weather events in the region.
Regarding the Rx3day and Rx5day indices (respectively, the maximum amount of precipitation over 3 and 5 days), the results under the SSP1-2.6 scenario show weak and insignificant trends (tau = 0.008 for Rx3day and tau = 0.0126 for Rx5day), indicating that no significant change is expected for these indices. However, under the SSP5-8.5 scenario, the trends become more significant, particularly for Rx5day, which has a Sen slope of 0.109, signaling a significant increase in 5-day precipitation in the future.
Table 4. Average annual changes in the six selected extreme precipitation indices for the future period, based on the Mann-Kendall test in the Koliba-Corubal basin.
|
SSP1-2.6 |
R99p |
Rx3day |
Rx5day |
SDII |
CWD |
R20mm |
|---|---|---|---|---|---|---|
|
Kendall’s Tau |
−0.010 |
0.008 |
0.026 |
0.166 |
0.074 |
0.168 |
|
p-value |
0.897 |
0.921 |
0.733 |
0.029 |
0.333 |
0.033 |
|
Sen slope |
−0.002 |
0.008 |
0.032 |
0.008 |
0.129 |
0.056 |
|
SSP5-8.5 |
R99p |
Rx3day |
Rx5day |
SDII |
CWD |
R20mm |
|
Kendall’s Tau |
0.244 |
0.109 |
0.109 |
−0.330 |
−0.186 |
−0.107 |
|
p-value |
0.002 |
0.153 |
0.153 |
0.000 |
0.015 |
0.172 |
|
Sen slope |
0.064 |
0.148 |
0.148 |
−0.016 |
−0.367 |
−0.042 |
Regarding the SDII (Rainfall Intensity Index), the SSP1-2.6 scenario reveals a slight positive trend (tau = 0.074), suggesting a moderate increase in rainfall intensity. This trend becomes negative under SSP5-8.5, where the tau value (−0.166) and the Sen slope (−0.008) indicate a stronger downward trend in rainfall intensity.
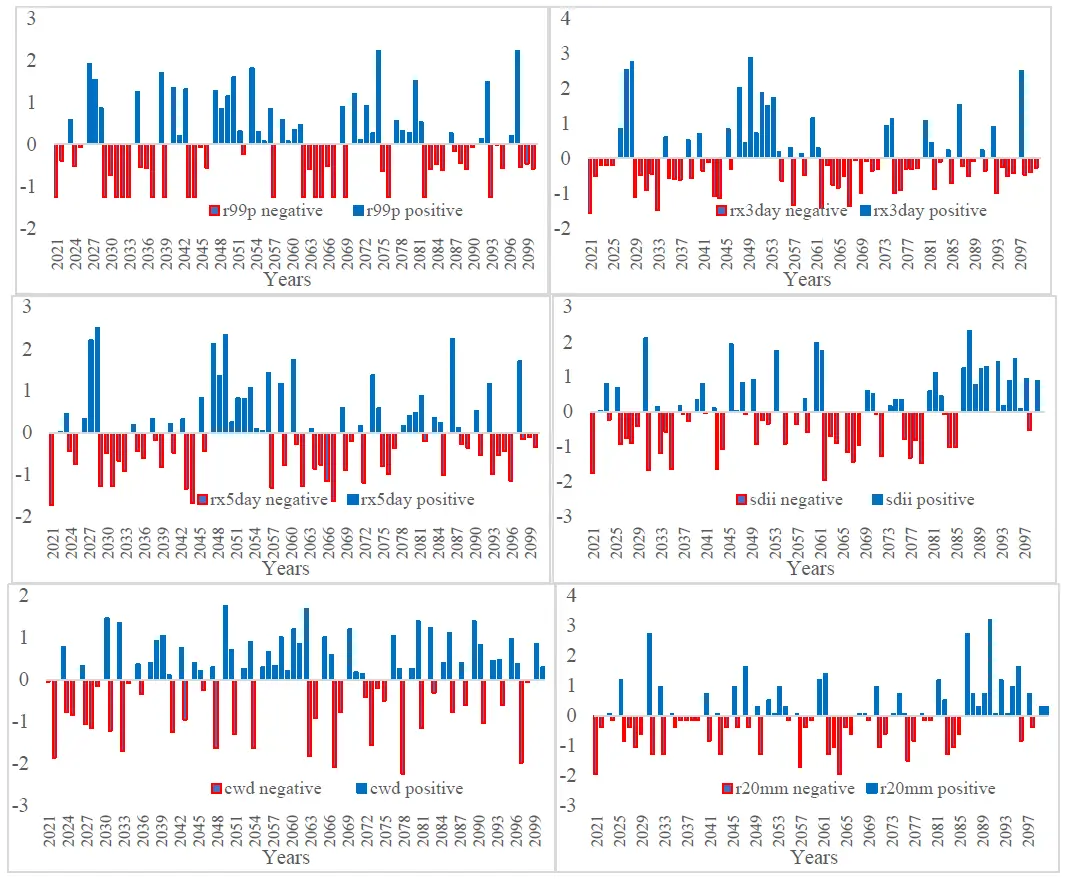
Figure 2. Evolution of the six extreme precipitation indices retained for the future period according to the SSP1-2.6 scenario in the Koliba-Corubal basin.
Finally, for the CWD (consecutive wet days) and R20mm (number of days with rainfall exceeding 20 mm) indices, the SSP1-2.6 scenario shows relatively low results, with a Sen slope of 0.129 for CWD. However, the significant variation of +268.6% in CWD under SSP1-2.6 with a non-significant trend in the Mann-Kendall test (p = 0.333) could be explained by strong interannual variability. However, under the SSP5-8.5 scenario, these indices show more significant negative trends, particularly for CWD, whose Sen slope is −0.367, highlighting a potential decrease in the number of consecutive wet days.
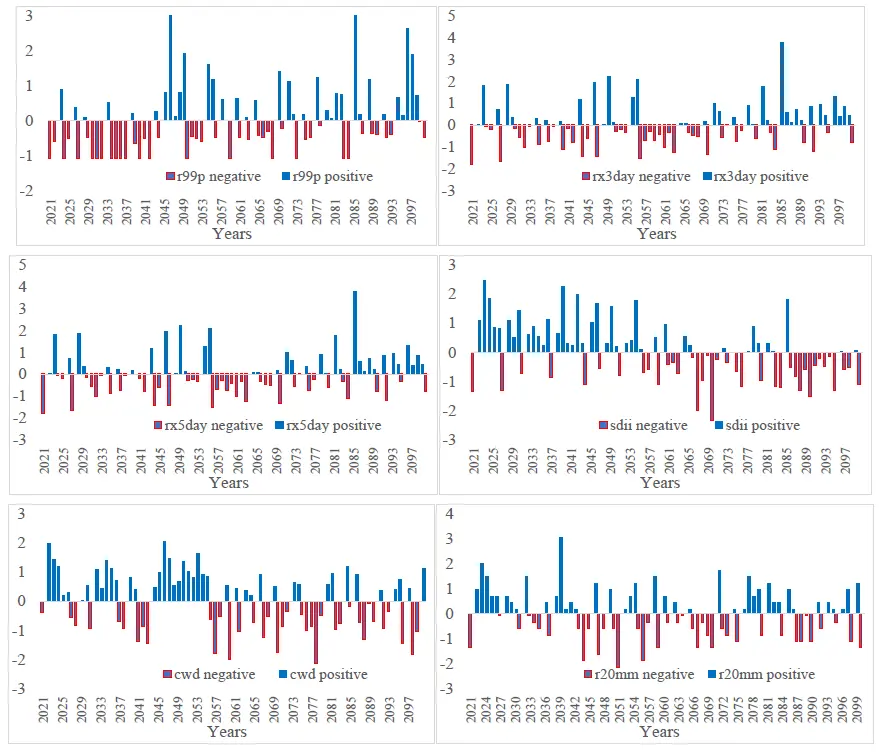
Figure 3. Evolution of the six extreme precipitation indices retained for the future period according to the SSP5-8.5 scenario in the Koliba-Corubal basin.
In general, it is observed that under the SSP5-8.5 scenario, extreme rainfall indices in the Koliba-Corubal basin tend to show more mixed trends compared to the SSP1-2.6 scenario, with some indices (R99p, Rx3day, Rx5day) increasing, while others (SDII, CWD, R20mm) decrease. This development suggests that the region could experience an intensification of extreme rainfall events in future periods under the high emissions scenario, which would have implications for climate risk management, including floods and associated disasters.
The evolution of the indices indicates a general trend toward a decrease in the intensity of extreme precipitation in the early stages of the 21st century, followed by an increase toward the end of the century under SSP5-8.5. This suggests a shift in the frequency and intensity of extreme precipitation events in the region. A decrease in the Rx3day and Rx5day indices at the beginning of the century could indicate fewer extreme precipitation events in the region during that period. However, the trend toward an increase later in the century could be attributed to several factors, including global climate change, which is altering precipitation patterns and making events that were rare in the past more frequent or more intense in the future.
The decrease in the rate of change of the indices over time could also mean that, although the variability of climatic conditions has decreased, the magnitude of extreme events may still increase, even if this appears to be happening at a slower pace.
The fact that torrential rains are already rare in the region, and that small changes can lead to high relative rates of change, demonstrates that these events, although infrequent, can have a disproportionate impact on the area. Management systems must therefore be prepared for scenarios where small variations can lead to significant changes in risk management.
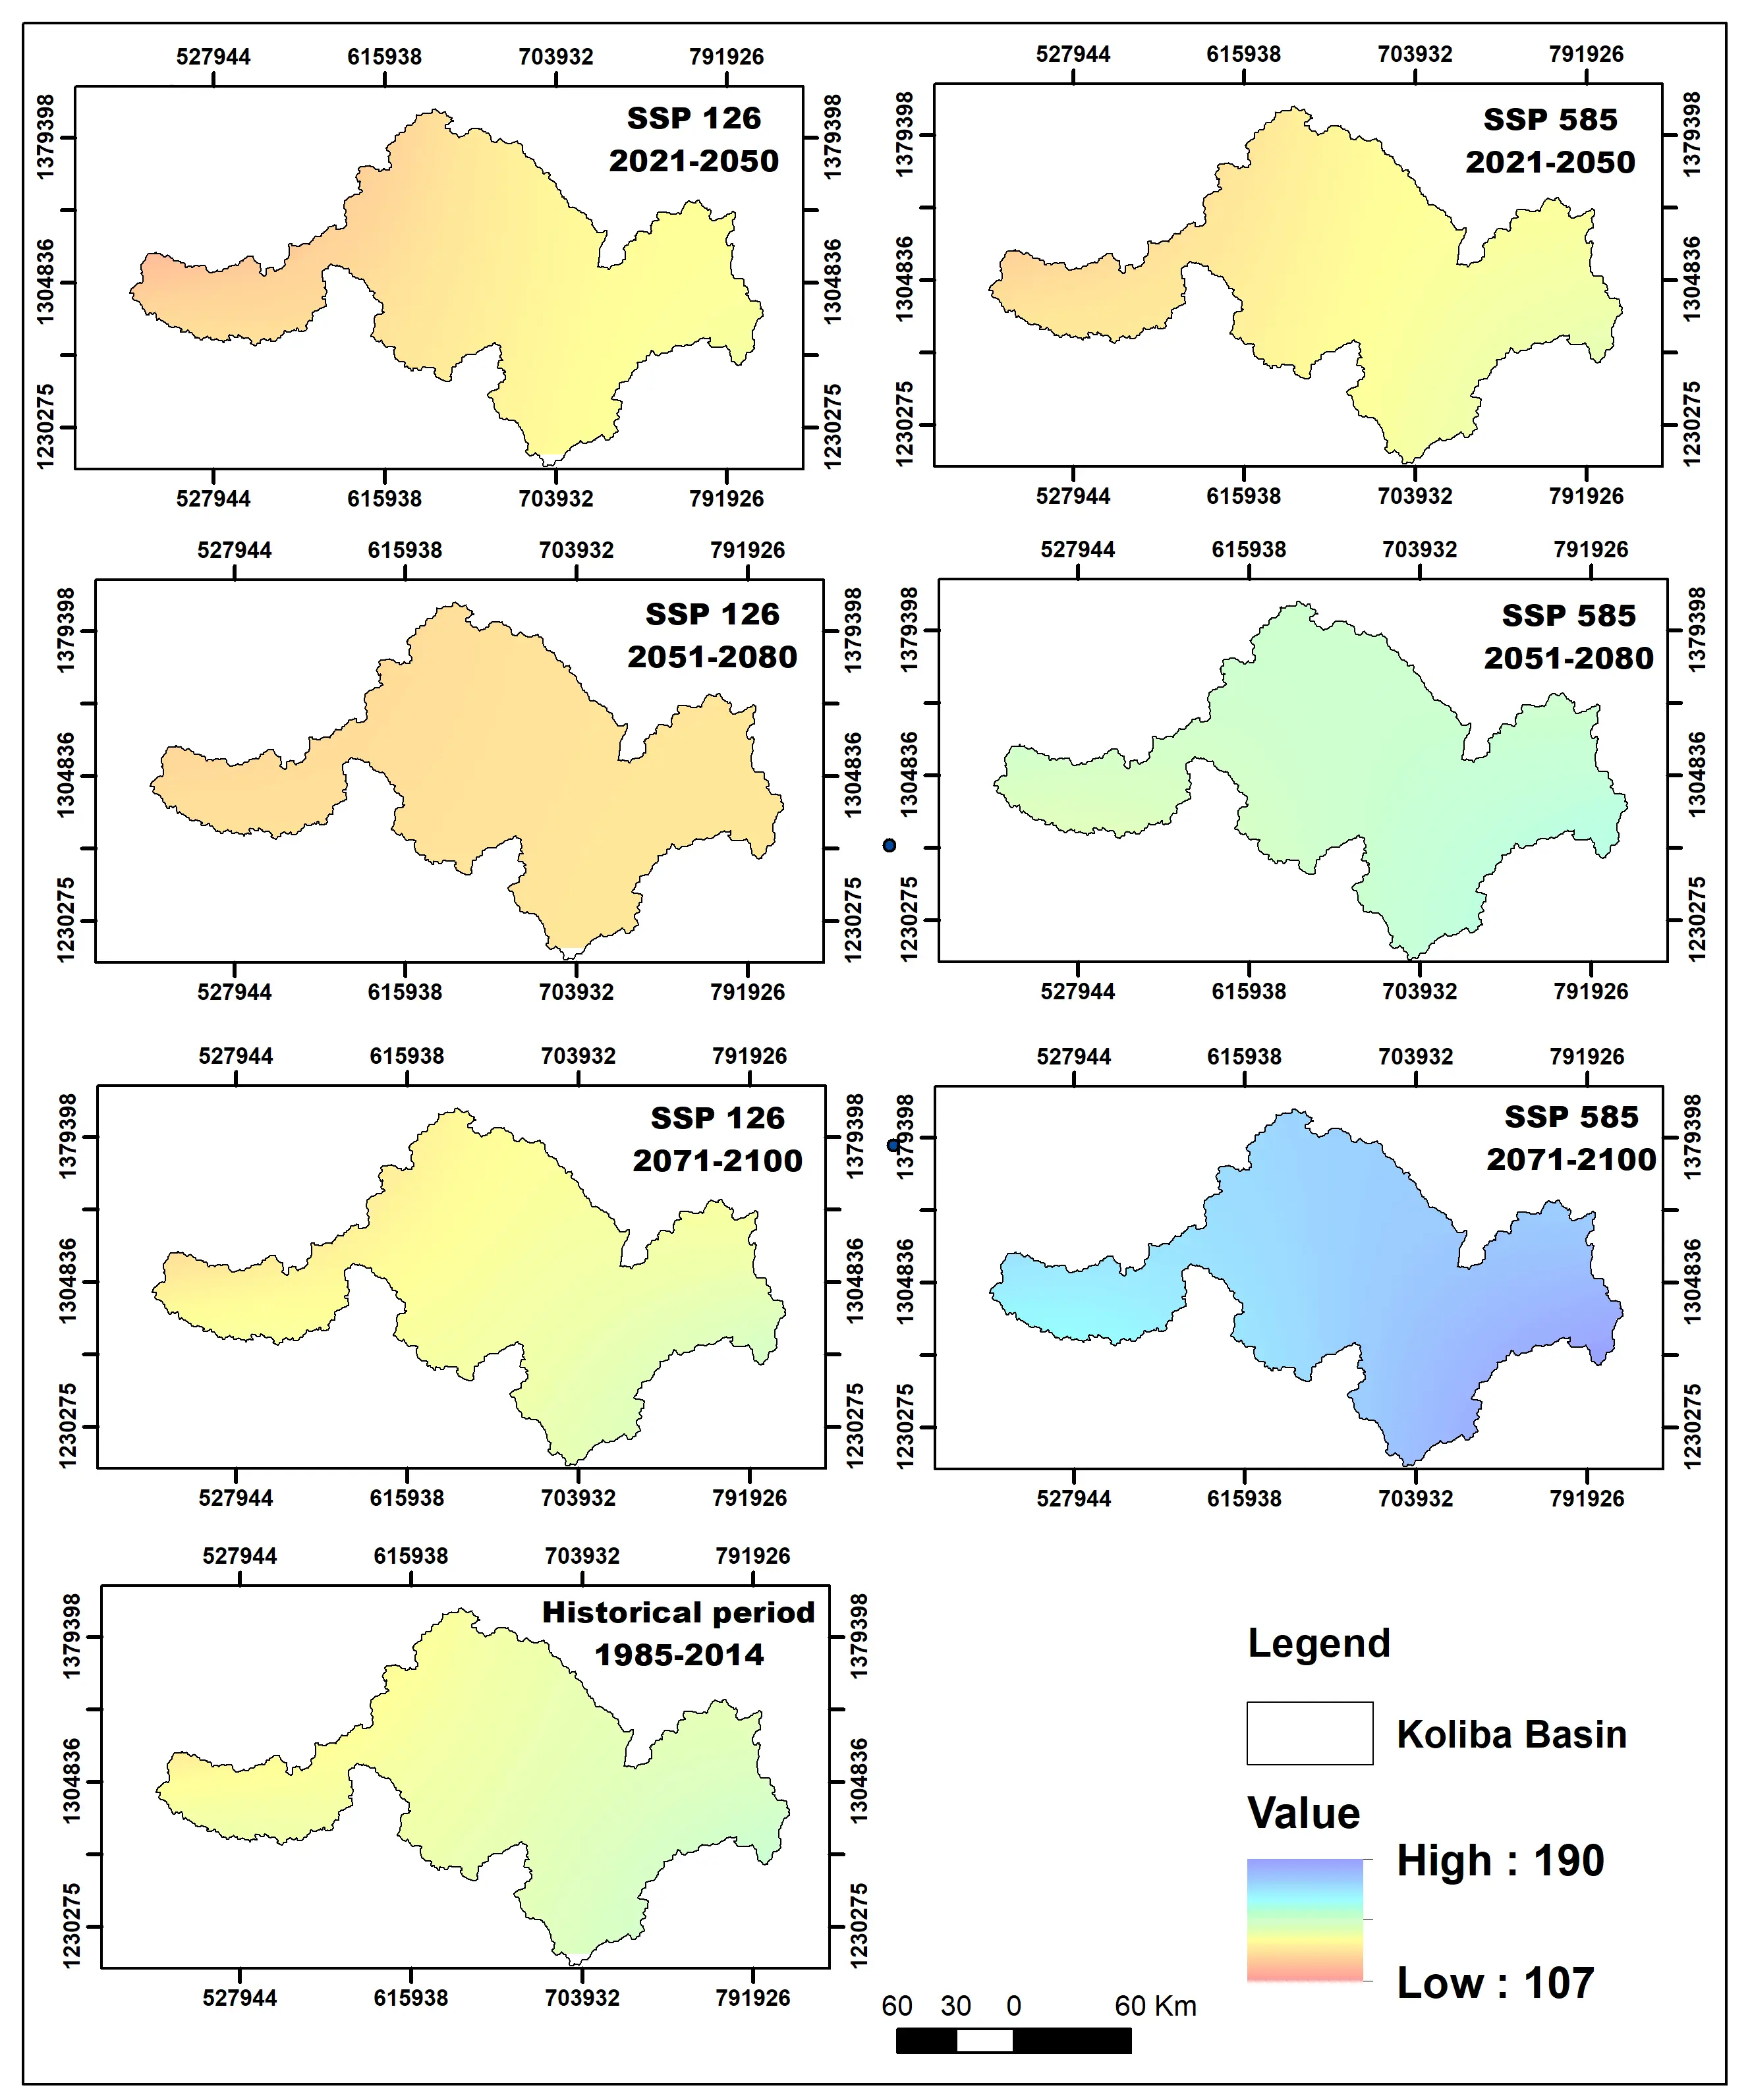
Figure 5. Spatial distribution of extreme daily precipitation indices Rx5day in the Koliba-Corubal basin.
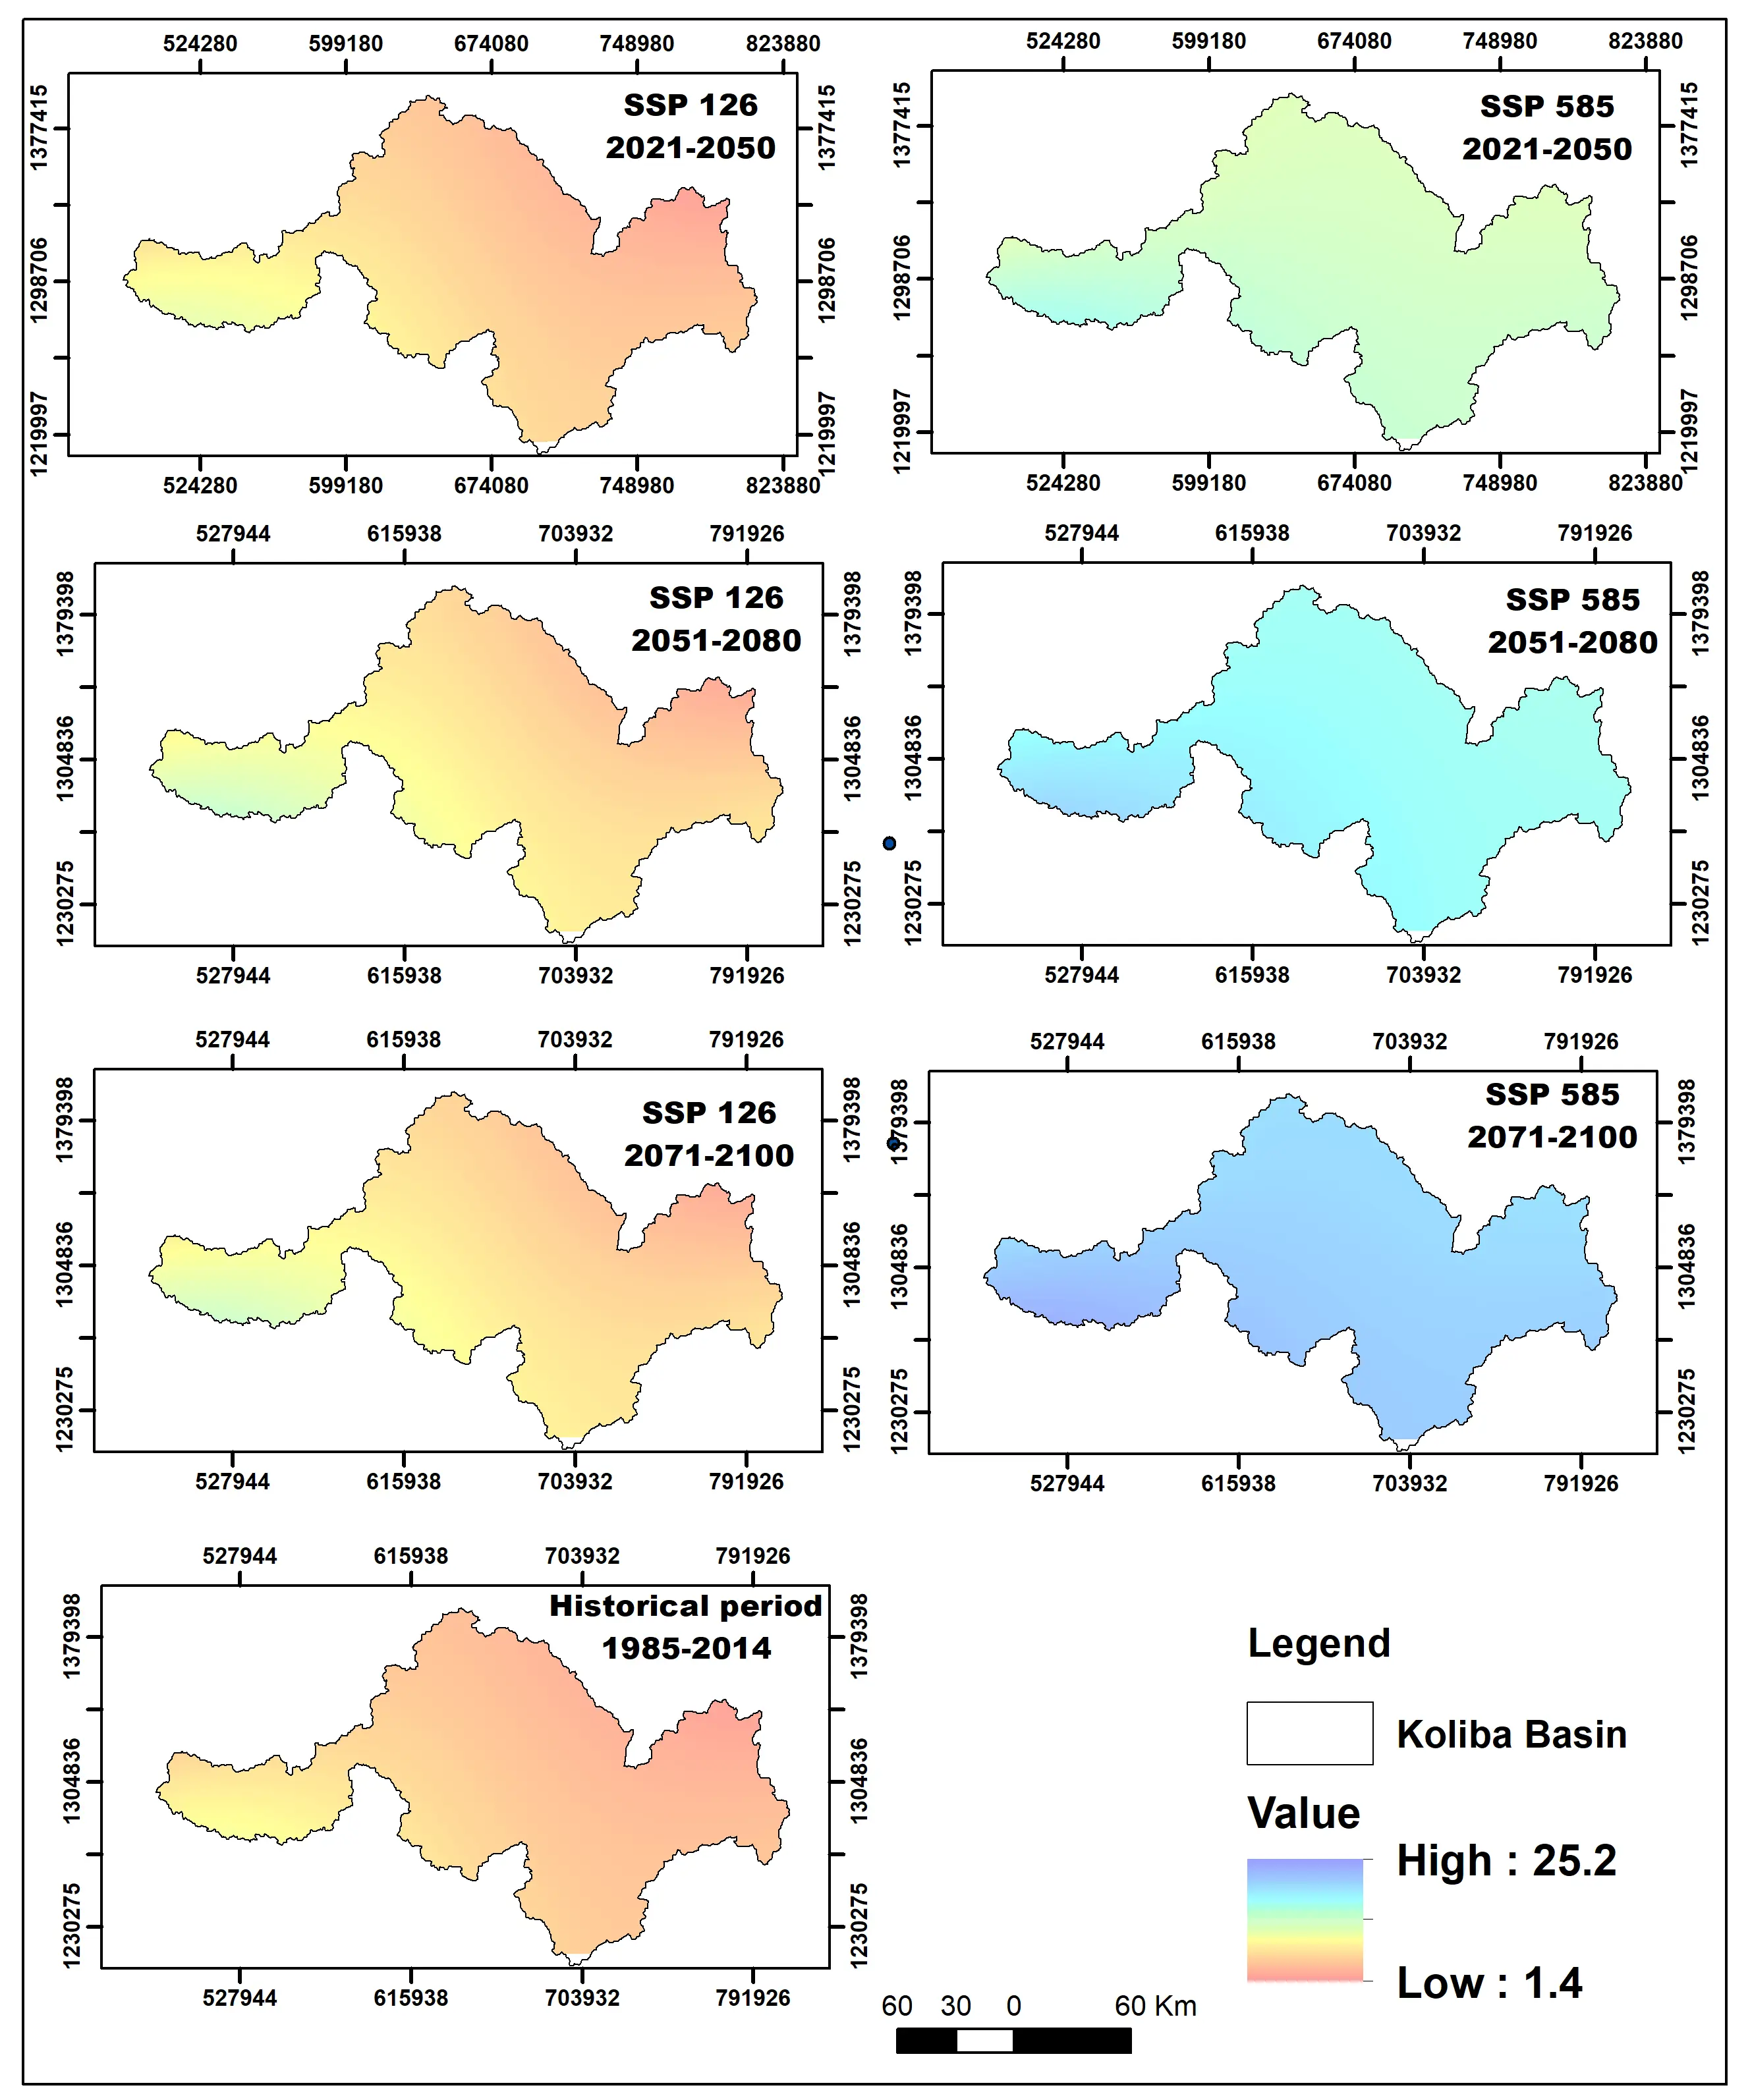
Figure 4 and Figure 5 indicate the spatial distribution of two of the extreme precipitation indices used in the scenarios considered (R20mm and Rx5day). The spatial evolution is almost identical and follows the same direction (northeast to southwest) for these two indices, throughout the area, and for both scenarios.
A general trend toward increased extreme precipitation indices is observed, particularly under SSP5-8.5, which indicates higher rainfall at the end of the century. Mountainous areas in the center of the basin appear to be the most affected by this increase, likely due to their elevated topography, which enhances orographic rainfall, and their proximity to the monsoon dynamics, which intensify precipitation in these regions during the rainy season. These changes are particularly pronounced in the 2071–2100 period, suggesting an increased risk of extreme weather events. The maps show marked spatial variation, with higher precipitation values in some areas, reflecting climate change projections. The phenomenon of extreme precipitation appears more pronounced in the SSP5-8.5 scenarios, suggesting a significant climatic impact across the different time periods studied.
4.2. Daily Variability of Future Temperatures in the Basins
Based on future data from the SSP1-2.6 and SSP5-8.5 scenarios, a set of extreme temperature indices was calculated. These include TN90p (Annual percentage of days where TN > 90th percentile), TNx (Annual maximum value of daily minimum temperatures), TX90p (Annual percentage of days where TX > 90th percentile), and TXx (Annual maximum value of daily maximum temperatures).
Due to the model’s long temporal projection range, which facilitates analysis, we divided the future projection period into three 30-year intervals starting from 2021: 2021–2050 (horizon 2050), 2051–2080 (horizon 2080), and 2081–2100 (horizon 2100). Observational precipitation data from 1985 to 2014 were used as the reference period to facilitate the analysis of the distribution of the four temperature indices in the Koliba-Corubal basin across different future periods relative to the baseline period (Table 5, Table 6 and Table 7).
Table 5. Average annual values of the four extreme temperature indices selected over the reference period and the future period in the Koliba-Corubal basin.
|
SSP1-2.6 |
TN90p (%) |
TNx (°C) |
TX90p (%) |
TXx (°C) |
|---|---|---|---|---|
|
1985–2014 |
10.6 |
25.8 |
10.5 |
38.2 |
|
2021–2100 |
10.8 |
29.2 |
10.6 |
38.7 |
|
2021–2050 |
9.5 |
29.2 |
7.2 |
38.6 |
|
2051–2080 |
13.7 |
29.2 |
11.0 |
38.7 |
|
2071–2100 |
10.8 |
29.3 |
16.0 |
39.0 |
|
SSP5-8.5 |
TN90p (%) |
TNx (°C) |
TX90p (%) |
TXx (°C) |
|
1985–2014 |
10.6 |
25.8 |
10.5 |
38.2 |
|
2021–2100 |
11.1 |
27.5 |
11.0 |
39.7 |
|
2021–2050 |
0.09 |
26.41 |
0.09 |
38.71 |
|
2051–2080 |
2.89 |
27.68 |
4.78 |
39.82 |
|
2071–2100 |
28.7 |
28.6 |
27.6 |
40.8 |
Table 6. Percentage change in the four selected extreme temperature indices for the future period compared to the reference period in the Koliba-Corubal basin.
|
SSP1-2.6 |
TN90p (%) |
TNx (°C) |
TX90p (%) |
TXx (°C) |
|---|---|---|---|---|
|
2021–2100 |
1.21 |
3.38 |
0.85 |
0.49 |
|
2021–2050 |
−10.4 |
3.37 |
−32.0 |
0.35 |
|
2051–2080 |
29.00 |
3.40 |
4.9 |
0.49 |
|
2071–2100 |
1.3 |
3.49 |
51.7 |
0.75 |
|
SSP5-8.5 |
TN90p (%) |
TNx (°C) |
TX90p (%) |
TXx (°C) |
|
2021–2100 |
4.0 |
1.67 |
4.9 |
1.49 |
|
2021–2050 |
−99.2 |
0.58 |
−99.1 |
0.49 |
|
2051–2080 |
−72.8 |
1.85 |
−54.5 |
1.60 |
|
2071–2100 |
169.7 |
2.76 |
161.9 |
2.57 |
The temperature increase in the Koliba-Corubal basin shows similar trends for both scenarios (SSP1-2.6 and SSP5-8.5) over the period 2021–2100. The TN90p, TNx, TX90p, and TXx indices all show an increase compared to the reference period (1985–2014). For example, under the SSP1-2.6 scenario, the TN90p index rises from 10.6% (1985–2014) to 10.8% (2021–2100), an increase of 1.21%. The TNx index, meanwhile, increases by 3.38 °C. Under the SSP5-8.5 scenario, the increase is also significant, but more pronounced, with rises of 4.0% for TN90p and 1.67 °C for TNx.
The 2051–2080 sub-period in both scenarios also shows a significant increase, particularly for the TN90p index, which experiences an impressive rise of 29.0% under SSP1-2.6, and 169.7% under SSP5-8.5 by the end of the century (2071–2100). This demonstrates a heightened emphasis on extreme temperatures in the coming decades, especially for the minimum and maximum temperature indices (TN90p, TX90p) (Table 5, Table 6 and Table 7, Figure 6 and Figure 7).
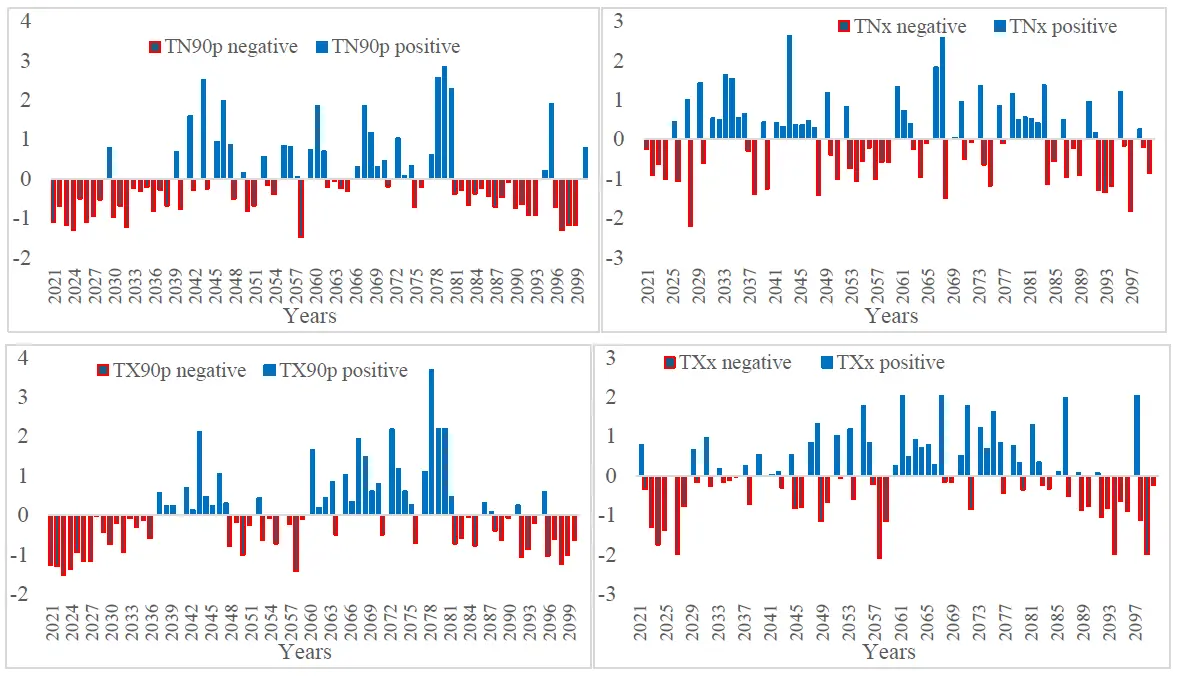
Figure 6. Evolution of the four extreme temperature indices retained for the future period according to the SSP1-2.6 scenario in the Koliba-Corubal basin.
In relation to the Mann-Kendall test (Table 7), we observe changes in extreme temperature indices in the Koliba-Corubal basin under the SSP1-2.6 and SSP5-8.5 scenarios, showing a general upward trend. Under the SSP1-2.6 scenario, the TN90p, TX90p, and TXx indices show significant increases, particularly for TX90p, with a Kendall tau reaching 0.132 and a Sen slope of 0.040. This change remains relatively small for the TN90p and TXx indices, but is still positive, suggesting a trend toward higher temperatures.
Under the SSP5-8.5 scenario, the trend intensifies, with higher values for the TN90p and TX90p indices, notably a Kendall Tau of 0.839 for TN90p, and p-values equal to 0.0, indicating highly significant results.
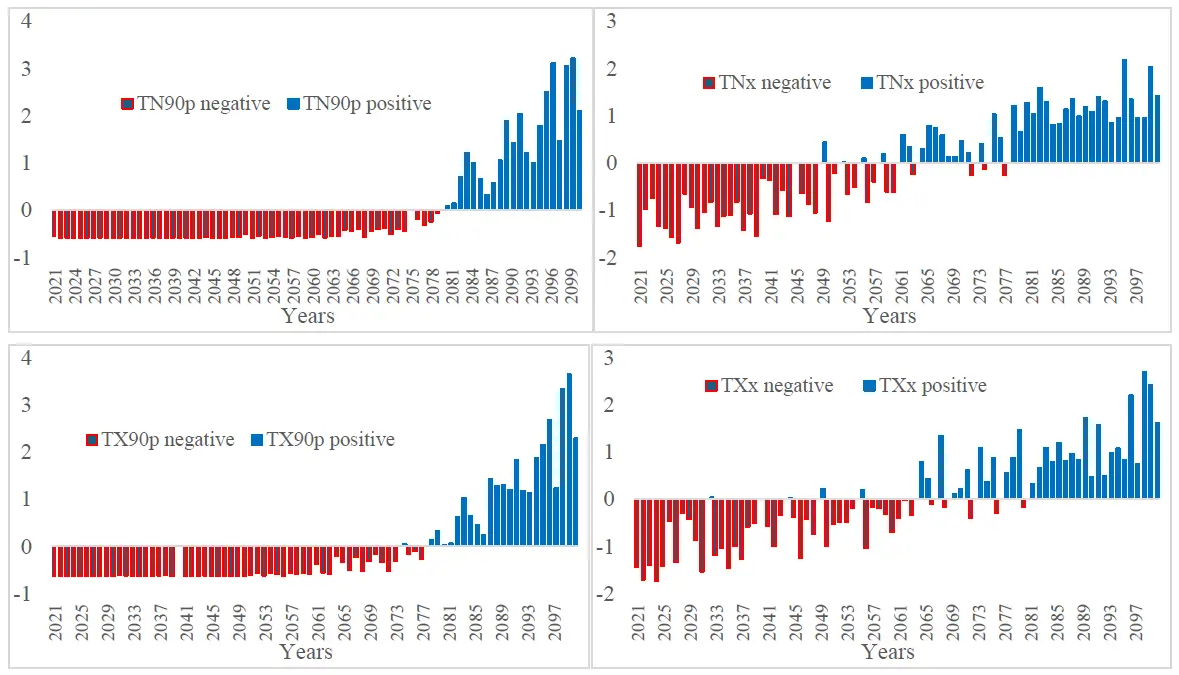
Figure 7. Evolution of the four extreme temperature indices retained for the future period according to the SSP5-8.5 scenario in the Koliba-Corubal basin.
Table 7. Average annual changes in the four selected extreme temperature indices for the future period, based on the Mann-Kendall test in the Koliba-Corubal basin.
|
SSP1-2.6 |
TN90p |
TNx |
TX90p |
TXx |
|---|---|---|---|---|
|
Kendall’s Tau |
0.072 |
−0.056 |
0.132 |
0.013 |
|
p-value |
0.346 |
0.465 |
0.083 |
0.861 |
|
Sen slope |
0.021 |
−0.001 |
0.040 |
0.000 |
|
SSP5-8.5 |
TN90p |
TNx |
TX90p |
TXx |
|
Kendall’s Tau |
0.806 |
0.717 |
0.839 |
0.691 |
|
p-value |
0.000 |
0.000 |
0.000 |
0.000 |
|
Sen slope |
0.453 |
0.043 |
0.426 |
0.042 |
Figure 8 and Figure 9 show the spatiotemporal variability of two extreme temperature indices (TNx and TXx) over the entire future period (2021–2100). The spatial distribution varies simultaneously with the extremes for each scenario used (SSP1-2.6 and SSP5-8.5) in the basin. The extreme temperature indices used are less severe in the SSP1-2.6 scenario than in the SSP5-8.5 climate scenario.
A trend towards increasing minimum and maximum temperatures is observed in future projections, particularly between 2051–2080 and 2071–2100 for both SSP scenarios. The areas most affected are located in the central and eastern regions of the basin, with TNx values reaching 44.3 °C. Compared to the historical period, these increases indicate significant global warming.
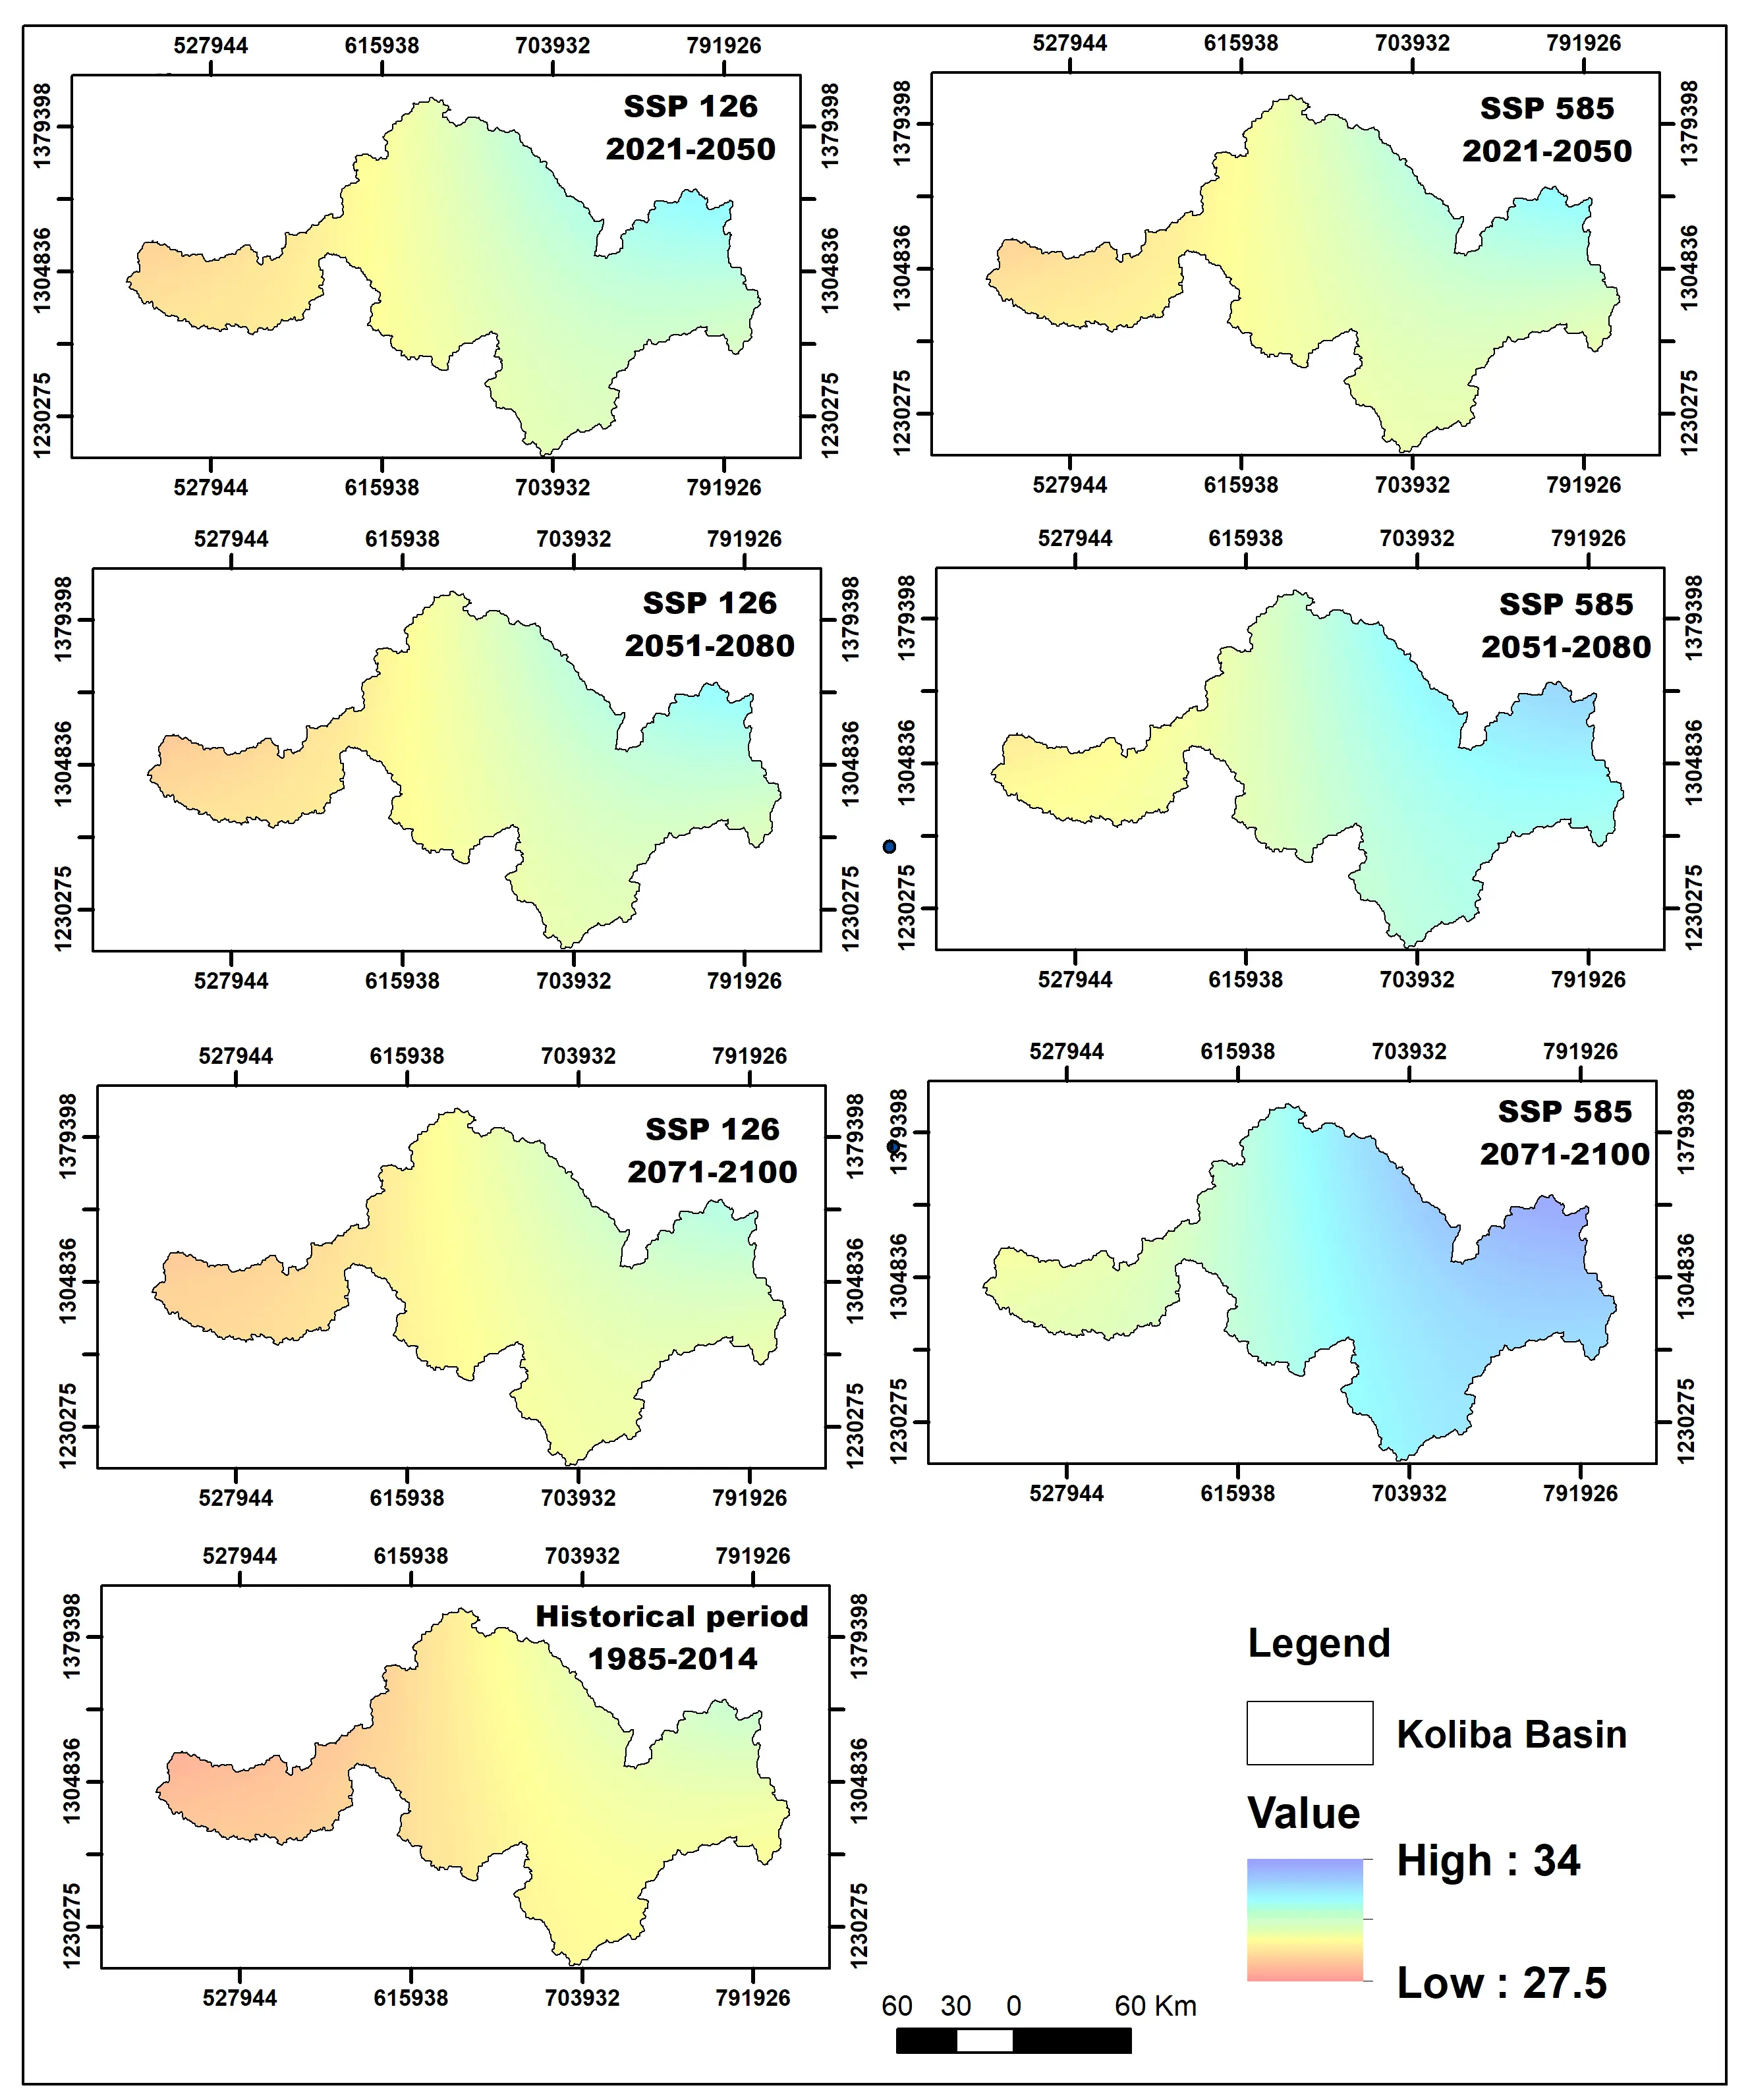
Figure 8. Spatial distribution of extreme daily temperature indices (TNx) in the Koliba-Corubal basin.
However, for the TNx index, the spatial evolution remains almost identical across both basins and both climate scenarios. As for the spatial variation of TX90p (%), it remains low in the SSP1-2.6 scenario and slightly higher in the SSP5-8.5 scenario in both basins. The spatial evolution of TXx (°C) is almost identical in both basins and across all climate scenarios considered.
Future changes in rainfall are primarily influenced by temperature in addition to general atmospheric humidification, and studies have shown that rainfall in Africa is highly sensitive to global warming and that rising temperatures lead to changes in rainfall levels [35,36].
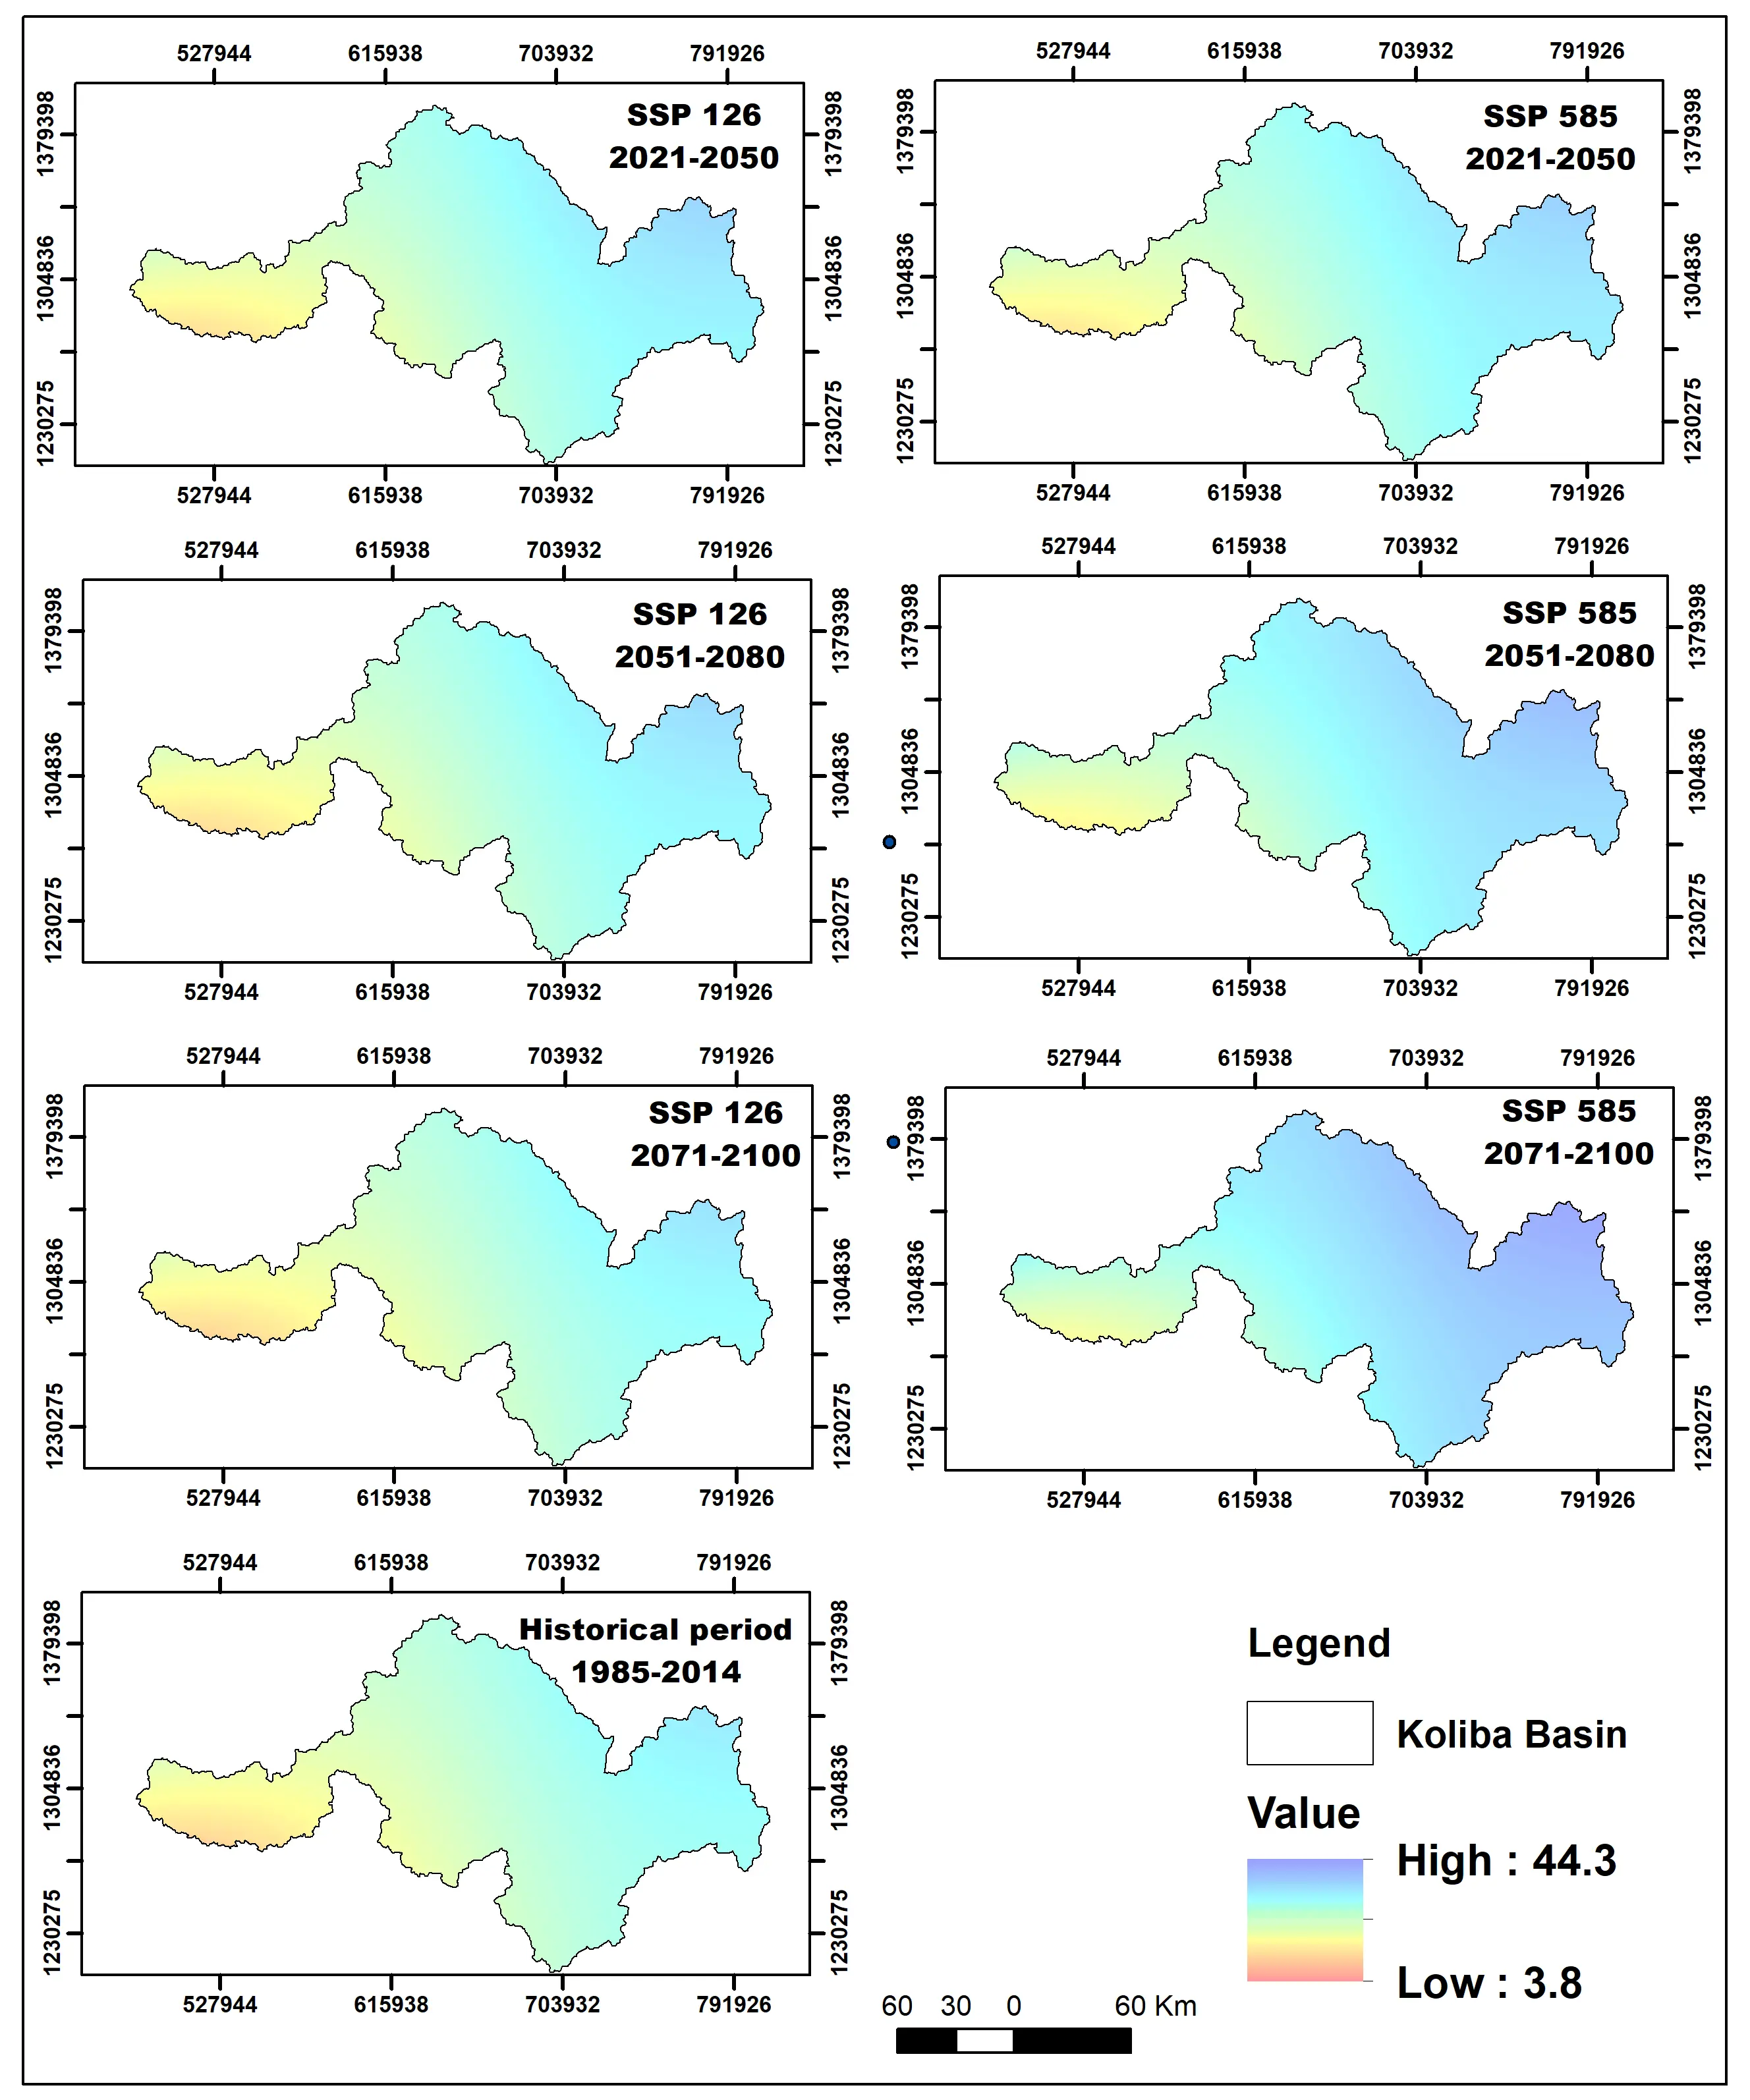
Figure 9. Spatial distribution of extreme daily temperature indices TXx in the Koliba-Corubal basin.
4.3. General Characteristics of Precipitation and Temperatures on an Annual Scale in the Basin
Table 8 provides statistical data on temperature and precipitation for three different scenarios (SSP126, SSP370, and SSP585) in the Koliba-Corubal basin.
-
-
Temperature Data: The minimum, average, and maximum temperatures all increase as the emissions scenario becomes more extreme (from SSP126 to SSP585). Minimum temperatures range from 21.6 °C to 25.8 °C, average temperatures range from 26.5 °C to 30.7 °C, and maximum temperatures range from 32.5 °C to 36.8 °C. Notably, skewness and kurtosis values indicate a slight shift toward higher temperatures, with the distribution becoming more concentrated in SSP370 and SSP585.
-
-
Precipitation Data: Precipitation decreases from 1693 mm in SSP126 to 1529 mm in SSP370, with a slight increase in SSP585 to 1535 mm. The standard deviation indicates variability, with SSP370 showing the highest spread in precipitation values.
These statistics underscore the impact of different greenhouse gas emission scenarios on both temperature and precipitation patterns in the basin.
Table 8. Statistics on precipitation and temperatures were used according to different scenarios in the Koliba-Corubal basin.
|
Parameters |
Scenarios |
Count |
Mean |
Std |
Min |
25% |
50% |
75% |
Max |
Skewness |
Kurtosis |
|---|---|---|---|---|---|---|---|---|---|---|---|
|
Minimum temperature |
SSP 126 |
87 |
22.4 |
0.2 |
21.6 |
22.3 |
22.4 |
22.6 |
23.0 |
−0.7 |
1.7 |
|
SSP 370 |
87 |
23.6 |
1.0 |
21.6 |
22.8 |
23.7 |
24.4 |
25.4 |
0.0 |
−1.0 |
|
|
SSP 585 |
87 |
23.6 |
1.2 |
21.8 |
22.6 |
23.3 |
24.5 |
25.8 |
0.3 |
−1.2 |
|
|
Average temperature |
SSP 126 |
87 |
27.4 |
0.2 |
26.5 |
27.3 |
27.4 |
27.5 |
28.0 |
−0.8 |
2.5 |
|
SSP 370 |
87 |
28.3 |
1.0 |
26.6 |
27.6 |
28.3 |
29.1 |
30.2 |
0.1 |
−1.0 |
|
|
SSP 585 |
87 |
28.4 |
1.1 |
26.7 |
27.4 |
28.2 |
29.3 |
30.7 |
0.3 |
−1.2 |
|
|
Miaximum temperature |
SSP 126 |
87 |
33.4 |
0.3 |
32.5 |
33.2 |
33.4 |
33.5 |
34.0 |
−0.7 |
1.5 |
|
SSP 370 |
87 |
34.1 |
1.0 |
32.6 |
33.2 |
34.0 |
34.9 |
36.1 |
0.3 |
−1.1 |
|
|
SSP 585 |
87 |
34.3 |
1.1 |
32.6 |
33.4 |
34.1 |
35.3 |
36.8 |
0.3 |
−1.1 |
|
|
Precipitation |
SSP 126 |
87 |
1693 |
143 |
1414 |
1604 |
1686 |
1783 |
2032 |
0.3 |
−0.3 |
|
SSP 370 |
87 |
1529 |
168 |
1039 |
1413 |
1529 |
1645 |
1970 |
−0.1 |
0.2 |
|
|
SSP 585 |
87 |
1535 |
169 |
1147 |
1419 |
1507 |
1628 |
1996 |
0.5 |
0.3 |
Analysis of future rainfall trends in the Koliba Corubal basin, according to the three scenarios SSP126, SSP370, and SSP585, shows variation over time and space. Future changes in rainfall (%) over the near, medium, and far horizons relative to the reference period (1985–2014) for SSP126, SSP370, and SSP585 are recorded in Table 9 and Table 10.
The Table 9 shows the future changes in annual rainfall (in %) over three periods (2021–2050, 2051–2080, and 2071–2100) under three scenarios (SSP126, SSP370, and SSP585) in the Koliba-Corubal basin.
-
-
SSP126 shows a slight increase in rainfall by 2.16% in 2021–2050, 1.84% in 2051–2080, and a larger increase of 4.57% by 2071–2100, with a cumulative 3.27% increase over the entire period (2021–2100).
-
-
SSP370 and SSP585 indicate a decline in rainfall, especially in the later periods. SSP370 shows a 7.98% decrease over 2021–2100, while SSP585 shows a 7.2% decrease, with substantial reductions in the mid-century periods (2051–2080).
This reflects the varying impacts of different emission scenarios on rainfall in the basin.
Table 9. Future changes in annual rainfall (in %) over three future periods according to the SSP126, SSP370, and SSP585 scenarios in the Koliba Corubal basin.
|
Rmm |
1985–2014 |
2021–2050 |
Variation |
2051–2080 |
Variation |
2071–2100 |
Variation |
2021–2100 |
Variation |
|---|---|---|---|---|---|---|---|---|---|
|
SSP 126 |
1643 |
1678 |
2.16 |
1673 |
1.84 |
1718 |
4.57 |
1697 |
3.27 |
|
SSP 370 |
1643 |
1628 |
−0.89 |
1497 |
−8.9 |
1399 |
−14.8 |
1512 |
−7.98 |
|
SSP 585 |
1643 |
1636 |
−0.40 |
1478 |
−10.03 |
1455 |
−11.4 |
1525 |
−7.2 |
Table 10. Future annual temperature changes (in °C) over three future periods according to the SSP126, SSP370, and SSP585 scenarios in the Koliba Corubal basin.
|
TM |
1985–2014 |
2021–2050 |
Variation |
2051–2080 |
Variation |
2071–2100 |
Variation |
2021–2100 |
Variation |
|---|---|---|---|---|---|---|---|---|---|
|
SSP 126 |
26.6 |
27.3 |
0.76 |
27.5 |
0.90 |
27.4 |
0.83 |
27.4 |
0.81 |
|
SSP 370 |
26.6 |
27.5 |
0.91 |
28.7 |
2.07 |
29.4 |
2.84 |
28.5 |
1.88 |
|
SSP 585 |
26.6 |
27.4 |
0.86 |
28.7 |
2.09 |
29.7 |
3.12 |
28.5 |
1.96 |
|
TN |
1985–2014 |
2021–2050 |
Variation |
2051–2080 |
Variation |
2071–2100 |
Variation |
2021–2100 |
Variation |
|
SSP 126 |
21.7 |
22.4 |
0.74 |
22.5 |
0.85 |
22.5 |
0.78 |
22.5 |
0.77 |
|
SSP 370 |
21.7 |
22.8 |
1.08 |
24.0 |
2.27 |
24.7 |
3.00 |
23.7 |
2.06 |
|
SSP 585 |
21.7 |
22.6 |
0.91 |
23.9 |
2.17 |
24.9 |
3.26 |
23.7 |
2.04 |
|
TX |
1985–2014 |
2021–2050 |
Variation |
2051–2080 |
Variation |
2071–2100 |
Variation |
2021–2100 |
Variation |
|
SSP 126 |
32.5 |
33.3 |
0.80 |
33.5 |
1.02 |
33.5 |
0.94 |
33.4 |
0.90 |
|
SSP 370 |
32.5 |
33.2 |
0.70 |
34.4 |
1.86 |
35.2 |
2.70 |
34.2 |
1.69 |
|
SSP 585 |
32.5 |
33.4 |
0.86 |
34.6 |
2.09 |
35.6 |
3.11 |
34.5 |
1.96 |
Table 10 presents the future annual temperature changes (in °C) over three future periods (2021–2050, 2051–2080, and 2071–2100) under three emission scenarios (SSP126, SSP370, and SSP585) in the Koliba-Corubal basin.
-
-
Mean Temperature (TM): Under the SSP126 scenario, the mean temperature increases by 0.76 °C by 2021–2050 and reaches a total of 0.81 °C by 2021–2100. For SSP370 and SSP585, the increases are more pronounced, with SSP370 showing an increase of 1.88 °C by 2021–2100 and SSP585 a 1.96 °C increase.
-
-
Minimum Temperature (TN): Minimum temperatures also rise, with SSP126 showing a steady increase of 0.77 °C by 2021–2100. SSP370 and SSP585 show more significant increases, with SSP370 rising by 2.06 °C, and SSP585 by 2.04 °C by the end of the century.
-
-
Maximum Temperature (TX): Maximum temperatures show similar trends, with SSP126 showing a modest increase of 0.90 °C by 2021–2100. SSP370 and SSP585 show a stronger increase in maximum temperatures, with SSP370 reaching 1.69 °C and SSP585 1.96 °C by the century’s end.
This data illustrates a consistent upward trend in temperatures, with the most significant increases projected under higher emission scenarios.
Table 8 and Table 10 clearly show a trend of increasing temperatures and variability in precipitation in the Koliba-Corubal basin under different emission scenarios (SSP126, SSP370, SSP585). Minimum, average, and maximum temperatures rise significantly, especially under the SSP370 and SSP585 scenarios, with increases of up to 3.12 °C by 2100. In contrast, precipitation generally decreases, particularly under SSP370 and SSP585, with reductions of up to 14.8%. These results highlight the growing impact of climate change on the basin, including increased risks of extreme events and challenges to water resources and ecosystems.
The limitations of climate trend analysis methods include several factors. Data quality and completeness are crucial, as missing or erroneous data can introduce biases. Model uncertainty, particularly in those projecting future extremes (such as CMIP6), leads to variations across models and projections. The spatial and temporal resolution of models, often too coarse, can overlook important local variations. Statistical methods like the Mann-Kendall test assume data stationarity, which may not hold true under climate change scenarios. Finally, the choice of emission scenarios (e.g., SSP1-2.6 vs. SSP5-8.5) strongly influences study outcomes, and uncertainty in future emissions introduces variations in projections of climate extremes.
5. Discussion
The results obtained on the future variability of extreme rainfall and temperature indices in the Koliba-Corubal basin reveal contrasting trends depending on the scenarios and time horizons considered. The widespread decrease in extreme rainfall indices under the SSP1-2.6 and SSP5-8.5 scenarios, particularly marked for R99p (−45.4% under SSP1-2.6) and Rx3day (−42.0% under SSP1-2.6), is consistent with work carried out in West Africa. Faye and Akinsanola [7] had already highlighted the ability of CMIP6 models to reproduce extreme indices in the region, while noting significant biases in the representation of the West African monsoon. Our results also corroborate the projections of Ilori and Adeyewa [8], which predict a significant change in the regime of extreme rainfall in West Africa, with marked spatial contrasts between sub-regions.
Analysis of temporal trends reveals a non-linear evolution of the indices, with a decrease at the beginning of the period followed by a rise towards the end of the century, particularly visible under the SSP5-8.5 scenario. This complex dynamic has been documented by Saley and Salack [17], who show that intense rainfall events in the Sahel and West Africa could increase in frequency despite a decrease in annual rainfall totals in some areas. This apparent contradiction is explained by an increased concentration of rainfall over shorter periods, as suggested by the work of Saley et al. [20] on future projections of rainfall extremes.
The Mann-Kendall test applied to future series reveals significant trends for several indices, particularly under the SSP5-8.5 scenario, where R99p exhibits a Kendall tau of 0.244 (p = 0.002). These results are consistent with the analyses of Vicente-Serrano et al. [16], who assessed the ability of CMIP models to capture observed precipitation trends. However, as Niu et al. [15] point out, the uncertainty associated with the projections remains substantial, justifying the multi-model approach adopted in this study.
Regarding extreme temperatures, the projected increases in the TN90p, TNx, TX90p, and TXx indices confirm the regional trends documented by Iyakaremye et al. [9] of the intensification of extreme heat events in Africa. Under the SSP5-8.5 scenario, the TN90p index registers a dramatic increase of 169.7% by 2071–2100, reflecting a significant rise in hot nights. This development is consistent with the projections of Dajuma et al. [23], which predict an expansion of the hottest climatic zones on the African continent during the 21st century. Chinasho et al. [22] also documented similar trends in southern Ethiopia, confirming the widespread warming of minimum and maximum temperatures in Africa.
We acknowledge that the climate projections used in our study show an intensification of precipitation extremes, but these trends are not necessarily uniform across the globe. For example, the study by Koutsoyiannis et al. [37] on Greece shows a lack of significant trends over more than 100 years for annual precipitation and maximum rainfall. This highlights the complexity of local climate dynamics, which can diverge from global projections. Thus, while our results indicate trends of intensifying extremes for the Koliba-Corubal basin region, it is crucial to consider local specificities and the uncertainties associated with climate models.
Divergent behaviors across the extreme climate indices, such as the decreasing trend in the Rx3day but an increasing trend in CWD, are observed in the Koliba-Corubal basin. However, these trends are not explained mechanistically in the current study. The complexity of regional climate dynamics, which involves both atmospheric and land surface interactions, may contribute to such inconsistencies. Further research is needed to understand better the underlying processes driving these contrasting trends and how they interact to shape future climate impacts in the basin.
When comparing the results of this study with previous research on similar West African basins, such as the Casamance and Kayanga basins [38], the Aga-Foua-Djilas basin [39], and the Gambia River basin [40], several key similarities and differences emerge. Similar to our findings in the Koliba-Corubal basin, these studies indicate significant temperature increases, particularly under high-emission scenarios, and shifts in precipitation patterns, including the intensification of extremes. However, while our study shows a decrease in extreme precipitation indices such as Rx3day, studies of the Casamance and Gambia basins reveal more complex behaviors, with regional variations in drought and runoff patterns. These comparisons underscore the need for further regional analysis to understand better the diverse impacts of climate change across West Africa.
The spatial mapping of the indices reveals marked heterogeneity, with higher values in the mountainous areas of the basin’s center. This spatial distribution, which persists across different time horizons, suggests a continued topographic influence on local climatic regimes. Sambou et al. [18] had already noted the importance of altitudinal gradients in the hydro-pluviometric variability of the Koliba-Corubal basin, a characteristic that our future projections appear to confirm.
The implications of these changes for water resources are considerable. Sadio [26] showed, in similar West African watershed contexts, that altered extreme weather patterns result in disrupted flows and increased vulnerability of hydrological systems. Rameshwaran et al. [12] project significant changes in West African river flows, with potential consequences for water availability for populations and ecosystems. In the Koliba-Corubal transboundary basin, where the river is the main freshwater resource for Guinea-Bissau [19], these developments warrant particular attention.
In terms of public policy, our results align with the recommendations of Neglo [24] regarding the need to integrate climate projections into development planning in West Africa. Hansen et al. [25] also emphasize the importance of developing climate risk management tools adapted to local realities, particularly in the agricultural and pastoral sectors, which remain highly dependent on rainfall patterns. The work of Abubakar et al. [29] on the impact of climate change on millet yields in Niger provides a concrete illustration of the food security challenges linked to the evolution of climate extremes.
Finally, the comparison between the two scenarios, SSP1-2.6 and SSP5-8.5 highlights the crucial role of future socio-economic choices in determining the magnitude of projected changes. As Dogiso et al. [28] emphasize in their analysis of climate extremes in Ethiopia, development trajectories and greenhouse gas emission mitigation policies will have a major impact on the future exposure of populations to climate hazards. This dimension underscores the importance of coordinated action at the local, national, and international levels to limit warming and adapt territories to inevitable changes.
6. Conclusions
Analysis of future daily variability in precipitation and temperature in the Koliba-Corubal watershed, based on CMIP6 projections under the SSP1-2.6 and SSP5-8.5 scenarios, reveals several key findings. The results show a general decrease in extreme precipitation indices, with reductions ranging from −20% to −45% depending on the index and scenario, reflecting a potential reduction in rainfall totals and the intensity of rainfall events. Concurrently, extreme temperature indices show significant increases, particularly marked under the highest emissivity scenario, where the percentage of warm nights (TN90p) increases by nearly 170% by 2071–2100.
Spatial analysis reveals significant heterogeneity in the distribution of projected changes, with the mountainous areas in the center of the basin appearing most vulnerable to the intensification of extreme temperatures and altered rainfall patterns. Mann-Kendall trend tests confirm the significance of these changes, particularly under the SSP5-8.5 scenario, highlighting the importance of future socio-economic choices in determining the magnitude of climate change.
These results have important implications for water resource management in this transboundary basin, where the Koliba-Corubal River is the main source of fresh water for the riparian populations. The projected changes in extreme weather patterns could have a lasting impact on water availability, agricultural productivity, and food security, calling for proactive adaptation of development strategies.
Faced with these challenges, integrating climate projections into public policies for land-use planning and risk management is essential. Further investigations, using higher-resolution regional models and incorporating local feedback, would refine these projections and support decision-makers in developing adaptation strategies tailored to the specific realities of this West African basin.
Acknowledgments
The authors thank the Geomatics and Environment Laboratory of Assane Seck University of Ziguinchor for their material support in the production of this article.
Author Contributions
Conceptualization, C.E.W. and C.F.; Methodology, C.E.W. and C.F.; Software, C.E.W.; Validation, C.E.W. and C.F.; Formal Analysis, C.E.W.; Investigation, C.E.W.; Resources, C.E.W.; Data Curation, C.E.W. and C.A.A.S.S.; Writing—Original Draft Preparation, C.E.W.; Writing—Review & Editing, C.F.; Visualization, C.E.W. and C.A.A.S.S.; Supervision, C.F.; Project Administration, C.A.A.S.S.
Ethics Statement
Not applicable.
Informed Consent Statement
Not applicable.
Data Availability Statement
The climate projection data used in this study are available from the ISIMIP platform (https://www.isimip.org, accessed on 20 November 2025). Derived data supporting the findings of this study are available from the corresponding author upon reasonable request.
Funding
This research received no external funding.
Declaration of Competing Interest:
The authors declare that they have no known competing financial interests or personal relationships that could have appeared to influence the work reported in this paper.
References
- Bedair H, Alghariani MS, Omar E, Anibaba QA, Remon M, Bornman C, et al. Global warming status in the African continent: Sources, challenges, policies, and future direction. Int. J. Environ. Res. 2023, 17, 45. DOI:10.1007/s41742-023-00534-w [Google Scholar]
- IPCC. Climate Change 2021: The Physical Science Basis; Contribution of Working Group I to the Sixth Assessment Report of the Intergovernmental Panel on Climate Change; Cambridge University Press: Cambridge, UK, 2021. [Google Scholar]
- Gnangouin AYJ, Kouassi AM, Diarrassouba K. Impacts du changement climatique sur les régimes climatiques futurs en Afrique de l’Ouest: Cas du bassin versant du N’zi (Bandama, Côte d’Ivoire). Bull. l’Assoc. Géographes Français 2023, 100, 92–111. DOI:10.4000/bagf.10813 [Google Scholar]
- Dione PM, Faye C, Sadio CA. Hydrological impacts of climate change (rainfall and temperature) and characterization of future drought in the Aga Foua Djilas Watershed. Indones. J. Soc. Environ. Issues (IJSEI) 2023, 4, 353–375. DOI:10.47540/ijsei.v4i3.1218 [Google Scholar]
- Ekolu J, Dieppois B, Tramblay Y, Villarini G, Slater LJ, Mahé G, et al. Variability in flood frequency in sub-Saharan Africa: The role of large-scale climate modes of variability and their future impacts. J. Hydrol. 2024, 640, 131679. DOI:10.1016/j.jhydrol.2024.131679 [Google Scholar]
- Zhang X, Alexander L, Hegerl GC, Jones P, Tank AK, Peterson TC, et al. Indices for monitoring changes in extremes based on daily temperature and precipitation data. Wiley Interdiscip. Rev. Clim. Change 2011, 2, 851–870. DOI:10.1002/wcc.147 [Google Scholar]
- Faye A, Akinsanola AA. Evaluation of extreme precipitation indices over West Africa in CMIP6 models. Clim. Dyn. 2022, 58, 925–939. DOI:10.1007/s00382-021-05942-2 [Google Scholar]
- Ilori OW, Adeyewa DZ. Projected changes in extreme rainfall events over West Africa and its sub-regions: A multi-scenario climate analysis. Meteorol. Atmos. Phys. 2025, 137, 33. DOI:10.1007/s00703-025-01081-z [Google Scholar]
- Iyakaremye V, Zeng G, Ullah I, Gahigi A, Mumo R, Ayugi B. Recent observed changes in extreme high-temperature events and associated meteorological conditions over Africa. Int. J. Climatol. 2022, 42, 4522–4537. DOI:10.1002/joc.7485 [Google Scholar]
- Sow M, Gaye D, Diakhaté MM. Caractérisation spatio-temporelle des vagues de chaleur au Sénégal sur la période 1984–2020. Ann. Géographie 2025, 761, 113–129. DOI:10.3917/ag.761.0113 [Google Scholar]
- Merem EC, Twumasi Y, Wesley J, Olagbegi D, Crisler M, Romorno C, et al. Assessing issues in water resources use within countries in West Africa. Int. J. Ecosyst. 2022, 12, 1–19. DOI:10.5923/j.ije.20221201.01 [Google Scholar]
- Rameshwaran P, Bell VA, Davies HN, Kay AL. How might climate change affect river flows across West Africa? Clim. Change 2021, 169, 21. DOI:10.1007/s10584-021-03256-0 [Google Scholar]
- Eyring V, Bony S, Meehl GA, Senior CA, Stevens B, Stouffer RJ, et al. Overview of the Coupled Model Intercomparison Project Phase 6 (CMIP6) experimental design and organization. Geosci. Model. Dev. 2016, 9, 1937–1958. DOI:10.5194/gmd-9-1937-2016 [Google Scholar]
- O’Neill BC, Kriegler E, Ebi KL, Kemp-Benedict E, Riahi K, Rothman DS, et al. The roads ahead: Narratives for shared socioeconomic pathways describing world futures in the 21st century. Glob. Environ. Change 2017, 42, 169–180. DOI:10.1016/j.gloenvcha.2015.01.004 [Google Scholar]
- Niu Q, She D, Xia J, Zhang Q, Zhang Y, Wang T. Uncertainty analysis of global meteorological drought in CMIP6 projections. Clim. Change 2025, 178, 75. DOI:10.1007/s10584-025-03919-2 [Google Scholar]
- Vicente-Serrano SM, García-Herrera R, Peña-Angulo D, Tomás-Burguera M, Domínguez-Castro F, Noguera I, et al. Do CMIP models capture long-term observed annual precipitation trends? Clim. Dyn. 2022, 58, 2825–2842. DOI:10.1007/s00382-021-06034-x [Google Scholar]
- Saley IA, Salack S. Present and future of heavy rain events in the Sahel and West Africa. Atmosphere 2023, 14, 965. DOI:10.3390/atmos14060965 [Google Scholar]
- Sambou S, Dacosta H, Diouf RN, Diouf I, Kane A. Hydropluviometric variability in non-Sahelian West Africa: Case of the Koliba/Corubal River Basin (Guinea and Guinea-Bissau). Proc. Int. Assoc. Hydrol. Sci. 2020, 383, 171–183. DOI:10.5194/piahs-383-171-2020 [Google Scholar]
- SOFRECO. Study of the Master Plan for the Integrated Development and Management of the Kayanga/Gêba and Koliba/Corubal River Basins, Water Resources and Needs and Options for Hydraulic and Hydro-Agricultural Development; SOFRECO: Paris, France, 1993; Volume 3, Annex B. [Google Scholar]
- Saley IA, Salack S, Sanda IS, Moussa MS, Bonkaney AL, Ly M, et al. The possible role of the Sahel Greenbelt on the occurrence of climate extremes over the West African Sahel. Atmos. Sci. Lett. 2019, 20, e927. DOI:10.1002/asl.927 [Google Scholar]
- Mohamed AML, Seyni S, Mkuhlani S, Chemura A, Faye B, Kadir SA, et al. Impact of climate change on millet yield under different fertilization levels in three agroecological zones of Niger Republic. PLoS ONE 2025, 20, e0333963. DOI:10.1371/journal.pone.0333963 [Google Scholar]
- Chinasho A, Bedadi B, Lemma T, Tana T, Elias B, Hordofa T. Analysis of past and future temperature variability and change in Southern Ethiopia. Int. J. Clim. Change Strateg. Manag. 2025, 17, 397–421. DOI:10.1108/IJCCSM-04-2023-0052 [Google Scholar]
- Dajuma A, Sylla MB, Tall M, Almazroui M, Yassa N, Diedhiou A, et al. Projected expansion of hottest climate zones over Africa during the mid and late 21st century. Environ. Res. Clim. 2023, 2, 025002. DOI:10.1088/2752-5295/acc08a [Google Scholar]
- Neglo A. L’intégration des mesures d’adaptation au changement climatique dans la planification du développement durable au Togo. Rev. Organ. Territ. 2023, 32, 210–221. DOI:10.1522/revueot.v32n3.1686 [Google Scholar]
- Hansen J, Trzaska S, Dinku T, Grossi A, Diop M, Huyer S, et al. La Gestion des risques climatiques pour la vulgarisation agricole et de l’élevage au Sénégal: Guide de référence; CCAFS: Wageningen, The Netherlands, 2025. [Google Scholar]
- Sadio CAAS. Caractérisation hydrologique et gestion des ressources en eau dans un contexte de variabilité et de changement climatique: Cas des bassins versants de la Casamance en amont de Kolda et de la Kayanga-Géva en amont de Wassadou. Ph.D. Thesis, Université Assane Seck de Ziguinchor, Ziguinchor, Senegal, 2024. [Google Scholar]
- Fotso-Nguemo TC, Weber T, Diedhiou A, Chouto S, Vondou DA, Rechid D, et al. Projected impact of increased global warming on heat stress and exposed population over Africa. Earth’s Future 2023, 11, e2022EF003268. DOI:10.1029/2022EF003268 [Google Scholar]
- Dogiso D, Muluneh A, Ketema A. Spatiotemporal analysis of CMIP6-based climate extremes and their implications for sustainable watershed management in the Gidabo watershed, Ethiopia. Sci. Rep. 2025, 15, 28104. DOI:10.1038/s41598-025-02408-x [Google Scholar]
- Abubakar A, Ishak MY, Uddin MK, Sulaiman Zangina A, Ahmad MH, Shehu Danhassan S. Impact of climate change and adaptations for cultivation of millets in Central Sahel. Environ. Sustain.2023, 6, 441–454. DOI:10.1007/s42398-023-00291-8 [Google Scholar]
- Zoumanigui AK. Étude de la dynamique des écosystèmes du bassin versant du Koliba (Guinea). Master’s Thesis, Université de Conakry, Conakry, Guinea, 2003. [Google Scholar]
- Dos Santos CA, Neale CMU, Rao TVR, da Silva BB. Trends in indices for extremes in daily temperature and precipitation over Utah, USA. Int. J. Climatol. 2011, 31, 1813–1822. DOI:10.1002/joc.2205 [Google Scholar]
- Bodian A. Caractérisation de la variabilité temporelle récente des précipitations annuelles au Sénégal (Afrique de l’Ouest). Physio-Géo 2014, 8, 297–312. DOI:10.4000/physio-geo.4243 [Google Scholar]
- An W, Liu X, Leavitt SW, Xu G, Zeng X, Wang W, et al. Relative humidity history on the Batang–Litang Plateau of western China since 1755 reconstructed from tree-ring δ18O and δD. Clim. Dyn. 2014, 42, 2639–2654. DOI:10.1007/s00382-013-1937-z [Google Scholar]
- Zhang R, Li Y, Chen M, Zheng H, Zhao J, Li S, et al. Benchmarking Spatial Interpolation Methods for Long-Term Meteorological Exposure Assessment in China: Comparing Inverse Distance Weighting and Ordinary Kriging in Climate-Health Research. Environ. Health Insights 2026, 20, 11786302261433113. DOI:10.1177/11786302261433113 [Google Scholar]
- Abiodun BJ, Mogebisa TO, Petja B, Abatan AA, Abatan AA, Roland T. Potential impacts of climate change on extreme precipitation over four African coastal cities. Clim. Change 2017, 143, 399–413. DOI:10.1007/s10584-017-2001-5 [Google Scholar]
- Dosio A, Pinto I, Lennard C, Sylla MB, Jack C, Nikulin G. What can we know about future precipitation in Africa? Robustness, significance and added value of projections from a large ensemble of regional climate models. Clim. Dyn. 2019, 53, 5833–5858. DOI: 10.1007/s00382-019-04900-3 [Google Scholar]
- Koutsoyiannis D, Iliopoulou T, Koukouvinos A, Malamos N, Mamassis N, Dimitriadis P, et al. In Search of Climate Crisis in Greece Using Hydrological Data: 404 Not Found. Water 2023, 15, 1711. DOI:10.3390/w15091711 [Google Scholar]
- Sadio CAAS, Faye C, Dione PM. Impacts of climate change on meteorological and hydrological drought in the Casamance basin in Kolda and the Kayanga basin in Wassadou. J. Mater. Environ. Sci. 2024, 15, 83–115. Available online: https://jmaterenvironsci.com/Document/vol15/vol15_N1/JMES-2024-150106-Sadio.pdf (accessed on 15 February 2026).
- Dione PM, Faye C. Future Projection of Extreme Temperature, Precipitation and Runoff Indices in the Aga-Foua-Djilas Basin (Senegal) under Global Warming. Geografický časopis/Geogr. J. 2025, 77, 115–130. DOI:10.31577/geogrcas.2025.77.3.01 [Google Scholar]
- Séne SMK, Faye C, Pande CB. Assessment of current and future trends in water resources in the Gambia River Basin in a context of climate change. Environ. Sci. Eur. 2024, 36, 32. DOI:10.1186/s12302-024-00848-2 [Google Scholar]