Intra- and Inter-Watershed Variability in Benthic Macroinvertebrate Community Diversity, Taxa Richness, and Biotic Integrity: Citizen Scientist Sampling Within a Minnesota USA Region Dominated by Agriculture

Intra- and Inter-Watershed Variability in Benthic Macroinvertebrate Community Diversity, Taxa Richness, and Biotic Integrity: Citizen Scientist Sampling Within a Minnesota USA Region Dominated by Agriculture

Received: 22 January 2026 Revised: 25 February 2026 Accepted: 18 March 2026 Published: 27 March 2026

© 2026 The authors. This is an open access article under the Creative Commons Attribution 4.0 International License (https://creativecommons.org/licenses/by/4.0/).
Graphical Abstract
1. Introduction
Aquatic benthic macroinvertebrates are an important part of stream and river food webs, linking basal resources to higher level consumers [1,2,3]. Macroinvertebrates typically occur in lotic systems ranging from headwater spring creeks to great rivers [1]. Because they frequently exhibit high abundance and biodiversity [2,3] and possess a wide range of sensitivities to habitat disturbance, impaired water quality, and unnatural temperature changes [4,5], benthic macroinvertebrates have been used extensively to monitor conditions in flowing water systems [6,7,8,9,10]. Aquatic invertebrate communities normally respond to a variety of environmental stressors in consistent and predictable ways [6,7,8,9,11], allowing investigators to determine the type and intensity of the stressor causing the response [8,11].
Volunteer citizen scientists from around the world have monitored stream and river quality by sampling and analyzing benthic macroinvertebrate communities [12,13,14,15,16,17,18,19,20,21]. Citizen scientist collections may be used to supplement limited sampling efforts by professional agency scientists, to save money for other conservation projects or activities, and to increase awareness and enthusiasm among the general public for protecting surface waters from potentially harmful human activities [15,16,18]. Some citizen science invertebrate monitoring programs may be extensive, spanning state- or nation-wide and involving hundreds to thousands of volunteer monitors [14,17,18,22,23], whereas others may be more regional and involve far fewer citizen scientists [12,13,16]. Regardless of program size, the contributions of citizen scientists monitoring benthic macroinvertebrates in streams and rivers have been proven to be of high value [13,15,16,20,21]. Even when monitoring protocols are greatly simplified to accommodate volunteers’ skill levels, results can be as useful as those obtained by professionals using much more complex protocols [20].
Macroinvertebrate communities have been used for over a century to assess water quality impairments in streams and rivers in southeastern Minnesota, USA [24,25,26,27]. However, macroinvertebrate surveys within this region usually have been intermittent, short-term, and highly localized academic research efforts, with no coordinated efforts to survey large numbers of streams throughout multiple watersheds using consistent protocols over an extended time period. Even the Minnesota Pollution Control Agency, which is tasked with systematically monitoring fish and macroinvertebrate communities in streams and rivers throughout the state to assess compliance with state and national water quality standards, is limited (by time, personnel, and funding) to surveying randomly selected sites within a given watershed only once every 10 years [28]. Clearly, additional stream macroinvertebrate monitoring, covering multiple watersheds more frequently than once each decade and using standardized protocols, would positively supplement the region’s assessments of water quality.
This study was undertaken to expand and enhance the monitoring of lotic macroinvertebrate communities in streams and rivers within southeastern Minnesota, adding to the efforts of state agencies, academic professionals, and non-profit groups who have been using this biotic group for water quality assessment. This region was selected for this effort due to strong public interest in regional stream water quality and the high value of local stream fisheries, especially for trout (L. Gates, Minnesota Department of Natural Resources–Fisheries, retired). Local citizen scientists committed to a multi-year monitoring program paired with organism identification by professionals produced a large data set allowing for region-wide comparisons of macroinvertebrate biotic integrity, diversity, and taxa richness across regional watersheds. It was hypothesized that these comparisons would reveal significant differences in macroinvertebrate community metrics both within and among watersheds influenced by karst geology and past and present land use practices.
2. Study Area
Southeastern Minnesota USA, is predominantly an agricultural region underlain by karst geology and drained by an extensive network (>1500 km) of streams and rivers [29,30]. Many of these are sustained by groundwater spring discharges and are categorized as coldwater systems (summer maximum water temperatures <20 °C), others are warmwater systems (summer maximum water temperatures >25 °C) supported primarily by surface runoff, and finally some are intermediate coolwater streams and rivers (summer maximum water temperatures 20–25 °C) [29]. All lotic systems within this region drain to the Mississippi River, many formed originally as outlet streams from the melting Des Moines lobe of the late Wisconsin glaciation approximately 10,000 years ago [30]. This study examined benthic macroinvertebrate communities in three of the five largest drainages in the region (Zumbro River, Whitewater River, and Root River watersheds) as well as several smaller watersheds lying between the larger systems (Figure 1). All study watersheds are dominated by agricultural land uses (e.g., croplands, pasture/haylands; Table 1).
Table 1. Percentage land uses within each of the study watersheds in southeastern Minnesota, USA.
|
|
Land Use Categories (%) |
||||
|---|---|---|---|---|---|
|
Watersheds |
Croplands |
Pasture/Haylands |
Forests |
Wetland/Water |
Developed |
|
Whitewater |
58 |
8 |
13 |
14 |
7 |
|
Root |
48 |
20 |
26 |
1 |
5 |
|
Zumbro |
56 |
23 |
10 |
9 |
2 |
|
Others |
50 |
12 |
25 |
8 |
5 |
This region has a history of poor agricultural land use practices during the late-1800s and early-1900s that resulted in severe soil erosion and catastrophic consequences for the streams and rivers that flowed through the impacted watersheds [29,31,32,33]. Destruction and recovery (via stocking and other management activities) of lotic fish communities have been documented [33], but the effects of past land abuse followed by more recent conservation practices have not been specifically examined or on a broad regional scale [25,26,27,34].
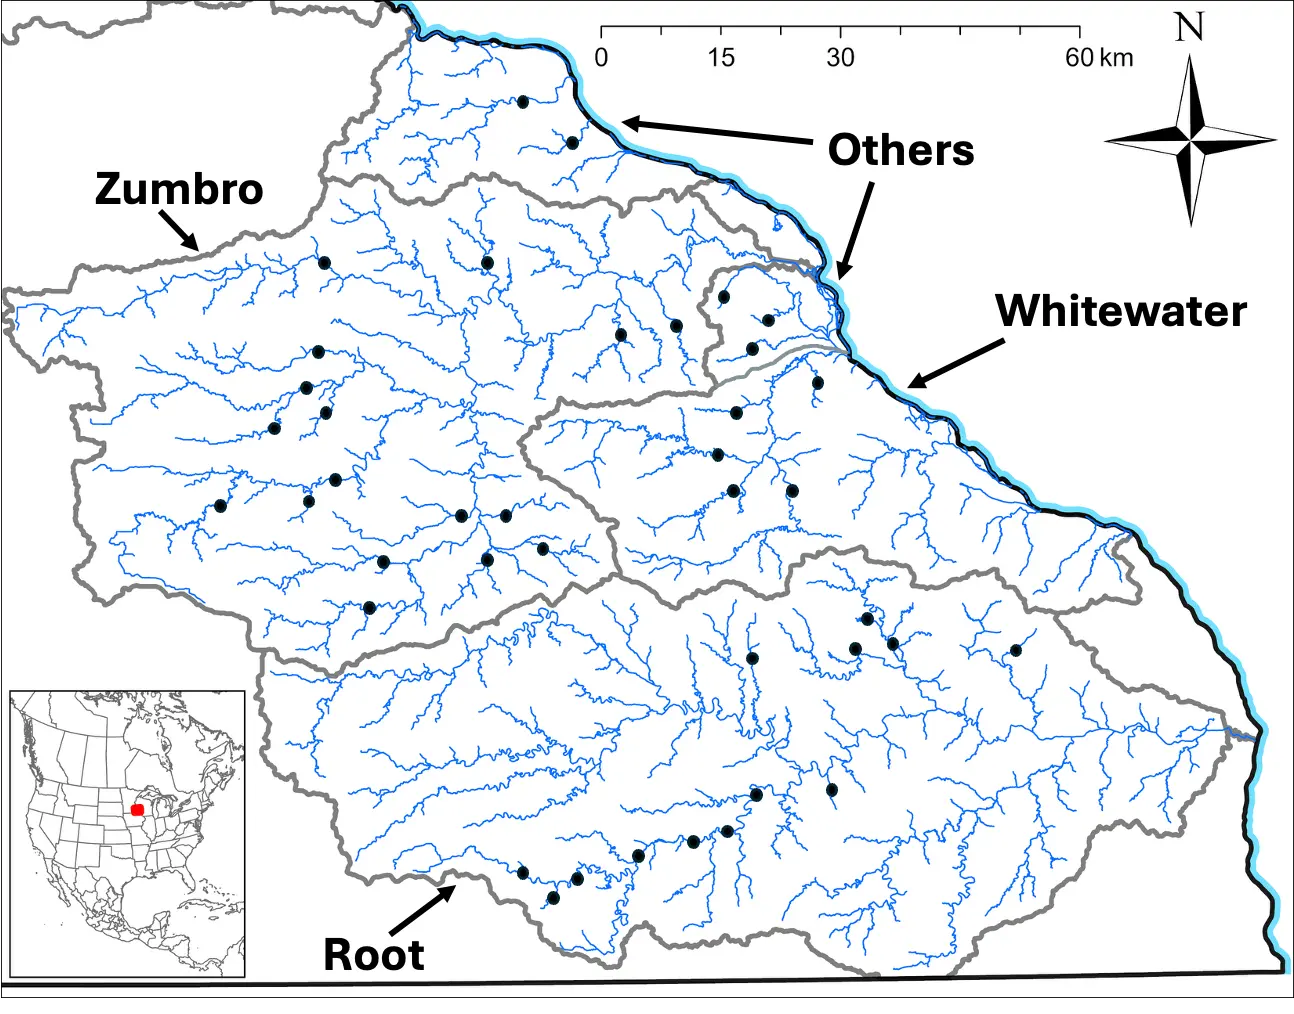
Figure 1. Map depicting 40 stream sites (black dots) in three major watersheds (Zumbro, Whitewater, Root) and other small watersheds (Others) in southeastern Minnesota, USA, where volunteer citizen scientists monitored benthic macroinvertebrates during 1999–2013. The inset maps show the location of the study area (red square) in North America. Gray lines depict watershed boundaries.
3. Methods
Project sampling was coordinated by a collaboration between the Minnesota Department of Natural Resources-Fisheries, Trout Unlimited members, university scientists, and volunteer citizen scientists. Volunteers (e.g., private landowners, anglers, state park personnel, county water planners, high school teachers/students) were recruited to participate based on interest in a specific stream, willingness to follow specific sampling protocols, and ability to continue annual sampling for a period of five years. Samples were collected, sorted, and preserved by volunteers, transferred to a single experienced individual (Trout Unlimited member with professional experience in benthic macroinvertebrate identification) for a quality assurance check (see description in Section 3.2 below), and submitted to university personnel for identification and enumeration. The program continued for 15 years, from 1999–2013.
3.1. Field Collecting Protocol
Volunteers were asked to make benthic macroinvertebrate collections each year between mid-July (late summer) and mid-October (mid-autumn), preferably in September or early October during the period of maximum invertebrate abundance in streams within the region. Benthic invertebrates are also large enough at this time to be easily noticed and picked from samples by volunteers. It was recommended that volunteers collect samples from their stream during approximately the same one- or two-week time period each year that they participated.
After choosing which stream they would sample, participants were asked to select and make their collections from within a 50–75-m reach of their stream. The reach chosen was meant to be representative or typical of the stream overall to prevent targeted and potentially biased sampling [35,36]. An experienced collector (a Trout Unlimited member with a professional background in benthic macroinvertebrate collection and identification) accompanied new volunteers on their first sampling effort to evaluate the selected sampling site, oversee general procedures, highlight potential errors or biases that could occur, and help volunteers to recognize typical macroinvertebrates [22,35,36]. Within each stream reach, separate benthic macroinvertebrate samples were collected from each of three separate riffles (shallow water, faster current velocity with disturbed surfaces, coarse substrates). Riffle-only sampling was chosen to simplify procedures and eliminate possible oversampling of specific habitat types when multihabitat protocols are used [36]. Samples were collected with a D-frame aquatic dip net (0.5-mm mesh) by placing the net against the stream bottom (open end facing upstream) and disturbing the coarse sediments upstream from the net by kicking for 30 s, causing dislodged invertebrates to be washed downstream into the net. Two, 30-s kicks were conducted in each riffle (one in a fast portion, one in a slow portion), and all invertebrates collected were combined into a single riffle sample.
Invertebrates were either picked from debris in the field and preserved in 90% isopropyl alcohol, or the entire sample with debris was preserved prior to later sorting indoors. Volunteers were allowed to use low-magnification (under 5×) hand lenses to aid in sample sorting. Field or indoor sample sorting used a shallow gridded pan. Volunteers were instructed to spread the sample evenly throughout the pan, then randomly select grid squares to remove invertebrates, continuing to sort out all invertebrates (all sizes from large to small to avoid bias) one grid square at a time until approximately 100 organisms had been sorted. If samples contained fewer than 90 organisms, volunteers were encouraged (but not required) to conduct another 30-s kick sample to collect additional organisms. Volunteers were discouraged from collecting >120 organisms/sample or spending >30 min sorting each sample to prevent bias [37]. It is acknowledged that a fixed-count approach likely underestimates any taxa richness metrics assessed [38], but it should not affect comparisons when all samples are collected using this same protocol.
Each year, prior to making collections, citizen scientists checked in with the same experienced collector who assisted them with their initial collection. This gave the volunteers an opportunity to ask questions about sampling and sorting or to work through any problems that may have arisen previously. Submitting their sorted samples to the same experienced taxonomist each year (see below) provided another opportunity for volunteers to ask questions or seek advice. These types of regular connections have been suggested to improve retention rates of volunteers in citizen scientist programs [39,40].
3.2. Quality Assurance Check, Laboratory Identifications, and Data Returns
All invertebrate samples were subjected to a brief quality assurance check by an experienced invertebrate taxonomist. Each sample was inspected for: proper labelling (stream, date of collection, collector name or collector identification code number, sample number), adequate preservation, lack of debris (i.e., clean sort), and general sample size (to ensure an adequate number of organisms per sample). When a sample passed these checks, it was forwarded for identification.
In the laboratory, all invertebrates in each sample were counted and identified (typically to genus level) [41,42,43,44,45,46,47] with the aid of a dissecting microscope (8 to 50× magnification; Nikon SMZ645, Nikon Instruments Inc., Melville, NY, USA). However, midge larvae and pupae (Chironomidae) were identified only to the family level.
After sample identifications were completed, data (list of taxa and counts for each sample, scores and ratings for each sample based on a regional biotic integrity index; see below) were summarized in tabular and graphical formats for return to individual volunteers. Each year, new data were added to information from previous years so volunteers could visualize changes (or lack of them) in macroinvertebrate communities in their chosen streams. This regular feedback was intended to keep volunteers engaged to continue with the monitoring program by demonstrating how their data could be used and what it meant for their stream.
3.3. Data Analyses
Several diversity, taxa richness, and biotic integrity metrics were calculated for all benthic macroinvertebrate samples collected by citizen scientist volunteers, to determine if the various metrics performed similarly in their ratings of the benthic macroinvertebrate communities. The Simpson diversity index (range from 0 [no diversity] to a maximum of 1) and the Shannon diversity index (base 10; range from 0 [no diversity] to a maximum of log10[X] where X = number of taxa) were calculated for each individual sample using Quantan Quantitative Analysis in Ecology software (May 1997 version) [48]. The total number of taxa (total taxa richness; genus for all organisms except for Chironomidae midges [family]) and the number of Ephemeroptera (mayflies), Plecoptera (stoneflies), and Trichoptera (caddisflies) taxa (EPT taxa richness; based on identification to genus) were also tabulated for each sample. Previous research in southeastern Minnesota (using fixed-count [100 organism] sampling) indicated that impaired stream sites averaged less than eight total taxa (based on genus-level identification) and three EPT taxa per sample, whereas high-quality reference sites averaged >15 total taxa and eight EPT taxa [49]. Finally, a regional, multimetric benthic invertebrate biotic integrity index (BIBI) [49,50] was calculated for each macroinvertebrate sample as an indicator of benthic biological integrity at the stream sites. This specific BIBI was developed and validated using data from 100-organism samples collected by citizen scientists and other researchers [49]. Scoring for the BIBI (possible scores from 0 to 100) was based on values for 10 different invertebrate community metrics that included various forms of taxa richness, tolerance to environmental stressors, feeding strategies, and longevity measures [49] (Table 2). Each metric received a score of 0, 5, or 10 based on the value for that metric, and collectively they produced ratings such as: excellent (total BIBI scores ranging from 65–100), good (50–60), fair (30–45), poor (10–25), and very poor (0–5) [49].
Table 2. Benthic index of biotic integrity (BIBI) metrics and scoring (0, 5, or 10) based on numbers of taxa (mostly genera except for Chironomidae midges) or percentages of organisms in individual samples. Sample BIBI score was the sum of all 10 metric scores (possible BIBI score range between 0 and 100). Table adapted from [49].
|
Score |
|||
|---|---|---|---|
|
Metric |
10 |
5 |
0 |
|
Percent Plecoptera |
>12 |
6–12 |
<6 |
|
Percent long-lived |
>12 |
6–12 |
<6 |
|
Percent predators |
>13 |
6.5–13 |
<6.5 |
|
Number of total taxa |
>12 |
7–12 |
0–6 |
|
Number of Plecoptera taxa |
>1 |
1 |
0 |
|
Number of Trichoptera taxa |
>3 |
2–3 |
0–1 |
|
Number of long-lived taxa |
>1 |
1 |
0 |
|
Number of Diptera taxa |
>4 |
3–4 |
0–2 |
|
Number of intolerant taxa |
>3 |
2–3 |
0–1 |
|
Number of filterer taxa |
>4 |
3–4 |
0–2 |
Simpson and Shannon diversities, total taxa and EPT taxa richness, and BIBI scores for all years were grouped by watershed, summarized, and compared among the four watershed groupings surveyed (Whitewater, Root, Zumbro, Others). Each community measure was compared among watersheds in two ways. First, watershed values were compared with separate Kruskal-Wallis tests, and if significant differences were detected, Tukey’s honest significant difference (HSD) tests were used to detect which watersheds differed from the others (VassarStats: Website for Statistical Computation; vassarstats.net; accessed on 10 January 2026). Second, variable values within each watershed were grouped into five or six bins or categories, and distributions of the counts within bins were compared among watersheds both visually and with Chi-square contingency tables [51]. Bins were used here to better align and compare all measures with the BIBI rating categories (five bins). Six bins were used for total taxa richness to balance category ranges and simplify break points between categories (i.e., groupings of three taxa).
To determine if BIBI scores changed from year to year at the various stream sites, BIBI scores at individual stream sites were compared among years using separate Kruskal-Wallis tests for each site. Only sites with three or more years of samples were compared in this way.
Relationships among the various community measures (combined across all watersheds) were also assessed in several different ways. First, multivariate analysis was used to produce a Spearman’s rank correlation coefficient table and scatterplot matrix comparing the strength of the relationships among the five macroinvertebrate community measures (JMP Pro 18.0.1; JMP Statistical Discovery LLC, Cary, NC, USA). Next, analysis of covariance (ANCOVA) was used to compare the relationships between each of the two taxa richness measures (total taxa, EPT taxa) and BIBI scores across the various watersheds to determine if the relationships varied among watersheds. Finally, the proportion of total taxa in each sample comprised of EPT taxa was compared among watersheds with Kruskal-Wallis and Tukey’s HSD tests to determine if EPT taxa were more important to overall community structure in some watersheds compared to others.
4. Results
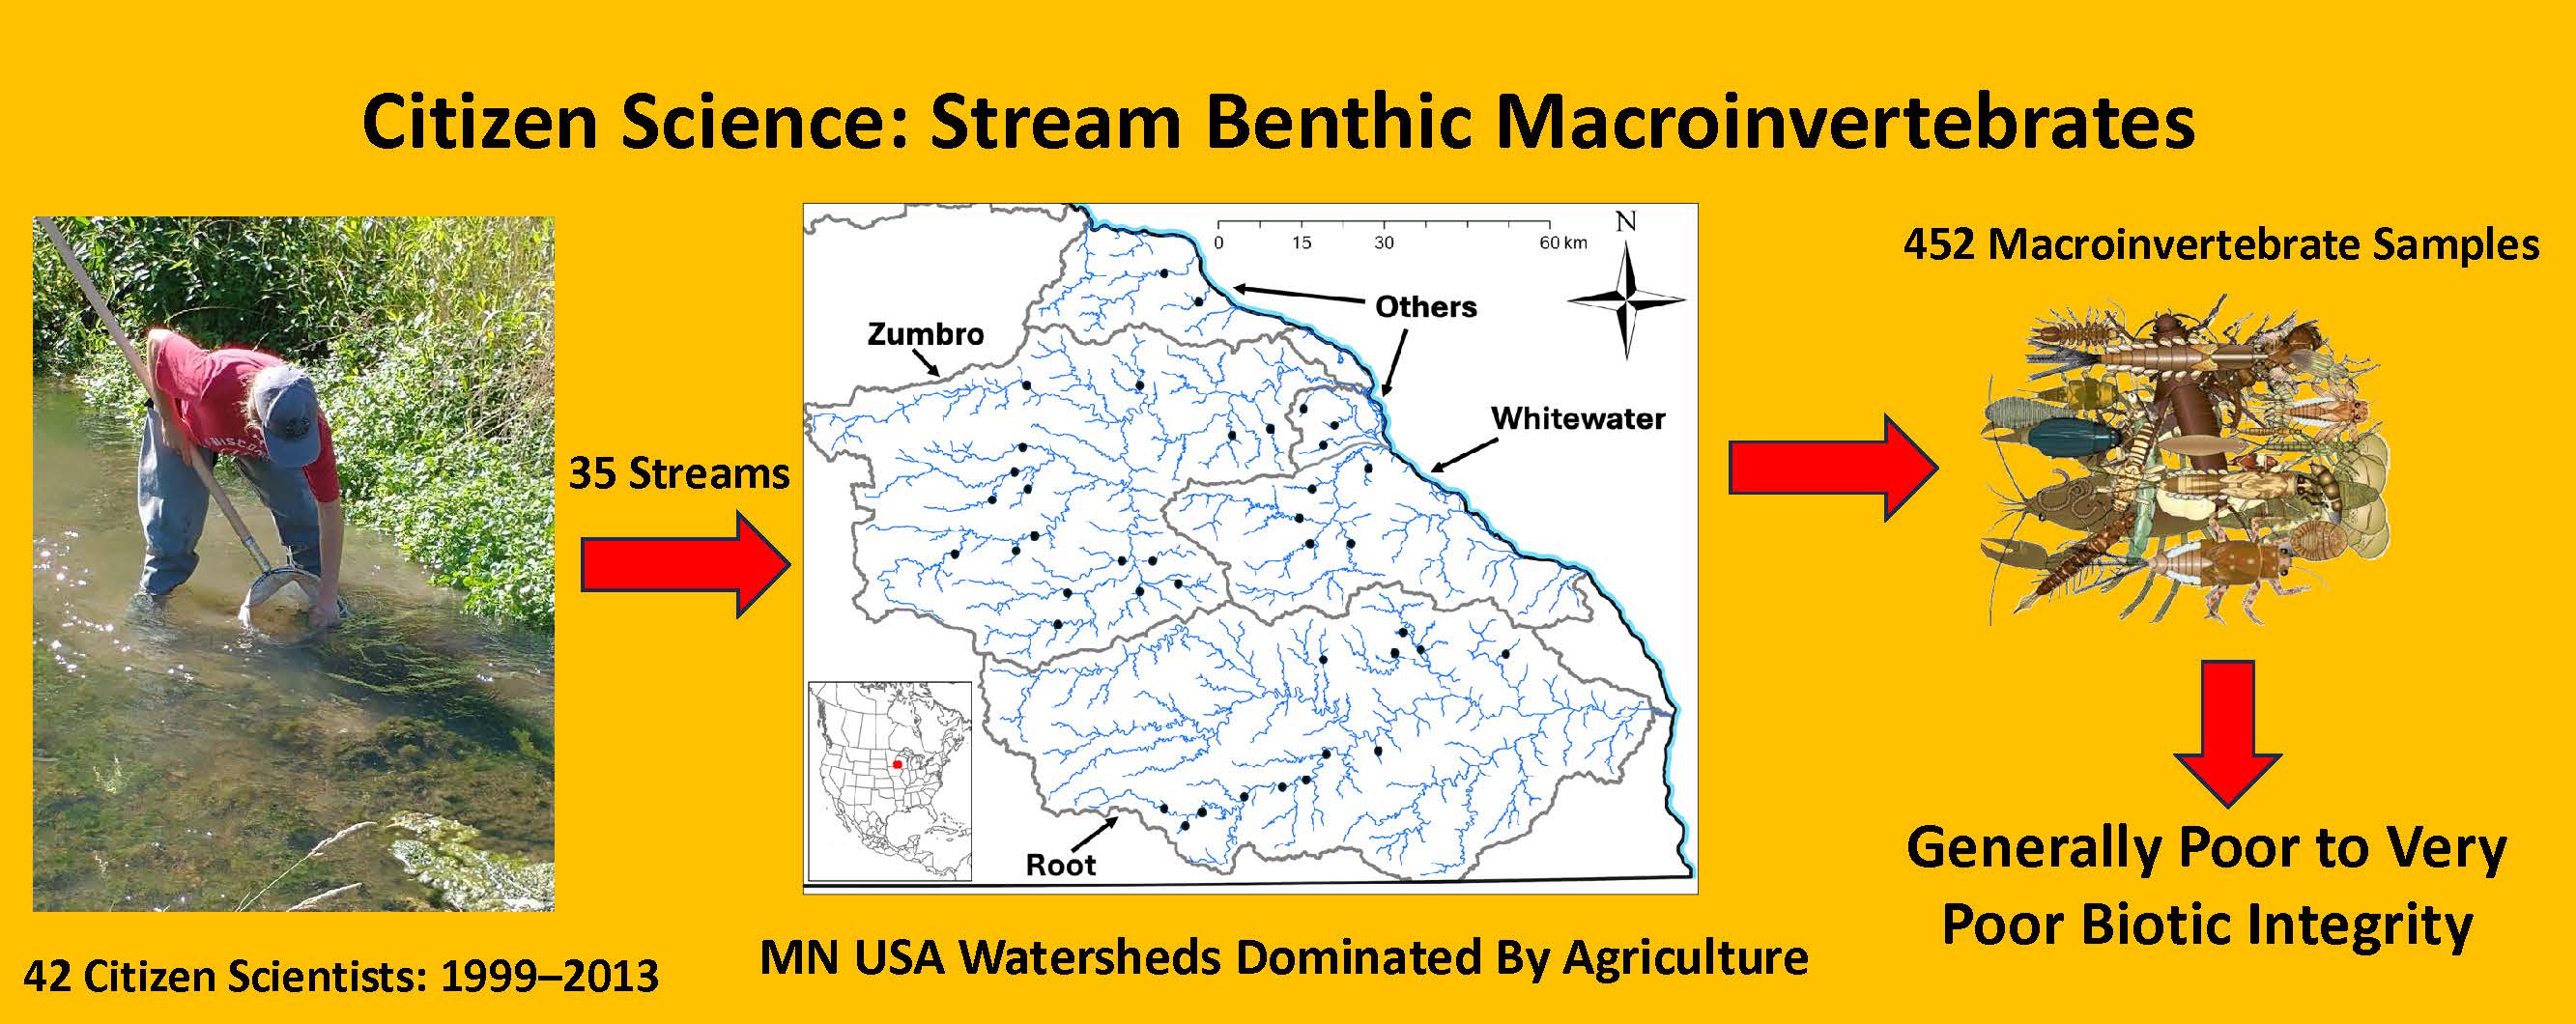
Across the 15 years of sampling within the watersheds of southeastern Minnesota, 42 volunteer citizen scientists (individuals or teams) collected 452 samples of benthic macroinvertebrates from 35 different streams and rivers (including six sites on one stream [South Branch Root River]; Table 1). For various reasons, only 19 of the 42 collectors (45%) fulfilled the requested five years of sampling at their chosen stream. Six of the 23 volunteers who did not make five annual collections missed sampling their stream site during only a single year in the middle of their five-year sampling period, citing high water conditions or family issues that prevented them from sampling. Six of the 19 collectors who completed five years of sampling continued sampling for one or more years beyond their original commitment. Across all watersheds, volunteers averaged 3.8 years of sampling (SD = 1.8 years, range = 1 to 7 years) and collected an average of 11.3 samples (SD = 5.7 samples, range = 1 to 19 samples). In some instances, multiple collectors chose to sample the same stream for their collections (e.g., six different collectors in the South Branch Root River), but this was allowed by monitoring program coordinators only on a few of the larger (longer and higher order) streams to better spread out the monitoring efforts. Overall, samples were collected from five streams in the Whitewater River watershed; eight streams in the Root River watershed; 17 streams in the Zumbro River watershed; and five streams each in their own small watersheds (Table 3).
In total, 46,763 individual organisms were collected and identified during this study, an average of 104 organisms/sample (95% CI = 4). These organisms represented 82 taxa, including insects, non-insect arthropods, molluscs, segmented worms, and flatworms. EPT taxa comprised 53 (65%) of the 82 taxa collected (Table 4). Although communities were highly variable among streams and years, benthic samples often were dominated by one or more of the following: amphipods (Gammarus), baetid (Baetis) mayflies, midges (Chironomidae), net-spinning caddisflies (Hydropsyche, Cheumatopsyche), brachycentrid (Brachycentrus) caddisflies, and riffle beetles (Optioservus).
Table 3. Summary data for streams monitored by citizen scientists in four watersheds in southeastern Minnesota, USA, during the period 1999–2013. Values are means with standard deviations in parentheses. EPT = Ephemeroptera, Plecoptera, Trichoptera; BIBI = Benthic Index of Biotic Integrity. Numbers after stream names are stream orders. BIBI ratings are based on the mean BIBI score (see text for explanation of ratings based on scores).
|
Number of Simpson Shannon |
||||||||
|---|---|---|---|---|---|---|---|---|
|
Watershed/Site |
Years Sampled |
Samples |
Diversity |
Diversity |
Taxa Richness |
EPT Taxa Richness |
BIBI Score |
BIBI Rating |
|
Whitewater River Watershed |
||||||||
|
North Fork Whitewater River (4) |
2001–2004 |
12 |
0.695 (0.088) |
0.673 (0.091) |
9.9 (1.6) |
4.8 (0.8) |
18.8 (5.7) |
Poor |
|
Middle Fork Whitewater River (4) |
2000, 2005 |
9 |
0.659 (0.121) |
0.605 (0.120) |
8.3 (1.8) |
4.6 (1.0) |
16.1 (8.6) |
Poor |
|
South Fork Whitewater River (4) |
2000–2004 |
15 |
0.752 (0.090) |
0.736 (0.114) |
9.9 (1.6) |
5.6 (1.2) |
19.7 (7.4) |
Poor |
|
Beaver Creek (2) |
2000–2005 |
19 |
0.676 (0.102) |
0.670 (0.137) |
10.8 (2.8) |
5.1 (2.1) |
21.8 (9.9) |
Poor |
|
Trout Valley Creek (2) |
2001, 2002, 2005 |
9 |
0.614 (0.121) |
0.524 (0.128) |
6.9 (2.4) |
3.7 (1.0) |
15.0 (12.0) |
Poor |
|
Whitewater watershed averages |
0.686 (0.108) |
0.657 (0.135) |
9.5 (2.5) |
4.9 (1.5) |
19.0 (8.9) |
Poor |
||
|
Root River Watershed |
||||||||
|
South Branch Root River #1 (5) |
2000–2004 |
15 |
0.679 (0.089) |
0.627 (0.100) |
9.0 (2.7) |
6.0 (1.4) |
29.3 (16.0) |
Poor/Fair |
|
South Branch Root River #2 (5) |
2001–2004 |
11 |
0.652 (0.102) |
0.578 (0.128) |
8.1 (2.6) |
4.9 (2.0) |
21.8 (17.9) |
Poor |
|
South Branch Root River #3 (2) |
2003–2007 |
15 |
0.742 (0.106) |
0.759 (0.133) |
11.2 (2.1) |
7.0 (1.1) |
44.7 (12.2) |
Fair/Good |
|
South Branch Root River #4 (3) |
2003–2006 |
12 |
0.795 (0.070) |
0.829 (0.097) |
12.2 (1.9) |
8.0 (1.1) |
67.5 (7.8) |
Excellent |
|
South Branch Root River #5 (3) |
2003–2006 |
12 |
0.731 (0.160) |
0.759 (0.225) |
12.4 (3.7) |
8.3 (2.3) |
54.6 (25.0) |
Good |
|
South Branch Root River #6 (4) |
2003–2006 |
12 |
0.707 (0.113) |
0.698 (0.163) |
9.6 (2.5) |
5.3 (1.2) |
22.5 (8.1) |
Poor |
|
Ferguson Creek (2) |
2000–2004 |
15 |
0.763 (0.085) |
0.789 (0.120) |
12.3 (2.2) |
6.3 (1.3) |
47.7 (8.2) |
Fair/Good |
|
Rush Creek (4) |
2000–2004 |
15 |
0.684 (0.098) |
0.619 (0.121) |
8.5 (2.2) |
3.6 (0.9) |
12.7 (6.2) |
Poor |
|
Trout Run Creek (3) |
2000–2004 |
18 |
0.282 (0.134) |
0.243 (0.091) |
4.1 (1.1) |
2.4 (0.8) |
3.3 (5.1) |
Very Poor |
|
Corey Creek (2) |
2002 |
3 |
0.607 (0.171) |
0.575 (0.251) |
8.3 (4.9) |
3.0 (2.6) |
16.7 (7.6) |
Poor |
|
Etna Creek (2) |
2003–2007 |
15 |
0.708 (0.067) |
0.639 (0.119) |
7.7 (2.4) |
4.9 (1.4) |
19.7 (9.3) |
Poor |
|
Gribben Creek (2) |
2004, 2005, 2007 |
9 |
0.593 (0.107) |
0.511 (0.116) |
7.2 (3.1) |
3.3 (1.1) |
16.1 (14.5) |
Poor |
|
Coolridge Creek (1) |
2007 |
3 |
0.664 (0.12) |
0.606 (0.151) |
9.0 (1.0) |
4.0 (0.0) |
28.3 (7.6) |
Poor/Fair |
|
Roor watershed averages |
0.657 (0.178) |
0.630 (0.209) |
9.2 (3.5) |
5.3 (2.3) |
29.8 (22.3) |
Poor/Fair |
||
|
Zumbro River Watershed |
||||||||
|
North Fork Zumbro River (5) |
2000–2002 |
9 |
0.747 (0.112) |
0.757 (0.179) |
10.9 (2.3) |
5.7 (1.8) |
36.7 (18.0) |
Fair |
|
Middle Fork Zumbro River (5) |
1999 |
2 |
0.693 (0.165) |
0.720 (0.238) |
12.5 (4.9) |
6.0 (1.4) |
40.0 (14.1) |
Fair |
|
Middle Fork South Branch Zumbro River (4) |
2001–2005, 2013 |
18 |
0.792 (0.086) |
0.845 (0.145) |
13.2 (2.1) |
6.7 (2.0) |
41.7 (17.1) * |
Fair |
|
South Fork Zumbro River (4) |
1999, 2013 |
4 |
0.840 (0.047) |
0.925 (0.075) |
16.8 (2.1) |
7.5 (1.3) |
32.5 (8.7) |
Fair |
|
Cold Spring (2) |
1999–2004 |
19 |
0.409 (0.154) |
0.327 (0.116) |
4.6 (1.5) |
1.4 (0.6) |
4.2 (7.1) |
Very Poor |
|
Long Creek (3) |
2001–2005 |
15 |
0.374 (0.202) |
0.333 (0.174) |
5.5 (2.3) |
2.3 (1.2) |
5.7 (6.5) |
Very Poor/Poor |
|
West Indian Creek (3) |
2001–2005 |
15 |
0.567 (0.173) |
0.529 (0.166) |
8.1 (1.8) |
2.7 (0.9) |
12.7 (6.2) |
Poor |
|
Silver Creek (2) |
1999–2000 |
4 |
0.519 (0.211) |
0.529 (0.230) |
9.5 (3.1) |
4.3 (1.3) |
20.0 (16.8) |
Poor |
|
Bear Creek (2) |
2000–2001 |
9 |
0.596 (0.145) |
0.551 (0.129) |
8.2 (1.5) |
3.1 (1.9) |
18.9 (12.4) |
Poor |
|
Cascade Creek (3) |
1999–2000 |
5 |
0.761 (0.062) |
0.713 (0.115) |
10.0 (3.7) |
4.6 (2.5) |
25.0 (8.7) |
Poor |
|
Milliken Creek (2) |
2001–2005, 2013 |
17 |
0.822 (0.073) |
0.881 (0.124) |
13.2 (3.4) |
5.8 (1.8) |
25.3 (13.5) |
Poor/Fair |
|
Masten Creek (2) |
2001–2005, 2013 |
18 |
0.820 (0.040) |
0.825 (0.086) |
10.8 (2.9) |
5.3 (1.4) |
46.1 (12.9) * |
Fair/Good |
|
Salem Creek (3) |
1999, 2001–2005, 2013 |
19 |
0.728 (0.112) |
0.758 (0.138) |
11.7 (3.3) |
6.8 (1.6) |
38.4 (13.5) |
Fair |
|
North Branch Salem Creek (2) |
2013 |
3 |
0.812 (0.058) |
0.843 (0.075) |
13.3 (0.6) |
5.0 (1.0) |
30.0 (8.7) |
Fair |
|
Harkcom Creek (2) |
2013 |
3 |
0.591 (0.167) |
0.598 (0.182) |
13.0 (2.6) |
4.3 (1.2) |
30.0 (8.7) |
Fair |
|
Dodge Center Creek (2) |
2013 |
2 |
0.744 (0.005) |
0.769 (0.013) |
16.0 (1.4) |
7.5 (0.7) |
35.0 (14.1) |
Fair |
|
Willow Creek (2) |
1999 |
1 |
0.508 |
0.499 |
11 |
5 |
15 |
Poor |
|
Zumbro watershed averages |
0.660 (0.204) |
0.660 (0.245) |
10.1 (4.0) |
4.6 (2.4) |
26.2 (18.8) |
Poor/Fair |
||
|
Other Watersheds |
||||||||
|
East Indian Creek (2) |
2000–2002, 2004 |
12 |
0.581 (0.159) |
0.517 (0.160) |
7.5 (2.6) |
2.46(0.9) |
12.1 (9.4) |
Poor |
|
Wells Creek (2) |
2000–2004 |
18 |
0.775 (0.084) |
0.757 (0.123) |
9.7 (2.4) |
4.3 (1.5) |
24.7 (13.8) |
Poor |
|
Gorman Creek (2) |
1999–2004 |
13 |
0.651 (0.175) |
0.588 (0.171) |
7.0 (1.6) |
3.1 (0.6) |
17.3 (9.7) |
Poor |
|
Snake Creek (2) |
2001, 2003–2005 |
12 |
0.416 (0.179) |
0.397 (0.169) |
7.4 (2.1) |
2.8 (0.5) |
12.9 (5.8) |
Poor |
|
Gilbert Creek (2) |
2001–2005 |
15 |
0.723 (0.110) |
0.674 (0.140) |
8.5 (2.5) |
3.7 (1.7) |
17.7 (11.3) * |
Poor |
|
Other watersheds averages |
0.639 (0.186) |
0.599 (0.195) |
8.2 (2.5) |
3.4 (1.4) |
17.7 (11.7) |
Poor |
||
* BIBI scores differed significantly among years.
Total taxa richness in samples averaged approximately nine taxa across all watersheds and years (Table 4), although some streams or individual samples had much lower (four or fewer) or much higher (12 or more) averages (Table 4, Figure 2A). Root River and Zumbro River watersheds both had some of the poorest and best taxa richness values (Table 4, Figure 2A), with five to 10 percent of samples from those two watersheds having 16 or more taxa (Figure 2A). Total taxa richness differed significantly (Kruskal-Wallis H = 15, df = 3, p = 0.0018) among the four watersheds, with richness lowest in the group of “Other watersheds”. Distributions of samples among the various total taxa richness groupings also differed significantly (Chi-square = 46.6, df = 15, p < 0.001) among watersheds (Figure 2A).
Table 4. Ephemeroptera, Plecoptera, and Trichoptera (EPT) taxa collected from four watersheds in southeastern Minnesota, USA, by volunteer citizen scientists during 1999–2013. X = taxon collected within watershed.
|
Watersheds |
||||
|---|---|---|---|---|
|
Ephemeroptera (Mayfly) Genera |
Whitewater |
Root |
Zumbro |
Others |
|
Baetis |
X |
X |
X |
X |
|
Baetisca |
X |
X |
||
|
Caenis |
X |
X |
||
|
Ephemera |
X |
|||
|
Ephemerella |
X |
X |
X |
X |
|
Ephoron |
X |
|||
|
Habrophleboides |
X |
|||
|
Heptagenia |
X |
X |
||
|
Heterocloeon |
X |
X |
||
|
Hexagenia |
X |
|||
|
Isonychia |
X |
X |
X |
|
|
Leptophlebia |
X |
X |
X |
|
|
Paraleptophlebia |
X |
X |
X |
X |
|
Pseudocloeon |
X |
|||
|
Rhithrogena |
X |
|||
|
Stenonema |
X |
X |
X |
X |
|
Tricorythodes |
X |
X |
X |
|
|
Number of mayfly taxa |
7 |
12 |
15 |
5 |
|
Plecoptera (stonefly) genera |
||||
|
Acroneuria |
X |
X |
||
|
Allocapnia |
X |
|||
|
Amphinemura |
X |
X |
X |
|
|
Hastaperla |
X |
|||
|
Isogenoides |
X |
|||
|
Isoperla |
X |
X |
X |
|
|
Nemoura |
X |
|||
|
Neoperla |
X |
X |
||
|
Paragnetina |
X |
X |
||
|
Phasganophora |
X |
|||
|
Pteronarcys |
X |
X |
X |
|
|
Strophopteryx |
X |
|||
|
Taeniopteryx |
X |
X |
||
|
Number of stonefly taxa |
4 |
10 |
6 |
3 |
|
Trichoptera (caddisfly) genera |
||||
|
Brachycentrus |
X |
X |
X |
X |
|
Cheumatopsyche |
X |
X |
X |
X |
|
Chimarra |
X |
X |
||
|
Glossosoma |
X |
X |
X |
X |
|
Helicopsyche |
X |
X |
||
|
Hesperophylax |
X |
X |
X |
|
|
Hydatophylax |
X |
X |
||
|
Hydropsyche |
X |
X |
X |
X |
|
Hydroptila |
X |
X |
X |
|
|
Lepidostoma |
X |
|||
|
Limnephilus |
X |
X |
X |
X |
|
Micrasema |
X |
X |
||
|
Neophylax |
X |
|||
|
Nyctiophylax |
X |
X |
||
|
Oecetis |
X |
X |
||
|
Onocosmoecus |
X |
|||
|
Platycentropus |
X |
X |
X |
|
|
Polycentropus |
X |
|||
|
Pseudostenophylax |
X |
|||
|
Psychomyia |
X |
X |
||
|
Ptilostomis |
X |
X |
||
|
Pycnopsyche |
X |
X |
||
|
Rhyacophila |
X |
|||
|
Number of caddisfly taxa |
11 |
17 |
14 |
11 |
|
Total number of EPT taxa |
22 |
39 |
35 |
19 |
The overall variety of EPT taxa was much higher in the Root (39 taxa) and Zumbro River (35 taxa) watershed samples than in samples from the other watersheds (22 taxa in Whitewater, 19 taxa in “Others”) (Table 4). Individual samples across all watersheds and years averaged approximately five EPT taxa, although the “Other watersheds” samples averaged significantly (Kruskal-Wallis H = 39.8, df = 3, p < 0.0001) fewer EPT taxa than those collected elsewhere (Table 4). Distributions of samples among the various EPT taxa richness groupings also differed significantly (Chi-square = 64.7, df = 12, p < 0.001) among watersheds (Figure 2B). Across all watersheds and years, total taxa richness and EPT taxa richness of samples were significantly correlated with one another (Figure 3, Table 5). When sample EPT taxa richness was expressed as a percentage of sample total taxa richness and compared among watersheds, significant differences (Kruskal-Wallis H = 93.13, df = 3, p < 0.0001) were detected among watersheds (Figure 4), with EPT taxa representing nearly 60% of taxa collected in Root River samples but 52% or less in samples from other watersheds.
Neither Simpson (Kruskal-Wallis H = 1.84, df = 3, p = 0.606) nor Shannon (Kruskal-Wallis H = 5.13, df = 3, p = 0.163) diversity indices of the macroinvertebrate samples displayed significant differences among the watersheds monitored, although several individual streams within most watersheds exhibited relatively low and relatively high diversities (Table 3). However, distributions of samples among the various Simpson and Shannon diversity groupings both differed significantly (Simpson: Chi-square = 35.2, df = 12, p < 0.001; Shannon: Chi-square = 40.0, df = 12, p < 0.001) among watersheds (Figure 5A,B). For both indices, the Zumbro River watershed samples skewed more toward higher values compared to samples from the other watersheds (Figure 5A,B). The two diversity indices were significantly correlated with one another, as well as with both total taxa richness and EPT taxa richness of the samples (Figure 3, Table 3), with Shannon diversities exhibiting slightly stronger correlations with both taxa richness variables compared to Simpson diversity correlations with those same variables.
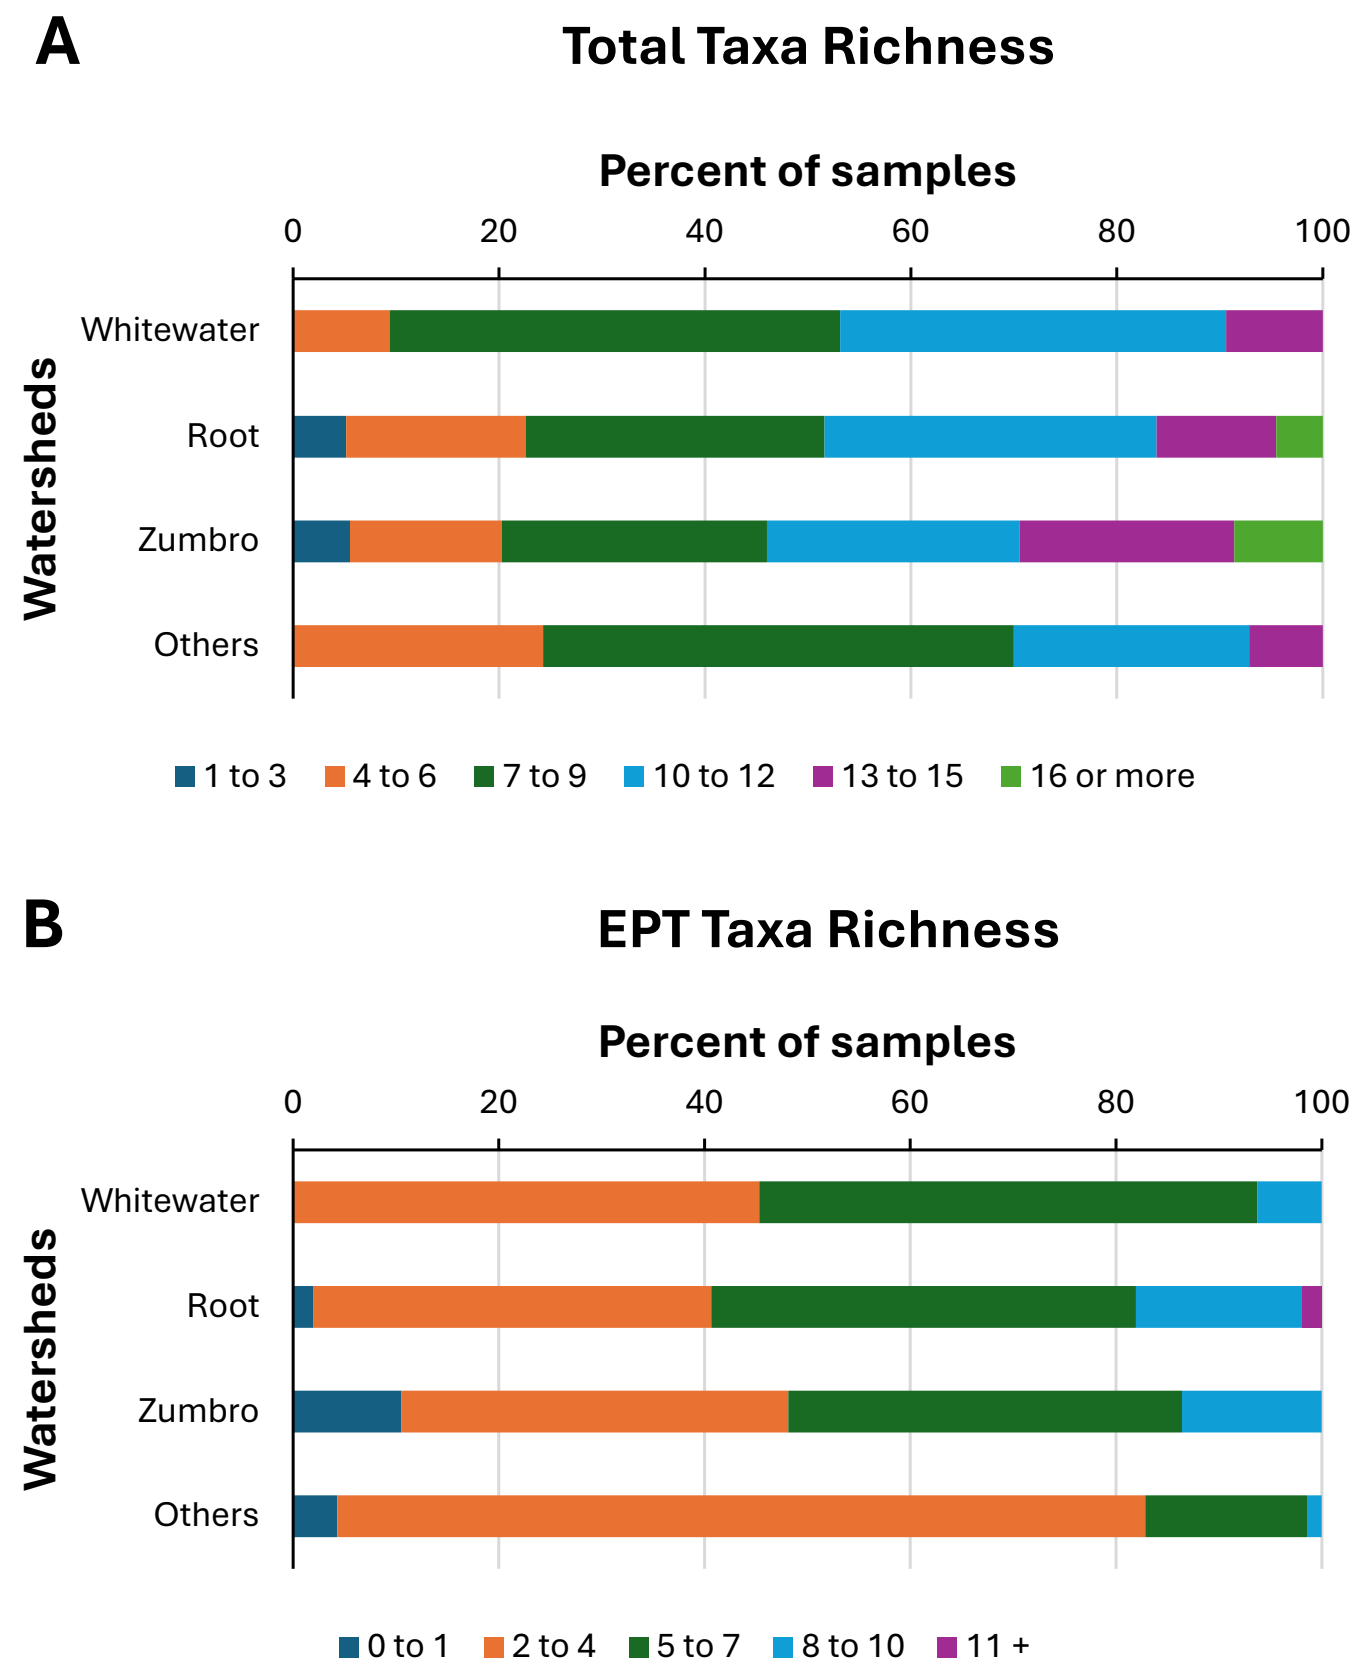
Figure 2. Distributions of benthic macroinvertebrate samples among total taxa richness categories (A) and Ephemeroptera-Plecoptera-Trichoptera (EPT) taxa richness categories (B) for four watersheds in southeastern Minnesota, USA. Citizen scientists collected samples from 1999–2013.
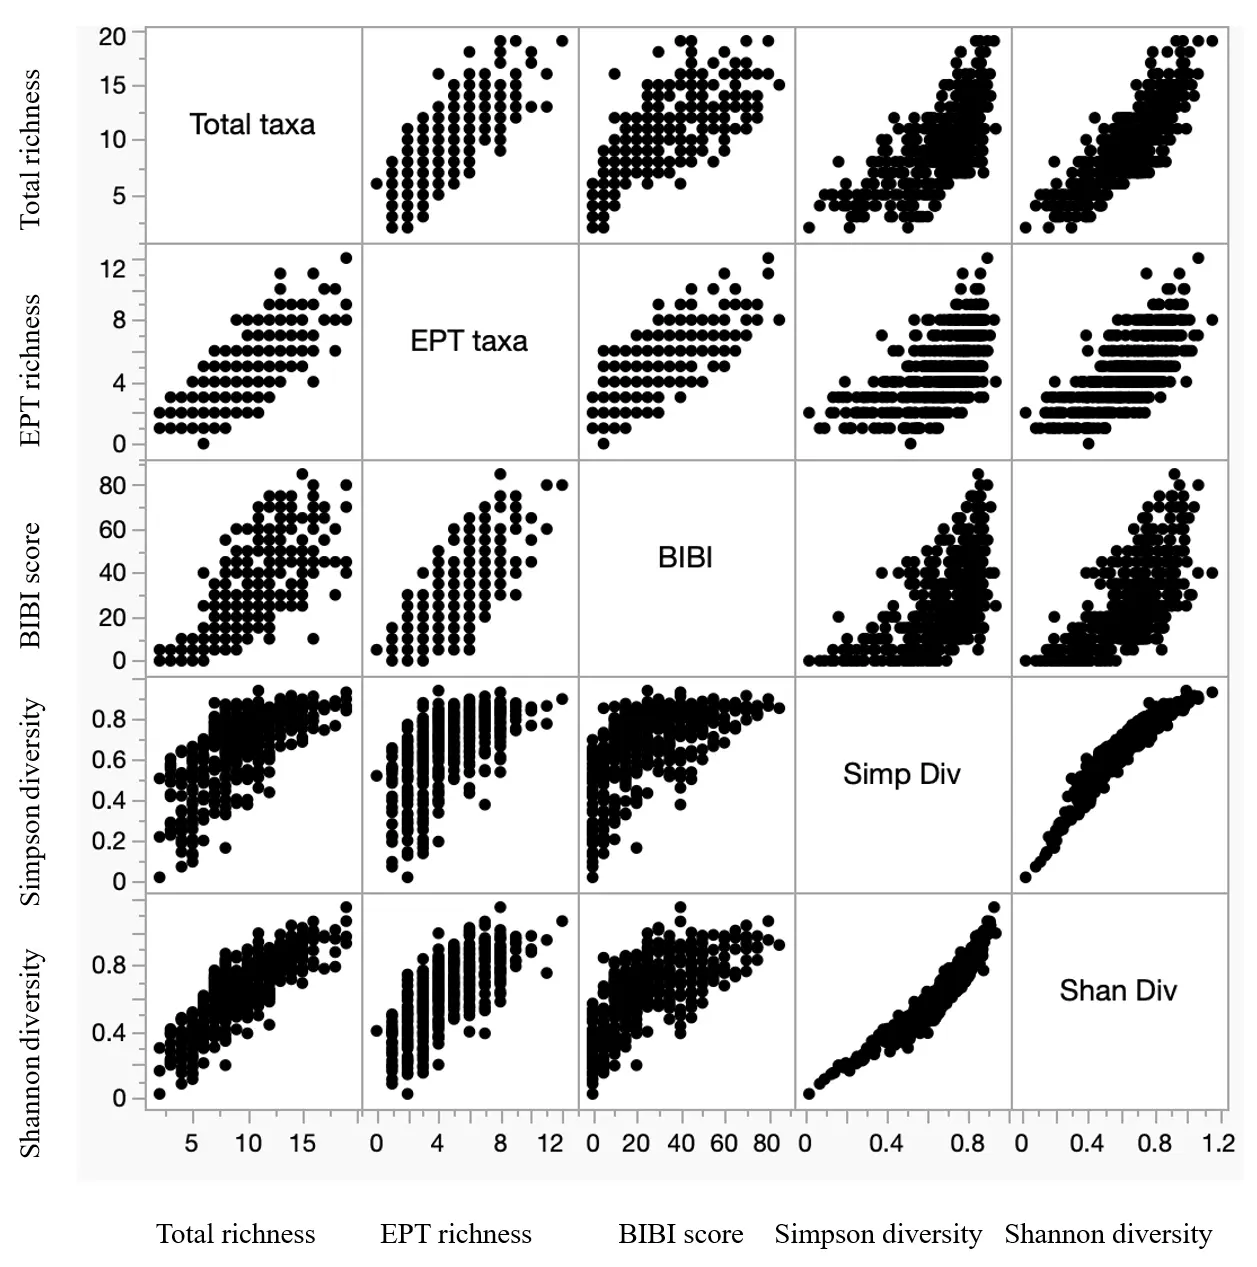
Figure 3. Scatterplot matrix displaying relationships among taxa richness, diversity, and biotic integrity variables for 452 samples of benthic macroinvertebrates collected by citizen scientists from four watersheds in southeastern Minnesota, USA, during 1999–2013. EPT = Ephemeroptera, Plecoptera, Trichoptera; BIBI = Benthic Index of Biotic Integrity.
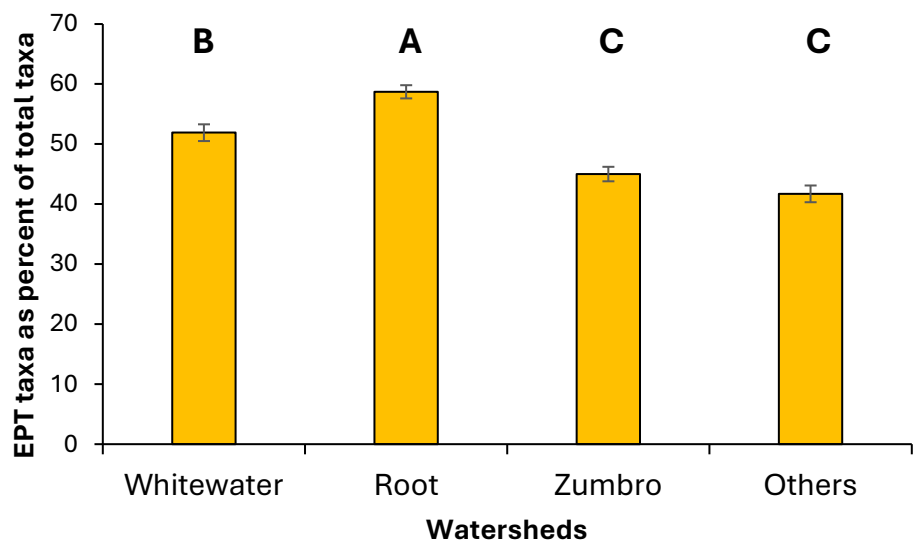
Figure 4. Percentages of total taxa richness of benthic macroinvertebrate samples comprised of Ephemeroptera-Plecoptera-Trichoptera (EPT) taxa. Values are means (± 1 standard error) of all samples from each of four watersheds in southeastern Minnesota, USA. Bars with different letters above them are significantly different from one another (Tukey’s HSD test, p < 0.05).
Table 5. Spearman rank correlation coefficient matrix depicting strengths of relationships among taxa richness, diversity, and biotic integrity variables for 452 samples of benthic macroinvertebrates collected by citizen scientists from streams within four watersheds in southeastern Minnesota, USA, 1999–2013. EPT = Ephemeroptera, Plecoptera, Trichoptera; BIBI = Benthic Index of Biotic Integrity.
|
EPT Taxa |
BIBI Score |
Simpson Diversity |
Shannon Diversity |
|
|---|---|---|---|---|
|
Total taxa |
0.805 * |
0.811 * |
0.688 * |
0.821 * |
|
EPT taxa |
0.820 * |
0.633 * |
0.733 * |
|
|
BIBI score |
0.646 * |
0.740 * |
||
|
Simpson diversity |
0.969 * |
* p < 0.0001.
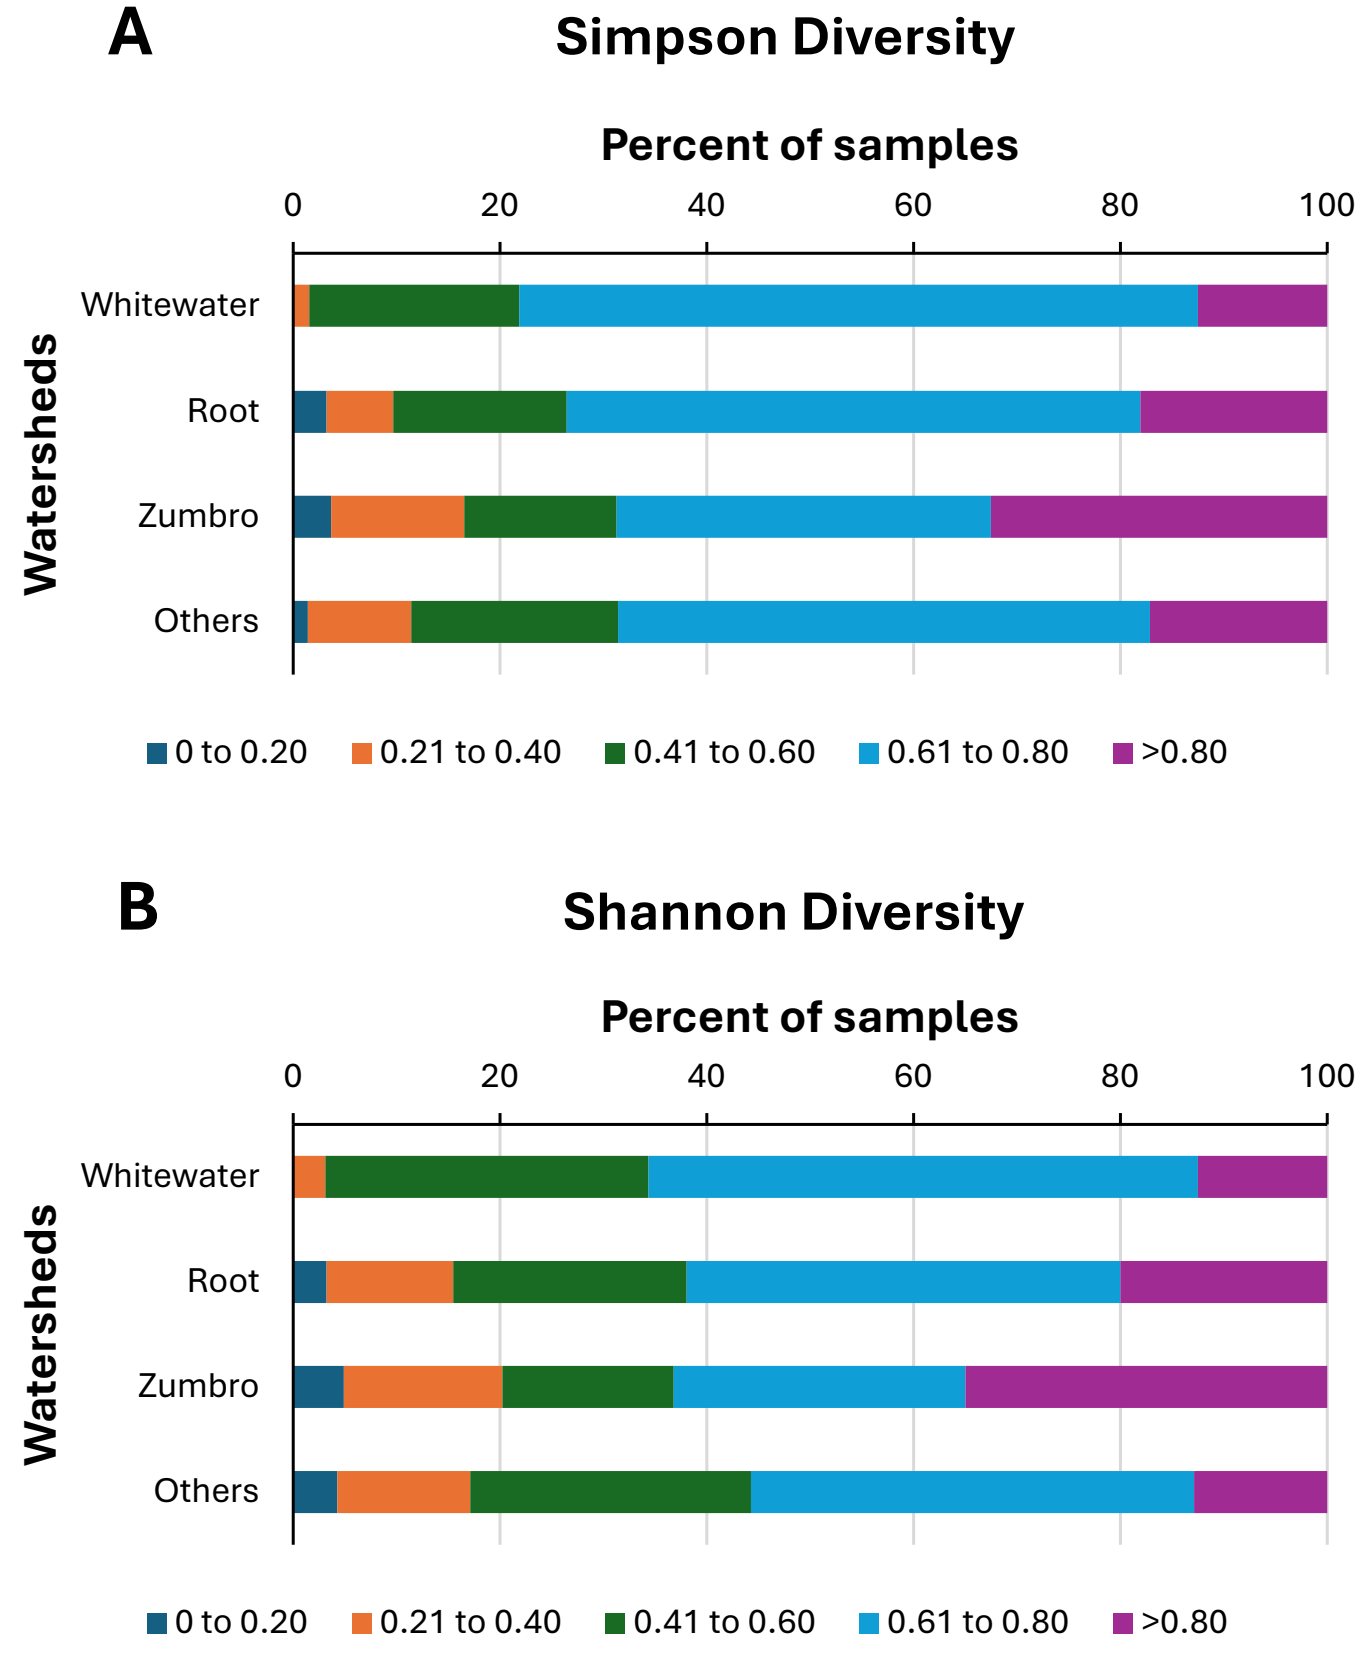
Figure 5. Distributions of 452 benthic macroinvertebrate samples among Simpson diversity categories (A) and Shannon diversity categories (B) for four watersheds in southeastern Minnesota, USA. Citizen scientists collected samples during 1999–2013.
BIBI scores and ratings were highly variable across both streams and watersheds (Table 3). BIBI scores differed significantly (Kruskal-Wallis H = 18.23, df = 3, p = 0.0004) among watersheds, higher in the Root and Zumbro systems compared to the others (Figure 6A). However, BIBI scores differed significantly among years at only three of the 30 stream sites where three or more years of samples were collected (Table 3). Distributions of samples among the various BIBI rating categories also differed significantly (Chi-square = 73.8, df = 12, p < 0.001) among watersheds (Figure 6B), with Root and Zumbro watersheds having 14% or more of their samples rated good or excellent, whereas no single sample from the other systems ever rated higher than fair. Overall, a majority (63.3%) of all samples were rated as poor or very poor, whereas only a small proportion (13.5%) was rated as good or excellent. BIBI sample scores were significantly correlated with both taxa richness and measures, and both diversity indices, although correlations were higher with the taxa richness variables than with the diversity indices (Figure 3, Table 5).
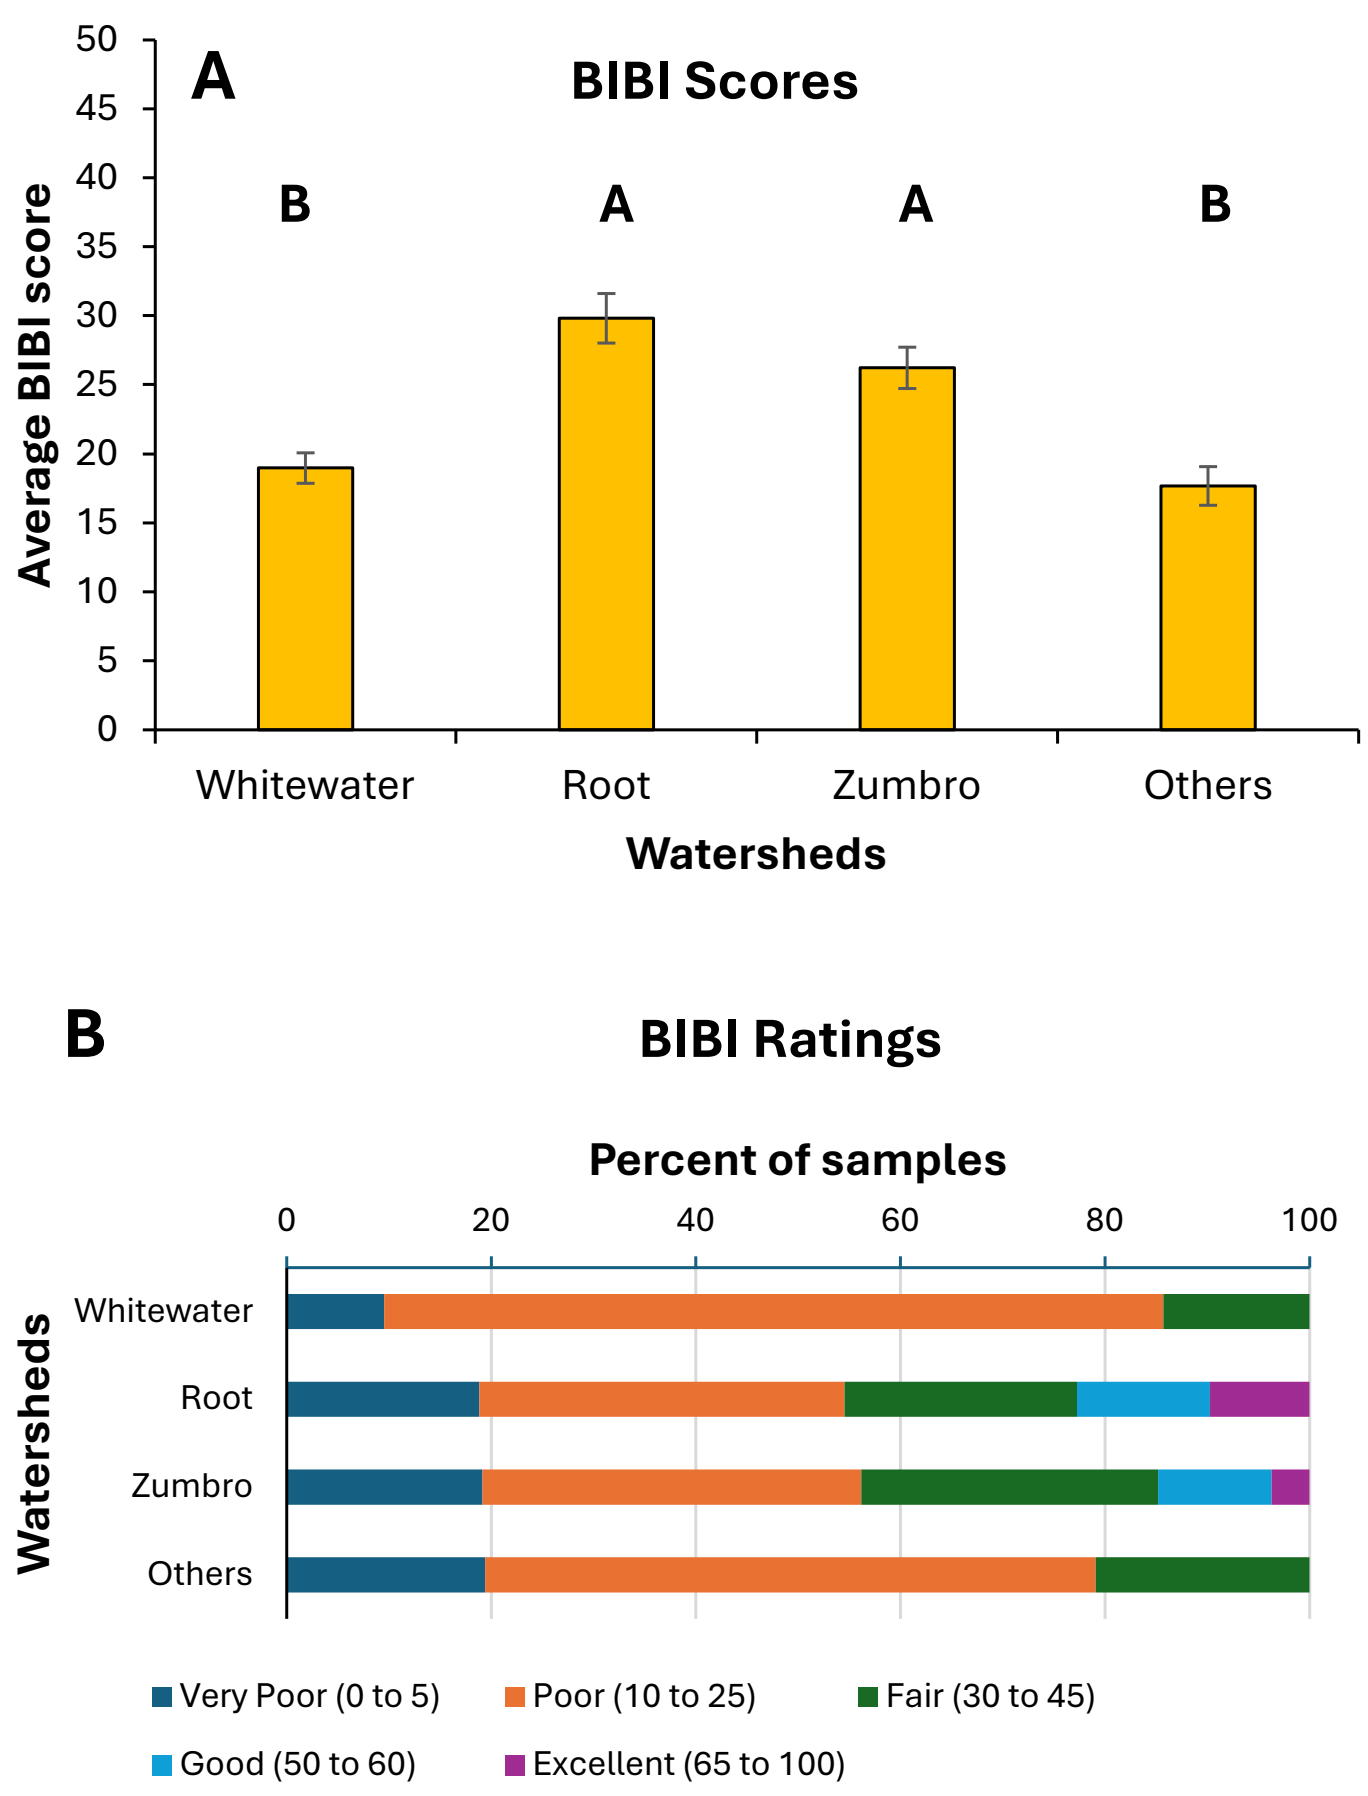
Figure 6. Mean (±1 standard error) benthic index of biotic integrity (BIBI) scores of benthic macroinvertebrate samples (A) and distribution of samples among BIBI rating categories (B) for 452 collections made by citizen scientists in four watersheds in southeastern Minnesota during 1999–2013. Mean BIBI score bars with different letters above them are significantly different from one another (Tukey’s HSD test, p < 0.05). Watershed sample sizes were: Whitewater = 64, Root = 155, Zumbro = 163, Others = 67.
When relationships between BIBI scores and the taxa richness variables were examined within each watershed, ANCOVA indicated that there were significant differences in both total taxa richness-BIBI and EPT taxa richness-BIBI regression variables (Y intercept, slope) among watersheds (Table 6, Figure 7A,B). For Root River watershed samples, BIBI scores increased more quickly (i.e., steeper regression slope) with increasing taxa richness (both total and EPT), whereas for Whitewater River watershed samples, BIBI scores increased more slowly (i.e., shallower regression slope) with increasing richness values (Figure 7A,B). Regressions for the Zumbro River and “Other” watersheds were similar and intermediate between the Root and Whitewater regressions.
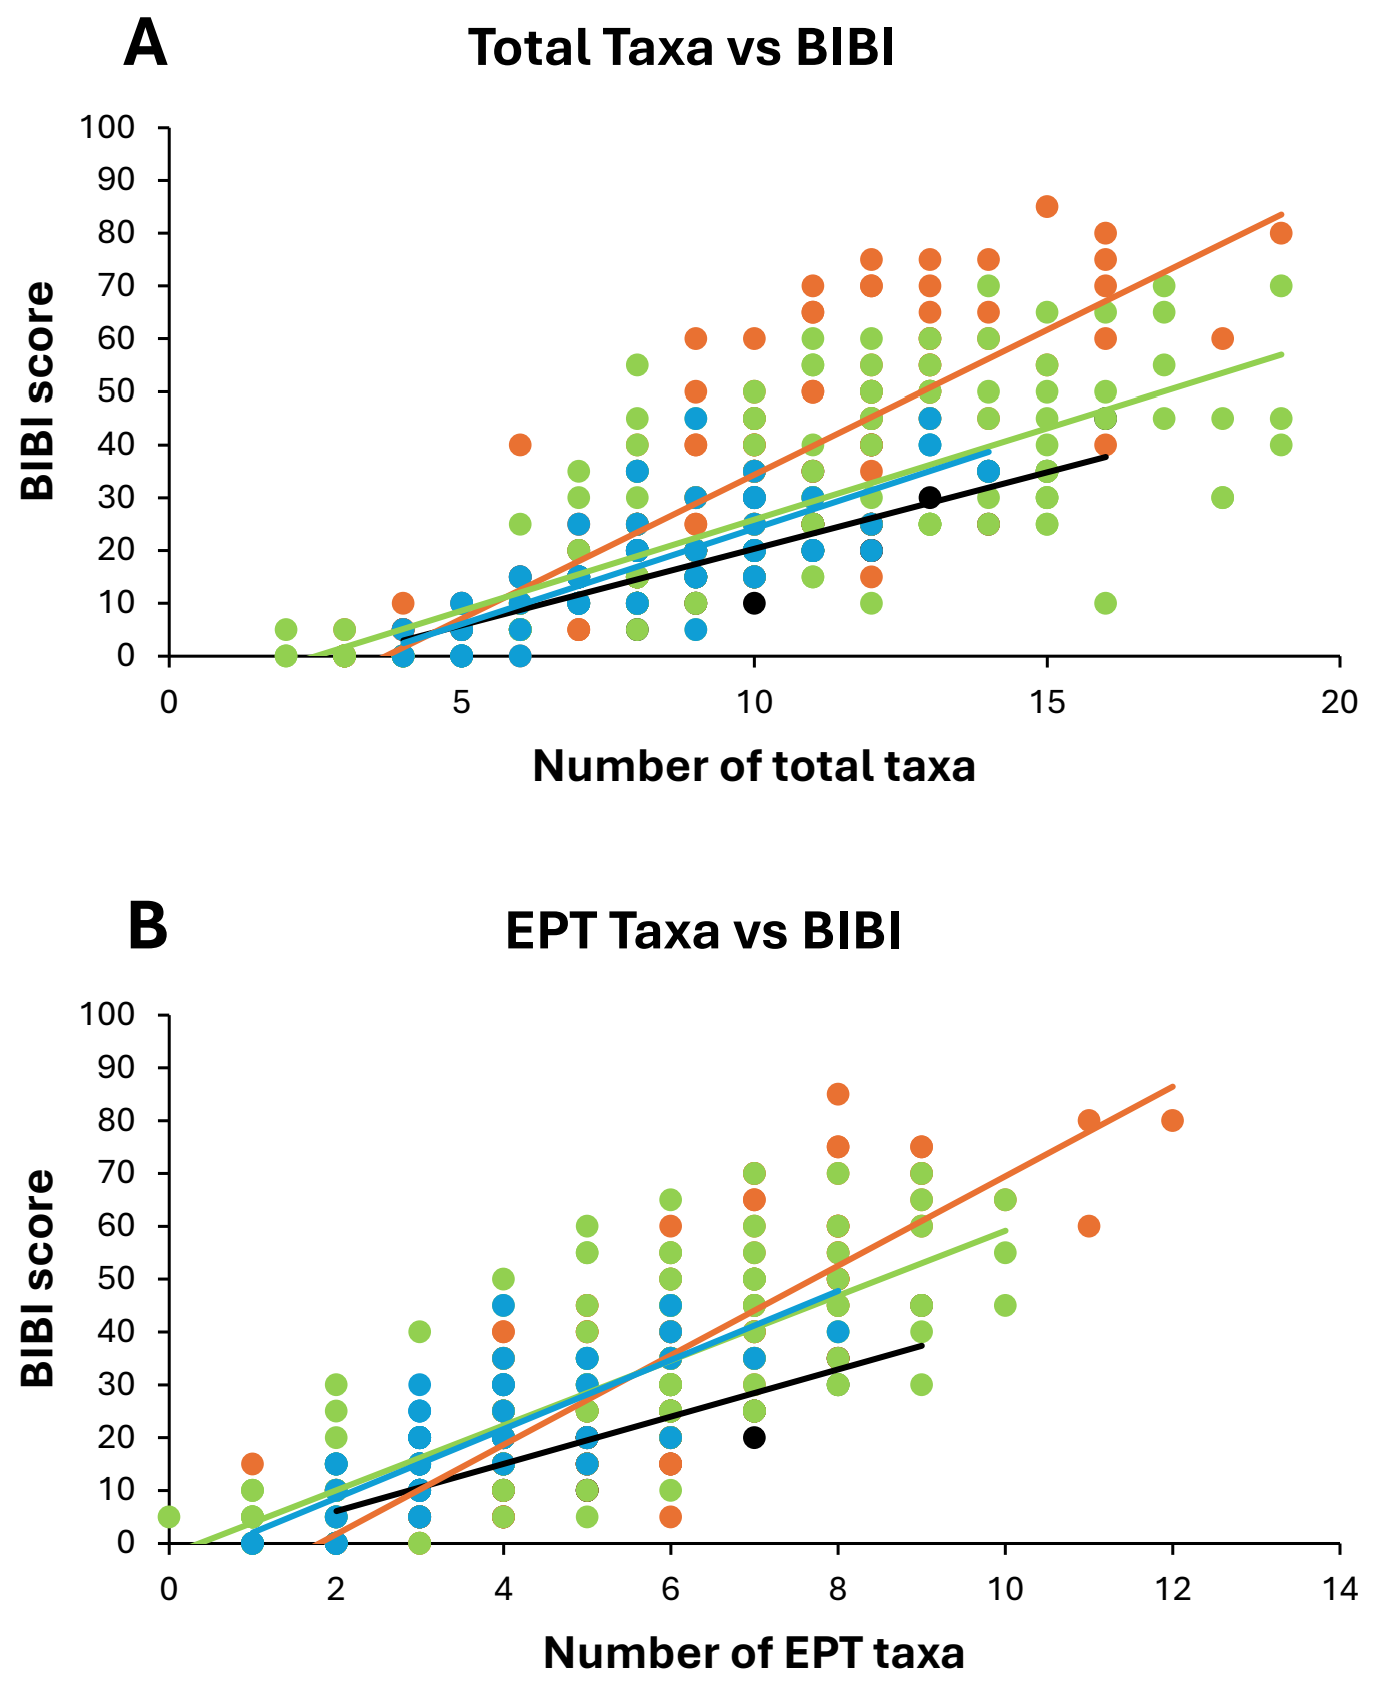
Figure 7. Linear regression relationships between total taxa richness and benthic index of biotic integrity (BIBI) scores (A) and Ephemeroptera-Plecoptera-Trichoptera (EPT) taxa richness and BIBI scores (B) for benthic macroinvertebrate samples collected from four watersheds in southeastern Minnesota, 1999–2013. Watershed sample sizes were: Whitewater = 64, Root = 155, Zumbro = 163, Others = 67. Not all points from each watershed are visible due to value overlays. For both points and lines, orange = Root watershed, green = Zumbro, black = Whitewater, and blue = Other. See Table 4 for ANCOVA statistics.
Table 6. Analysis of covariance statistics of sample taxa richness variables versus biotic integrity scores for 452 samples of benthic macroinvertebrates collected by citizen scientists from streams within four watersheds in southeastern Minnesota, USA, 1999–2013. EPT = Ephemeroptera, Plecoptera, Trichoptera; BIBI = Benthic Index of Biotic Integrity.
|
Comparison/Regression Component |
Degrees of Freedom |
F |
p |
|---|---|---|---|
|
Total taxa richness versus BIBI score |
|||
|
Y intercept |
3, 444 |
22.47 |
<0.0001 |
|
Slope |
3, 441 |
14.37 |
<0.0001 |
|
EPT taxa richness versus BIBI score |
|||
|
Y intercept |
3, 444 |
11.78 |
<0.0001 |
|
Slope |
3, 441 |
10.42 |
<0.0001 |
5. Discussion
This study revealed several important findings about the usefulness of macroinvertebrate community data gathered by citizen scientists from streams and rivers in southeastern Minnesota. First, these collections produced sample-based diversity indices, taxa richness metrics, and BIBI scores that were all significantly correlated with each other and generally displayed differences within and among watersheds. Second, streams in the two largest watersheds (Root, Zumbro) with the highest proportions (>20%) of pasture and haylands frequently had higher invertebrate taxa richness, diversity, and biotic integrity than the smaller systems. Finally, based on samples collected by citizen scientists during a 15-year period, a majority (nearly two-thirds) of stream macroinvertebrate communities surveyed in southeastern Minnesota have poor or very poor biotic integrity, indicative of continuing environmental stressors impacting stream systems.
All measures of community structure (diversities, taxa richness metrics, BIBI) calculated from macroinvertebrate samples in this study were significantly correlated with one another. Single-metric diversity and taxa richness values have a long history of use in assessing communities [52], whereas multi-metric biotic integrity scores represent a more recent approach to understanding how communities can be affected by environmental disturbances [6]. Multi-metric approaches like the BIBI have been favored over single metric indices because they combine several different community characteristics (often including both diversity and taxa richness) that may respond slightly differently to environmental stressors [6,7,53]. The BIBI used here included total taxa richness as one of 10 metrics included when deriving a total BIBI score. It also included separate metrics for stonefly and caddisfly taxa richness along with other taxa richness metrics for longevity, tolerance, and feeding guilds, but did not include any specific diversity measure as a metric [49]. This may partially explain why BIBI scores in this study were more strongly correlated to taxa richness measures than to diversity indices.
Of the community indices or metrics determined for each macroinvertebrate sample, only the BIBI determines a condition rating (range from excellent to very poor). The fixed-count protocol (i.e., limiting sample size to approximately 100 organisms; see Section 3) used by volunteers probably underestimated total taxa richness and EPT taxa richness values and overall community diversity levels [38], so direct comparisons of data from this study to taxa richness and diversity values from other studies where entire samples were used would be inappropriate. However, the BIBI was developed for use specifically on 100-count samples [49], so sample, stream, and watershed ratings should be realistic and comparable to other studies using similar multi-metric indices [6,7,53]. Other regional studies e.g., [25,26,27,34,54] conducted using multi-metric benthic macroinvertebrate indices before, during, and after the period of the present study produced stream ratings similar to those presented in this study (see below).
Although macroinvertebrate community metrics differed considerably among streams sampled within each of the watersheds surveyed in southeastern Minnesota, the two largest watersheds (Root, Zumbro) with the highest proportions of pasture and haylands had higher average taxa richness and BIBI scores and marginally higher average diversities than the streams in the smaller watersheds. All watersheds contained a mix of coldwater, coolwater, and warmwater streams, so macroinvertebrate community differences among watersheds likely cannot be attributed to differing thermal conditions. All watersheds also have similar underlying geology, climate, and topography. Land use differed somewhat among watersheds, with the Zumbro and Root systems having considerably more pasture/haylands (>20% in each watershed) than the other watersheds (12% or less) examined. Greater proportions of grass on the landscape may serve to reduce soil erosion and thereby maintain better stream habitat that can support macroinvertebrate communities with greater diversity and biotic integrity [26,34,50]. Another possible explanation for higher taxa richness and BIBI scores in the Root and Zumbro watersheds may arise from watershed size and the degree of isolation from potential colonizers that may have survived a period of significant disturbance. Larger watersheds may be more likely than smaller systems to have one or more subwatersheds that served as macroinvertebrate refugia [55] during major historical disturbances [29,32,33] that likely extirpated sensitive invertebrates from much of the remainder of the watershed. Recolonization within a watershed from these few refugia subwatersheds theoretically could occur over the course of many decades via downstream drift [56,57,58] or slow upstream migration of winged adults [55]. However, smaller watersheds within the region may not have any pockets of surviving sensitive species from which to initiate recolonization. Also, recolonizers may be less likely to arrive from larger neighboring watersheds because aquatic invertebrates are generally poor lateral dispersers [59] and streams located in narrow valleys in different watersheds may be separated by many km (e.g., 10 km or more) of high ridges (typical in the landscape of southeastern Minnesota) that can pose significant dispersal barriers.
During the 15-year monitoring period, streams in the southeastern Minnesota region mostly exhibited poor to very poor biotic integrity based on the macroinvertebrate collections made by citizen scientists. These findings generally are supported by more localized studies of stream invertebrates conducted within the region by professional scientists before [25], during [26,54], and after [27] the time period of this study. An earlier study in the Root watershed by University of Minnesota (U of MN) scientists [25] reported mostly poor, pollution-tolerant macroinvertebrate communities in areas dominated by agriculture. During the same period when citizen scientists were collecting samples for this study, scientists from the U of MN [26] and Winona State University (WSU) [54] reported mostly poor and very poor macroinvertebrate communities in streams within the Whitewater and Root watersheds, respectively. After citizen scientist collections ended, WSU scientists reported poor macroinvertebrate communities throughout the Whitewater watershed [27]. In addition, 19 of the 35 streams monitored by citizen scientists are currently listed as impaired for benthic macroinvertebrates by the Minnesota Pollution Control Agency [28], and all 19 of those streams were rated as fair, poor, or very poor by citizen scientists.
Despite widespread implementation of soil conservation practices, runoff control structures, and livestock manure management systems beginning in the mid-1900s [29,32,33], stream systems in southeastern Minnesota were still being impacted by environmental stressors during the study period. Legacy deposits of eroded soils still blanket river valleys and form steep eroding banks along many regional streams [32], contributing to elevated suspended sediment loads during high flow events [54] and embedding coarse stream bottom substrates with fine-grained silts and clays [27]. Fecal coliform bacteria levels also were high in regional streams after heavy rain events during the study period [54], suggesting continuing problems with controlling livestock waste runoff from pastures and/or feedlots.
6. Conclusions
This study demonstrated that volunteer citizen scientists were able to collect samples of benthic macroinvertebrates that were used to assess and compare stream water quality among several watersheds in southeastern Minnesota, USA. These samples allowed for the calculation of several community measures (taxa richness, diversity, biotic integrity) that were correlated significantly with one another and demonstrated differences in benthic community structure within and among the four watersheds examined. Communities within the two largest watersheds exhibited significantly higher taxa richness and better biotic integrity than those in smaller watersheds, suggestive of protective refugia potentially existing in larger watersheds during past disturbance events and subsequently providing a source of within-watershed recolonizers. Unfortunately, streams in southeastern Minnesota were characterized by mostly poor and very poor biotic integrity based on the macroinvertebrate communities surveyed by citizen scientists, indicative of continued environmental stressors likely acting to reduce water quality and instream habitat conditions.
Acknowledgments
Thank you to the Minnesota Department of Natural Resources-Fisheries for providing sampling and sorting equipment for citizen scientists. Larry Gates was the driving force behind this project and Bill Stark donated many hours to train and supervise volunteers and coordinate sample processing. This project could not have been accomplished without the enthusiasm and support of many citizen science volunteers. Russell Zwiers created the study area base map.
Ethics Statement
Not applicable.
Informed Consent Statement
Not applicable.
Data Availability Statement
Data on which this paper is based can be obtained from the author upon reasonable request.
Funding
This research received no external funding.
Declaration of Competing Interest
The author declares that he has no known competing financial interests or personal relationships that could have appeared to influence the work reported in this paper.
References
- Allan JD, Castillo MM, Capps KA. Stream Ecology: Structure and Function of Running Waters, 3rd ed.; Springer Nature: Cham, Switzerland, 2021. [Google Scholar]
- Hynes HBN. The Ecology of Running Waters; Liverpool University Press: Liverpool, UK, 1970. [Google Scholar]
- Waters TF. Wildstream: A Natural History of the Free Flowing River; Riparian Press: Saint Paul, MN, USA, 2000. [Google Scholar]
- Hynes HBN. The Biology of Polluted Waters; Liverpool University Press: Liverpool, UK, 1960. [Google Scholar]
- Hilsenhoff WL. Using a Biotic Index to Evaluate Water Quality in Streams; Wisconsin Department of Natural Resources Technical Bulletin No. 132; Wisconsin Department of Natural Resources: Madison, WI, USA, 1982. [Google Scholar]
- Karr JR, Chu EW. Restoring Life in Running Waters: Better Biological Monitoring; Island Press: Washington, DC, USA, 1999. [Google Scholar]
- Simon TP. (Ed.). Biological Response Signatures: Indicator Patterns Using Aquatic Communities; CRC Press: Boca Raton, FL, USA, 2003. [Google Scholar]
- Carter JL, Resh VH, Hannaford MJ, Myers MJ. Macroinvertebrates as biotic indicators of environmental quality. In Methods in Stream Ecology, 2nd ed.; Hauer FR, Lamberti GA, Eds.; Academic Press: Burlington, MA, USA, 2006; pp. 805–833. [Google Scholar]
- Lenat DR, Barbour MT. Using benthic macroinvertebrate community structure for rapid, cost-effective, water quality monitoring: Rapid bioassessment. In Biological Monitoring of Aquatic Systems; Loeb SL, Spacie A, Eds.; Lewis Publishers: Boca Raton, FL, USA, 1994; pp. 187–215. [Google Scholar]
- Likens GE. (Ed.). River Ecosystem Ecology: A Global Perspective; Academic Press: San Diego, CA, USA, 2010. [Google Scholar]
- Ingram WM, Mackenthun KM, Bartsch AF. Biological Field Investigative Data for Water Pollution Surveys; United States Department of Interior, Federal Water Pollution Control Administration WP 13; United States Department of Interior: Washington, DC, USA, 1966. [Google Scholar]
- Nerbonne JF, Nelson KC. Volunteer macroinvertebrate monitoring in the United States: Resource mobilization and comparative state structures. Soc. Nat. Resour. 2004, 17, 817–839. DOI:10.1080/08941920490493837 [Google Scholar]
- Edwards PM. The value of long-term stream invertebrate data collected by citizen scientists. PLoS ONE 2016, 11, e0153713. DOI:10.1371/journal.pone.0153713 [Google Scholar]
- Brooks SJ, Fitch B, Davy-Bowker J, Codesal SA. Angler’s Riverfly Monitoring Initiative (ARMI): A UK-wide citizen science project for water quality assessment. Freshw. Sci. 2019, 38, 270–280. DOI:10.1086/703397 [Google Scholar]
- Moolna A, Duddy M, Fitch B, White K. Citizen science and aquatic macroinvertebrates: Public engagement for catchment-scale pollution vigilance. Ecoscience 2020, 27, 303–317. DOI:10.1080/11956860.2020.1812922 [Google Scholar]
- Krabbenhoft CA, Kashian DR. Citizen science data are a reliable complement to quantitative ecological assessments in urban rivers. Ecol. Indic. 2020, 116, 106476. DOI:10.1016/j.ecolind.2020.106476 [Google Scholar]
- von Gönner J, Gröning J, Grescho V, Neuer L, Gottfried B, Hänsch VG, et al. Citizen science shows that small agricultural streams in Germany are in poor ecological status. Sci. Total Environ. 2024, 922, 171183. DOI:10.1016/j.scitotenv.2024.171183 [Google Scholar]
- von Gönner J, Masson T, Köhler S, Fritsch I, Bonn A. Citizen science promotes knowledge, skills and collective action to monitor and protect freshwater streams. People Nat. 2024, 6, 2357–2373. DOI:10.1002/pan3.10714 [Google Scholar]
- Shao GP, Bishop IJ. Citizen science in river monitoring: A systematic literature review of the whys and hows. Front. Environ. Sci. 2025, 13, 1609084. DOI:10.3389/fenvs.2025.1609084 [Google Scholar]
- Harrison S, McSorley B, Sullivan T. The Citizen Science Stream Index—A simple and effective citizen science biomonitoring protocol using six key macroinvertebrate indicator taxa. Sci. Total Environ. 2025, 1009, 181002. DOI:10.1016/j.scitotenv.2025.181002 [Google Scholar]
- Lagrotteria A, Roccatello S, Doretto A. Contribution of citizen science data on the evaluation of local biodiversity of benthic macroinvertebrate communities. Ecologies 2025, 6, 31. DOI:10.3390/ecologies6020031 [Google Scholar]
- Nerbonne JF, Nelson KC. Volunteer macroinvertebrate monitoring: Tensions among group goals, data quality, and outcomes. Environ. Manag. 2008, 42, 470–479. DOI:10.1007/s00267-008-9103-9 [Google Scholar]
- Izaak Walton League of America. Save Our Streams; Izaak Walton League of America: Gaithersburg, MD, USA, 2026. Available online: https://iwla.org/save-our-streams/ (accessed on 13 January 2026).
- Surber T. Biological surveys and investigations in Minnesota. Trans. Am. Fish. Soc. 1923, 52, 225–238. DOI:10.1577/1548-8659(1922)52[225:BSAIIM]2.0.CO;2 [Google Scholar]
- Troelstrup NH, Jr., Perry JA. Water quality in southeastern Minnesota streams: Observations along a gradient of land use and geology. J. Minn. Acad. Sci. 1989, 55, 6–13. Available online: https://digitalcommons.morris.umn.edu/jmas/vol55/iss1/2/ (accessed on 20 January 2026).
- Nerbonne BA, Vondracek B. Effect of local land use on physical habitat, benthic macroinvertebrates, and fish in the Whitewater River, Minnesota, USA. Environ. Manag. 2001, 28, 87–99. DOI:10.1007/s002670010209 [Google Scholar]
- Varela WL, Mundahl ND, Bergen S, Staples DF, Cochran-Biederman J, Weaver CR. Physical and biological stream health in an agricultural watershed after 30+ years of targeted conservation practices. Water 2023, 15, 3475. DOI:10.3390/w15193475 [Google Scholar]
- Minnesota Pollution Control Agency. River and Stream Biological Monitoring; Minnesota Pollution Control Agency: Saint Paul, MN, USA, 2026. Available online: https://www.pca.state.mn.us/air-water-land-climate/river-and-stream-biological-monitoring (accessed on 3 January 2026).
- Waters TF. The Streams and Rivers of Minnesota; University of Minnesota Press: Minneapolis, MN, USA, 1977. [Google Scholar]
- Schwartz GM, Theil GA. Minnesota’s Rocks and Waters: A Geological Story; Minnesota Geological Survey Bulletin 37; University of Minnesota Press: Minneapolis, MN, USA, 1963. [Google Scholar]
- Waters TF. Sediment in Streams: Sources, Biological Effects, and Control; American Fisheries Society Monograph 7; American Fisheries Society: Bethesda, MD, USA, 1995. [Google Scholar]
- Trimble SW. Historical Agriculture and Soil Erosion in the Upper Mississippi Valley Hill Country; CRC Press: Boca Raton, FL, USA, 2013. [Google Scholar]
- Thorn WC, Anderson CS, Lorenzen WE, Hendrickson DL, Wagner JW. A review of trout management in southeast Minnesota streams. N. Am. J. Fish. Manag. 1997, 17, 860–872. DOI:10.1577/1548-8675(1997)017<0860:AROTMI>2.3.CO;2 [Google Scholar]
- Vondracek B, Blann KL, Cox CB, Nerbonne JF, Mumford KG, Nerbonne BA, et al. Land use, spatial scale, and stream systems: Lessons from an agricultural region. Environ. Manag. 2005, 36, 775–791. DOI:10.1007/s00267-005-0039-z [Google Scholar]
- Nerbonne JF, Vondracek B. Volunteer macroinvertebrate monitoring: Assessing training needs through examining error and bias in untrained volunteers. J. N. Am. Benthol. Soc. 2003, 22, 152–163. DOI:10.2307/1467984 [Google Scholar]
- Nerbonne JF, Ward B, Ollila A, Williams M, Vondracek B. Effect of sampling protocol and volunteer bias when sampling for macroinvertebrates. J. N. Am. Benthol. Soc. 2008, 27, 640–646. DOI:10.1899/07-101.1 [Google Scholar]
- Hilsenhoff WL. Use of Arthropods to Evaluate Water Quality of Streams; Wisconsin Department of Natural Resources Technical Bulletin Number 100; Wisconsin Department of Natural Resources: Madison, WI, USA, 1977. [Google Scholar]
- Sovell LA, Vondracek B. Evaluation of the fixed-count method for Rapid Bioassessment Protocol III with benthic macroinvertebrate metrics. J. N. Am. Benthol. Soc. 1999, 18, 420–426. DOI:10.2307/1468455 [Google Scholar]
- Fischer H, Cho H, Storksdieck M. Going beyond hooked participants: The nibble-and-drop framework for classifying citizen science participation. Citiz. Sci. 2021, 10, 1–18. DOI:10.5334/cstp.350 [Google Scholar]
- Eveleigh A, Jennett CI, Blandford AE, Brohan P, Cox AL. Designing for dabblers and deterring drop-outs in citizen science. In Proceedings of the SIGCHI Conference on Human Factors in Computing Systems, Toronto, ON, Canada, 26 April–1 May 2014; pp. 2984–2994. DOI:10.1145/2556288.2557262 [Google Scholar]
- Hilsenhoff WL. Key to Genera of Wisconsin Plecoptera (Stonefly) Nymphs, Ephemeroptera (Mayfly) Nymphs, Trichoptera (Caddisfly) Larvae; Wisconsin Department of Natural Resources Research Report 67; Wisconsin Department of Natural Resources: Madison, WI, USA, 1970. [Google Scholar]
- Hilsenhoff WL. Aquatic Insects of Wisconsin: Generic Keys and Notes on Biology, Ecology and Distribution; Technical Bulletin No. 89; Wisconsin Department of Natural Resources: Madison, WI, USA, 1975. [Google Scholar]
- Pennak RW. Fresh-Water Invertebrates of the United States, 2nd ed.; John Wiley & Sons: New York, NY, USA, 1978. [Google Scholar]
- Merritt RW, Cummins KW. (Eds.) An Introduction to the Aquatic Insects of North America, 2nd ed.; Kendall-Hunt Publishing Company: Dubuque, IA, USA, 1984. [Google Scholar]
- Thorp JH, Covich AP. (Eds.) Ecology and Classification of North American Freshwater Invertebrates; Academic Press: San Diego, CA, USA, 1991. [Google Scholar]
- Wiggins GB. Larvae of the North American Caddisfly Genera (Trichoptera), 2nd ed.; University of Toronto Press: Toronto, ON, Canada, 1996. [Google Scholar]
- Bouchard RW, Jr. Guide to Aquatic Invertebrates of the Upper Midwest: Identification Manual for Students, Citizen Monitors, and Aquatic Resource Professionals; University of Minnesota: Minneapolis, MN, USA, 2004. [Google Scholar]
- Brower JE, Zar JH, von Ende CN. Field and Laboratory Methods for General Ecology, 4th ed.; WCB McGraw-Hill: Boston, MA, USA, 1998. [Google Scholar]
- Wittman E, Mundahl ND. Development and Validation of a Benthic Index of Biotic Integrity (B-IBI) for Streams in Southeastern Minnesota; Winona State University, College of Science and Engineering: Winona, MN, USA, 2003. [Google Scholar]
- Magner JA, Vondracek B, Brooks KN. Grazed riparian management and stream channel response in southeastern Minnesota (USA) streams. Environ. Manag. 2008, 42, 377–390. DOI:10.1007/s00267-008-9132-4 [Google Scholar]
- Kirkman TW. Statistics to Use; College of Saint Benedict/Saint John University: Saint Joseph, MN, USA, 1996. Available online: http://www.physics.csbsju.edu/stats/ (accessed on 10 January 2026).
- Krebs CJ. Ecological Methodology; Harper and Row: New York, NY, USA, 1989. [Google Scholar]
- Plafkin JL, Barbour MT, Porter KD, Gross SK, Hughes RM. Rapid Bioassessment Protocols for Use in Streams and Rivers: Benthic Macroinvertebrates and Fish; United States Environmental Protection Agency EPA/444/4-89-001; United States Environmental Protection Agency: Washington, DC, USA, 1989. [Google Scholar]
- Mundahl ND. Characterizing stream condition with benthic macroinvertebrates in southeastern Minnesota, USA: Agriculture, channelization, and karst geology impact lotic habitats and communities. Insects 2025, 16, 59. DOI:10.3390/insects16010059 [Google Scholar]
- Williams DD, Williams NE. The upstream/downstream movement paradox of lotic invertebrates: Quantitative evidence from a Welsh mountain stream. Freshw. Biol. 1993, 30, 199–213. DOI:10.1111/j.1365-2427.1993.tb00802.x [Google Scholar]
- Cano-Barbacil C, Sinclair JS, Welti EAR, Haase P. Recovery and degradation drive changes in the dispersal capacity of stream macroinvertebrate communities. Glob. Change Biol. 2025, 31, e70054. DOI:10.1111/gcb.70054 [Google Scholar]
- Mackay RJ. Colonization by lotic macroinvertebrates: A review of processes and patterns. Can. J. Fish. Aquat. Sci. 1992, 49, 617–628. DOI:10.1139/f92-071 [Google Scholar]
- Waters TF. Recolonization of denuded stream bottom areas by drift. Trans. Am. Fish. Soc. 1964, 93, 311–315. DOI:10.1577/1548-8659(1964)93[311:RODSBA]2.0.CO;2 [Google Scholar]
- Petersen I, Winterbottom JH, Orton S, Friberg N, Hildrew AG, Spiers DC, et al. Emergence and lateral dispersal of adult Plecoptera and Trichoptera from Broadstone Stream, U.K. Freshw. Biol. 1999, 42, 401–416. DOI:10.1046/j.1365-2427.1999.00466.x [Google Scholar]