Geospatial Analysis of Energy Requirements for Supplying Desalinated Seawater to the Greek Territory

Geospatial Analysis of Energy Requirements for Supplying Desalinated Seawater to the Greek Territory

Received: 21 December 2025 Revised: 04 January 2026 Accepted: 30 January 2026 Published: 05 February 2026

© 2026 The authors. This is an open access article under the Creative Commons Attribution 4.0 International License (https://creativecommons.org/licenses/by/4.0/).
1. Introduction
1.1. Prolegomena
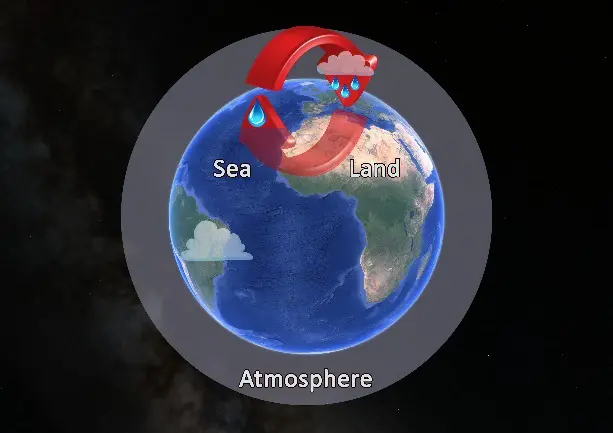
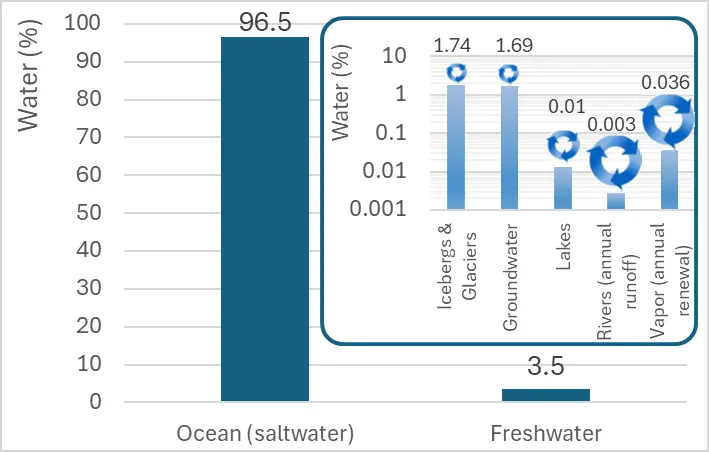
Although Earth is covered by water (~71% of its surface), ~97.5% is saline, with only ~1% readily accessible as renewable freshwater in rivers, lakes, and groundwater [1] (Figure 1).
 |
 |
|
(a) |
(b) |
Figure 1. (a) Graphical abstract of the hydrological cycle; (b) Distribution of water on the planet and the dynamics of the renewal in different types of water.
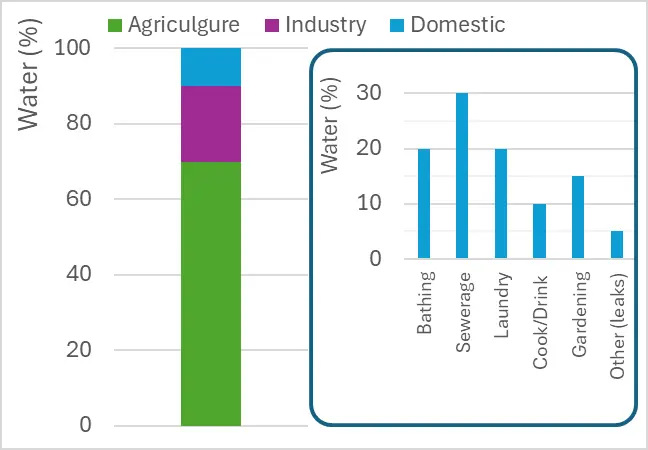
Global freshwater withdrawals are dominated by agriculture (~70%), followed by industry (~20%) and domestic use (~10–12%), with hygiene accounting for most household consumption while direct drinking is only 1–5% (Figure 2) [2,3,4,5].
 |
 |
|
(a) |
(b) |
Figure 2. (a) The water sources (surface water, groundwater) and basic water uses (agriculture, industry, domestic). (b) Categories of water uses (total) and domestic water uses.
Per-capita consumption has risen dramatically, from 5–10 m3/year in pre-industrial societies [6,7,8] to ~63 m3/year (173 L/day) in modern Greece [9,10] driven by infrastructure, population growth, urbanization, and improved hygiene standards, while minimum health requirements are ~18.5 m3/year (50 L/day) [11]. Despite dynamic renewal of surface water, 2.1 billion people still lack safely managed drinking water, 3.4 billion lack sanitation, and 1.7 billion lack basic hygiene according to 2025 WHO/UNICEF data [12].
Traditional sources are increasingly strained by climate variability [13,14], seasonal fluctuations, and over-reliance on slow-recharging groundwater [15,16], making alternative solutions, such as desalination, a strategic priority, particularly in coastal nations [17,18,19].
1.2. Objectives of the Study
The main objectives of this study are:
-
To develop and apply a high-resolution GIS-based methodology capable of spatially estimating the total energy requirements (desalination + pumping + frictional losses) needed to supply desalinated seawater to meet domestic water demand across the Greek territory.
-
To quantify and visualize the spatial variability of specific energy intensity (kWh/m3) and total daily energy needs (kWh/day), highlighting differences between coastal, near-coastal, and inland regions as well as intra-urban heterogeneity.
-
To provide an order-of-magnitude assessment of the additional electricity consumption that would be required under a hypothetical scenario in which desalination fully covers domestic water needs in Greece, thereby contributing to the discussion of the water–energy nexus in a water-scarce Mediterranean country.
1.3. Desalination
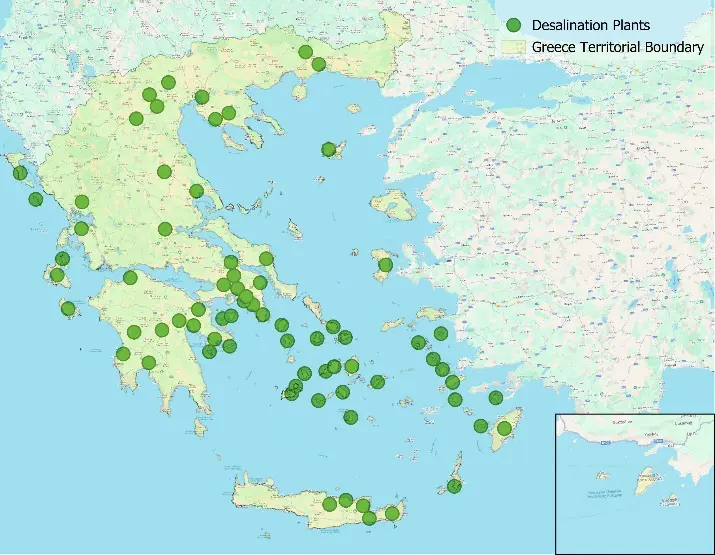
Greece, particularly its islands and coastal regions—which lack extensive water supply infrastructure and face heightened pressure from tourism—has increasingly turned to seawater desalination in recent years as a reliable alternative solution. This technology is widely regarded as mature and effective.
Among available desalination techniques, seawater reverse osmosis (SWRO) has emerged as the dominant and most advanced method, accounting for more than 60% of global installed desalination capacity [20]. The process involves passing seawater or brackish water through semi-permeable membranes under pressure exceeding osmotic pressure, thereby removing salts and producing fresh water.
Energy consumption remains the primary operational constraint of this technology. Modern desalination plants require approximately 3–5 kWh/m3 of produced water, depending on operating conditions and feedwater salinity [21,22,23]. In Greece, thermal methods (e.g., multi-effect distillation) have been piloted; however, SWRO remains the dominant technology due to its energy efficiency and suitability for decentralized island applications.
Installation and operating costs vary based on plant capacity, feedwater quality, and pretreatment technology. For large-scale plants, total water production costs are estimated at 0.50–2.5 USD/m3, of which roughly 40–45% is attributable to energy expenses [24].
At the European level, Greece ranks in the top five for active desalination capacity within the EU, though it lags considerably behind Spain, the undisputed leader in European desalination [25] (Figure 3). Currently, Greece operates more than 165 desalination units, with a combined production exceeding 150,000 m3/day. The majority of installations, implemented since the 1990s, employ SWRO technology in small- to medium-scale plants. Notably, the Corfu desalination plant—the country’s largest—has a total capacity of 14,500 m3/day, while units in the southeastern regions range from 100 to 4500 m3/day [26].
Recent studies on Greek islands indicate substantial variations in water production costs, which predominantly rely on desalination. A related study estimated domestic water costs in the Aegean islands at approximately 2.56 €/m3 in Mykonos and 1 €/m3 in Skyros [27].
1.4. Case Study Area
Greece exhibits pronounced geographical diversity, particularly in its hydrogeology and climate. Covering an area of approximately 131,960 km2, it features one of Europe’s most mountainous terrains, with roughly 75% of its surface comprising mountainous and semi-mountainous zones [30].
The country’s morphology is characterized by extensive high-altitude mountain ranges, numerous rocky areas, valleys, and islands ranging in size from 10 m2 to 8264.9 km2. These islands are distributed across the two seas bordering the mainland—the Ionian and Aegean Seas—highlighting the nation’s marked climatic variability [31].
Greece’s geographical diversity is further evidenced by its extensive coastline, exceeding 15,000 km in total length—the longest in the Mediterranean Basin—and ranking it among the countries with the world’s most substantial coastlines [32,33]. Given that the highest population densities and tourism development are concentrated in coastal areas [34], desalination has become a prevalent technical solution for water supply.
As of 1 January 2023, Greece’s total population stood at 10,413,982 inhabitants, according to the Hellenic Statistical Authority (ELSTAT) [35]. Spatial population distribution displays significant disparities, with a high urbanization rate: approximately 81% of the population resides in urban centers such as Athens, Thessaloniki, and Patras [36]. This concentration intensifies water demand in metropolitan areas, particularly in the Attica region.
Water demand for public supply (drinking water) and irrigation is directly influenced by factors such as urbanization, tourism, agricultural activity, and infrastructure development. In 2022, Greece’s total annual freshwater withdrawals amounted to 10,070 hm3/year. Of this total, irrigation accounted for approximately 8110 hm3/year (around 80%), public supply for 1690 hm3/year, and the remaining 280 hm3/year for industrial use [37].
Water abstracted from surface sources constituted roughly 38% of the total (3830 hm3/year), while the remainder (6220 hm3/year) was derived from groundwater pumping [37].
Greece produces approximately 10 hm3/year of desalinated water, representing about 0.1% of the country’s total water production [37]. However, this proportion is significantly higher in the Aegean islands, where desalination meets 30–95% of public water supply needs. Correspondingly, 56% of desalinated water is sourced from seawater, while 41% comes from brackish water [26].
A methodology is being developed in order to determine the amount of energy needed by every part of the Greek territory to be fully or partially supplied by desalinated water for domestic use premises.
2. Methodology
2.1. Introduction
This study assesses a hypothetical scenario where desalinated seawater fully supplies domestic water demand in the analyzed urban centers (and nationally for extrapolation). Pipelines follow reverse hydrological paths from the coast; surface water and groundwater are not considered. This 100% desalination assumption provides an upper-bound energy estimate that isolates topographic and distance effects. It does not reflect current practices nor advocate full replacement of traditional sources—real deployment would be hybrid, retaining lower-energy freshwater where available.
To estimate the energy requirements associated with desalinated water supply, population density data are derived from databases integrated with geographic information systems (GIS). The total energy demand comprises three primary components: desalination, water conveyance (pumping), and distribution losses.
First, water must be designated, which is an energy intensive process.
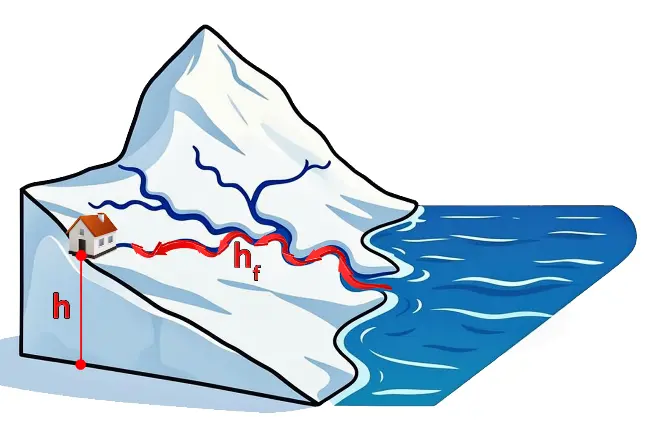
Second, water must be elevated to the consumption altitude, plus an additional margin to ensure adequate pressure for proper system operation. This pumping energy is directly related to the topographic relief of the consumption area (Figure 4).
Third, frictional losses along the conveyance pipeline must be accounted for. To estimate the effective transport distance, the shortest coastal proximity is not used; instead, the analysis adopts the reverse flow path that a raindrop would follow from the consumption point to the sea. Accordingly, the pipeline is assumed to follow this natural drainage path in the opposite direction (uphill), as illustrated in Figure 4.
 |
 |
|
(a) |
(b) |
Figure 4. (a) Anaglyph of a mountain and sea. In the figure, the main hydrological network (main paths of water) is indicated (b) The location of the consumption. The elevation gain (h) determines the gravitational pumping energy, and the path of the water (reverse path of the hydrological network), which estimates the frictional losses (hf).
By summing these components: desalination energy, gravitational pumping energy (elevation gain), and frictional losses along the path, the total required energy consumption is determined.
2.2. Population Density
The use of a gridded demographic dataset is needed to specify the volume of water needed in each part of the Greek territory. The disaggregation of the Greek population was performed by WorldPop [38]. The data sets provide raster depicting constrained estimates of the total number of people per grid at a resolution of 3 arc (approximately 100 m at the equator), but when projected in GGRS 87/Greek Grid, the resolution increases to approximately 80 m. Each cell has units of number of people per pixel. WorldPop constructs many global population data, and in this paper, a top-down constrained modeling method dataset was used. The top-down approach uses national and subnational population census data and a set of covariate layers (night-time lights, distance to roads, land cover, slope, and water bodies) to generate a weighting layer that breaks population totals into grid cells.
The constrained modeling technique creates a binary mask defining zones where it is physically possible for people to live by using satellite-detected building footprints. Once the weighting layer from Random Forest modelling and a constrained mask are created, the actual population counts are assigned to grid cells by enforcing an asymmetric distribution [39,40].
In the current study, the analysis of desalination energy demand focuses on the eight largest urban centers in Greece, which together represent a substantial share of the national population. Specifically, the examined cities are Athens (3,431,430 inhabitants), Thessaloniki (793,421), Heraklion (173,822), Patras (160,140), Larissa (121,462), Volos (97,001), Ioannina (66,209), and Chania (60,767). These eight cities account for approximately 45% of Greece’s total population and therefore capture a significant fraction of the country’s domestic water demand.
To quantify the distributed daily water demand throughout the Greek territory, the WorldPop (ELSTAT adjusted) raster is being multiplied by the average daily water need of one capita (173 litres per day per capita) [3,4].
2.3. Elevation to the Altitude of Consumption
Topological data was derived from FABDEM V1.2 [41], a global dataset containing Digital Terrain Model (DTM) with a spatial resolution of 1 arc-second. Projecting it on the Greek territory, an elevation raster with a spatial resolution of 30 m emerged [42]. FABDEM stands for Forest and Buildings removed Copernicus DEM. Unlike Digital Surface Models (DSMs), which capture surface features like forests and buildings, and define them as ground, FABDEM provides a ‘bare earth’ representation of the terrain. The dataset filters out distortion caused by vegetation and urban artifacts to minimize vertical bias, which is present in Copernicus GLO-30 and SRTM. By applying a random forest regression to these datasets, it renders a new one suitable for precise geomorphological and spatial analysis.
For the purpose of this paper, elevation data is needed to calculate the gravitational potential energy density in kilojoules per cubic meter of water. By applying Equation (1) in a raster calculator, a gravitational potential energy raster, or static head, with a resolution of ~30 m, is generated.
where U is the needed energy per cubic meter for each location; 9.81 is the gravitational acceleration, and FABDEM V1.2 is the elevation of each location.
2.4. Determination of Transmission Path and Friction Energy Losses
Elevation data is also used for determining friction losses throughout the transmission grid. The definition of a realistic path, water follows from the shoreline to meet each pixel’s demand, is a tricky part because assumptions need to be placed in the analysis. The shortest “as the crow flies” perpendicular to the sea distance is not an appropriate modeling variable, since only in few rare occasions do the water pipelines cut inside the terrain via large and expensive technical works and even if they do, the cost and effort of this notion will damage the argument on which we base the paper’s case, that of creating an efficient strategy on the up-scaling the share of desalination as a potable water supplier.
To ensure that a reasonable water’s travel length is being taken into account, and also to make a generalized assumption that covers all parts of the Greek territory, it was postulated that water follows the reversed path of a stream, meaning the pipeline’s route traces the thalweg of valleys. This assumption ensures the alignment of distribution infrastructure on the natural drainage path, utilizing the river’s optimal gradient in reverse. By this technique, excavation works are being minimized and water flows on an upstream trajectory along the river network.
For the determination of the magnitude of friction losses for each cell [43,44], we use the Darcy-Weisbach equation, where the length variable extracts the values from the flow length raster.
Frictional head losses along the conveyance pipeline are calculated using the Darcy-Weisbach (Equation (2)).
where f is the Darcy friction factor, D is pipe diameter (m), V is flow velocity (m/s), g = 9.81 m/s2, and flow_length_raster has been determined as an upstream trajectory along the river network.
Flow velocity (V) is a critical parameter in the design of water supply networks, as it directly governs frictional energy losses and, consequently, overall system requirements. To achieve a realistic balance between capital (construction) [45] and operational (pumping) costs, a design velocity of V = 2.0 m/s is selected (which corresponds to a representative internal pipe diameter of ~1.0 m, yielding a Darcy friction factor f ≈ 0.02), ensuring losses remain within acceptable limits. This diameter approximates a main transmission line in medium- to large-scale systems; real networks would employ variable (branching) diameters, with larger trunks reducing losses. However, the fixed value ensures consistency in this strategic-scale model while providing a conservative estimate for dispersed demand.
Given the turbulent flow regime in closed conduits, the Colebrook-White equation is employed to determine the Darcy friction factor [46]. The analysis adopts high-density polyethylene (HDPE) pipes as the standard material, reflecting their prevalent use in such applications [47]. It was estimated that approximately 4.9 m of pressure head is lost per kilometer of pipeline route.
While routing along reverse natural drainage paths offers a realistic, excavation-minimizing alignment suitable for a national-scale strategic assessment, it represents a conservative assumption. In practice, major inter-basin or long-distance transmission mains often incorporate straighter segments, tunnels, or elevated aqueducts to shorten conveyance distances and reduce frictional losses. Consequently, the present model likely overestimates path lengths and associated energy requirements compared to fully optimized engineering designs. This conservatism strengthens the identification of structurally challenging (e.g., inland) regions while providing an upper-bound estimate of conveyance energy needs.
2.5. Pumping Energy Needs
Pump efficiency ($${\eta }_{\text{pump}}$$) represents the ratio of hydraulic power imparted to the water to the input shaft power. For centrifugal pumps commonly used in external water conveyance systems, a design value of $${\eta }_{\text{pump}}=0.80$$ (typical range: 70–90%) is adopted at the best efficiency point.
Pressure head ($$p/\gamma$$) expresses residual pressure in energy terms (m). To ensure reliable delivery and system operation, a minimum delivery pressure head of 15 m (≈1.5 bar) is specified [48]. Energy for subsequent intra-urban distribution, such as booster stations, elevated storage, or neighborhood piping, is not included. The model, therefore, estimates requirements to a distributed ‘entry point’ level rather than full end-use delivery within buildings.
Desalination energy intensity is quantified by the specific energy consumption (SEC) in kWh/m3. For SWRO plants employed herein, a representative SEC of 5 kWh/m3 is selected. SEC varies with feedwater salinity, temperature, pretreatment type, and desalination method [49,50,51]; however, a representative SEC is adopted, as it reflects typical values for older or conservative plant designs [52]. Additional plant-side energy costs, such as seawater intake, pretreatment, and brine pumping/discharge, are not included in the analysis, consistent with the focus on core desalination SEC and long-distance conveyance to consumption points.
The total dynamic head (kWh/m3) for each point is estimated with Equation (3).
The desalination component (SEC = 5 kWh/m3) is a fixed value applied to all produced water and represents only the energy for the SWRO process itself. Plants are implicitly distributed along the coastline, with water routed uphill via reverse drainage paths to minimize infrastructure costs and energy for transport. Gravitational (static head) and frictional losses are additional and account solely for post-production conveyance and distribution pumping.
2.6. Evaluation of the GIS-Based Geospatial Approach
As presented above, this study employs a high-resolution GIS-based geospatial framework to estimate energy requirements for desalinated water supply across Greece’s diverse terrain. This method was chosen over traditional lumped models (e.g., average elevations or straight-line distances) or detailed site-specific engineering designs for the following reasons:
-
Captures spatial heterogeneity: Using gridded data, it accounts for elevation variations and intra-city differences in rugged, mountainous terrain, revealing disparities that aggregated approaches overlook.
-
Realistic routing: Pipelines follow reverse natural drainage paths (valley thalwegs), providing feasible, cost-effective conveyance lengths and frictional losses—more accurate than straight-line approximations in complex topography.
-
Scalability and transparency: Integrates open global datasets with standard GIS tools, enabling national-scale analysis, reproducibility, and easy extension to scenarios (e.g., partial supply or irrigation).
-
Systematic energy breakdown: Quantifies desalination (fixed SEC = 5 kWh/m3), gravitational pumping, and frictional losses separately, using realistic parameters (e.g., HDPE pipes, V = 2 m/s).
The GIS approach balances accuracy, feasibility, and insight into spatial disparities, ideal for policy-oriented evaluation of desalination expansion. More advanced methods (e.g., full network optimization) exceed the scope of this strategic, order-of-magnitude assessment.
3. Results and Discussion
The GHSL Urban Centre Database (GHS-UCDB) uses the degree of urbanization (DEGURBA) method to target high density human settlements. Unlike administrative boundaries, this method provides a sound physical definition of a city taking into account population density and built-up structures [53,54].
Based on the foregoing analysis, GIS data are employed to evaluate a hypothetical scenario in which desalination fully meets the water demands of Greece’s eight largest urban centers. Desalinated water is assumed to be produced at coastal facilities, with conveyance pipelines following the reverse flow path of the natural hydrological network toward each city.
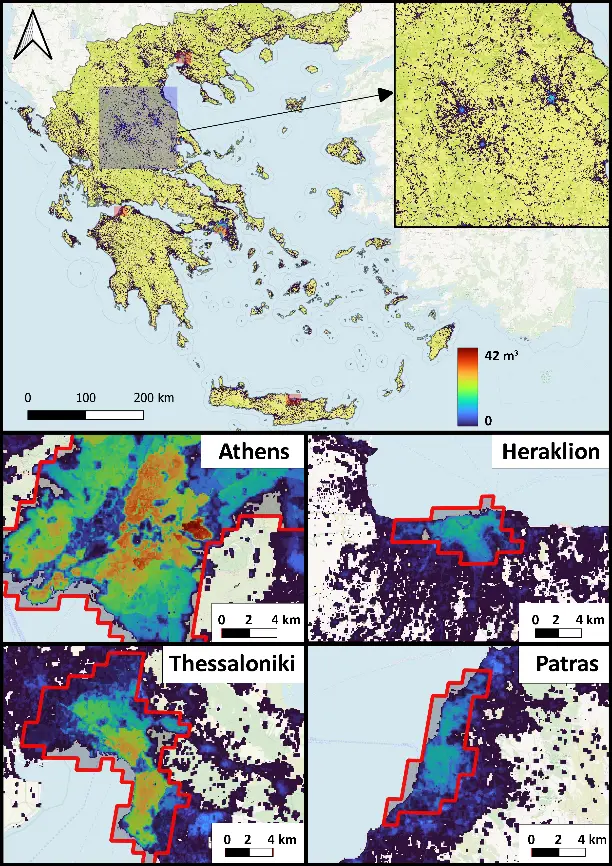
In Figure 5a, the limits of the cities are marked in red and for each city, the following parameters are estimated:
-
-
Daily water demand (m3/day) (Figure 5a)
-
-
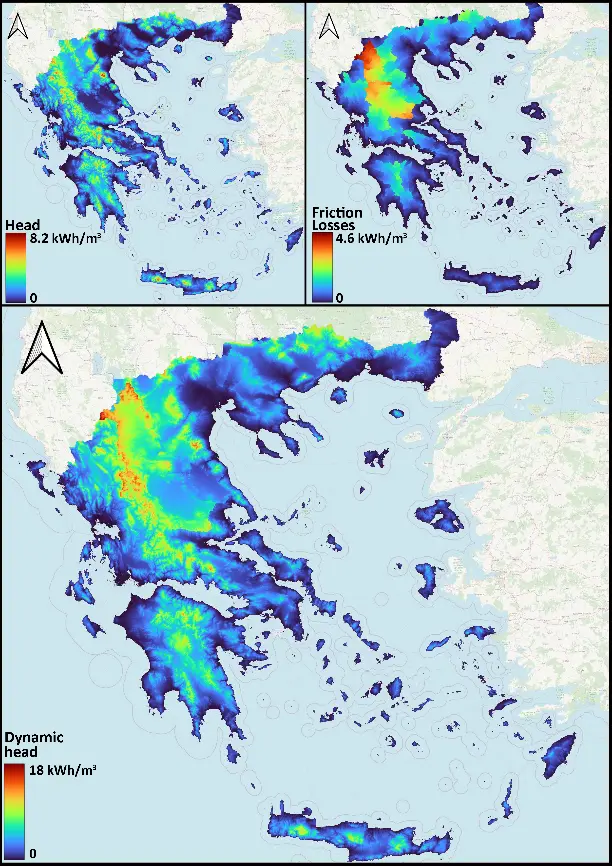
Pumping energy for elevation (kWh/m3) (Figure 5b top-left)
-
-
Frictional losses ($${h}_{f}$$, in kWh/m3) (Figure 5b top-right)
-
-
Total specific energy requirement (dynamic head, in kWh/m3) (Figure 5b bottom)
-
-
Total daily energy for production and conveyance (kWh/day)
(a)
(b)
Figure 5. (a) Water needs. (b) Top left, energy needs for elevation; top right, friction losses; bottom, total dynamic head.
The head parameter quantifies the specific energy required for elevation, arising from the altitudinal difference between the coastal desalination plant and each consumption point. Although Athens exhibits the highest total energy demand (23,691 kWh/day), Ioannina records by far the greatest mean specific elevation energy (1.4 kWh/m3), indicating consistently high pumping requirements for conveyance to the city. In contrast, cities such as Chania (0.07 kWh/m3), Volos (0.08 kWh/m3), and Patras (0.10 kWh/m3) display low mean values due to their lower elevations (Table 1).
Athens also shows the largest standard deviation (0.27 kWh/m3), attributable to its extensive spatial coverage and varied sub-regional elevations. Thessaloniki shows the highest energy intensity (0.20 kWh/m3), while Ioannina exhibits considerably lower dispersion (0.10 kWh/m3). Combined with its high mean, this suggests uniformly elevated energy intensity across the area, with variability playing a secondary role. Lower variability is observed in Chania (0.08 kWh/m3) and Volos (0.07 kWh/m3), whereas Larissa demonstrates near-zero dispersion, confirming its location on a flat plain and minimal intra-city variation in pumping costs.
Table 1. Pumping energy for elevation for 8 cities and Greece in total.
|
City |
Mean (kWh/m3) |
Standard Deviation (kWh/m3) |
Minimum (kWh/m3) |
Maximum (kWh/m3) |
|---|---|---|---|---|
|
Athens |
0.4 |
0.3 |
0 |
1.9 |
|
Thessaloniki |
0.2 |
0.2 |
0 |
1.1 |
|
Heraklion |
0.1 |
0.1 |
0 |
0.4 |
|
Patras |
0.1 |
0.1 |
0 |
0.6 |
|
Larissa |
0.2 |
0.0 |
0.2 |
0.3 |
|
Volos |
0.1 |
0.1 |
0 |
0.5 |
|
Ioannina |
1.4 |
0.1 |
1.3 |
1.8 |
|
Chania |
0.1 |
0.1 |
0 |
0.5 |
|
Greece |
1.4 |
1.2 |
0 |
8.16 |
Frictional losses ($${h}_{f}$$) are highest in Athens, Ioannina, and Larissa. Athens records the greatest total (11,607 kWh/m3), primarily due to its extensive considered area (411 km2) and the aggregation of numerous GIS cells. Additionally, Athens’ spatial heterogeneity—with consumption points varying significantly in distance from the coast—elevates $${h}_{f}$$ in many sub-areas (Table 2).
However, mean specific frictional losses (0.2 kWh/m3) in Athens (0.2 kWh/m3) are substantially lower than in Ioannina (1.2 kWh/m3) and Larissa (1.0 kWh/m3). This disparity arises because the latter cities are located inland, resulting in longer conveyance paths from the coast and, consequently, higher friction.
The standard deviation of $${h}_{f}$$ reflects intra-city variability in hydraulic difficulty along individual paths. Low values indicate relatively uniform path lengths or gradients, whereas high values signify a mix of short and long routes. Athens exhibits relatively high dispersion (0.13 kWh/m3; range: 0–0.47 kWh/m3), driven by internal spatial differentiation. In contrast, Larissa and Ioannina show low variability (0.05 kWh/m3 and 0.03 kWh/m3, respectively), implying consistently unfavorable and homogeneous paths.
In summary, frictional losses in Larissa and Ioannina represent a structural cost (remote from the coast with uniformly demanding routes), whereas in Athens they stem predominantly from internal spatial heterogeneity. High total losses hf_sum in major metropolises (Athens, Thessaloniki) result from the aggregation of numerous spatial elements, while in inland cities (Ioannina, Larissa) they arise from inherently challenging conveyance paths.
Table 2. Frictional losses (kWh) for 8 cities and Greece in total.
|
City |
Mean (kWh/m3) |
Standard Deviation (kWh/m3) |
Minimum (kWh/m3) |
Maximum (kWh/m3) |
|---|---|---|---|---|
|
Athens |
0.2 |
0.13 |
0 |
0.47 |
|
Thessaloniki |
0.1 |
0.05 |
0 |
0.2 |
|
Heraklion |
0.0 |
0.02 |
0 |
0.1 |
|
Patras |
0.0 |
0.02 |
0 |
0.1 |
|
Larissa |
1.0 |
0.05 |
0.9 |
1.1 |
|
Volos |
0.0 |
0.02 |
0 |
0.1 |
|
Ioannina |
1.2 |
0.03 |
1.2 |
1.3 |
|
Chania |
0.0 |
0.02 |
0 |
0.1 |
|
Greece |
0.8 |
0.9 |
0 |
4.56 |
The dynamic head represents the total specific energy cost per cubic meter, incorporating pump efficiency, residual pressure head, and desalination energy consumption (5 kWh/m3) (Table 3).
In terms of mean values, Ioannina exhibits by far the highest energy cost (8.3 kWh/m3), coupled with low standard deviation (0.14 kWh/m3), indicating uniformly high requirements across the area. Larissa follows with a similarly elevated mean (6.6 kWh/m3) and the lowest dispersion (near zero), signifying consistent energy demands throughout the city zone.
Among coastal cities, Athens records the highest mean (5.8 kWh/m3), accompanied by the greatest standard deviation (0.49 kWh/m3) and the widest range (5.1–7.9 kWh/m3). This variability is attributable to pronounced internal spatial heterogeneity.
Table 3. Dynamic head needed for 8 cities and Greece in total (kWh/m3).
|
City |
Mean (kWh/m3) |
Standard Deviation (kWh/m3) |
Minimum (kWh/m3) |
Maximum (kWh/m3) |
|---|---|---|---|---|
|
Athens |
5.8 |
0.49 |
5.1 |
7.9 |
|
Thessaloniki |
5.4 |
0.30 |
5.1 |
6.7 |
|
Heraklion |
5.3 |
0.15 |
5.1 |
5.7 |
|
Patras |
5.2 |
0.14 |
5.1 |
5.9 |
|
Larissa |
6.6 |
0.07 |
6.4 |
6.7 |
|
Volos |
5.2 |
0.11 |
5.1 |
5.8 |
|
Ioannina |
8.3 |
0.14 |
8.2 |
8.9 |
|
Chania |
5.2 |
0.11 |
5.1 |
5.7 |
|
Greece |
7.7 |
2.2 |
5.1 |
18.9 |
The total energy parameter (Figure 6 and Table 4) denotes the total daily electrical energy requirement (kWh/day) for producing and conveying the necessary water volume to each urban area. As an aggregated daily total, it scales directly with demand, explaining why Athens records the highest value (~3.35 GWh/day).
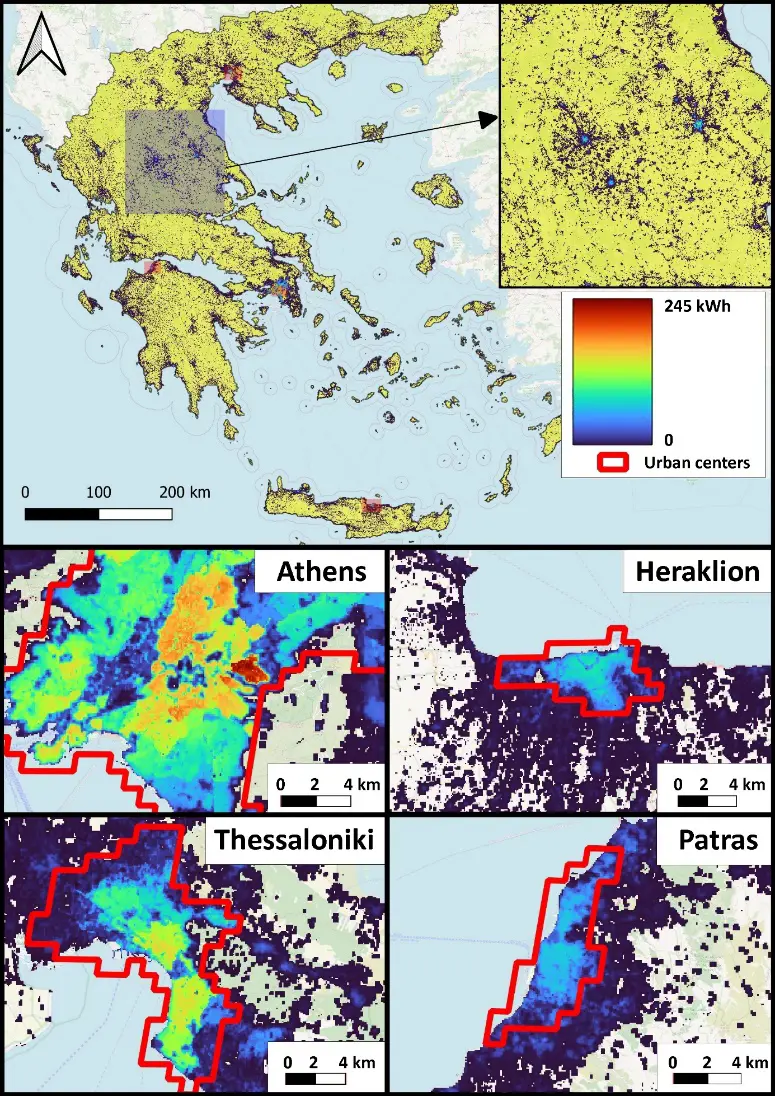
Table 4. Total energy (kWh/day) for 8 cities and Greece in total.
|
City |
Sum (kWh/Day) |
Mean (kWh/Day) |
Standard Deviation (kWh/Day) |
Minimum (kWh/Day) |
Maximum (kWh/Day) |
|---|---|---|---|---|---|
|
Athens |
3,349,401 |
60.1 |
47.3 |
0 |
243 |
|
Thessaloniki |
723,708 |
47.3 |
46.7 |
0 |
154 |
|
Heraklion |
157,606 |
33.9 |
26.2 |
0 |
87 |
|
Patras |
142,596 |
31.1 |
21.6 |
0.1 |
71 |
|
Larissa |
138,466 |
43.0 |
33.6 |
0 |
120 |
|
Volos |
86,464 |
32.7 |
21.1 |
0.1 |
72 |
|
Ioannina |
95,503 |
34.3 |
29.9 |
0 |
110 |
|
Chania |
54,146 |
26.8 |
19.4 |
0 |
77 |
|
Greece |
11,180,669 |
2.4 |
10.2 |
0 |
243 |
In terms of spatial distribution, Athens also exhibits the highest mean per-cell energy demand (60.13 kWh/day), accompanied by substantial standard deviation (47.30 kWh/day) and the widest range (0–243 kWh/day) nationwide. This reflects a large overall energy footprint driven by scale, coupled with pronounced intra-city variations.
Thessaloniki follows (0.72 GWh/day), with a lower mean (47.3 kWh/day) but comparably high dispersion (46.7 kWh/day). Although Heraklion and Patras rank next in total daily requirements (0.16 and 0.14 GWh/day, respectively), their means (33.9 and 31.1 kWh/day) are lower than those of Larissa and Ioannina (43 and 34.3 kWh/day). This disparity arises from elevated specific frictional losses (hf/m3) in the latter and more compact spatial demand distributions in the coastal cities.
4. Conclusions
This study presents a geospatial methodology for estimating the energy requirements associated with supplying desalinated seawater to meet the full domestic water demand of Greece and Greece’s eight largest urban centers under a hypothetical scenario of water supply from desalination. By integrating GIS-based population density, topographic data, and hydrological flow paths, the analysis quantifies the contributions of desalination, gravitational pumping, and frictional losses to the total energy footprint.
Considering that Greece consumes 137 GWh/day of electricity (daily average 2014–2023 [55]), the big picture indicates that if domestic water were supplied from desalination (11 GWh/day), an additional 8% of the energy consumption would be needed [56,57].
Key findings reveal substantial spatial heterogeneity in total energy intensity (dynamic head, kWh/m3), driven primarily by differences in hydraulic head (elevation and frictional losses along conveyance paths). Inland cities such as Ioannina and Larissa exhibit the highest specific energy costs (mean dynamic head of 8.3 and 6.6 kWh/m3, respectively), driven by elevated altitudes and longer conveyance distances, resulting in uniformly high and consistent requirements. In contrast, coastal metropolises like Athens, while displaying the largest absolute daily energy demand (~3.35 GWh/day) due to scale, show lower mean specific costs (5.8 kWh/m3) but greater intra-city variability attributable to topographic and distance diversity.
Frictional losses further underscore structural challenges in inland areas (uniformly demanding paths) versus scale-driven aggregation in major coastal centers. The reverse-valley routing assumption, while minimizing hypothetical construction impacts, conservatively overestimates frictional losses relative to optimized direct routes with tunneling, which, however, could be balanced by local frictional losses generated by changes in pipeline route direction, which are not estimated.
Overall, the results highlight that densely populated regions can achieve relatively smoother per-capita energy profiles despite high total demands, owing to the moderating influence of proximity to coastal desalination sites. These insights underscore desalination’s viability as a supplementary water source in water-scarce coastal and island contexts, while emphasizing the energy-intensive barriers for inland expansion.
Future research should extend zonal statistics to explore correlations between sea proximity and population clustering to assess the feasibility of meeting irrigation demands. Land-use patterns—particularly mapping agricultural areas, which dominate national withdrawals (~80%)—should also be evaluated.
Furthermore, the capital costs of the requisite infrastructure must be evaluated, as widespread adoption of desalination would necessitate a fundamental shift in water management paradigms. Currently, systems capture water at higher elevations and distribute it downward; in contrast, a desalinated supply would reverse this flow, sourcing water from sea level and pumping it uphill. This inversion alone would require a comprehensive redesign of regulatory frameworks and operational management. Although detailed case-by-case studies are essential, an order-of-magnitude cost estimation would provide valuable preliminary insights.
Finally, the potential role of desalination as an energy storage mechanism within the water–energy–food nexus merits consideration. By operating flexibly during periods of surplus renewable generation—currently curtailed or wasted—desalination could enhance grid stability and resource efficiency.
Statement of the Use of Generative AI and AI-Assisted Technologies in the Writing Process
The authors declare that Generative AI tools as Grok and ChatGPT were used for helping the translation of the manuscript and the optimization of syntax from the original text.
Author Contributions
Conceptualization, G.-F.S.; Methodology, G.-F.S.; Software, G.-F.S. and I.A.; Validation, G.-F.S., I.A. and M.-A.A.; Formal Analysis, I.A. and M.-A.A.; Investigation, G.-F.S., I.A. and M.-A.A.; Resources, G.-F.S., I.A. and M.-A.A.; Data Curation, I.A. and M.-A.A.; Writing-Original Draft Preparation, G.-F.S., I.A. and M.-A.A.; Writing-Review & Editing, G.-F.S., I.A. and M.-A.A.; Visualization, I.A. and M.-A.A.
Ethics Statement
Not applicable.
Informed Consent Statement
Not applicable.
Data Availability Statement
The databases utilized are thoroughly outlined and referenced in the citation provided within the text, and they are publicly available.
Funding
This research has received funding from the European Union’s Horizon Europe research and innovation programme under grant agreement No. 101181779 (WATERSENS—Development of Innovative Decentralized Technologies and New Co-Created Governance Models for Water Sensitive Communities). Views and opinions expressed are however those of the author only and do not necessarily reflect those of the European Union. Neither the European Union nor the granting authority can be held responsible for them.
Declaration of Competing Interest
The authors declare that they have no known competing financial interests or personal relationships that could have appeared to influence the work reported in this paper
References
-
United Nations. UN World Water Development Report 2022. 21 March 2022. Available online: https://www.unwater.org/publications/un-world-water-development-report-2022 (accessed on 21 January 2026).
-
UNESCO. UN World Water Development Report 2022. Groundwater, Making the Invisible Visible. Available online: https://www.unesco.org/reports/wwdr/2022/en (accessed on 21 January 2026).
-
AQUASTAT—FAO’s Global Information System on Water and Agriculture. Available online: https://www.fao.org/aquastat/en/overview/methodology/water-use (accessed on 21 January 2026).
-
Unesco: UN World Water Development Report. Available online: https://www.unesco.org/reports/wwdr/en/2024 (accessed on 21 January 2026).
-
Sargentis G-F, Kougkia M. Vulnerabilities of water-energy and food nexus in cities of digital era. Insight—Civ. Eng. 2024, 7, 608. DOI:10.18282/ice.v7i1.608 [Google Scholar]
-
Sargentis G-F, Mamasis N. Water Collection in Complexes & Residences—Design for Small Scales. 2021. Available online: https://www.itia.ntua.gr/en/docinfo/2131/ (accessed on 21 January 2026).
-
Iliopoulou T, Dimitriadis P, Siganou A, Markantonis D, Moraiti K, Nikolinakou M, et al. Modern Use of Traditional Rainwater Harvesting Practices: An Assessment of Cisterns’ Water Supply Potential in West Mani, Greece. Heritage 2022, 5, 2944–2954. DOI:10.3390/heritage5040152 [Google Scholar]
-
Sargentis G-F, Dimitriadis P, Ioannidis R, Iliopoulou T, Frangedaki E, Koutsoyiannis D. Optimal utilization of water resources for local communities in mainland Greece (case study of Karyes, Peloponnese). Procedia Manuf. 2020, 44, 253–260. DOI:10.1016/j.promfg.2020.02.229 [Google Scholar]
-
Fair & Smart Use of the World’s Fresh Water. Available online: https://www.waterfootprint.org/ (accessed on 21 January 2026).
-
Hoekstra AY, Mekonnen MM. The water footprint of humanity. Proc. Natl. Acad. Sci. USA 2012, 109, 3232–3237. DOI:10.1073/pnas.1109936109 [Google Scholar]
-
Gleick PH. Basic Water Requirements for Human Activities: Meeting Basic Needs. Water Int. 1996, 21, 83–92. DOI:10.1080/02508069608686494 [Google Scholar]
-
WHO/UNICEF JMP Report (2025)—Primary Source: Progress on Household Drinking Water, Sanitation and Hygiene 2000–2024: Special Focus on Inequalities. Available online: https://www.who.int/publications/m/item/progress-on-household-drinking-water--sanitation-and-hygiene-2000-2024--special-focus-on-inequalities (accessed on 21 January 2026).
-
Sargentis G-F, Markantonis D. Water-energy-food nexus and its stochastic dynamics: Case study Greece. Discov. Sustain. 2024, 5, 511. DOI:10.1007/s43621-024-00751-z [Google Scholar]
-
Sargentis G-F, Ioannidis R, Karakatsanis G, Sigourou S, Lagaros ND, Koutsoyiannis D. The Development of the Athens Water Supply System and Inferences for Optimizing the Scale of Water Infrastructures. Sustainability 2019, 11, 2657. DOI:10.3390/su11092657 [Google Scholar]
-
Koutsoyiannis D. Revisiting the global hydrological cycle: Is it intensifying? Hydrol. Earth Syst. Sci. 2020, 24, 3899–3932. DOI:10.5194/hess-24-3899-2020 [Google Scholar]
-
Koutsoyiannis D. Scale of water resources development and sustainability: Small is beautiful, large is great. Hydrol. Sci. J. 2011, 56, 553–575. DOI:10.1080/02626667.2011.579076 [Google Scholar]
-
Sargentis G-F. Issues of Prosperity: Stochastic Evaluation of Data Related to Environment, Infrastructures, Economy and Society. Ph.D. Thesis, National Technical University of Athens, Athens, Greece, 2022. [Google Scholar]
-
Sargentis G-F, Iliopoulou T, Sigourou S, Dimitriadis P, Koutsoyiannis D. Evolution of Clustering Quantified by a Stochastic Method—Case Studies on Natural and Human Social Structures. Sustainability 2020, 12, 7972. DOI:10.3390/su12197972 [Google Scholar]
-
Dimitriadis P, Iliopoulou T, Sargentis G-F, Koutsoyiannis D. Spatial Hurst–Kolmogorov Clustering. Encyclopedia 2021, 1, 1010–1025. DOI:10.3390/encyclopedia1040077 [Google Scholar]
-
Jones E, Qadir M, van Vliet MTH, Smakhtin V, Kang SM. The state of desalination and brine production: A global outlook. Sci. Total Environ. 2019, 657, 1343–1356. DOI:10.1016/j.scitotenv.2018.12.076 [Google Scholar]
-
Gude VG. Energy consumption and recovery in reverse osmosis. Desalination Water Treat. 2011, 36, 239–260. DOI:10.5004/dwt.2011.2534 [Google Scholar]
-
Sargentis G-F, Markatos E, Malamos N, Iliopoulou T. Enhancing Resilience and Self-Sufficiency in the Water–Energy–Food Nexus: A Case Study of Hydroponic Greenhouse Systems in Central Greece. Earth 2025, 6, 95. DOI:10.3390/earth6030095 [Google Scholar]
-
Sargentis G-F, Ioannidis R, Dimitriadis P, Malamos N, Lyra O, Kitsou O, et al. Energy Self-Sufficiency in Rural Areas, Case Study: North Euboea, Greece. Adv. Environ. Eng. Res. 2024, 5, 1–19. DOI:10.21926/aeer.2404025 [Google Scholar]
-
Kettani M, Bandelier P. Techno-economic assessment of solar energy coupling with large-scale desalination plant: The case of Morocco. Desalination 2020, 494, 114627. DOI:10.1016/j.desal.2020.114627 [Google Scholar]
-
Al-Obaidi MA, Alsadaie S, Alsarayreh A, Sowgath MT, Mujtaba IM. Integration of Renewable Energy Systems in Desalination. Processes 2024, 12, 770. DOI:10.3390/pr12040770 [Google Scholar]
-
Zotalis K, Dialynas EG, Mamassis N, Angelakis AN. Desalination Technologies: Hellenic Experience. Water 2014, 6, 1134–1150. DOI:10.3390/w6051134 [Google Scholar]
-
Papathanasiou A-F, Baltas E. Achieving Water and Energy Independence, Economic Sustainability, and CO2 Reduction Through Hybrid Renewable Systems: A Case Study of Skyros Island. Water 2025, 17, 1267. DOI:10.3390/w17091267 [Google Scholar]
-
Download GADM Data. Available online: https://gadm.org/download_country_v3.html (accessed on 21 January 2026).
-
Cogea Srl. Desalination Plants in the EU [Data set]. European Marine Observation and Data Network (EMODnet). 2021. Available online: https://emodnet.ec.europa.eu/en/human-activities (accessed on 21 January 2026).
-
Tampakis S, Andrea V, Karanikola P, Pailas I. The Growth of Mountain Tourism in a Traditional Forest Area of Greece. Forests 2019, 10, 1022. DOI:10.3390/f10111022 [Google Scholar]
-
Sargentis G-F, Koutsoyiannis D, Angelakis A, Christy J, Tsonis AA. Environmental Determinism vs. Social Dynamics: Prehistorical and Historical Examples. World 2022, 3, 357–388. DOI:10.3390/world3020020 [Google Scholar]
-
Simboura N, Zenetos A. Benthic indicators to use in Ecological Quality classification of Mediterranean soft bottom marine ecosystems, including a new Biotic Index. Mediterr. Mar. Sci. 2002, 3, 77–111. DOI:10.12681/mms.249 [Google Scholar]
-
Lada A, Manos E. Country Profile of Greece. Hannover. = ARL Country Profiles. 2021. Available online: https://www.arl-international.com/knowledge/country-profiles/greece/rev/3738 (accessed on 21 January 2026).
-
Sargentis G-F, Papadodimas N. Cultural Cells: A Circular Economy-Driven Blueprint for Creative Tourism and Regional Revitalization in Greece. Adv. Environ. Eng. Res. 2025, 6, 32. DOI:10.21926/aeer.2504032 [Google Scholar]
-
Helenic Statistical Authority. Data on Estimated Population (1.1.2023) and Migration Flows (2022) Available online: https://www.statistics.gr/documents/20181/de3e26f6-9b77-d2e5-2ca3-e13bcafe482a?utm_source (accessed on 21 January 2026).
-
WORLD BANK GROUP. Urban population (% of total population) – Greece. Available online: https://data.worldbank.org/indicator/SP.URB.TOTL.IN.ZS?locations=GR&utm_source (accessed on 21 January 2026).
-
FAO. AQUASTAT Country Fact Sheet—Greece (Summary Statistics). 2022. Available online: https://storage.googleapis.com/fao-aquastat.appspot.com/countries_regions/factsheets/summary_statistics/en/GRC-CF.pdf (accessed on 21 January 2026).
-
Bondarenko M, Priyatikanto R, Tejedor-Garavito N, Zhang W, McKeen T, Cunningham A, et al. Constrained Estimates of 2015–2030 Total Number of People per Grid Square at a Resolution of 3 Arc (Approximately 100m at the Equator) R2025A Version V1. Global Demographic Data Project—Funded by The Bill and Melinda Gates Foundation (INV-045237). WorldPop—School of Geography and Environmental Science, University of Southampton. Available online: https://hub.worldpop.org/doi/10.5258/SOTON/WP00839 (accessed on 21 January 2026).
-
Reed FJ, Gaughan AE, Stevens FR, Yetman G, Sorichetta A, Tatem AJ. Gridded Population Maps Informed by Different Built Settlement Products. Data 2018, 3, 33. DOI:10.3390/data3030033 [Google Scholar]
-
Stevens FR, Gaughan AE, Nieves JJ, King A, Sorichetta A, Linard C, et al. Comparisons of two global built area land cover datasets in methods to disaggregate human population in eleven countries from the global South. Int. J. Digit. Earth 2019, 13, 78–100. DOI:10.1080/17538947.2019.1633424 [Google Scholar]
-
Neal J, Hawker L. FABDEM V1.2. 2023. Available online: https://data.bris.ac.uk/data/dataset/s5hqmjcdj8yo2ibzi9b4ew3sn (accessed on 21 January 2026).
-
Hawker L, Uhe P, Paulo L, Sosa J, Savage J, Sampson C, et al. A 30 m global map of elevation with forests and buildings removed. Environ. Res. Lett. 2022, 17, 024016. DOI:10.1088/1748-9326/ac4d4f [Google Scholar]
-
Sitzenfrei R, Möderl M, Rauch W. Automatic generation of water distribution systems based on GIS data. Environ. Model. Softw. 2013, 47, 138–147. DOI:10.1016/j.envsoft.2013.05.006 [Google Scholar]
-
van Summeren J, Blokker M. Modeling particle transport and discoloration risk in drinking water distribution networks. Drink. Water Eng. Sci. 2017, 10, 99–107. DOI:10.5194/dwes-10-99-2017 [Google Scholar]
-
Markantonis D, Sargentis GF, Dimitriadis P, Iliopoulou T, Siganou A, Moraiti K, et al. Stochastic Evaluation of the Investment Risk by the Scale of Water Infrastructures—Case Study: The Municipality of West Mani (Greece). World 2023, 4, 1–20. DOI:10.3390/world4010001 [Google Scholar]
-
Brkić D, Ćojbašić Ž. Evolutionary Optimization of Colebrook’s Turbulent Flow Friction Approximations. Fluids 2017, 2, 15. DOI:10.3390/fluids2020015 [Google Scholar]
-
Fuertes-Miquel VS, Arrieta-Pastrana A, Coronado-Hernández OE. Analyzing Water Leakages in Parallel Pipe Systems with Rapid Regulating Valve Maneuvers. Water 2024, 16, 926. DOI:10.3390/w16070926 [Google Scholar]
-
Martin-Candilejo A, Santillán D, Garrote L. Pump Efficiency Analysis for Proper Energy Assessment in Optimization of Water Supply Systems. Water 2019, 12, 132. DOI:10.3390/w12010132 [Google Scholar]
-
Jara-Arriagada C, Stoianov I. Pipe breaks and estimating the impact of pressure control in water supply networks. Reliab. Eng. Syst. Saf. 2021, 210, 107525. DOI:10.1016/j.ress.2021.107525 [Google Scholar]
-
Gevorkov L, Domínguez-García JL, Trilla L. The Synergy of Renewable Energy and Desalination: An Overview of Current Practices and Future Directions. Appl. Sci. 2025, 15, 1794. DOI:10.3390/app15041794 [Google Scholar]
-
Gevorkov L, Gonzalez HDP, Arias P, Domínguez-García JL, Trilla L. Enabling Reliable Freshwater Supply: A Review of Fuel Cell and Battery Hybridization for Solar- and Wind-Powered Desalination. Appl. Sci. 2025, 15, 12145. DOI:10.3390/app152212145 [Google Scholar]
-
Ludwig H. Energy consumption of reverse osmosis seawater desalination—Possibilities for its optimisation in design and operation of SWRO plants. Desalination Water Treat. 2010, 13, 13–25. DOI:10.5004/dwt.2010.982 [Google Scholar]
-
Pesaresi M, Schiavina M, Politis P, Freire S, Krasnodębska K, Uhl JH, et al. Advances on the Global Human Settlement Layer by joint assessment of Earth Observation and population survey data. Int. J. Digit. Earth 2024, 17, 2390454. DOI:10.1080/17538947.2024.2390454 [Google Scholar]
-
Melchiorri M, Freire S, Schiavina M, Florczyk A, Corbane C, Maffenini L, et al. The multi-temporal and multi-dimensional Global Urban Centre Database to delineate and analyse world cities. Sci. Data 2024, 11, 82. DOI:10.1038/s41597-023-02691-1 [Google Scholar]
-
ENTSOE. Transparency Platform. Available online: https://transparency.entsoe.eu/load/total/dayAhead?appState=%7B%22sa%22%3A%5B%22BZN%7C10YGR-HTSO-----Y%22%5D%2C%22st%22%3A%22BZN%22%2C%22mm%22%3Atrue%2C%22ma%22%3Afalse%2C%22sp%22%3A%22HALF%22%2C%22dt%22%3A%22CHART%22%2C%22df%22%3A%5B%222025-12-22%22%2C%222025-12-22%22%5D%2C%22tz%22%3A%22CET%22%7D (accessed on 21 January 2026).
-
Sargentis G-F, Koutsoyiannis D. The Function of Money in Water–Energy–Food and Land Nexus. Land 2023, 12, 669. DOI:10.3390/land12030669 [Google Scholar]
-
Sargentis G-F, Ioannidis R, Mamassis N, Zoukos V, Koutsoyiannis D. A Review of the Energy Policy in Greece in the Last 50 Years and Its Implications for Prosperity. Clean Energy Sustain. 2024, 2, 10021. DOI:10.70322/ces.2024.10021 [Google Scholar]