Forecasting Forest Product Yields in China Based on a Random Forest Model: Interaction Between Climate Change and Socio-Economic Factors

Forecasting Forest Product Yields in China Based on a Random Forest Model: Interaction Between Climate Change and Socio-Economic Factors
Xuekun Cheng 1,2 Mengchen Hu 3 Lei Gu 1,2 Weiqiang Zhu 1,2 Yufeng Zhou 1,2 Guomo Zhou 1,2,*
Received: 15 December 2025 Revised: 29 December 2025 Accepted: 22 January 2026 Published: 30 January 2026

© 2026 The authors. This is an open access article under the Creative Commons Attribution 4.0 International License (https://creativecommons.org/licenses/by/4.0/).
1. Introduction
Global climate change has become a major challenge facing human society and has a profound impact on the Earth’s ecosystems [1,2]. Global climate change has introduced substantial uncertainty into the long-term sustainability of forest resource supply systems, particularly in countries with large populations and intensive forest product demand [3,4]. As the world’s most populous country, China’s forest resources occupy a crucial position in the ecosystem, economic development, and carbon cycle, and forest products, especially wood, pulp, and wood-based bioenergy, play a pivotal role [5]. As one of the world’s largest producers and consumers of forest products, China’s forest resources play a central role in meeting domestic and international market demand, promoting economic development, and achieving ecological sustainability [6,7]. However, under the combined influence of climate change, socio-economic development, and current forestry policy constraints, the future trajectory of forest product yield in China remains highly uncertain.
Since the 1980s, the Chinese government has continuously adjusted and optimized its forestry policies to address the serious challenges facing forest resources [8], such as overconsumption of forest resources and deterioration of the ecological environment [9,10]. Currently, China’s forestry policy is developing in the direction of multifunctionality and ecological priority. Through the implementation of natural forest protection projects, the return of farmland to forests and grasslands, and various forest management measures, the Government is actively promoting the restoration and enhancement of forest resources [11,12,13]. In this policy context, it is particularly important to study the complex relationship between the production and supply of forest products and population, economic, and climate change [14,15,16]. Population growth directly contributes to the rise in demand for forest products, especially for everyday necessities such as building materials, paper products, and fuel [17]. The warming of the climate, the frequency of extreme weather events, and the increase in forest pests and diseases will lead to the degradation of forest resources, thus reducing the yield of forest products [18,19,20,21]. On the other hand, the carbon sink function of forests plays an important role in combating climate change, and the conservation and sustainable use of forest resources have also become important considerations in policy formulation [22,23]. These policy measures aim to ensure that China’s forest resources continue to meet the multiple demands of the economy, society, and the ecological environment, and to gradually realize a sustainable supply of forest products [7,11].
Statistical models are often used for yield forecasting because of their ability to simplify complex relationships and their high interpretability [24]. Statistical models developed based on machine learning algorithms have better simulation results than traditional linear regression models [25]. The random forest algorithm is one of the most popular machine learning techniques for regression analysis and can be used to predict outcomes due to its high degree of generality and accuracy [24,26]. Whereas output can be affected by climate, demographics, the economy, etc., the Cobb-Douglas production function, which is a highly interpretable economic model, can be used to calculate economic output and analyze the relationship between its influencing factors [27,28,29]. This function has been widely applied to the prediction of agricultural products, but less research has been conducted on the prediction of forest products [30,31,32,33,34]. However, the integration of machine learning models and economic production functions to predict forest product yield under policy and climate constraints remains limited.
We will consider various factors such as socio-economics (population and GDP) and climate, based on the current Chinese forestry policy. The future yield of forest products in China will be predicted by a random forest model and Cobb-Douglas function. Moreover, this paper will explore the possible impacts of climate and socio-economic factors on the future yield of forest products under the current forestry policy, and put forward corresponding recommendations, with a view to providing a scientific basis and policy reference for the development of China’s forestry industry.
2. Material and Methods
2.1. Study Region
China is located in the east of Asia, on the west coast of the Pacific Ocean. The terrain is high in the west and low in the east, and the climate is complex and diverse (Figure 1). By 2022, China’s forest area will reach 231 million hectares, with a forest coverage rate of 24.02%. China is the world’s most populous developing country, the world’s third-largest land area, the world’s second-largest economy, and continues to be the largest contributor to global economic growth, with an aggregate economic output exceeding 100 trillion yuan in 2020.
Figure 1. Location (a), precipitation (b), temperature (c), mean annual surface downward shortwave radiation (RSDS) (e), and forest land distribution (d) of the study area.
2.2. Data Collection and Calculation
2.2.1. Forest Product Yield Data
China’s forest products yield data are from the Chinese forestry information network (https://www.forestdata.cn/; accessed on 1 August 2024). It contains forest product yield data (log yield data and commodity timber yield data) for all provinces in China from 1998 to 2015.
2.2.2. Land Use Data
The forest area data from 1985 to 2015 are based on the annual land cover data set (CLCD) of Chinese provinces, with a spatial resolution of 30 m, released by Wuhan University, and an overall accuracy of 79.31% [35]. In this study, forest pixels within the study area were extracted. The future forest area data are based on a global land-use change dataset under different scenarios from 2020 to 2100, which combines climate and socio-economic factors to achieve high-precision simulation [36]. Land use data is a key factor in calculating forest products per unit area. Statistical forest product data and land cover data (forest area data) were used to compile forest product data per unit area.
2.2.3. Climate Data
We model forest products based on the effects of climate change on forest growth. Environmental data obtained through CMIP6 (https://pcmdi.llnl.gov/CMIP6/; accessed on 1 August 2024), compared with the past CMIP project implementation, CMIP6 has more participation mode number, better science experiment design, and a larger simulation database [37], making it more accurate to describe the physical processes of the earth [38]. In this study, four scenarios, namely sustainable development SSP126, moderate development SSP245, local development SSP370, and high-energy unconventional development SSP585, are adopted. By averaging the data of these representative models, we obtained average data for future mean annual temperature (MAT), mean annual surface downward shortwave radiation (RSDS), and mean annual precipitation (MAP). Different environmental data were used to predict the future forest yield under these four scenarios.
2.2.4. Social Data
Population and GDP have significant effects on the yield and use of forest products. These two socio-economic indicators may influence the yield of forest products through government policies, the number of people employed in forestry, investment in forestry, and the price and volume of timber trade. By incorporating social factors, we examine whether policy and economic changes affect forest product output in China. 1985–2015, population and GDP data are obtained from the National Bureau of Statistics (https://www.stats.gov.cn/; accessed on 1 August 2024). Future data population and GDP are derived from the population forecast and GDP forecast in five common socio-economic paths (SSPs) [39]. We converted the data and matched it with other data.
2.3. Model Design
We choose Cobb-Douglas function as the basic theoretical model of forest product forecasting in China. Projections beyond the historical period are intended for exploratory scenario analysis rather than precise long-term forecasting. The Cobb-Douglas function primarily examines the relationship between inputs and outputs [40]. It reflects the quantitative relationship between a specific combination of production factors and the maximum output they can produce under given technical conditions, and can describe the relationship between output and production factors. The yield model is suitable for long-term estimation and easy to calculate [34,41]. Therefore, this study simulates the main influencing factors of forest yield in China through this model, and the basic formula is as follows:
where Y is the forest yield, A is the technical coefficient, T is the MAT, P is the MAP, R is the RSDS, N is the population, G is GDP, and $${a}_{i}$$ (i = 1, 2, 3, 4, 5) is the elastic coefficient of each variable.
For many years of calculation in this study, we perform a logarithmic transformation of Equation (1) to fit the functional form:
where i represents the region and t represents the year. The construction and calculation methods of yield function parameters are used to model how each factor affects the output. It can be used to predict the sustainable development of yield under the change of environmental factors [42].
In the construction of a forest product prediction model, we use the random forest algorithm to integrate multiple decision trees. Random forests have significant advantages in dealing with complex nonlinear relations [43]. Moreover, the model can provide high accuracy [24,43]. The random forest model has strong tolerance for outliers and noise, can handle high-dimensional data, effectively analyzes nonlinear, collinear, and interactive data, and provides variable importance scores when reanalyzing the data [35]. The importance of random forest can be used to calculate variables and analyze contribution characteristics [36]. This process allows the model to effectively deal with various factors that affect forest products, such as environmental conditions (temperature, precipitation, and solar radiation), economic factors, population, and land use change. In forest ecosystems, there are complex interactions between different variables. Random forest aggregate results by voting or averaging, thereby mitigating bias in individual decision trees and reducing the risk of overfitting, which is particularly beneficial in dynamic and complex ecological environments [44]. In this study, we used a random forest approach to model forest products across China. The data set was randomly divided into a training set (80%) and a test set (20%) to effectively evaluate the model’s performance on unseen data [45]. We further verified the stability of the model using cross-validation, ensuring that each data point was fully utilized during the testing phase. Cross-validation was primarily used to assess overall model stability (R2 = 0.92).
In our modeling framework, the Cobb-Douglas function serves as the theoretical foundation, providing a logical and interpretable structure to describe the relationship between forest product yield and socio-economic and environmental variables in China (Figure 2). The elasticity coefficients of the Cobb-Douglas function are first estimated using historical data, allowing preliminary modeling of the theoretical production relationships. Building on this baseline, the random forest algorithm is subsequently applied to refine the initial predictions by capturing nonlinear relationships and complex interactions that the Cobb-Douglas formulation does not adequately explain. By constructing multiple decision trees based on different data subsets and feature combinations, the random forest model introduces randomness and flexibility, enabling a more accurate representation of interactions between climate, socio-economic factors, and forest product yield. Compared with the Cobb-Douglas model alone, the combined Cobb-Douglas-random forest framework better addresses nonlinearities and interaction effects, while ensemble averaging across trees reduces overfitting and enhances model robustness and predictive performance.

3. Results
3.1. Accuracy Evaluation and Importance Analysis of the Model
In model construction, model accuracy evaluation is very important. We trained and tested the model. The prediction model showed high accuracy (Figure 3). For China’s commodity timber yield model, the model prediction results were reliable (R2 = 0.7441), MSE = 0.502, and MAE = 0.2. For the Chinese log yield model, the prediction accuracy of the model was highly reliable (R2 = 0.7015), MSE = 0.523, MAE = 0.189, which indicated that the model was also reliable in predicting log yield.
 |
|
|
(a) |
(b) |
Figure 3. Linear relationship between the predicted value and the actual value of commodity timber (a) and logs (b). Prediction accuracy is represented by R2.
In the aspect of feature importance evaluation, random forest provides importance scores for features, which help to identify key factors affecting forest products. The characteristic importance of the model for commercial timber and logs, respectively (Figure 4). As can be seen from the figure, for commodity timber, RSDS was the most important feature, followed by MAT > POP > MAP > GDP, and in this order, the contribution was at least the most. For the log yield model, the order of importance of variables was POP > RSDS > MAT > MAP > GDP. This indicates that RSDS, POP, and MAT play the most critical role in influencing forest products. By assessing the importance of features in this way, we can identify key influencing factors and improve the accuracy of our forest product model simulations.
 |
|
|
(a) |
(b) |
Figure 4. RF Models feature the importance of commodity timber (a) and logs (b). The mean annual temperature means MAT, the annual mean surface downward shortwave radiation means RSDS, the mean annual precipitation means MAP, the gross domestic product means GDP, and the population means POP.
3.2. Forecast Trends in the Future Yield of Commodities and Logs
Based on forest yield data and other variables from 1985–2015, we used a random forest model to simulate future trends in commercial timber and log yields under four different SSPs (SSP126, SSP245, SSP370, and SSP585). Under the SSP126, the output per unit area of logs is relatively stable, with little fluctuation and a slow increase trend (Figure 5). Under the SSP245, the output per unit area of logs shows an upward trend, and the increase is large. In the SSP370, the log yield per unit area increases to 2038, then the growth rate flattens out. Unit yield at the SSP585 peak in 2030, then begins to decline, rising slightly in 2045 and declining in 2080. The output per unit area of commodity timber has a large overall change from 2015 to 2040, and a more moderate change from 2040 to 2100. Under the SSP126 and SSP245, the fluctuation of unit yield is relatively gentle, and the overall trend is increasing. The output under SSP245 is higher than under SSP126. In 2080, the output under the two scenarios is similar. In the SSP370, yield increases rapidly, then begins to decrease in 2038 and levels off in 2060. In the SSP585, yield increases to a sharp decline in 2035, shows an increasing trend to 2046, and then declines in 2080.
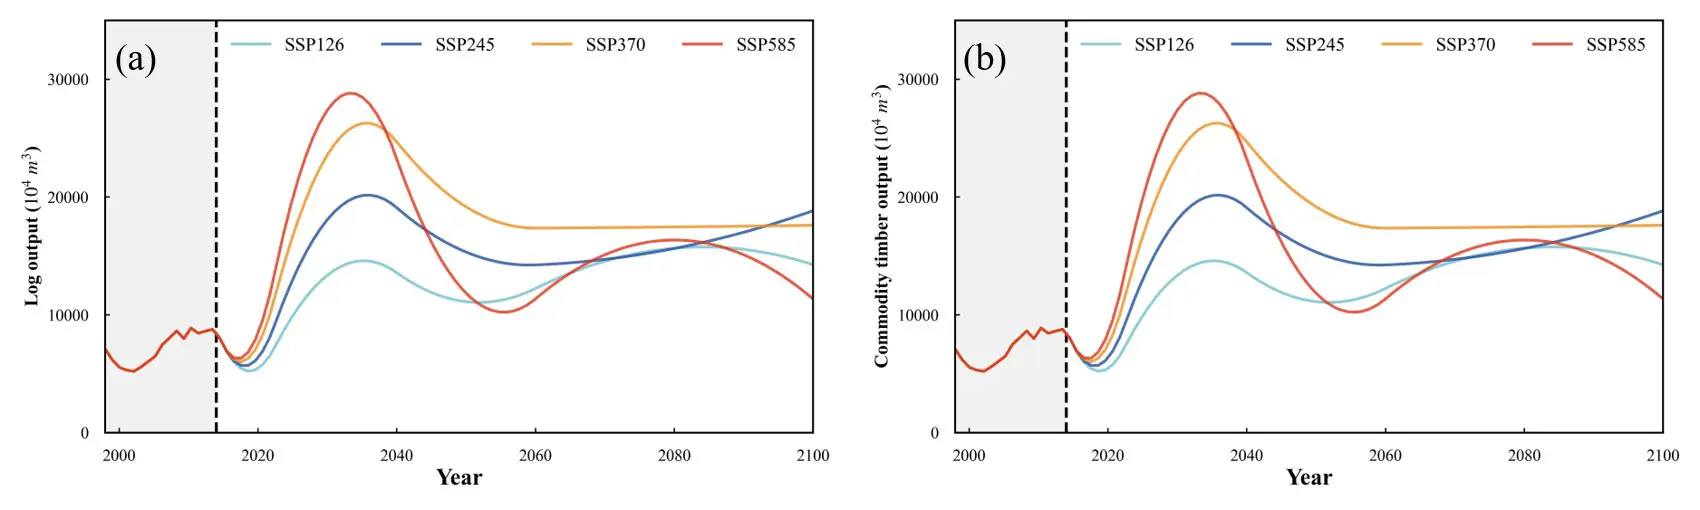
Based on projections of log and commodity timber yields per unit area, we calculated total log and commodity timber yields (Figure 6). The trend in total yield was generally consistent with that of yield per unit area. In the SSP126, the total log yield and commodity timber yield are relatively stable, with less fluctuation and a slow growth trend. Under the SSP245, log yields show an upward trend, with a significant increase in 2038, and commodity timber yields show a slow, increasing trend. Under the SSP370, log yields fluctuate steadily overall, with a slow, increasing trend, and commodity timber yields peak in 2038, then decline and level off in 2060. In the SSP585, both log and commodity timber yields fluctuate considerably, with two peaks in 2038 and 2060.
Based on the future forest product data obtained from the forecast, the spatial distribution of commodity timber and log yield was obtained (Figure 7 and Figure 8). It can be seen that the overall spatial distribution pattern of China’s commodity timber yield is high in the north and south and low in the east and west. Under the SSP126, the yield of commodity lumber is high in the northeast and low in the northwest. The provinces with the highest yield in 2030, 2050, and 2070 are Hubei (2.23 × 10⁷ m3), Heilongjiang (1.27 × 10⁷ m3), and Inner Mongolia (2.73 × 10⁷ m3). By 2100, the five provinces with the highest yields are, in descending order, Heilongjiang (2.44 × 10⁷ m3), Inner Mongolia (2.26 × 10⁷ m3), Yunnan (2.20 × 10⁷ m3), Sichuan (1.54 × 10⁷ m3), and Guangxi (6.43 × 10⁶ m3). The main areas of origin of a product are in the northeast and southwest. Under the SSP245, there is little overall change in yield in the north and a decrease in the south over time. The provinces with the highest yields in 2030, 2050, and 2070 are Zhejiang (3.45 × 10⁷ m3), Zhejiang (2.13 × 10⁷ m3), and Heilongjiang (2.36 × 10⁷ m3). By 2100, the five provinces with the highest yield are Liaoning (2.48 × 10⁷ m3), Inner Mongolia (2.41 × 10⁷ m3), Heilongjiang (2.24 × 10⁷ m3), Shanxi (1.85 × 10⁷ m3), and Yunnan (1.67 × 10⁷ m3). By 2100, the five provinces with the highest yield are Liaoning (2.48 × 10⁷ m3), Inner Mongolia (2.41 × 10⁷ m3), Heilongjiang (2.24 × 10⁷ m3), Shanxi (1.85 × 10⁷ m3), and Yunnan (1.67 × 10⁷ m3). The overall, the source of a product gradually shifts northward, except in the southwest. Under the SSP370, the central region shows a decrease in yield over time, with an overall distribution pattern of high north-south and low east-west. In 2030, 2050, and 2070, the provinces with the highest yield are Hubei, with 6.43 × 10⁷ m3, 3.23 × 10⁷ m3, 3.12 × 10⁷ m3, respectively. The five provinces with the highest yield of commodity timber in 2100 are Inner Mongolia (2.69 × 10⁷ m3), Heilongjiang (2.08 × 10⁷ m3), Hubei (2.04 × 10⁷ m3), Yunnan (1.55 × 10⁷ m3), and Sichuan (1.50 × 10⁷ m3). In the SSP585, the distribution of yields shows a decreasing trend, with the north-south remaining higher than the east-west. The provinces with the highest yield in 2030, 2050, and 2070 are Hubei (6.84 × 10⁷ m3), Yunnan (2 × 10⁷ m3), and Sichuan (2.85 × 10⁷ m3). By 2100, the five provinces with the highest yield of commodity timber are Yunnan (1.51 × 10⁷ m3), Sichuan (1.39 × 10⁷ m3), Heilongjiang (8.36 × 10⁶ m3), Jilin (7.33 × 10⁶ m3), and Guangxi (7.29 × 10⁶ m3). It shows a distribution pattern of higher yield in the northeast and southwest than in other regions.
We can see that the overall distribution pattern of log yield is high in the southwest and low in the center (Figure 8). In the SSP126, the yield in the northeast region gradually increases, and the other regions do not change much. The provinces with the highest yield in 2030, 2050, and 2070 are Inner Mongolia (9.28 × 10⁶ m3), Heilongjiang (1.59 × 10⁷ m3), and Inner Mongolia (2.91 × 10⁷ m3). By 2100, the top six provinces in terms of national log yield are Inner Mongolia (2.38 × 10⁷ m3), Heilongjiang (2.34 × 10⁷ m3), Guizhou (7.40 × 10⁶ m3), Guangxi (6.76 × 10⁶ m3), Shaanxi (5.94 × 10⁶ m3), and Yunnan (5.86 × 10⁶ m3). Under the SSP245, the overall change in yield is insignificant in the north-west and southern regions of China, with a gradual increase in the northern region. The provinces with the highest yield in 2030, 2050, and 2070 are Guangxi (2.39 × 10⁷ m3), Guangxi (2.34 × 10⁷ m3), and Henan (5.67 × 10⁷ m3). By 2100, the top six provinces in terms of log yield are Shaanxi (7.68 × 10⁷ m3), Shanxi (3.31 × 10⁷ m3), Guangdong (2.90 × 10⁷ m3), Liaoning (1.77 × 10⁷ m3), Guangxi (1.13 × 10⁷ m3), and Inner Mongolia (8.36 × 10⁶ m3). In the SSP370, yield in the central region shows an increasing trend. The provinces with the highest yields in 2030, 2050, and 2070 are Henan (2.24 × 10⁷ m3), Henan (1.54 × 10⁷ m3), and Heilongjiang (2.22 × 10⁷ m3). By 2100, the top six provinces in terms of log yield are Inner Mongolia (2.54 × 10⁷ m3), Heilongjiang (1.98 × 10⁷ m3), Yunnan (1.95 × 10⁷ m3), Sichuan (9.33 × 10⁶ m3), Hebei (6.73 × 10⁶ m3), and Guangxi (6.72 × 10⁶ m3). Under the SSP585, there is a clear decreasing trend in the southern region of China and a slight increase in yield in the north-west. The provinces with the highest yield in 2030, 2050, and 2070 are Yunnan (3.25 × 10⁷ m3), Yunnan (9.87 × 10⁶ m3), and Guangdong (1.83 × 10⁷ m3). By 2100, the top six provinces in terms of log yield are Yunnan (1.3 × 10⁷ m3), Guangxi (7.31 × 10⁶ m3), Heilongjiang (7.14 × 10⁶ m3), Jilin (6.87 × 10⁶ m3), Hunan (5 × 10⁶ m3), and Guizhou (4.88 × 10⁶ m3).


4. Discussion
4.1. Results of Forest Products Modelling Projections
In this study, China’s commodity timber and log yield up to 2100 under different scenarios were simulated based on the random forest model and Cobb-Douglas function, and the model’s prediction accuracy for both commodity timber and logs showed high confidence (Figure 3). Indicators such as R2 and MSE show the good predictive ability of the model for forest products, and this high accuracy indicates the applicability of the selected model with the variables. In addition, the low error values indicate that the model is potentially effective in practical applications and can be applied to different forest product data, providing important data support for forest management and sustainable development decisions.
Different variables showed different levels of importance in predicting commercial timber and logs (Figure 4). From the results, we can see that climatic conditions play a key role in the growth of commodity timber, while socio-economic factors such as GDP make a relatively small contribution. This may be due to the possibility that the yield of forest products may be more influenced by natural environmental factors, such as climate. Policies such as environmental protection and sustainable development goals in China may have limited the overexploitation of forest resources, which, in turn, has led to a relatively weak relationship between GDP and forest product yields [46,47,48]. For log yield, population is the most important variable. This suggests that social demand is the main driver of changes in log yields, with climatic factors such as RSDS and MAT following closely behind. This difference in variable importance reflects differences in the sensitivity of different forest products to environmental and socio-economic factors.
The yield under the SSP585 scenario shows two wave peaks in 2035 and 2090 (Figure 6). This may be due to the high-intensity climate change, high socio-economic development, and population growth in the SSP585, which may produce phase fluctuations in demand for forest products. This is also related to land use change under climate change. In 2035, the peak may be driven by the interaction between market demand and competitive exuberance amid high carbon emissions, while the 2090 peak may be driven by variable effects of resource reallocation or ecosystem adaptive restoration.
4.2. Spatial Distribution of Forest Yield under Different Scenarios
Analyses of the spatial distribution of future yield of commodity timber and logs reveal a pattern of high north-south and low east-west (Figure 7 and Figure 8), which may be closely related to regional forest resource endowment and economic activities. Under SSP126, commercial timber yield is higher in the north-eastern and southern regions. However, under SSP585, the yield of commodity timber in the southern region gradually decreases, whereas that in the northern region remains relatively stable. This change may be influenced by a combination of climate change and regulatory policies [49,50]. Increased temperatures due to global warming, some southern forest yield areas may become unsuitable for forest growth due to high summer temperatures or increased drought, while the higher latitude of the northern region and the longer summer sunshine hours are conducive to the extension of the growth cycle of forest trees [51,52]. In the South, where population density is higher, and land is mostly used for agriculture, urban expansion, etc., the area of forested land may be reduced. In contrast, the north is relatively rich in land resources, which makes it easier to expand forested lands [53]. The Government of China has implemented a series of ecological protection measures in recent years, such as the ‘Returning Cultivated Land to Forests’ and the ‘Three-North Protection Forest Project’. These policies may have facilitated afforestation activities in the northern regions, thereby expanding the range of tree-producing areas, and the widespread use of modern forestry technologies (e.g., precision silviculture, irrigation systems) in the northern regions may have improved their yield conditions [54,55].
In terms of future spatial distribution of both commodity timber and log yield, under different scenarios, most of the peak yield areas are concentrated in the provinces of Inner Mongolia, Heilongjiang, and Yunnan. These regions are rich in forest resources, and high yields are supported by favorable climatic conditions and large plantation areas. However, Northwest China and parts of the south experience a significant reduction in yields under the high emissions scenario, suggesting that these regions may be negatively affected by climate change. Climate change may lead to an increase in the frequency and intensity of pests and diseases in the southern region, and higher temperatures may lead to an increase in evapotranspiration, making water availability insufficient, which in turn affects plant growth and forest productivity. Particularly in the north-west, where water resources are already scarce, higher temperatures may further exacerbate water stress and inhibit plant growth. This suggests that regional variability should be taken into account when developing regional forest management strategies to optimize resource allocation to maximize yield.
4.3. Influence of Policy, Climatic, and Socio-Economic Factors on the Existence of Forest Yields
Policy plays a central role in forest yield [56]. Through policy guidance, the government can regulate the balance between supply and demand of forest products and promote the sustainable management of forest resources. For example, by restricting the felling of natural forests and promoting the planting and management of plantation forests, the Government has effectively controlled the overconsumption of forest resources and guaranteed the long-term supply of forest products [9,57,58].
After our study, we found that the future yield of commodity timber and logs showed significant differences under different climate scenarios. Under the SSP370 and SSP585, the yield of forest products decreased significantly in some regions, especially in the original main yield areas, such as provinces in southern and southwestern China. Taking Guangxi, Yunnan, and Sichuan as examples, the yield of commodity timber and logs under the SSP585 in these regions, which were originally important yield areas for forest products, showed significant decreasing trends. The decrease in yield may be related to the deterioration of forestry yield conditions due to increases in economic development, land-use change, and climate change [18,59,60]. In the central region, such as Hubei and Henan, although high yields are maintained in the short term, yields tend to decline in the long term due to climate suitability and under-utilization of resources. Under climate change scenarios (e.g., SSP585), the southern and central regions (e.g., Guangxi, Hunan) may experience declining yields due to reduced climatic suitability and over-exploitation of resources, whereas the north-eastern and northwestern regions (e.g., Heilongjiang, Inner Mongolia) may emerge as new major yield areas due to improved climate and population migration. Therefore, forestry policies need to take climate change as a key consideration when developing future strategies and prioritize the development of climate-adapted forestry to cope with the uncertainties that climate change may bring. In addition, socio-economic factors such as rural migration and labour shortages in forestry may affect the effectiveness of forestry operations.
4.4. Model Applicability and Uncertainty
Uncertainty from CMIP6 climate projections is not explicitly propagated through the random forest model. Therefore, long-term results should be interpreted as scenario-based outcomes rather than probabilistic forecasts. The combined Cobb-Douglas and random forest framework provides an efficient and flexible tool for national-scale prediction of forest product yield. Its main strength lies in integrating interpretable economic relationships with the strong nonlinear predictive capability of machine-learning models. The Cobb-Douglas function offers a transparent representation of socio-economic drivers, while the random forest model captures complex responses to climatic and demographic factors. This modular design allows the framework to be easily extended to different regions and future socio-economic scenarios. The model is intended for large-scale scenario analysis rather than detailed simulation of forest biological processes. By focusing on widely available climate and socio-economic variables, it enables rapid evaluation of long-term development pathways at relatively low data and computational cost. This makes the framework particularly suitable for policy-oriented assessments of how population growth, economic development, and climate change jointly affect forest product supply.
5. Conclusions
From 1985 to 2020, China’s forestry policy shifted from resource use to ecological protection, gradually moving towards a green, sustainable development model. Based on the random forest model and the Cobb-Douglas yield function, this study predicts future yield trends and the spatial distribution of forest products in China, accounting for the effects of climate change and socio-economic factors. By simulating the yield of forest products under different scenarios (SSP126, SSP245, SSP370, and SSP585), the results of the study show that the constructed prediction model has a high accuracy for forest yield and can effectively reveal the key roles of climatic, economic, and demographic factors in the changes of forest product yield. The future yield per unit area of forest products showed obvious spatial and temporal trends under different scenarios. Spatial distribution analyses show significant differences in forest product yields across regions of China, with relatively high yields in the northeast and northwest, while parts of the south and southwest may face the risk of declining yields in the future. The paper finds that climate change in the southern region may lead to water scarcity and declining forest productivity, while the northern region may become a new major area for forest products because of improved climate and abundant land resources. Government policies have played a crucial role in this process, promoting the sustainable use of forest resources by limiting natural forest harvesting, promoting plantation forestry and optimizing forestry management.
In summary, this paper provides a scientific foundation for predicting China’s future forest product output and serves as an important reference for adjusting forestry policies and sustainable management of forest resources. With the intensification of climate change, forestry policies need to place greater emphasis on climate adaptation and prioritize the development of adaptive forestry technologies and management approaches to cope with future changes in forest product yields and ecosystem service functions.
Statement of the Use of Generative AI and AI-Assisted Technologies in the Writing Process
During the preparation of this manuscript, the authors used ChatGPT (OpenAI) solely for language editing and stylistic refinement. The AI tool was not used for data analysis, model development, result interpretation, or drawing conclusions. All scientific content and final decisions were made by the authors.
Author Contributions
Conceptualization, X.C. and G.Z.; Methodology, X.C. and M.H.; Software, X.C.; Validation X.C., M.H. and W.Z.; Formal Analysis, X.C.; Investigation, X.C.; Resources, G.Z. and L.G.; Data Curation, M.H.; Writing—Original Draft Preparation, X.C. and M.H.; Writing—Review & Editing, X.C., Y.Z. and G.Z.; Visualization, X.C. and M.H.; Supervision, G.Z.; Project Administration, Y.Z.; Funding Acquisition, G.Z.
Ethics Statement
Not applicable.
Informed Consent Statement
Not applicable.
Data Availability Statement
All relevant data are within the manuscript.
Funding
This research was funded by the China National Key Research and Development Program (Grant Number 2023YFE0105100), the Joint Research Fund of the Department of Forestry of Zhejiang Province and the Chinese Academy of Forestry (Grant No. 2022SY05), and the Key Research and Development Program of Zhejiang Province (Grant number:2022C03039).
Declaration of Competing Interest
The authors declare that they have no known competing financial interests or personal relationships that could have appeared to influence the work reported in this paper.
References
-
Hoegh-Guldberg O, Jacob D, Taylor M, Guillén Bolaños T, Bindi M, Brown S, et al. The human imperative of stabilizing global climate change at 1.5 °C. Science 2019, 365, eaaw6974. DOI:10.1126/science.aaw6974 [Google Scholar]
-
Pecl GT, Araújo MB, Bell JD, Blanchard J, Bonebrake TC, Chen IC, et al. Biodiversity redistribution under climate change: Impacts on ecosystems and human well-being. Science 2017, 355, eaai9214. DOI:10.1126/science.aai9214 [Google Scholar]
-
Hisano M, Searle EB, Chen HYH. Biodiversity as a solution to mitigate climate change impacts on the functioning of forest ecosystems. Biol. Rev. 2017, 93, 439–456. DOI:10.1111/brv.12351 [Google Scholar]
-
Sicard P, Augustaitis A, Belyazid S, Calfapietra C, de Marco A, Fenn M, et al. Global topics and novel approaches in the study of air pollution, climate change and forest ecosystems. Environ. Pollut. 2016, 213, 977–987. DOI:10.1016/j.envpol.2016.01.075 [Google Scholar]
-
Benz JP, Chen S, Dang S, Dieter M, Labelle ER, Liu G, et al. Multifunctionality of forests: A white paper on challenges and opportunities in China and Germany. Forests 2020, 11, 266. DOI:10.3390/f11030266 [Google Scholar]
-
Cai Y, Liu C. Research on the export efficiency and potential of China’s forest products to RCEP membercountries—From the perspectiveof Asia-Pacific economic integration. Prices Mon. 2020, 41, 39–46. DOI:10.14076/j.issn.1006-2025.2020.08.08 [Google Scholar]
-
Ke S, Qiao D, Zhang X, Feng Q. Changes of China’s forestry and forest products industry over the past 40 years and challenges lying ahead. For. Policy Econ. 2021, 123, 102352. DOI:10.1016/j.forpol.2020.102352 [Google Scholar]
-
Wang S, Van Kooten GC, Wilson B. Mosaic of reform: Forest policy in post-1978 China. For. Policy Econ. 2004, 6, 71–83. DOI:10.1016/S1389-9341(02)00078-3 [Google Scholar]
-
Dai L, Li S, Zhou W, Qi L, Zhou L, Wei Y, et al. Opportunities and challenges for the protection and ecological functions promotion of natural forests in China. For. Ecol. Manag. 2018, 410, 187–192. DOI:10.1016/j.foreco.2017.09.044 [Google Scholar]
-
Yemo Z. Environmental policy in china: Forest management and development in heilongjiang province. Contemp. Chin. Polit. Econ. Strateg. Relat. 2021, 7, 1775–1808. [Google Scholar]
-
Aguilar FX, Wen Y. Socio-economic and ecological impacts of China’s forest sector policies. For. Policy Econ. 2021, 127, 102454. DOI:10.1016/j.forpol.2021.102454 [Google Scholar]
-
Bryan BA, Gao L, Ye Y, Sun X, Connor JD, Crossman ND, et al. China’s response to a national land-system sustainability emergency. Nature 2018, 559, 193–204. DOI:10.1038/s41586-018-0280-2 [Google Scholar]
-
Xu J, Yin R, Li Z, Liu C. China’s ecological rehabilitation: Unprecedented efforts, dramatic impacts, and requisite policies. Ecol. Econ. 2006, 57, 595–607. DOI:10.1016/j.ecolecon.2005.05.008 [Google Scholar]
-
Heubes J, Heubach K, Schmidt M, Wittig R, Zizka G, Nuppenau EA, et al. Impact of future climate and land use change on non-timber forest product provision in Benin, West Africa: Linking niche-based modeling with ecosystem service values. Econ. Bot. 2012, 66, 383–397. DOI:10.1007/s12231-012-9216-1 [Google Scholar]
-
Solomon S. Climate Change 2007—The Physical Science Basis: Working Group I Contribution to the Fourth Assessment Report of the IPCC; Cambridge University Press: Cambridge, UK, 2007. [Google Scholar]
-
Wang J, Xin L, Wang Y. Economic growth, government policies, and forest transition in China. Reg. Environ. Chang. 2019, 19, 1023–1033. DOI:10.1007/s10113-018-1450-3 [Google Scholar]
-
Basnyat B. Impacts of Demographic Changes on Forests and Forestry in Asia and the Pacific; FAO Regional Office for Asia and the Pacific: Bangkok, Thailand, 2009. [Google Scholar]
-
Johnston CMT, Henderson JD, Guo J, Prestemon JP, Costanza J. Unraveling the impacts: How extreme weather events disrupt wood product markets. Earth’s Futur. 2024, 12, e2024EF004742. DOI:10.1029/2024EF004742 [Google Scholar]
-
Kirilenko AP, Sedjo RA. Climate change impacts on forestry. Proc. Natl. Acad. Sci. USA 2007, 104, 19697–19702. DOI:10.1073/pnas.0701424104 [Google Scholar]
-
Rive N, Aaheim HA, Hauge KE. Adaptation and World Market Effects of Climate Change on Forestry and Forestry Products. In Proceedings of the 8th Annual Conference on Global Economic Analysis, Lübeck, Germany, 9–11 June 2005. [Google Scholar]
-
Subramanian N, Nilsson U, Mossberg M, Bergh J. Impacts of climate change, weather extremes and alternative strategies in managed forests. Ecoscience 2019, 26, 53–70. DOI:10.1080/11956860.2018.1515597 [Google Scholar]
-
Alig R, Adams D, Joyce L, Sohngen B. Climate change impacts and adaptation in forestry: Responses by trees and markets. Choices 2004, 19, 7–12. DOI:10.22004/ag.econ.93984 [Google Scholar]
-
Nambiar AO EKS. Forestry for rural development, poverty reduction and climate change mitigation: We can help more with wood. Aust. For. 2015, 78, 55–64. DOI:10.1080/00049158.2015.1050776 [Google Scholar]
-
Prasad NR, Patel NR, Danodia A. Crop yield prediction in cotton for regional level using random forest approach. Spat. Inf. Res. 2021, 29, 195–206. DOI:10.1007/s41324-020-00346-6 [Google Scholar]
-
Cooner AJ, Shao Y, Campbell JB. Detection of urban damage using remote sensing and machine learning algorithms: Revisiting the 2010 Haiti earthquake. Remote Sens. 2016, 8, 868. DOI:10.3390/rs8100868 [Google Scholar]
-
Vincenzi S, Zucchetta M, Franzoi P, Pellizzato M, Pranovi F, De Leo GA, et al. Application of a Random forest algorithm to predict spatial distribution of the potential yield of Ruditapes philippinarum in the Venice lagoon, Italy. Ecol. Modell. 2011, 222, 1471–1478. DOI:10.1016/j.ecolmodel.2011.02.007 [Google Scholar]
-
Dorji T, Piao S, Wang X, Zhao C, Liu B, Chen A, et al. Emerging negative warming impacts on Tibetan crop yield. Engineering 2022, 14, 163–168. DOI:10.1016/j.eng.2021.01.012 [Google Scholar]
-
Wang Y, Liao S. Impacts of climate change on grain yield:a review of research methods. Chin. J. Agric. Resour. Reg. Plan 2018, 39, 54–63. DOI:10.7621/cjarrp.1005-9121.20181209 [Google Scholar]
-
Zou Z, Cheng C, Shen S. The influence of socio-economic factors and meteorological factors on rice yield: A case study of Sanjiang Plain. Chin. J. Agric. Resour. Reg. Plan 2022, 43, 24–30. DOI:10.7621/cjarrp.1005-9121.20220403 [Google Scholar]
-
Saepudin T, Amalia A. Analysis of rice production approach to Cobb Douglas production function in Tambakdahan Sub-district Subang District. Agric. Socio-Econ. J. 2022, 22, 121–127. DOI:10.21776/ub.agrise.2022.022.2.6 [Google Scholar]
-
Singh AK, Narayanan KGS, Sharma P. Effect of climatic factors on cash crop farming in India: An application of Cobb-Douglas production function model. Int. J. Agric. Resour. Gov. Ecol. 2017, 13, 175–210. DOI:10.1504/IJARGE.2017.086452 [Google Scholar]
-
Kumar Sinha J. Economies of the factors affecting crop production in India: Analysis based on Cobb-Douglas Production Function. Sumerianz J. Econ. Financ. 2023, 6, 10–18. DOI:10.47752/sjef.61.10.18 [Google Scholar]
-
Tirfi AG, Oyekale AS. An Augmented Cobb-Douglas Production Function Modeling of the Impact of Climate Change on Maize Yields in Ethiopia. Agro Ekon. 2023, 34, 12. DOI:10.22146/ae.76238 [Google Scholar]
-
Zhang Q, Dong W, Wen C, Li T. Study on factors affecting corn yield based on the Cobb-Douglas production function. Agric. Water Manag. 2020, 228, 105869. DOI:10.1016/j.agwat.2019.105869 [Google Scholar]
-
Yang J, Huang X. The 30 m annual land cover dataset and its dynamics in China from 1990 to 2019. Earth Syst. Sci. Data 2021, 13, 3907–3925. DOI:10.5194/essd-13-3907-2021 [Google Scholar]
-
Cheng X, Zhou T, Liu S, Sun X, Zhou Y, Xu L, et al. Effects of climate on variation of soil organic carbon and alkali-hydrolyzed nitrogen in subtropical forests: A case study of Zhejiang province, China. Forests 2023, 14, 914. DOI:10.3390/f14050914 [Google Scholar]
-
Li B, Huang Y, Du L, Wang D. Bias correction for precipitation simulated by RegCM4 over the upper reaches of the Yangtze River based on the mixed distribution quantile mapping method. Atmosphere 2021, 12, 1566. DOI:10.3390/atmos12121566 [Google Scholar]
-
Hamed MM, Nashwan MS, Shahid S, Ismail TB, Wang XJ, Dewan A, et al. Inconsistency in historical simulations and future projections of temperature and rainfall: A comparison of CMIP5 and CMIP6 models over Southeast Asia. Atmos. Res. 2022, 265, 105927. DOI:10.1016/j.atmosres.2021.105927 [Google Scholar]
-
Huang J, Qin D, Jiang T, Wang Y, Feng Z, Zhai J, et al. Effect of Fertility Policy Changes on the Population Structure and Economy of China: From the Perspective of the Shared Socio-economic Pathways. Earth’s Futur. 2019, 7, 250–265. DOI:10.1029/2018EF000964 [Google Scholar]
-
Tang X, Mu Y, Ma Y. A Further Study of Cost Function under Cobb-Douglas Production Function. Chin. J. Manag. Sci. 2005, 13, 1–6. DOI:10.3321/j.issn:1003-207X.2005.04.001 [Google Scholar]
-
Jiao L, Zhu Q, Luan J. The study on the influence factors of urban modern agriculture based on C-D production function—A case study of Hefei city. J. Heilongjiang Bayi Agric. Univ. 2018, 30, 97–101. DOI:10.3969/j.issn.1002-2090.2018.06.016 [Google Scholar]
-
Vasyl’Yeva O. Assessment of factors of sustainable development of the agricultural sector using the Cobb-Douglas production function. Balt. J. Econ. Stud. 2021, 7, 37–49. DOI:10.30525/2256-0742/2021-7-2-37-49 [Google Scholar]
-
Speiser JL, Miller ME, Tooze J, Ip E. A comparison of random forest variable selection methods for classification prediction modeling. Expert Syst. Appl. 2019, 134, 93–101. DOI:10.1016/j.eswa.2019.05.028 [Google Scholar]
-
Zhang L, Huettmann F, Liu S, Sun P, Yu Z, Zhang X, et al. Classification and regression with random forests as a standard method for presence-only data SDMs: A future conservation example using China tree species. Ecol. Inform. 2019, 52, 46–56. DOI:10.1016/j.ecoinf.2019.05.003 [Google Scholar]
-
Sivanandam P, Lucieer A. Tree Detection and Species Classification in a Mixed Species Forest Using Unoccupied Aircraft System (UAS) RGB and Multispectral Imagery. Remote Sens. 2022, 14, 4963. DOI:10.3390/rs14194963 [Google Scholar]
-
Katila P, Colfer CJ, De Jong W, Galloway G, Pacheco P, Winkel G. Sustainable Development Goals; Cambridge University Press: Cambridge, UK, 2019. [Google Scholar]
-
Zhang J, Fu B, Stafford-Smith M, Wang S, Zhao W. Improve forest restoration initiatives to meet Sustainable Development Goal 15. Nat. Ecol. Evol. 2020, 5, 10–13. DOI:10.1038/s41559-020-01332-9 [Google Scholar]
-
Zhang K, Wen Z. Review and challenges of policies of environmental protection and sustainable development in China. J. Environ. Manag. 2008, 88, 1249–1261. DOI:10.1016/j.jenvman.2007.06.019 [Google Scholar]
-
Hao Y, Xu Y, Zhang J, Hu X, Huang J, Chang CP, et al. Relationship between forest resources and economic growth: Empirical evidence from China. J. Clean. Prod. 2019, 214, 848–859. DOI:10.1016/j.jclepro.2018.12.314 [Google Scholar]
-
Li L, Lu G, Shen Y. The evolution and impact of timber markets in China’s southern collective forest region. For. Policy Econ. 2021, 123, 102353. DOI:10.1016/j.forpol.2020.102353 [Google Scholar]
-
Tong X, Brandt M, Yue Y, Ciais P, Rudbeck Jepsen M, Penuelas J, et al. Forest management in southern China generates short term extensive carbon sequestration. Nat. Commun. 2020, 11, 129. DOI:10.1038/s41467-019-13798-8 [Google Scholar]
-
Yin Y, Ma D, Wu S. Climate change risk to forests in China associated with warming. Sci. Rep. 2018, 8, 493. DOI:10.1038/s41598-017-18798-6 [Google Scholar]
-
Mahtta R, Fragkias M, Güneralp B, Mahendra A, Reba M, Wentz EA, et al. Urban land expansion: The role of population and economic growth for 300+ cities. Npj Urban Sustain. 2022, 2, 5. DOI:10.1038/s42949-022-00048-y [Google Scholar]
-
Li BV, Wu S, Hua F, Mi X. The past and future of ecosystem restoration in China. Curr. Biol. 2024, 34, R379–R387. DOI:10.1016/j.cub.2024.03.057 [Google Scholar]
-
Lü Y, Zhang L, Feng X, Zeng Y, Fu B, Yao X, et al. Recent ecological transitions in China: Greening, browning and influential factors. Sci. Rep. 2015, 5, 8732. DOI:10.1038/srep08732 [Google Scholar]
-
Krott M. Forest Policy Analysis; Springer: Dordrecht, The Netherlands, 2005. [Google Scholar]
-
Delang CO, Wang W. Chinese forest policy reforms after 1998: The case of the natural forest protection program and the slope land conversion program. Int. For. Rev. 2013, 15, 290–304. DOI:10.1505/146554813807700128 [Google Scholar]
-
Zhang P, Shao G, Zhao G, Le Master DC, Parker GR, Dunning JB, et al. China’s forest policy for the 21st century. Science 2000, 288, 2135–2136. DOI:10.1126/science.288.5474.2135 [Google Scholar]
-
Beach RH, Cai Y, Thomson A, Zhang X, Jones R, McCarl BA, et al. Climate change impacts on US agriculture and forestry: Benefits of global climate stabilization. Environ. Res. Lett. 2015, 10, 095004. DOI:10.1088/1748-9326/10/9/095004 [Google Scholar]
-
Fuchs JM, Husmann K, Schick J, Albert M, Lintunen J, Paul C. Severe and frequent extreme weather events undermine economic adaptation gains of tree-species diversification. Sci. Rep. 2024, 14, 2140. DOI:10.1038/s41598-024-52290-2 [Google Scholar]