Can Global Contract Research Organisations Contribute to Decarbonisation? The Impact of Environmentally Sustainable Business Practice on Scope 1 and 2 Emissions

Can Global Contract Research Organisations Contribute to Decarbonisation? The Impact of Environmentally Sustainable Business Practice on Scope 1 and 2 Emissions
Received: 15 August 2025 Revised: 08 January 2026 Accepted: 13 January 2026 Published: 20 January 2026

© 2026 The authors. This is an open access article under the Creative Commons Attribution 4.0 International License (https://creativecommons.org/licenses/by/4.0/).
1. Introduction
Greenhouse Gas (GHG) emissions are becoming an increasingly significant environmental concern, contributing to climate change and long-lasting effects that adversely impact global ecosystems, weather patterns and human health [1]. Carbon emissions, in particular, are a major contributor to the global GHG effect, necessitating the implementation of environmentally sustainable strategies to mitigate harmful emissions [2]. The Greenhouse Gas Protocol, a globally recognised standard for the measurement and management of GHG emissions, defines three scopes of emissions within its reporting framework [3]. Scope 1 emissions refer to an organisation’s direct carbon emissions, i.e., from sources the firm owns or controls, such as fuel combustion from boilers or furnaces, and process emissions resulting from manufacturing/industrial processes [4]. Scope 2 emissions are defined as indirect carbon emissions arising from the purchase of energy, such as electricity and steam [4]. Scope 3 carbon emissions are indirect emissions that occur in the organisation’s upstream and downstream supply chain.
These scopes account for the largest share of the companies’ total carbon footprint. By mitigating these emissions, organisations can develop accountable sustainability strategies and make tangible progress toward achieving global climate goals [5]. The clinical research industry and, especially, contract research organisations (CROs) have received little attention in extant studies regarding their carbon footprint. CROs are private firms contracted to conduct various clinical research functions on behalf of pharmaceutical, biotechnology and medical device organisations undertaking studies in human subjects [6]. This research aims to examine the environmentally sustainable practices implemented by leading global CROs and investigate what impact this practice has on scope 1 and 2 CO2 emissions. Scope 3 emissions are beyond this study, as scope 1 and 2 emissions are the most direct indicators of operational efficiency improvements made by CROs. In this study, a grouping of CROs is considered to be leading organisations as these are influential, well-established companies whose environmentally sustainable practices are likely to be borrowed by other CROs and commonly used across the sector [7,8,9].
2. Literature Review
2.1. Carbon Emissions of Clinical Trials
Clinical trials provide a systematic, evidence-based method for determining the safety and efficacy of novel therapies and medical devices [10]. The importance of clinical trials is underscored by a range of studies, e.g., [11], which examined the growing incidence of communicable and non-communicable diseases worldwide. Although clinical trials are essential from a public health perspective, ref. [11,12] highlight the growing need for decarbonisation of clinical trials, noting the substantial contribution of trials to global GHG emissions. However, little has been done to reduce clinical trial carbon consumption, even though the threat from climate change has significantly increased and continues to grow [12]. Ref. [13] explains that the healthcare sector is one of the most carbon-intensive industries globally, contributing between 4.4% and 4.6% of GHG emissions. Clinical trials, specifically, are a significant contributor, with recent studies indicating global clinical trial emissions equate to 27.5 million tonnes of GHG emissions [13].
Given the considerable impact of scope 1 and 2 emissions on the GHG effect, clinical research organisations must implement appropriate mitigation strategies to curb their emissions. However, despite growing environmental concerns and the significant emissions contributions of the clinical research industry, this industry, in general, and the CRO sector in particular, has received little attention in existing literature regarding its carbon footprint. Data shows that CROs are now responsible for conducting about 75% of clinical trials globally [8]. CROs play a pivotal role in the successful execution of clinical trials, supporting the development of new therapies and devices, and ensuring all aspects of the trial are implemented in line with ethical and regulatory requirements [14].
2.2. Current Knowledge: The Pharmaceutical Sector’s Emissions and CROs
In this study, a comprehensive literature review was conducted to assess current knowledge in the field and identify gaps in the existing literature. This review identified no publications focusing on CROs’ environmental sustainability. Although several studies provide evidence that clinical trials are a significant contributor to global carbon footprint [12,13], extant knowledge is lacking in relation to the environmental sustainability performance of the CROs responsible for trial execution. The literature focuses mainly on larger pharmaceutical companies, rather than the CROs these companies contract for trial management. Studies by [12,15,16,17] explore the carbon footprint of the pharmaceutical sector and clinical trials as a whole, highlighting the growing need for decarbonisation and proposing strategies for emissions reduction.
Research by [18,19,20,21,22] employs a more focused approach, examining the carbon footprint of specific organisations and their progress towards achieving emissions reduction targets. Although clinical trials in general, as well as some leading organisations in the pharmaceutical sector, are explored to some extent in existing research, most authors note a surprising lack of knowledge in this area, given the industry’s emissions intensity. Given the very high proportion of clinical trials conducted by CROs worldwide (75%), the lack of current knowledge about CROs and their emissions should be viewed as a critical gap that provides a rationale for this study. The gap is linked to the unique operational profile of CROs (e.g., energy-intensive laboratories vs. standard office spaces; CROs’ emphasis on experiments and tests that involve emissions, often significant, rather than office work). Due to CROs’ unique features, general studies of the pharmaceutical sector or selected companies are insufficient, which justifies the current paper’s focus on CROs and their emissions intensity.
2.3. Importance of CROs’ Environmental Sustainability and Knowledge Gap
In the context of clinical research, clients, employees, investors, industry peers and the wider community are increasingly engaged with climate change [17]. Stakeholders, including funders and sponsors, are expected to provide justification for their clinical trial carbon footprint and emissions reduction efforts [12,16]. Stakeholders are increasingly placing value on environmental sustainability [23,24,25], which is driving a sustainability improvement agenda among CROs [26]. CROs’ stakeholders are progressively withdrawing capital and/or switching to competitor organisations in those cases where environmental performance is lacking [15]. Whilst many CROs are setting the 2030 GHG reduction targets, the existing knowledge gap means very little is known about the practices these organisations are implementing now in order to achieve these, and what effect these practices are having on emissions.
Aiming to bridge the knowledge gap, at least in part, this study is expected to contribute to a more nuanced understanding of the effectiveness of environmentally sustainable business strategies adopted by CROs. In addition to the assessment of benchmarking practices exemplified by the leading CROs within the clinical trials industry, the study’s findings may also aid in identifying best practices that could influence industry-wide carbon emissions reduction efforts, keeping in mind that the clinical research industry is a significant contributor to the global carbon footprint.
3. Research Questions
To investigate the impact of the CROs’ environmentally sustainable practice on scope 1 and 2 CO2 emissions, the following research questions were set.
RQ1: Have CROs that implemented a greater number of environmentally sustainable practices achieved a greater decrease in scope 1 and 2 emissions in comparison to those CROs that have implemented fewer environmentally sustainable practices within the same timeframe?
RQ2: Does CRO’s implementation of a larger number of sustainable practices within a specific category enable a greater reduction in emissions compared to the implementation of practices in other categories?
Therefore, this research seeks to examine, first, whether the implementation of a greater number of practices overall facilitates a greater decrease in emissions. Second, the study investigates whether the implementation of a greater number of specific types of environmentally sustainable practices enables a greater reduction in emissions than other sustainable practice types achieve.
The following hypotheses were developed.
To address RQ1:
H0: The number of environmentally sustainable business practices implemented does not have a significant effect on the reduction of scope 1 and 2 emissions.
H1: There is a strong negative relationship between the number of environmentally sustainable business practices implemented and the total scope 1 and 2 emissions.
To address RQ2:
H0: There is no difference in the reduction of scope 1 and 2 emissions across categories of sustainable practices implemented.
H1: Certain categories of sustainable practices lead to greater reductions in scope 1 and 2 emissions compared to others.
4. Method
4.1. Research Approach
A quantitative content analysis approach was employed to guide data collection and analysis. This approach was selected because the research comprises the collection and analysis of numerical data and performs statistical analyses to test hypotheses, measure relationships between variables and draw conclusions. The emissions data that forms the basis of the dependent variable encompasses scope 1 and 2 emissions only. This is because organisations have greater control over scope 1 and 2 emissions compared to Scope 3 [27]. Therefore, the focus of this research is emissions at scopes 1 and 2, as this study seeks to examine the relationship between ESG practices implemented and subsequent emissions. The quantitative content analysis approach encompasses three key steps: sampling, data collection, and data analysis, which are outlined below.
4.2. Sampling
A purposive sample of CROs was sought for this study. The aim was to identify a sample of organisations that generate the highest revenue and, therefore, are most active in the CRO sector. The top 20 global CROs, based on their 2023 annual revenue, were selected. Out of these firms, only those that consistently reported annual emissions data (alongside their environmentally sustainable practices) for at least three consecutive years were selected. This ensured accurate and reliable data collection and analysis. This also afforded the opportunity to conduct a comparative analysis that includes each of the 20 organisations, for each year within the five-year timeframe, to investigate which practices were implemented and their subsequent impact on emissions. The annual ESG reports for these organisations were reviewed, revealing that only 7 out of 20 had reported annual scope 1 and 2 emissions data and environmentally sustainable business practices consecutively, throughout this five-year timeframe. These organisations and data availability covering this period are detailed in Table 1.
Table 1. Annual ESG data availability.
|
Organisation |
2019 |
2020 |
2021 |
2022 |
2023 |
|---|---|---|---|---|---|
|
Thermo Fisher |
Not Available |
Not Available |
Available |
Available |
Available |
|
WuXi AppTec |
Available |
Available |
Available |
Available |
Available |
|
Labcorp |
Not Available |
Not Available |
Not Available |
Available |
Available |
|
Charles River |
Available |
Not Available |
Available |
Not Available |
Available |
|
IQVIA |
Available |
Available |
Available |
Available |
Not Available |
|
ICON |
Available |
Available |
Available |
Available |
Available |
|
Parexel |
Available |
Available |
Available |
Available |
Available |
4.3. Data Collection
This study used secondary data from publicly available reports obtained from the websites of each organisation, e.g., Charles River Laboratories [28], IQVIA [29,30,31,32,33], Labcorp [34,35,36]. This data comprises scope 1 and 2 emissions (reported in MTCO2e) and the environmentally sustainable practices implemented throughout the set timeframe. The focus on secondary data is well justified as the study seeks to examine existing data and their impact on emissions, with the intent to draw objective conclusions.
Emissions data were extracted manually from each document and categorised by year for each organisation. This data is summarised in Table 2.
Table 2. Annual Emissions Data.
|
2021 |
2022 |
2023 |
||||
|---|---|---|---|---|---|---|
|
Scope 1 |
Scope 2 |
Scope 1 |
Scope 2 |
Scope 1 |
Scope 2 |
|
|
Thermo Fisher |
327,183.00 |
313,561.00 |
329,290.00 |
267,752.00 |
331,463.00 |
229,110.00 |
|
WuXi AppTec |
15,310.02 |
347,248.63 |
19,453.58 |
495,184.83 |
68,853.62 |
467,798.35 |
|
ICON |
23,388.00 |
15,155.00 |
2211.00 |
13,573.00 |
2503.00 |
13,663.00 |
|
Paraxel |
3013.00 |
19,196.00 |
3104.00 |
6017.00 |
2924.00 |
6943.00 |
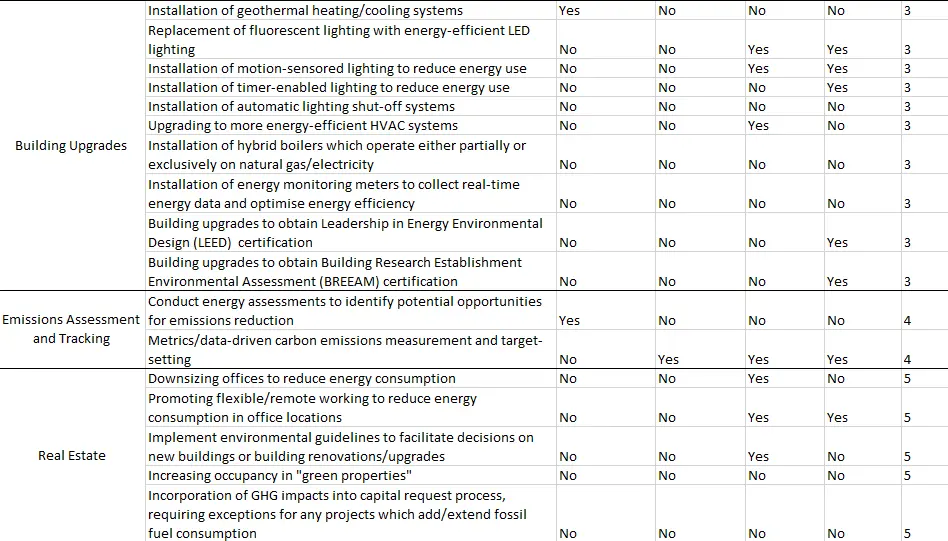
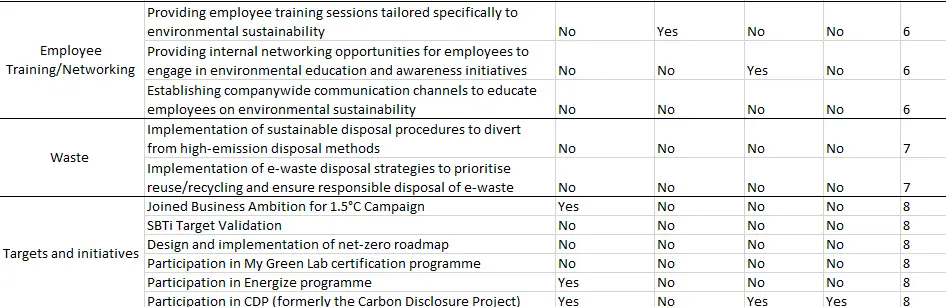
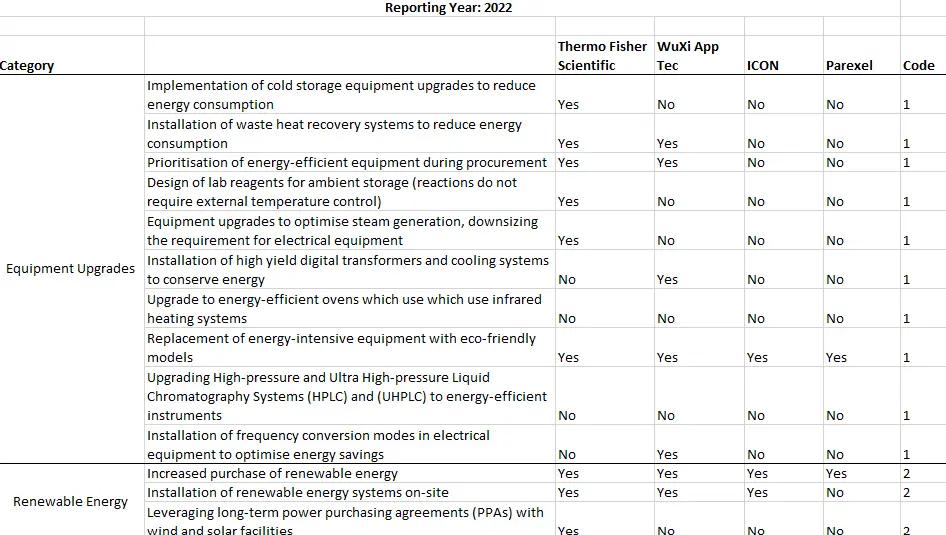
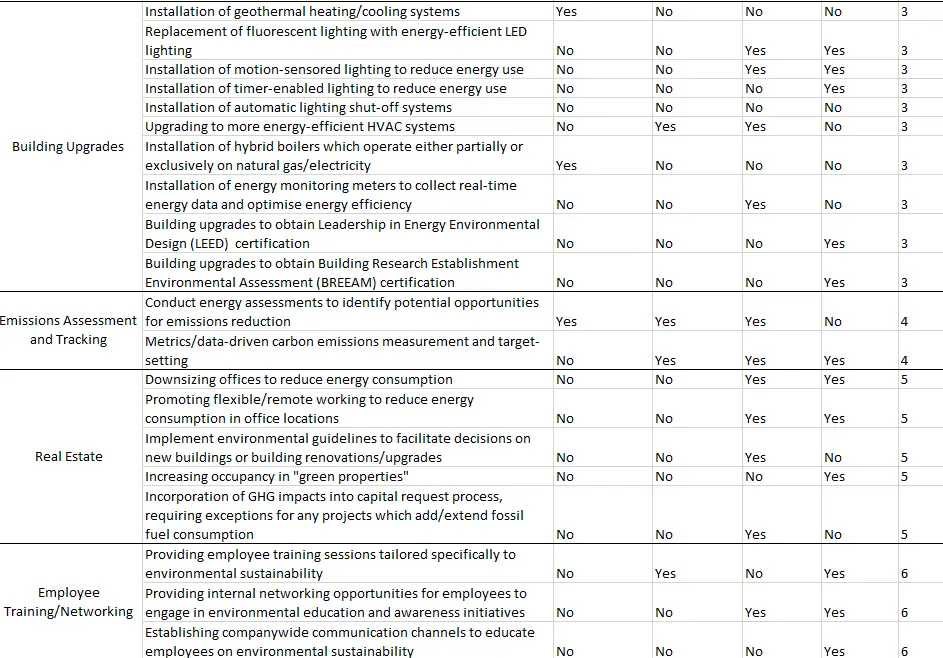
The reports were analysed, and all data pertaining to emissions-related environmentally sustainable practices implemented by each organisation, for each reporting year, were extracted manually. To ensure no data was missed, a cross-check was conducted on each document by applying the search function to find the following terms: “environment”, “emissions”, “scope”, “carbon”, “footprint”, “energy”, “greenhouse”, and “GHG”. As this research is focusing on scope 1 and 2 emissions only, practice relating to Scope 3 emissions, as well as the economic and social sustainability pillars, was excluded. Quantitative content analysis was conducted to analyse and interpret data obtained from the ESG reporting, grouping environmentally sustainable practices under respective themes and determining the frequency each theme appears.
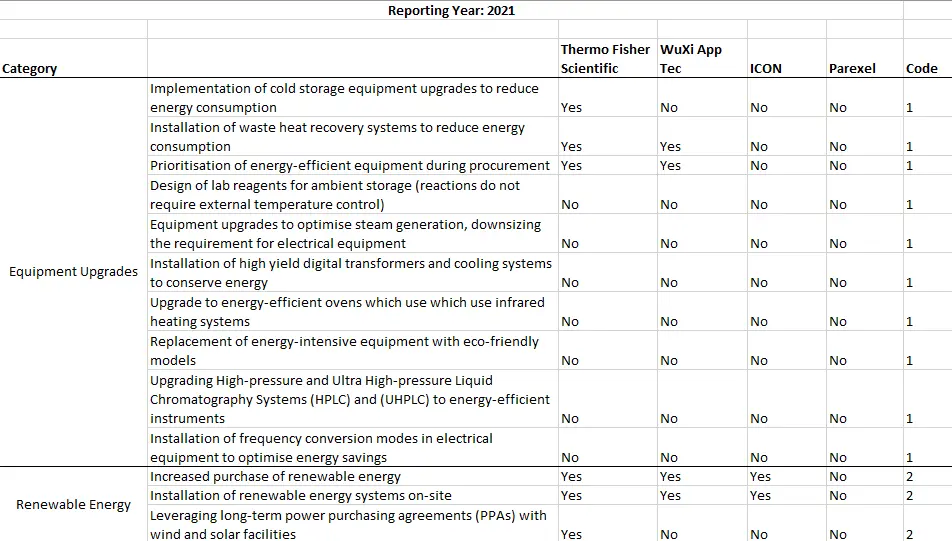
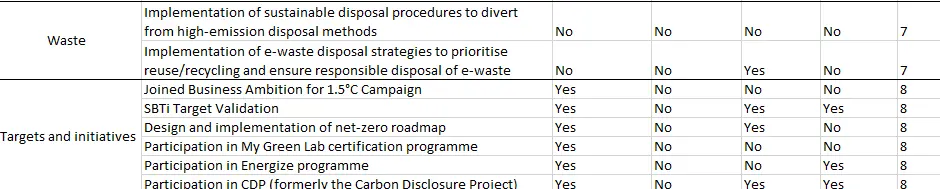
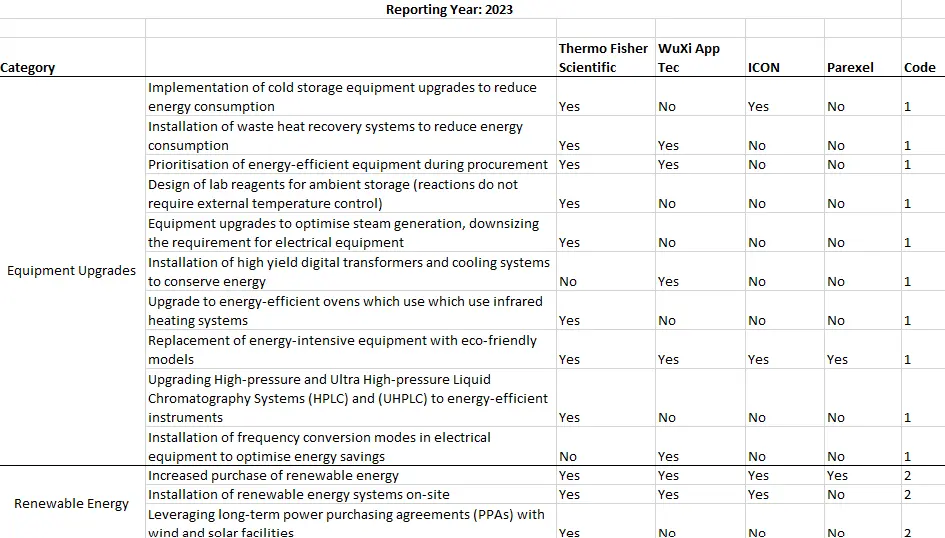
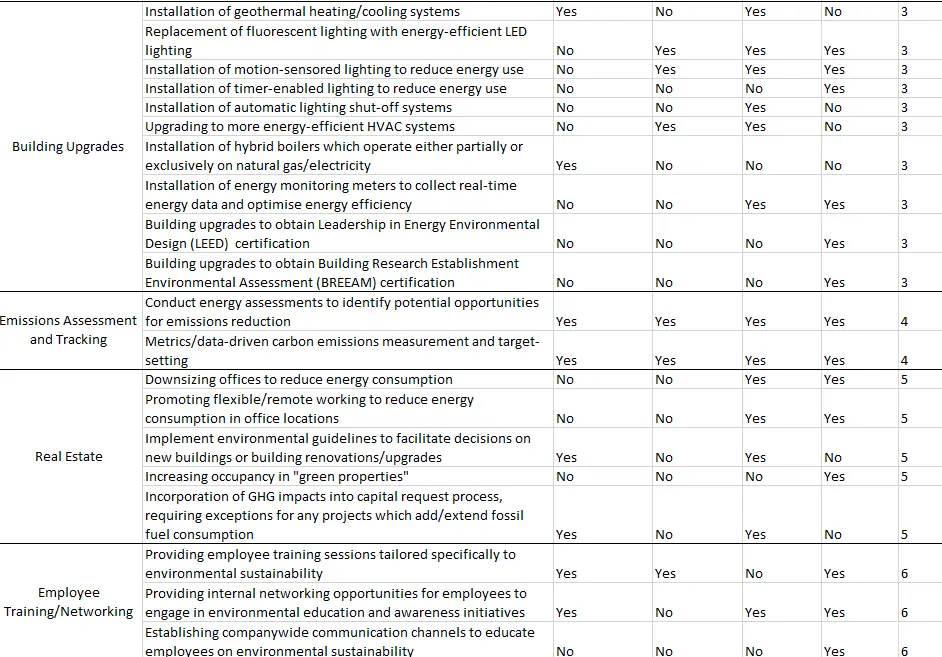
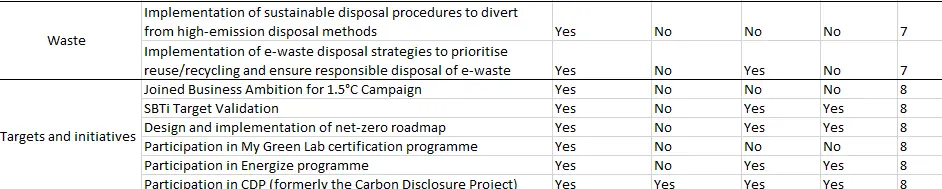
First, every environmentally sustainable practice was extracted manually from each report and listed individually in Excel by reporting year. A “yes” or “no” value was assigned to each individual practice, for each organisation, to indicate if this practice was implemented by each organisation in that year. Each practice was listed individually to aid categorisation within the coding framework and ensure that they were mutually exclusive, i.e., each practice could only be present in one category. The coding framework is provided in the Appendix A.
The content analysis approach was guided by research of [21], wherein each practice, listed individually, was analysed to identify specific words and phrases, thereby enabling categorisation of each practice under a specific theme. The analysis was conducted manually, and values were assigned to each practice in Excel, as detailed in the coding framework. As this research embraces a range of specific practices, each code is assigned equal weight in the analysis. The extracted data demonstrated various common themes, within which each of the sustainable business practices could be grouped. These themes were categorised (see Table 3) and assigned a value of 1 to 8 based on a category:
Table 3. Sustainable practice themes.
|
Category |
Code |
|---|---|
|
Equipment Upgrade |
1 |
|
Renewable Energy |
2 |
|
Building Upgrades |
3 |
|
Emissions Assessment and Tracking |
4 |
|
Real Estate |
5 |
|
Employee Training/Networking |
6 |
|
Waste |
7 |
|
Targets and Initiatives |
8 |
This study focuses on scope 1 and 2 emissions only; scope 3 emissions and practices pertaining to other environmental concerns, such as hazardous waste disposal, recycling and water usage, were excluded.
5. Data Analysis and Findings
This section presents the analytical approaches used to explore the relationship between the implementation of environmentally sustainable practices and scope 1 and 2 emissions among CROs. It begins with a descriptive statistical analysis of the frequency and trends of practice implementation across organisations and reporting years. Following this, statistical techniques were used to evaluate the correlation between the number of practices implemented and changes in scope 1 and 2 emissions, addressing the first research question. To answer the second research question, further correlation analyses were conducted by sustainable practice category to determine whether specific types of practices were more strongly associated with emissions reduction than others.
5.1. Descriptive Statistics of Practice Implementation
The data were entered into SPSS to generate descriptive statistics showing the frequency with which each type of practice was implemented in each reporting year. Values from 1 to 8 were assigned (as Table 4 shows) to each type of sustainable business practice.
Table 4. The outcome of the Spearman correlation analysis between dependent variables and emission practices.
|
Variable |
Relationship with Emissions |
Correlation Coefficient |
p-Value |
|---|---|---|---|
|
equipment upgrades |
Positive |
0.733 |
0.007 |
|
renewable energy practices |
Positive |
0.780 |
0.003 |
|
building upgrades |
Negative |
−0.741 |
0.006 |
|
between emissions assessment/tracking practices |
Week |
0.145 |
0.653 |
|
real estate practices |
Negative |
−0.787 |
0.002 |
|
training/networking practices |
Negative |
−0.607 |
0.036 |
|
waste-focused practices |
Week |
−0.078 |
0.809 |
|
targets and initiatives-focused practices |
Week |
0.043 |
0.895 |
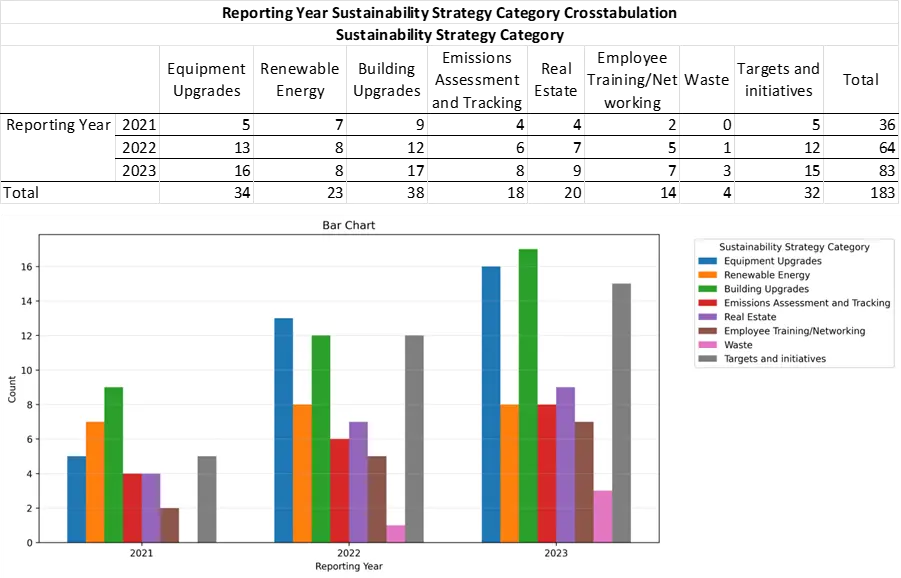
The reporting year was assigned a value of either 1, 2 or 3, corresponding to a reporting year of 2021, 2022 and 2023, respectively. As specified by [37], ordinal and nominal variables are both categorical (ordinal variables have a meaningful order, whilst nominal variables do not). Hence, the sustainable practice variable was assigned as nominal, whilst the reporting year was assigned as ordinal. Bivariate analysis should be used when conducting descriptive analysis for two variables, as this seeks to explore both variables in relation to each other [38]. As the purpose of this analysis was to visualise the types of sustainable practices and the number of organisations that had implemented them in each reporting year, a bivariate analysis was conducted. The output is presented in the cross-tabulation frequency table and bar chart, shown in Figure 1.
The frequency of most practice types implemented increases year on year (with the exception of renewable energy practices that increased by 1 between 2021 and 2022), then remains the same in 2023, with 8 practices implemented. Generally, practices pertaining to building/equipment upgrades are the most frequently occurring, in addition to environmental targets/initiatives that demonstrate a significant increase year on year. These findings are consistent with research by [21] who reported similar observations in a sample of 20 pharmaceutical organisations within the same timeframe.
5.2. Implementation Patterns Across Organisations
To better understand the number of practices implemented by each organisation, separate bivariate analyses were conducted to find out the frequency with which each practice type was implemented by each organisation per reporting year. The outputs are presented in Figure 2.
Thermo Fisher implemented the greatest number of sustainable practices—56 in total (11 in 2021, 18 in 2022, and 27 in 2023) [39,40,41]. The majority of these (17) pertain to equipment upgrades, followed by targets/initiatives-focused practices that account for 15 practices overall. The least frequently occurring practices are those pertaining to Real Estate, Training/Networking, and Waste, with 0 practices implemented in 2021 or 2022 and 2 practices implemented in 2023 for each category, respectively.
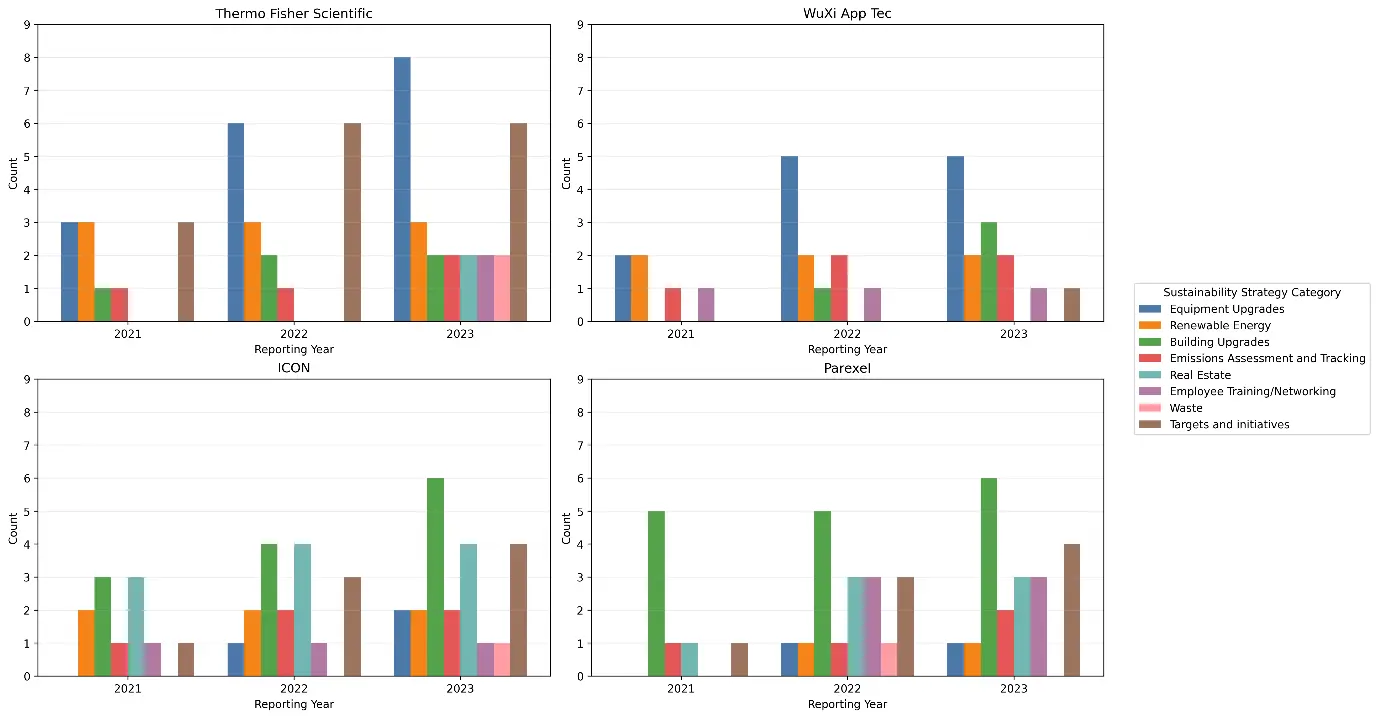
WuXi App Tec implemented the fewest number of practices—31—overall (6 in 2021, 11 in 2022, and 14 in 2023) [42,43,44,45]. The most frequently occurring practice type is Equipment Upgrades, with a total of 12 practices implemented (2, 5, and 5 in 2021, 2022, and 2023, respectively). Targets/initiatives-focused practices were implemented least frequently, with 0 reported in 2021 and 2022, and 1 reported in 2023.
ICON implemented the second greatest number of sustainable practices—51 in total (11 in 2021, 18 in 2022, and 22 in 2023) [46,47,48,49,50]. The majority of these (13) pertain to building upgrades, followed by real estate-focused practices that account for 11 practices overall. The least frequently occurring practices are those pertaining to waste, with 0 implemented in 2021, and 1 practice reported in each 2022 and 2023.
Parexel appears to place more focus than the other organisations on practices pertaining to building upgrades, with 16 practices out of 45 within this category (5 reported in each 2021 and 2022, and 6 reported in 2023) [51,52,53]. The least frequently implemented practice types are those related to equipment upgrades and renewable energy, with 0 practices reported for either category in 2021, and 1 practice implemented in each category in 2022 and 2023.
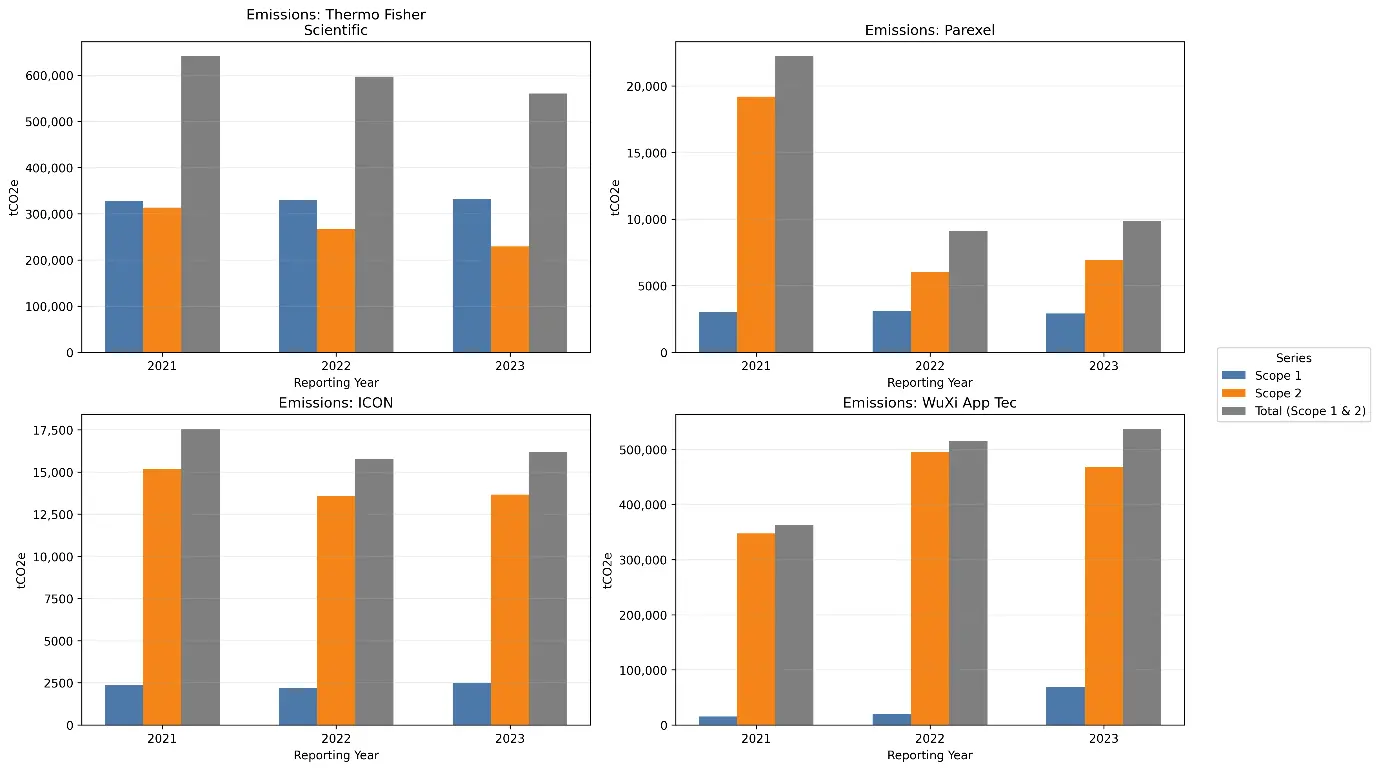
For the purposes of data visualisation, the emissions data outlined in Table 3 were input into Excel, and clustered bar charts were created, detailing the emissions data reported by each organisation, for each year. These are presented in Figure 3.
As demonstrated above, Thermo Fisher Scientific has the highest total scope 1 and 2 emissions, reporting 640,744, 597,042, and 560,573 (MTCO2e) per year in 2021, 2022 and 2023, respectively. It is, however, the only organisation that has consistently reduced total scope 1 and 2 emissions each year. In contrast, WuXi App Tec reported an increase in total scope 1 and 2 emissions each year, whilst ICON and Parexel reported a reduction between 2021 and 2022, followed by a slight increase in 2023. The emissions data in Table 3 were used to calculate the percentage change in total emissions between 2021 and 2023. This indicated that Parexel has achieved the greatest overall percentage decrease in total scope 1 and 2 emissions (55.57%), followed by Thermo Fisher Scientific and ICON, with a total percentage decrease of 12.51% and 7.85%, respectively. Total scope 1 and 2 emissions for Wuxi App Tec, however, increased by 48.02% between 2021 and 2023.
5.3. Assessing the Impact of Sustainable Practices on Emissions
To answer research question 1, the following variables were defined:
Independent variable: Number of environmentally sustainable business practices implemented.
Dependent variable: Total scope 1 and 2 emissions (MTCO2e).
To analyse the relationship between the independent and dependent variables, correlation analysis was conducted. First, inferential statistical analysis was conducted to determine the strength and direction of the relationship. To ascertain the most appropriate correlation method, normality testing was conducted via the Shapiro-Wilk test in SPSS to establish whether the data were normally distributed. This output is provided in Table 5.
Table 5. Tests of Normality output.
|
Kolmogorov-Smirnov |
Shapiro-Wilk |
|||||
|---|---|---|---|---|---|---|
|
Statistic |
df |
Sig. |
Statistic |
df |
Sig |
|
|
Total Scope 1 and 2 Emissions |
0.318 |
12 |
0.002 |
0.761 |
12 |
0.003 |
As explained by [54], if data are normally distributed, the Shapiro-Wilk test will return a Sig. value >0.05. The data show the Sig. value is 0.003, which is therefore indicative of abnormal data distribution. Therefore, parametric testing methods, such as the Pearson correlation, are unsuitable. Where data are not normally distributed, non-parametric testing methods, such as the Spearman correlation, are more appropriate [55] as these do not assume normality of the data. Non-parametric correlation analysis was, therefore, conducted in SPSS via the Spearman correlation. The analysis output is provided in Table 6.
Table 6. Spearman’s correlation.
|
Correlations |
||||
|---|---|---|---|---|
|
Number of Sustainable Practices Implemented |
Total Scope 1 and 2 Emissions |
|||
|
Spearman’s rho |
Number of Sustainable Practices Implemented |
Correlation Coefficient |
1 |
−0.169 |
|
Sig. (2-tailed) |
0.599 |
|||
|
N |
12 |
12 |
||
|
Total Scope 1 and 2 Emissions |
Correlation Coefficient |
−0.169 |
1 |
|
|
Sig. (2-tailed) |
0.599 |
|||
|
N |
12 |
12 |
||
The Spearman correlation coefficient is measured on a scale ranging from +1 (perfect positive linear relationship) to −1 (perfect negative linear relationship), whilst a correlation coefficient of 0 is indicative of no relationship between variables [56]. It can, therefore, be concluded that the variables demonstrate a weak negative correlation (−0.169). This means that as the value of the independent variable increases, the value of the dependent variable decreases [57]. However, this relationship is weak, and as the p-value (0.599) is >0.05, this indicates it is not statistically significant [58]. This allows us to confirm whether the null hypothesis should be accepted or rejected. By setting α = 0.05, obtaining a p-value < 0.05 indicates this value is smaller than the specified significance level (5%), demonstrating there is <5% chance the strength of the relationship occurred by chance if the null hypothesis were true [59]. However, as the p-value is >0.05, in this case, the null hypothesis should be accepted, and the alternative hypothesis rejected. It can therefore be concluded that the implementation of a greater number of sustainable business practices does not facilitate a greater reduction in total scope 1 and 2 emissions.
5.4. Analysis of Emissions Reduction by Sustainable Practice Type
To answer research question 2, the following variables were defined:
Independent variable: Number of environmentally sustainable business practices implemented by type.
Dependent variable: Total scope 1 and 2 emissions (MTCO2e).
To analyse the relationship between the independent and dependent variables, separate correlation analyses were conducted for each category of sustainable practice. These analyses comprised the total number of sustainable practices implemented by category for each reporting year, relative to the total scope 1 and 2 emissions for the same year. Visual inspection indicates a potential positive relationship between both equipment upgrades and renewable energy, on the one hand, and the dependent variable, on the other. A potential negative relationship between both building upgrades and real estate practices, on the one hand, and the dependent variable, on the other, is also observed. However, inferential statistical analysis was conducted to confirm this. As normality testing had already determined abnormal data distribution, correlation analysis was again conducted via the Spearman correlation. These outputs are provided in Table 4.
Research question 2 was set to determine whether a relationship exists between the number of sustainable practices implemented by category and the scope 1 and 2 emissions. When formulating the hypotheses for research question 2, it was postulated that implementing a greater number of sustainable practices within a specific category may enable a greater reduction in emissions than implementing practices in other categories. However, based on the study’s results, it can be concluded that both equipment upgrades and renewable energy practices demonstrated a statistically significant, strong positive relationship with total scope 1 and 2 emissions, indicating that as the number of practices in both categories increased, so too did emissions. In contrast, building upgrades and real estate practices demonstrated a statistically strong negative correlation with total volume of scope 1 and 2 emissions, indicating that as the number of practices implemented in each category increased, emissions decreased.
Training/networking practices indicated a statistically significant moderate negative relationship with scope 1 and 2 emissions. Waste-focused practices and emissions assessment/tracking practices both showed a weak negative relationship with the emissions, neither of which was statistically significant, whilst targets/initiatives-focused practices demonstrated a weak positive relationship with emissions, which was not statistically significant. Therefore, in this case, the results do support the alternative hypothesis, which stipulates that a relationship exists between the number of sustainable practices implemented by type and scope 1 and 2 emissions. However, the limited number of observations (12) in the sample may affect the reliability of the linear model. Therefore, although implementation of a specific practice type may influence emissions, the number of observations is insufficient to confirm this reliably.
6. Discussion
Whilst the results for answering research question 1 demonstrated a negative linear relationship between the number of sustainable practices implemented, on the one hand, and scope 1 and 2 emissions, on the other, the evidence suggests this relationship is weak, and the correlation between the two variables is not statistically significant. Therefore, whilst implementation of a greater number of sustainable practices may seem to facilitate a greater reduction in emissions, the results are not sufficient to confirm this. The available data does not allow this study to factor in the quality of sustainable practices, nor the details of the specific actions taken by each facility or unit within an organisation. Therefore, it is not possible to determine whether it is the number of practices that is influencing subsequent reduction of emissions, or whether other contributing factors enable these results.
The data also demonstrates that emissions are increasing for WuXi App Tec year on year, despite the increase in the implementation of sustainable practices. Therefore, an important consideration that was not factored into the current research is the reason for the increase in emissions. Could this be attributed to organisational growth and expansion, or are there other factors contributing to this increase? Have the other organisations grown significantly during the reporting period? If so, to what extent? The lack of available ESG data for the CRO sector presents a limitation of this research. Given the limited number of observations in the sample size, this may affect the reliability of the correlation analyses.
The purpose of research question 2 was to determine if a relationship exists between the number of practices, implemented by type, on the one hand, and scope 1 and 2 emissions, on the other. Interestingly, the results indicated a statistically strong positive relationship between both equipment upgrades and renewable energy practices and emissions, indicating that as the number of practices in both categories increased, so too did emissions. Meanwhile, a weak positive, non-statistically significant relationship was identified between targets and initiatives-focused practices and emissions. However, an important consideration is the fact that these positive correlations could be attributed to how these organisations are responding to and mitigating increasing emissions, rather than arguing that increasing emissions are a result of an increasing number of practices. If emissions were increasing due to organisational expansion or other factors, firms could be implementing a larger number of sustainability strategies to reduce emissions.
Conversely, building upgrades and real estate practices demonstrated a statistically strong negative correlation with total scope 1 and 2 emissions, indicating that as the number of practices implemented in each category increased, emissions decreased. This aligns with the relationship assumed for setting research question 2. Training/networking practices indicated a statistically significant moderate negative relationship with scope 1 and 2 emissions, whilst waste-focused practices and emissions assessment/tracking practices both showed weak negative relationships with the emissions, neither of which was statistically significant.
The present research does not take into account other factors that may be contributing to scope 1 and 2 emissions. In addition to organisations’ growth and expansion during the reporting period, the examples of these factors include organisational size, the number and type of facilities globally (labs, offices, manufacturing facilities, etc.), the number of employees globally, and the number of clinical tests. Any of these factors may have a substantial impact on the volume of emissions of each organisation. Lastly, it is worth reiterating that the limited data available stems from organisations’ limited reporting. This forms the need for more comprehensive and consistent ESG reporting by CROs in the future, which would allow further studies of organisations’ sustainable practices and their impact on emissions.
7. Conclusions
The results of the research show that implementing more sustainable business practices overall does not lead to a greater reduction in scope 1 and 2 emissions. The results also indicate there may be a linear relationship between the number of practices within a specific category and subsequent emissions.
The first finding suggests that whilst there appears to be a negative relationship between the number of sustainable practices implemented and scope 1 and 2 emissions, this relationship is weak and not statistically significant. This indicates that increasing the number of sustainability initiatives may not be sufficient to drive measurable emissions reductions. One reason for this could be the lack of data on the quality and types of practices used. Also, the potential influence of external factors, such as organisational growth, limits the ability to draw firm conclusions. The case of WuXi App Tec, where emissions have continued to rise despite an increasing number of sustainability measures, highlights the need to examine related factors more closely. In addition, limited ESG reporting across the CRO sector makes it difficult to fully understand the impact of these practices, underscoring the importance of improved data availability for future research.
The results also show that whilst some sustainable practices, such as building upgrades and real estate improvements, are linked to reductions in scope 1 and 2 emissions, others, such as equipment upgrades and renewable energy investments, are surprisingly associated with higher emissions. This does not necessarily mean these efforts cause emissions to rise. Instead, it suggests that organisations are using more of these practices in response to increasing emissions, possibly due to growth or other operational changes. Training and networking activities also seem to help reduce emissions, whilst other categories show weaker or unclear effects. Overall, the findings highlight the complex relationship between sustainability efforts and emissions, where, in some cases, higher emissions may lead to more sustainability efforts, rather than where the sustainability activities reduce emissions. The findings is aligned with existing sustainability and decarbonisation literature, e.g., a study that reveals the effects of green fiscal policy in reducing pollutant and carbon emissions [60], a paper that shows that growth of infrastructure is more likely to cause lasting damage if built at a higher pace [61] and research that unpacks the broader trade-offs between economic, decarbonisation and security goals [62]. This demonstrates how the paper’s findings are situated within the wider academic debate.
For CROs, sustainability efforts alone, especially when measured only by quantity, may not be enough to reduce emissions effectively. The findings show that simply increasing the number of sustainable practices does not guarantee lower emissions, and, in some cases, practices may be implemented as a reaction to rising emissions, rather than a solution to prevent them. This reflects a more complex and reactive approach to sustainability. A counterintuitive finding that sustainability efforts showed a positive correlation with emissions, which is this paper’s contribution, appears, on the surface, to be a paradox. However, this is an important warning against measuring sustainability by the quantity of initiatives, rather than their quality and/or impact on the emissions’ volume.
For CROs, this highlights a critical need to focus on the effectiveness and strategic use of sustainability measures, not just quantity. It is likely that organisational factors, such as growth, expansion, and the nature of global operations, play a major role in emissions outcomes, and ignoring these makes it harder to measure real progress towards climate change mitigation.
Furthermore, improved transparency and data quality are crucial for identifying best practices that make a difference. For CROs to make measurable environmental improvements, they must invest not just in a larger number of sustainable practices, but in more comprehensive and consistent ESG reporting, targeted strategies, and sector-wide collaboration to address shared challenges.
7.1. Implications
The findings suggest that leading CROs are not currently setting a clear benchmark for effective emissions reduction through sustainability practices. Whilst they may be implementing more initiatives, the lack of consistent results and limited transparency means that smaller or less advanced CROs have little guidance on what activities work effectively. This shows a missed opportunity. If leading CROs took a more strategic, results-oriented approach and improved their ESG reporting, they could set stronger standards for the sector and enable broader improvements by demonstrating examples of their sustainability efforts.
The inconsistency and lack of detail in ESG reporting across the CRO sector significantly limit the ability to assess impact or identify best practices. To close this gap, ESG reporting must become more standardised, transparent, and aligned with global frameworks. This would not only improve accountability but also enable more meaningful comparisons across organisations, ultimately helping the sector move beyond surface-level sustainability claims.
CROs play a critical role in global healthcare and pharmaceutical development, but their growing environmental impact is often not recognised or given enough attention. The study’s findings highlight the need for the clinical research industry to take a stronger, data-driven stance on emissions. Without clear reporting and a better connection between actions and results, sustainability efforts, whilst they appear meaningful, may have little real impact. Stronger leadership from large CROs could help create a better climate action not only in their own sector but also in the global supply chains they affect. The approach taken in this study—isolating CROs from the broader pharmaceutical industry—has afforded an opportunity to emphasise the importance of studying the clinical research sector, its emissions and efforts to mitigate them, which is the paper’s novelty and its notable contribution to the supply chain decarbonisation literature.
7.2. Limitations and Suggestions for Further Research
Several limitations of the present research should be acknowledged. One is data availability. Only four organisations had at least three consecutive years of reliable reporting of environmentally sustainable business practices and scope 1 and 2 emissions. The lack of available data meant that comparative analysis could only be conducted for a small proportion of leading global CROs. Therefore, the exclusion of the other CRO industry leaders may generate interpretation bias due to the limited number of organisations included. In addition, as the focus of this research was CRO industry leaders, the selection of companies was conducted via purposive sampling based on annual revenue. Other firms that earned less revenue did not, therefore, meet the selection criteria. Future studies could set different selection criteria to include factors, such as overall clinical trial success rate or percentage FDA approval rate, to broaden the scope of potential CROs. Another option would be to obtain data for all CROs globally, categorise these based on attributes, and conduct comparative analyses for all CROs within a specific category. For example, CROs could be grouped by therapeutic area covered (oncology, cardiovascular, infectious diseases, etc.), by market type (i.e., drug discovery, pre-clinical, clinical), or by end-user (e.g., pharmaceutical companies, medical device companies, academic institutes, government organisations).
As this research does not consider various other contributing factors that may be influencing emissions, further research is required in order to gain additional insights into the type and quality of the specific practices implemented by CROs, as well as other factors that may impact emissions. Future research could conduct comparative analyses of various organisational types within the clinical research industry, e.g., CROs vs. pharmaceutical and/or biotechnology companies, to determine the types of practice these organisations implement and the subsequent impact on emissions.
Another limitation is the use of solely secondary data. There is, therefore, no control over data quality, and the data context may vary across organisations. For example, the specific practices and level of information about these are not standardised, which presents a challenge in terms of data analysis and interpretation of findings. Additionally, as this research is based solely on secondary data obtained from publicly available documents, the data may be subject to data biases from those who produced it, i.e., the organisations in question. Whilst the secondary data obtained for this research was useful in answering the research questions, future research could involve primary data collection pertaining to specific practices implemented by these organisations and analyse this data alongside the secondary data from the published ESG reports.
In addition, the small sample size represents a critical limitation for the reliability of the Spearman correlation analysis. The statistical power is low, and the findings should be interpreted as exploratory associations, rather than robust or causal relationships. Future research should replicate these analyses with larger, adequately powered samples to confirm the observed trends.
Finally, the study does not normalise emissions by revenue or output (i.e., intensity metrics). This means that an increase in absolute emissions, such as in the case of WuXi App Tec, might still represent improved carbon efficiency if the company experienced significant growth. Future studies should incorporate intensity-based measures to capture efficiency trends better and provide a more nuanced interpretation of sustainability performance.
In relation to CROs’ strategies for dealing with emissions, future studies would benefit from drawing on the work of Du et al. [63] on decarbonising data centre networks, which may provide useful suggestions on how CROs could manage the rising digital carbon footprint of clinical trial data. This is particularly relevant for future strategies regarding Scope 2 emissions as CROs increasingly rely on data-heavy operations, where computing power migration and renewable integration could offer significant efficiencies. Another avenue for future research is to explore how the clinical trials sector could handle the expansion of its infrastructure while not allowing emissions to increase. In this theme, the work of Giannelos et al. [64] regarding network expansion planning under uncertainty offers a useful foundation for investigating how CROs might optimise their long-term infrastructure investments. This perspective is vital for future research on mitigating CROs’ financial and environmental risks when upgrading facilities, such as laboratories and equipment, amidst changing clinical trial demands and regulatory uncertainties.
Appendix A
Statement of the Use of Generative AI and AI-Assisted Technologies in the Writing Process
During the preparation of this manuscript, the authors used Grammarly, the free version that does not have the AI-generative capability. This tool was used for making minor editorial adjustments to the text. After using this tool/service, the authors reviewed and edited the content as needed and takes full responsibility for the content of the published article.
Author Contributions
Conceptualization, K.-A.W. and E.O.; Methodology, K.-A.W., E.O. and N.M.; Software, K.-A.W. and E.O.; Validation, K.-A.W., E.O. and N.M.; Formal Analysis, K.-A.W., E.O. and N.M.; Investigation, K.-A.W., E.O. and N.M.; Resources, K.-A.W., E.O. and N.M.; Data Curation, K.-A.W., E.O. and N.M.; Writing—Original Draft Preparation, K.-A.W.; Writing—Review & Editing, K.-A.W., E.O. and N.M.; Project Administration, K.-A.W., E.O. and N.M.
Ethics Statement
Not applicable.
Informed Consent Statement
Not applicable.
Data Availability Statement
The datasets generated during and/or analysed during the current study are publicly available online.
Funding
This research received no external funding.
Declaration of Competing Interest
The authors declare that they have no known competing financial interests or personal relationships that could have appeared to influence the work reported in this paper.
References
-
Mikhaylov A, Moiseev N, Aleshin K, Burkhardt T. Global climate change and greenhouse effect. Entrep. Sustain. Issues 2020, 7, 2897–2913. DOI:10.9770/jesi.2020.7.4(21) [Google Scholar]
-
Filonchyk M, Peterson MP, Yan H, Gusev A, Zhang L, He Y, et al. Greenhouse gas emissions and reduction strategies for the world’s largest greenhouse gas emitters. Sci. Total Environ. 2024, 944, 173895. DOI:10.1016/j.scitotenv.2024.173895 [Google Scholar]
-
Caro D. Carbon Footprint. In Encyclopaedia of Ecology, 2nd ed.; Elsevier: Amsterdam, The Netherlands, 2019; pp. 252–257. DOI:10.1016/B978-0-12-409548-9.10752-3 [Google Scholar]
-
Mahapatra SK, Schoenherr T, Jayaram J. An assessment of factors contributing to firms’ carbon footprint reduction efforts. Int. J. Prod. Econ. 2021, 235, 108073. DOI:10.1016/j.ijpe.2021.108073 [Google Scholar]
-
Krabbe O, Linthorst G, Blok K, Crijns-Graus W, van Vuuren DP, Höhne N, et al. Aligning corporate greenhouse-gas emissions targets with climate goals. Nat. Clim. Change 2015, 5, 1057–1060. DOI:10.1038/nclimate2770 [Google Scholar]
-
Roberts DA, Kantarjian HP, Steensma DP. Contract research organizations in oncology clinical research: Challenges and opportunities. Cancer 2016, 122, 1476–1482. DOI:10.1002/cncr.29994 [Google Scholar]
-
Statista. Leading Global Contract Research Organizations (CROs) Based on 2024 Revenue, 2024. Available online: https://www.statista.com/statistics/732804/top-clinical-research-organizations-by-revenue/ (accessed on 5 October 2024).
-
Straits Research. Clinical Trials Outsourcing Market Size, Share & Growth Report by 2033, 2024. Available online: https://straitsresearch.com/report/clinical-trials-outsourcing-market#:~:text=As%20of%202023%2C%20over%2075,trial%20execution%20and%20regulatory%20compliance (accessed on 28 December 2024).
-
Zion Market Research. Global Contract Research Organization (CRO) Market Size, Share, Growth Analysis Report – Forecast 2034, 2024. Available online: https://www.zionmarketresearch.com/report/contract-research-organization-cro-market (accessed on 5 October 2024).
-
Jager W. The importance of clinical trials in advancing medical research. Ann. Clin. Trials Vaccines 2023, 13, 93–98. Available online: https://www.openaccessjournals.com/articles/the-importance-of-clinical-trials-in-advancing-medical-research-16485.html (accessed on 11 October 2024).
-
Kandi V, Vadakedath S. Clinical trials and clinical research: A comprehensive review. Cureus 2023, 15, e35077. DOI:10.7759/cureus.35077 [Google Scholar]
-
Adshead F, Al-Shahi Salman R, Aumonier S, Collins M, Hood K, McNamara C, et al. A strategy to reduce the carbon footprint of clinical trials. Lancet 2021, 398, 281–282. DOI:10.1016/S0140-6736(21)01384-2 [Google Scholar]
-
Nidhi A. Reducing the carbon footprint of clinical trials: Implementing sustainable practices in clinical research. Nat. Environ. Pollut. Technol. 2023, 22, 2111–2119. DOI:10.46488/NEPT.2023.v22i04.036 [Google Scholar]
-
Dehlinger-Kremer M, Lüning H, Yaşaroğulları Ş, Rolando D, Mahi L. OP16 The importance of clinical research organizations (CRO) in clinical research and impact of COVID-19 Pandemic. Value Health 2023, 26, S310. DOI:10.1016/j.jval.2023.03.2718 [Google Scholar]
-
Furtner D, Hutas G, Tan BJW, Meier R. Journey from an enabler to a strategic leader: Integration of the medical affairs function in ESG initiatives and values. Pharm. Med. 2023, 37, 405–416. DOI:10.1007/s40290-023-00485-9 [Google Scholar]
-
Hoffmann JM, Bauer A, Grossmann R. The carbon footprint of clinical trials: A global survey on the status quo and current regulatory guidance. BMJ Glob. Health 2023, 8, e012754. DOI:10.1136/bmjgh-2023-012754 [Google Scholar]
-
Milanesi M, Runfola A, Guercini S. Pharmaceutical industry riding the wave of sustainability: Review and opportunities for future research. J. Clean. Prod. 2020, 261, 121204. DOI:10.1016/j.jclepro.2020.121204 [Google Scholar]
-
Belkhir L, Elmeligi A. Carbon footprint of the global pharmaceutical industry and relative impact of its major players. J. Clean. Prod. 2019, 214, 185–194. DOI:10.1016/j.jclepro.2018.11.204 [Google Scholar]
-
Okereke M. How pharmaceutical industries can address the growing problem of climate change. J. Clim. Change Health 2021, 4, 100049. DOI:10.1016/j.joclim.2021.100049 [Google Scholar]
-
Ray A, Sharma S, Sadasivam B. Carbovigilance: Curtailing the global pharmaceutical carbon footprint. Future Healthc. J. 2021, 8, e683–e685. DOI:10.7861/fhj.2021-0071 [Google Scholar]
-
Booth A, Jager A, Faulkner SD, Winchester CC, Shaw SE. Pharmaceutical company targets and strategies to address climate change: Content analysis of public reports from 20 pharmaceutical companies. Int. J. Environ. Res. Public Health 2023, 20, 3206. DOI:10.3390/ijerph20043206 [Google Scholar]
-
López B, Rangel-Pérez C, Fernández M. Sustainable strategies in the luxury business to increase efficiency in reducing carbon footprint. J. Bus. Res. 2023, 157, 113607. DOI:10.1016/j.jbusres.2022.113607 [Google Scholar]
-
Mensah J, Casadevall SR. Sustainable development: Meaning, history, principles, pillars, and implications for human action: Literature review. Cogent Soc. Sci. 2019, 5, 1653531. DOI:10.1080/23311886.2019.1653531 [Google Scholar]
-
Purvis B, Mao Y, Robinson D. Three pillars of sustainability: In search of conceptual origins. Sustain. Sci. 2019, 14, 681–695. DOI:10.1007/s11625-018-0627-5 [Google Scholar]
-
Wolniak R, Gajdzik B, Grebski W. Environmental sustainability in business. Sci. Pap. Silesian Univ. Technol. Organ. Manag. 2023, 175, 611–630. DOI:10.29119/1641-3466.2023.175.39 [Google Scholar]
-
Fultinavičiūtė U. The E in ESG: How CROs Aim to Leave a Positive Ecological Mark. 2022. Available online: https://www.clinicaltrialsarena.com/news/e-in-esg-cro/?cf-view (accessed on 11 October 2024).
-
Doda B, Gennaioli C, Gouldson A, Grover D, Sullivan R. Are corporate carbon management practices reducing corporate carbon emissions? Corp. Soc. Responsib. Environ. Manag. 2015, 23, 257–270. DOI:10.1002/csr.1369 [Google Scholar]
-
Charles River Laboratories. 2025 Corporate Citizenship Reports, 2023, 2021, 2019. Available online: https://www.criver.com/about-us/about-us-overview/corporate-citizenship/esg-library-reports-disclosures-and-statements (accessed on 7 October 2024).
-
IQVIA. 2023 Environmental, Social and Governance Report, 2024. Available online: https://www.iqvia.com/-/media/iqvia/pdfs/about-us/esg/iqvia-2023-esg-report.pdf (accessed on 9 October 2024).
-
IQVIA. 2022 Environmental, Social and Governance Report, 2023. Available online: https://www.iqvia.com/-/media/iqvia/pdfs/about-us/esg/iqvia-2022-esg-report.pdf (accessed on 9 October 2024).
-
IQVIA. 2021 Environmental, Social and Governance Report, 2022. Available online: https://www.iqvia.com/-/media/iqvia/pdfs/about-us/esg/iqvia-2021-esg-report.pdf (accessed on 9 October 2024).
-
IQVIA. 2020 Sustainability Report, 2021. Available online: https://www.iqvia.com/-/media/iqvia/pdfs/about-us/2020-sustainability-report.pdf (accessed on 9 October 2024).
-
IQVIA. 2019 Sustainability and Corporate Citizenship Report, 2020. Available online: https://www.iqvia.com/-/media/iqvia/pdfs/about-us/2019-sustainability-report.pdf (accessed on 9 October 2024).
-
Labcorp. 2024 Corporate Responsibility Report, 2025. Available online: https://www.labcorp.com/about/our-impact/sustainability (accessed on 16 April 2025 October).
-
Labcorp. 2023 Corporate Responsibility Report, 2024. Available online: https://ir.labcorp.com/static-files/3b911bf0-8257-479a-850d-877901cb4dd7 (accessed on 9 October 2024).
-
Labcorp. 2022 Corporate Responsibility Report, 2023. Available online: https://ir.labcorp.com/static-files/bf3a9aa6-c28e-49c1-8e29-893703174a16 (accessed on 9 October 2024).
-
Field A. Discovering Statistics Using IBM SPSS Statistics; Sage Publications: London, UK, 2017. [Google Scholar]
-
Bertani A, Di Paola G, Russo E, Tuzzolino F. How to describe bivariate data. J. Thorac. Dis. 2018, 10, 1133–1137. DOI:10.21037/jtd.2018.01.134 [Google Scholar]
-
Thermo Fisher Scientific Inc. 2023 Corporate Social Responsibility Report, 2024. Available online: https://corporate.thermofisher.com/content/dam/tfcorpsite/documents/corporate-social-responsibility/annual-reports/2023-CSR-Report.pdf (accessed on 8 October 2024).
-
Thermo Fisher Scientific Inc. 2022 Corporate Social Responsibility Report, 2023. Available online: https://corporate.thermofisher.com/content/dam/tfcorpsite/documents/corporate-social-responsibility/2022%20Corporate%20Social%20Responsibility%20Report.pdf (accessed on 8 October 2024).
-
Thermo Fisher Scientific Inc. 2021 Corporate Social Responsibility Report, 2022. Available online: https://corporate.thermofisher.com/content/dam/tfcorpsite/documents/corporate-social-responsibility/2021-CSR-Report%20Thermo%20Fisher%20Scientific.pdf (accessed on 8 October 2024).
-
WuXi App Tec. 2023 Environmental, Social and Governance Report, 2024. Available online: https://officialsite-static.wuxiapptec.com/upload/ESG_2023_English_f12dec5dd9.pdf (accessed on 7 October 2024).
-
WuXi App Tec. 2022 Environmental, Social and Governance Report, 2023. Available online: https://officialsite-static.wuxiapptec.com/upload/ESG_2022_English_da6f9306c9.pdf (accessed on 7 October 2024).
-
WuXi App Tec. 2021 Environmental, Social and Governance Report, 2022. Available online: https://officialsite-static.wuxiapptec.com/upload/ESG_2021_English_hd_927bfd3138.pdf (accessed on 7 October 2024).
-
WuXi App Tec. 2020 Corporate Social Responsibility Report, 2021. Available online: https://officialsite-static.wuxiapptec.com/upload/CSR_2020_English_7a6ab935b1.pdf (accessed on 7 October 2024).
-
ICON plc. ICON Cares 2023 ESG Report, 2024. Available online: https://www2.iconplc.com/2023_ESG_Report (accessed on 9 October 2024).
-
ICON plc. ICON Cares 2022 ESG Report, 2023. Available online: https://www2.iconplc.com/ICON_CARES_2022_ESG_Report (accessed on 9 October 2024).
-
ICON plc. 2021 ESG Report: Caring for Patients, People, and Planet, 2022. Available online: https://www2.iconplc.com/ICON_ESG_Report (accessed on 9 October 2024).
-
ICON plc. 2020 Environmental, Social and Governance Report, 2021. Available online: https://www2.iconplc.com/ICON_Publication_ESG_Report_November_2020 (accessed on 9 October 2024).
-
ICON plc. 2019 Environmental, Social and Governance Report, 2020. Available online: https://www2.iconplc.com/esg_report (accessed on 9 October 2024).
-
Parexel. 2023 Environmental, Social and Governance (ESG) Report, 2024. Available online: https://newsroom.parexel.com/static-files/448fa58f-8e3b-460c-ab2e-7edcaf8dbd56 (accessed on 8 October 2024).
-
Parexel. 2022 Environmental, Social and Governance (ESG) Report, 2023. Available online: https://newsroom.parexel.com/static-files/dca7f45f-d4f1-430d-872d-064136f8de60 (accessed on 8 October 2024).
-
Parexel. 2021 ESG Report: Our Environmental, Social and Governance (ESG) Approach, 2022. Available online: https://newsroom.parexel.com/static-files/bb624db0-4afa-4d3d-a0bc-2b91d0b7f0d1 (accessed on 8 October 2024).
-
Ghasemi A, Zahediasl S. Normality tests for statistical analysis: A guide for non-statisticians. Int. J. Endocrinol. Metab. 2012, 10, 486–489. DOI:10.5812/ijem.3505 [Google Scholar]
-
Mukaka MM. A guide to appropriate use of correlation coefficient in medical research. Malawi Med. J. 2012, 24, 69–71. DOI:10.4314/mmj.v24i3 [Google Scholar]
-
Schober P, Boer C, Schwarte LA. Correlation coefficients: Appropriate use and interpretation. Anesth. Analg. 2018, 126, 1763–1768. DOI:10.1213/ane.0000000000002864 [Google Scholar]
-
Henley AJ, Wolf D. Learn Data Analysis with Python: Lessons in Coding; Apress: New York, NY, USA, 2018. [Google Scholar]
-
Schwarz JS, Chapman C, McDonnell E. Python for Marketing Research and Analytics; Springer International Publishing: Greer, SC, USA, 2020. [Google Scholar]
-
DATAtab. Spearman’s Rank Correlation Coefficient, 2024. Available online: https://datatab.net/tutorial/spearman-correlation (accessed on 21 December 2024).
-
Bai T, Xu D, Bi S, Zhu K, Dávid LD. Impact of green fiscal policy on the collaborative reduction of pollution and carbon emissions: Evidence from energy saving and emission reduction policy in China. Oeconomia Copernic. 2024, 15, 1263–1302. DOI:10.24136/oc.3159 [Google Scholar]
-
Hoffmann C. Decarbonization rush? The problem of speed in the energy transition. Econ. Soc. 2025, 54, 789–810. DOI:10.1080/03085147.2025.2588931 [Google Scholar]
-
Meckling J. The geoeconomic turn in decarbonization. Nature 2025, 645, 869–876. DOI:10.1038/s41586-025-09416-x [Google Scholar]
-
Du Z, Yin H, Zhang X, Hu H, Liu T, Hou M, et al. Decarbonisation of Data Centre Networks through Computing Power Migration. In Proceedings of the 2025 IEEE 5th International Conference on Computer Communication and Artificial Intelligence (CCAI), Haikou, China, 23–25 May 2025; pp. 871–876. DOI:10.1109/CCAI65422.2025.11189418 [Google Scholar]
-
Giannelos S, Konstantelos I, Zhang X, Strbac G. A stochastic optimization model for network expansion planning under exogenous and endogenous uncertainty. Electr. Power Syst. Res. 2025, 248, 111894. DOI:10.1016/j.epsr.2025.111894 [Google Scholar]