Diversity and Community Structure of Birds in Urbanized Habitats of a City in the Arid Zone in South-Western Africa

Diversity and Community Structure of Birds in Urbanized Habitats of a City in the Arid Zone in South-Western Africa
Grzegorz Kopij 1,2,*
Received: 08 September 2025 Revised: 14 October 2025 Accepted: 24 December 2025 Published: 31 December 2025

© 2025 The authors. This is an open access article under the Creative Commons Attribution 4.0 International License (https://creativecommons.org/licenses/by/4.0/).
1. Introduction
Promoting urban green spaces, such as urban parks, woods and gardens, is a very efficient way to improve both human wellbeing and biodiversity conservation in cities [1,2]. From an environmental point of view, the green spaces ameliorate local climate, improve air quality, reduce noise, conserve biodiversity and increase architectural aesthetics. From the economic point of view, green spaces often cause an increase in property values and the creation of job opportunities (the maintenance of green spaces). Last, but not least, green spaces create avenues for education, recreation, sport, birding and other nature-related activities [1,2].
In spite of the significance of urban green spaces in human life, biodiversity protection and city development [3,4,5,6], their depletion rates are alarming in sub-Saharan countries, as shown in Dar es Salaam, Accra, Kumasi, Luanda, and four cities in Malawi [7,8,9,10]. The causation factors include the pressure of rapid urbanization, socioeconomic challenges, poor urban planning regulations, weak institutions, and a lack of research on the positive effects on human life and biodiversity.
The ecology and biodiversity of tropical cities are as important as they are unknown [11]. Recently, the situation seems, however, to be changing. Out of 264 articles on urban green spaces of Africa published in 2000–2023, 68% were published in the last 5 years, although 63% in only four countries, viz. South Africa (25%), Ethiopia (13%), Ghana (13%), and Nigeria (12%) [12]. Awoyemi & Ibanez-Alamo (2023) [13] have reviewed 795 articles on urban ecology of Africa for the period 1920–2020. This constitutes merely 3% of urban ecology in the world (for comparison, in Germany—2479, Australia—2900 articles are available on this subject). As in Muhoza & Zhou (2024) [12], the articles were searched across the following databases: Web of Science, Google Scholar, and Scopus. Most of these African articles (55%) are from South Africa, and 40.3% are on animal ecology.
Only four articles from Namibia and four from Botswana were found in these bases. In other SADAC countries, the situation is not better. Altogether, in 16 member states of the SADAC, the number is 518, including 437 from South Africa and 26 from Madagascar. However, from 2015, a rapid exponential growth in the number of these articles has taken place, so that today much higher numbers can be expected in some of these countries.
The presented paper further contributes to the knowledge urban ecology to one of the SADAC countries, and provides vital information on avian communities associated with various habitats in Windhoek, the capital city of Namibia.
2. Methodology
2.1. Study Area
Studies were conducted in Windhoek, the biggest city and the capital of Namibia. For bird counts, five study plots were designed (Figure 1, Table 1). These plots were selected randomly to reflect different types of habitats in the urbanized landscape. Three transects (four in the city centre) were designed for bird counting in each study plot. Transects were designed along all streets within each selected plot. In total, 16 transects were designed, with a total length of 82.8 km.
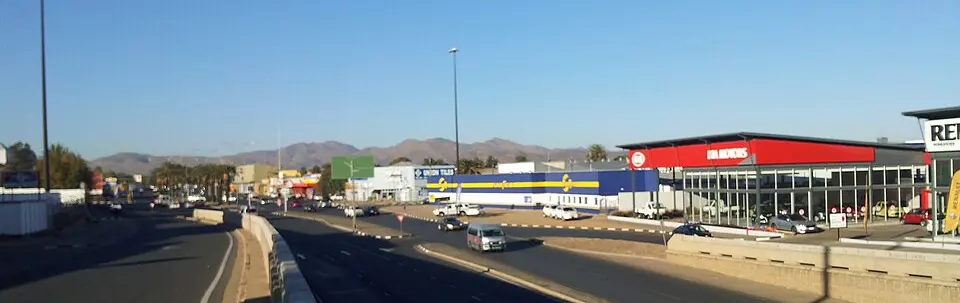
(A) Windhoek city centre, 19.5 km; densely-built up area, mostly public buildings with shops and services, devoid of green spaces (Figure 2A);
(B) Southern industrial area, 19.4 km; mostly densely built-up areas on a flat dry land; mostly light industry activities (Figure 2B);
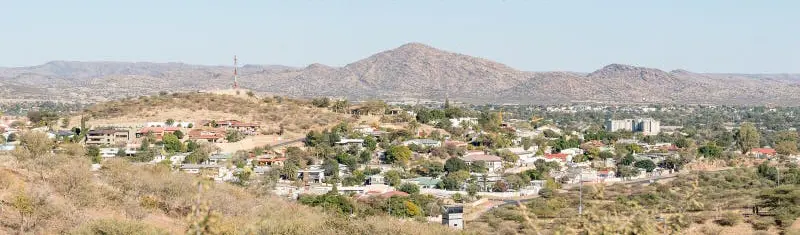
(Ca) Eros residential suburbs, 10.3 km; mostly residential flats situated in a hilly valley;
(Cb) Klein Windheok residential suburbs, 16.2 km; mostly residential areas on a humid hill;
(Cc) Olimpia/Suiderhof residential suburbs, 17.4 km; mostly residential area on a dry flat land and hills.
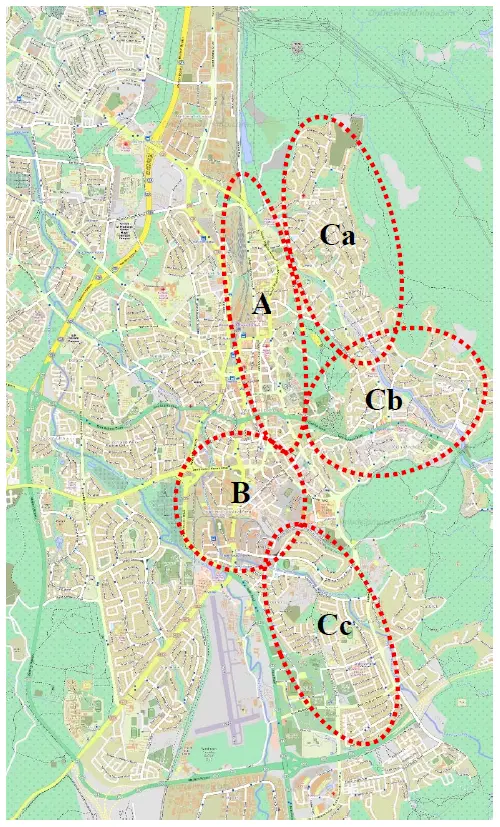
Table 1. Transects designed to study bird communities, their length, route, and date and time of counts, and speed of count (min./1 km) were conducted.
|
# |
Date |
Start/End Time |
Length |
Speed |
District |
Course |
|---|---|---|---|---|---|---|
|
2 |
9 August |
08.00–10.15 |
2.0 km |
68 |
A, Centre |
(Railway)-Indongo-Werner List-Karina-Mugabe-Independence-Werner |
|
5 |
12 August |
08.10–11.00 |
7.0 km |
24 |
A, Centre |
Berg-Kaunda-Nujoma-Heinzburg-Kesteel-Burg-Thorer[Hubert]-Feld-Scott-Karuaihe[Luderitz]-Moltke-Karina-Ndemufayo-(Indonga) |
|
6 |
14 August |
08.00–10.30 |
4.2 km |
36 |
A, Centre |
(Barella)-Kaunda-Schanzenweg-Promenadenweg-Langenhoven-Lilliencron-Pupkowitz-Independence-Luther-Lilliencron-Kaunda[Uhland]-Goethe-Independence-(Bahnhof) |
|
12 |
23 August |
07.30–10.30 |
3.3 km |
55 |
A, Centre |
Chapman-Kaunda-Nujoma-Heinzburg-Gurirab[Burg]-Thorer[Hubert]-Jonker-Neto Circle-Independence-Nujoma-Blohm-Sixixung-Kutako-(Indonga) |
|
7 |
16 August |
07.40–10.40 |
7.8 km |
23 |
B, Industrial South/Centre |
(Mandela)-Berg-Eadi-Jonker-Galilei-Faraday-Gutenberg-Nachtigal-Merensky-Tal-Nujoma-Trifft-Rehoboter-Ndemufayo-Shixungileni[Bismarck]-Nuyoma-Haddy-Schmerenbeck-Hoogenot-Vogelsang-Castro-Ndemufayo |
|
8 |
17 August |
08.45–11.15 |
4.2 km |
36 |
B, Industrial South |
(Rehobother)-Bell-Show Grounds-Stokes-Patterson-Campbell-Stokes-Armstrong-Manning-Patterson-Nyerere-Voigt-Planck-Marconi-Kelvin-Bismarch-Kulz-Kerby-Church-Konrad-Nujoma-(Independence) |
|
15 |
27 August |
07.15–11.00 |
7.4 km |
30 |
B, Industrial South/Olympia |
(Mororo)-Ndemufayo-Dalmler-Joule-Parsons-Perkin-Alwyn-Seder-Palm-Springbok-Sable-Oryx-Eland-Impala-Duiker-Rietbok-Buffel-Gnu-Bosbok-Springbok-Palm-Blackwood-Acacia-Tacoma |
|
1 |
8 August |
08.35–10.50 |
3.3 km |
41 |
Ca, Eros |
Chapman-Kaunda-Mandela-Barella-Woermann-Frederick Gese-Kaunda-Metje-Mandela-(Chapman) |
|
3 |
10 August |
08.10–10.30 |
3.0 km |
47 |
Ca, Eros |
(Mandela)-Bowker-Ziegler-Von Eckenbrecher-Palme-Hanman-Rust-Nkurmah-Hahn-Koch-Berg-Breitling |
|
10 |
21 August |
08.15–11.15 |
4.0 km |
45 |
Ca, Eros |
(Mandela)-Barella-Nlaaukuse-Lotz-river valley-Kuiseb-Gorges-Gutsche-Aob-Spitzkop-Drakensberg-Naukluft-Atlas-Voortreker-Etna-river valley- (Promenadenweg) |
|
11 |
22 August |
07.45–11.15 |
3.4 km |
62 |
Cb, Eros/Centre |
(Eros)-Mugabe-Etna-Independence-Eros-Kilimanjaro-Rossing-Palomar-Valley-Muhamed-Outeniqua-Groot Tiras-Brandberg-Independence-Anokos-Kreuzburg-Shakespeare-Johnson-Independence-Zoo Park |
|
4 |
11 August |
08.00–10.55 |
5.1 km |
34 |
Cb, Klein Windhoek |
(Berg)-Mandela-Jonker-Stauch-Krumah-Quenta-Schafer-Reuining-Woermann |
|
9 |
19 August |
08.55–11.50 |
7.7 km |
23 |
Cb, Eros/Klein Windhoek |
Bowker-Palme-Ametis-Eros-Muhamed-Khan-Drakensberg-Kunene-Caprici-Mandela-(Chapman) |
|
13 |
24 August |
07.20–10.30 |
8.5 km |
22 |
Cc, Olympia |
Makbede-Tjitendero-Bekker-Tjitendero-Ogumbo-Omukunda-Evans-Tjitedero-Brand-Wilson-Atkinson-Tjitendero-Kaltenbrun-Brand-Dreyer-Kuppe-Dreyer-Raymond-Ndadi |
|
16 |
25 August |
09.00–10.30 |
3.6 km |
25 |
Cc, Olympia |
Frederick-Ndadi-Danielowitz-Brand-Joubert-Tjitendero-Kabila |
|
14 |
26 August |
07.10–10.35 |
5.3 km |
39 |
Cc, Suiderhof |
Toivo ya Toyvo-Bessemer-T.y.T-Messum-Bamsrat-Messum-T.y.T.-Diaz-T.y.T.-Van Zyl-Knudsen-Kabila |


2.2. Data Collection
Studies were conducted in August 2020. The line transect method [14,15] (Bibby et al. 2012, Sutherland 1996) has been employed to count birds. Counts were conducted on 16 transects by one researcher in the mornings, under sunny, calm weather conditions. Each transect was surveyed only once. The single surveys were compensated by a higher number of transects, enabling to calculation of ranges and variances for particular parameters. In total, 16 days (mornings) were spent on counting. Only resident (potentially breeding) birds were counted [14,15] (Bibby et al. 2012, Sutherland 1996). Not all resident birds can be regarded as potentially breeding; only adult birds performing breeding or territorial displays, and recorded in habitats suitable for foraging, nesting, and breeding. 1–2 recorded adult birds at the same site were regarded as a breeding pair, 3–4 as two pairs, 5–6 as three and so on. Incidentally, flying over birds, like herons, ducks or raptors, were excluded from counts, as were also Palearctic vagrants and visitors. As recommended in the line transect method [14], a potentially breeding pair, not an individual, was a census unit. Each transect length, route, date and time of counts are given in Table 1.
2.3. Data Analysis
The dominance is expressed as the percentage of the total number of breeding pairs of a given species in relation to the total number of all breeding pairs of all species recorded. As in most other studies on bird communities, dominant species are defined as those comprising 5% or more of all breeding pairs of all species recorded, while subdominant species are those comprising 2–4.99%. The relative abundance is expressed as the linear population density, i.e., the number of breeding pairs per 10 km of the transect.
Two indices were used to characterize the diversity of avian communities:
Species diversity was also determined using the Shannon Diversity Index per site:
where: pi = proportion of individuals of the ith species in a whole community; pi = n/N, where: n = number of individuals of a given species.
Pielou’s Evenness Index was used as a measure of equality or heterogeneity in the relative abundances of the different species present in each habitat distinguished.
where: ln(S) = the natural logarithm of the species richness (S) in a particular habitat. E was also based on species relative abundances and ranged from 0 to 1. A value of 0 signified no evenness in species abundances and 1 denoted complete evenness.
As universally accepted in the analysis of the structure of avian communities, the following ecological guilds were distinguished:
Nesting: T—in trees or shrubs (but not in tree holes), B—buildings, G—on the ground; H—in tree holes;
Diet: G—granivorous, F—frugivorous, I—insectivorous, C—carnivorous, H—herbivorous (but not granivores or frugivores).
The Sørensen Similarity Index was used to investigate similarities between avian communities in various habitat types: S = 2c/(a + b), where “c” is the number of species common for two compared communities, a = the number of species in the community “a”, and b = the number of species in the community “b”. The index changes from 0 (absolute dissimilarity between communities) to 1 (identical communities).
The one-way analysis of variance (ANOVA) was used to identify differences in the abundance of species between habitat types. The χ2-test was used to test differences in the number of species recorded between habitat types, in the number of breeding pairs per 1 km between different habitat types, and between main ecological guilds within the same habitat type.
3. Results
The avian assemblage was composed of 32–45 resident (breeding) bird species in each habitat, distinguished, with 4–7 dominant species identified in each of these habitats (Appendix A, Table 2 and Table 3). The dominant species comprised more than half of all birds recorded in each habitat. Three species, the House Sparrow Passer domesticus, Laughing Dove Spilopelia senegalensis, and Red-eyed Bulbul Pycnonotus nigricans, were recorded as dominants in each habitat. Their overall proportion was 36.6%. The proportion of the House Sparrow in particular habitat changed from 17.3% to 23.5%, being 19.0% in overall. It was by far the most abundant bird species in Windhoek. It was followed by the Laughing Dove, with an overall dominance of 10.2% (5.6–14.5% in particular habitats). The Red-eyed Bulbul dominance changed between 5.5% and 10.3% (overall 7.6%). The South African Masked Weaver Ploceus velatus was not a dominant species in one habitat only, while the Feral Pigeon Columba livia was a dominant species only in one habitat. Apart from these species, the Little Swift Apus affinis, and Speckled Pigeon Columba guinea were found as dominant in three out of the five distinguished habitats, the White-browed Sparrow Weaves Plocepasser mahali—in two, whereas the Blue Waxbill Uraeginthus angolensis and African Black Swift Apus barbatus—only in one habitat (Appendix A, Table 2). Most of the dominant species were granivores, only the Red-eyed Bulbul was a granivore, and the Little Swift was the only insectivore.
The group of subdominants comprised, in overall, seven additional species, i.e., African Palm Swift Cypsiurus parvus, African Reed Warbler Acrocephalus scirpaceus, Black Swift, Black-throated Canary Crithagra atrogularis, Red-headed Finch Amadina erythrocephala, Rosy-faced Parrot Agapornis roseicollis, Rufous-vented Tit-babbler Sylvia subcaerulea, and White-backed Mousebird Colius colius. Their overall contribution was 28.2% (Table 2 and Table 3). A similar proportion of granivorous and insectivorous species was recorded in the subdominant group.
The relative abundance of particular species did not differ significantly between habitats (Table 4). Sorensen Similarity Index was the highest between habitat B and Cb (0.90), and between Cb and Cc (0.91), whereas it was the lowest between habitat A and Cc (0.53) (Table 5).
Shannon’s Diversity Index was low, ranging slightly between 1.17 and 1.26. Pielou’s Evenness Index was also low and much the same (0.31–0.36) in all avian communities studied.
Table 2. Dominant species and parameters characterizing bird communities in particular urban habitats (A, B, Ca, Cb, Cc) in Windhoek.
|
Parameter |
A |
B |
Ca |
Cb |
Cc |
Total |
|---|---|---|---|---|---|---|
|
Number of species |
41 |
41 |
41 |
32 |
45 |
61 |
|
Number of breeding pairs |
1926 |
1337 |
1527 |
706 |
1367 |
6863 |
|
Number of dominant species |
7 |
6 |
7 |
7 |
4 |
6 |
|
Cumulative dominance |
67.7 |
58.0 |
65.6 |
65.4 |
54.5 |
59.88 |
|
Dominance Index |
0.34 |
0.29 |
0.28 |
0.34 |
0.38 |
0.29 |
|
Shannon Diversity Index |
1.17 |
1.25 |
1.25 |
1.26 |
1.19 |
1.26 |
|
Pielou’s Evenness Index |
0.32 |
0.34 |
0.34 |
0.36 |
0.31 |
0.31 |
Table 3. Dominant species (dominance values are given) in different habitat types. Listed are all species recorded as dominant at least in one habitat type.
|
Species Name |
Habitat A |
Habitat B |
Habitat Ca |
Habitat Cb |
Habitat Cc |
Average |
|---|---|---|---|---|---|---|
|
House Sparrow |
17.7 |
17.3 |
17.5 |
20.1 |
23.5 |
19.2 |
|
Laughing Dove |
5.6 |
8.5 |
11.0 |
14.2 |
14.5 |
10.8 |
|
Little Swift |
16.4 |
9.4 |
7.5 |
0.0 |
7.1 |
8.1 |
|
Red-eyed Bulbul |
5.3 |
5.4 |
9.3 |
9.3 |
10.3 |
7.9 |
|
Masked Weaver |
3.1 |
12.2 |
8.4 |
6.1 |
6.2 |
7.2 |
|
Feral Pigeon |
16.8 |
4.8 |
4.3 |
1.6 |
0.1 |
5.5 |
|
Speckled Pigeon |
5.7 |
3.4 |
5.1 |
7.4 |
2.3 |
4.8 |
|
Sparrow-Weaver |
2.3 |
5.2 |
6.7 |
3.1 |
4.5 |
4.4 |
|
Blue Waxbill |
1.6 |
2.2 |
4.6 |
6.5 |
3.4 |
3.7 |
|
Black Swift |
5.7 |
2.2 |
0.3 |
1.4 |
0.0 |
1.9 |
|
Total |
80.2 |
70.6 |
74.7 |
69.7 |
71.9 |
73.4 |
Table 4. Results of ANOVA analysis used to identify the existence of differences in the relative abundance of species between three main habitat types (A, B, Ca).
|
Source of Variation |
SS |
df |
S2 |
F |
|---|---|---|---|---|
|
Between |
382,402 |
2 |
1,912,001 |
6.24 |
|
Within |
7,318,905 |
59 |
30,623 |
|
|
Total |
7,701,307 |
61 |
F2,239 = 6.24; p > 0.05.
Table 5. Sørensen index (right diagonal) and statistical differences (χ2-test) between the numbers of species (left diagonal).
|
Habitat A |
Habitat B |
Habitat Ca |
Habitat Cb |
Habitat Cc |
|
|---|---|---|---|---|---|
|
Habitat A |
0.56 |
0.56 |
0.85 |
0.53 |
|
|
Habitat B |
0.00 |
0.66 |
0.90 |
0.60 |
|
|
Habitat Ca |
0.00 |
0.00 |
0.85 |
0.60 |
|
|
Habitat Cb |
0.55 |
0.55 |
0.55 |
0.91 |
|
|
Habitat Cc |
0.09 |
0.09 |
0.09 |
1.10 |
Relatively low population densities were recorded for raptors (Accipiteriformes, Falconiformes), crows (Corvidae), African Hoopoe Upupa epops, Cape Thick-knee Burhinus capensis, Crowned Lapwing Vanellus coronatus, Fork-tailed Drongo Dicrurus adsimilis, Brubru Nilaus afer, Familiar Chat Cercomela familiaris, and Yellow Canary Crithagra flaviventris. Unexpectedly, the Cape Turtle Dove Streptopelia capicola was virtually absent in all transects. On the other hand, relatively high population densities were recorded for species such as the Scarlet-chested Sunbird Chalcomitra senegalensis, Dusky Sunbird Cinnyris fuscus, Rufous-vented Tit-babbler, Cape Glossy Starling Lamprotonis nitens, and African Palm Swift.
In all distinguished habitats, granivores comprised more than half of all birds recorded (Figure 3). Frugivores comprised 20.4–28.0% in most habitats. Only in the city centre, they comprised less, i.e., 16%. The insectivorous birds were represented by a higher number of species than the granivorous and frugivorous birds. However, they comprised less than 20% in most habitats, except for the city centre with 28.2% (Figure 3, Table 6).
In most habitats, birds nesting on trees or shrubs comprised at least 50%, except for the city centre where they comprised only 30.6%. On the other hand, species nesting on/in buildings comprised as much as 68.2% only in the city center (Figure 4, Table 6). In all other habitats, their contribution ranged between 39.2% and 48.5%. Other nesting guilds were marginal. Their overall contribution in each habitat ranged between 1% and 3%. The proportion of nesting guilds was distinctively much the same in all suburb habitats (Figure 4).

Figure 3. Proportions of feeding guilds of bird communities in particular urban habitats (A, B, Ca, Cb, Cc) in Windhoek.
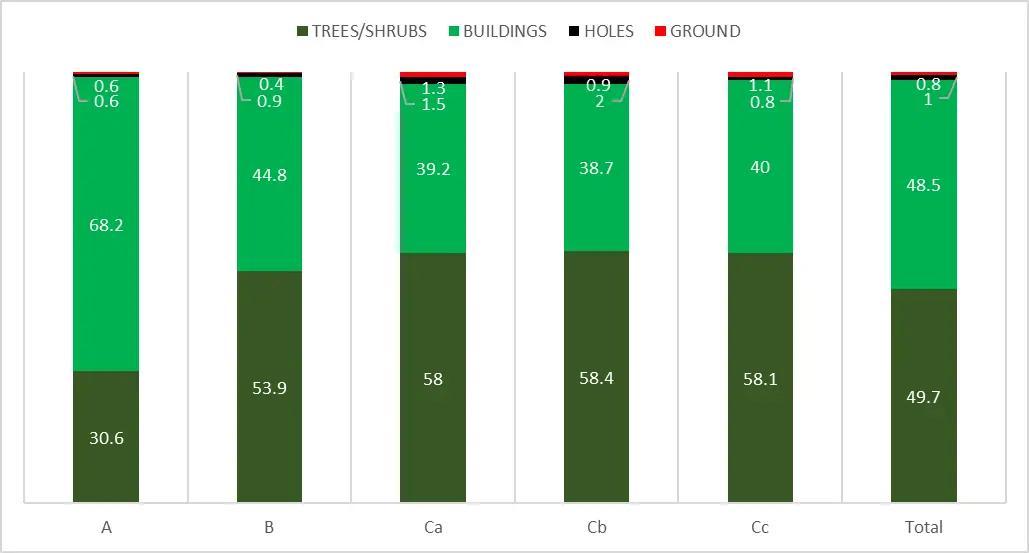
Figure 4. Proportions of nesting guilds in bird communities in particular urban habitats (A, B, Ca, Cb, Cc) in Windhoek.
Table 6. Statistical differences between main ecological guilds within the habitat.
|
Comparable Guilds |
Habitat A |
Habitat B |
Habitat Ca |
Habitat Cb |
Habitat Cc |
Overall |
|---|---|---|---|---|---|---|
|
Main feeding guilds |
||||||
|
Granivorous (O1) |
1075 |
746 |
962 |
465 |
901 |
4152 |
|
Frugivorous (O2) |
308 |
214 |
354 |
187 |
362 |
1414 |
|
Insectivorous (O3) |
543 |
377 |
211 |
54 |
104 |
1297 |
|
E |
642 |
446 |
509 |
235 |
456 |
2288 |
|
χ2 |
480.5 |
333.5 |
625.0 |
374.8 |
725.7 |
2282.3 |
|
p |
<0.01 |
<0.01 |
<0.01 |
<0.01 |
<0.01 |
<0.01 |
|
Main nesting guilds |
||||||
|
Tree/shrubs (O1) |
589 |
409 |
886 |
412 |
798 |
3411 |
|
Buildings (O2) |
1314 |
912 |
599 |
273 |
529 |
3329 |
|
E |
951 |
660 |
742 |
343 |
664 |
3370 |
|
χ2 |
275.6 |
191.3 |
55.5 |
28.2 |
54.6 |
1.0 |
|
p |
<0.01 |
<0.01 |
<0.01 |
<0.01 |
<0.01 |
>0.05 |
4. Discussion
The applied method is suitable for calculating dominance, but less so for assessing population densities. For species elusive, silent, and not active vocally (e.g., Cape Penduline-tit Anthoscopus minutus, Dusky Sunbird, Long-billed Crombec Sylvietta rufescens, Marico Flycatcher, Pearl-spotted Owlet Glaucidium perlatum, Pririt Batis Batis pririt, Short-toed Rock Thrush Monticola brevipes, Red-billed Firefinch Logonosticta senegala), the population densities were certainly underestimated. To minimize such bias, studies should be supplemented by netting, point counts, or even by call stimulations. On the other hand, for conspicuous and vocally active species (doves, crows, Rosy-faced Lovebird, Speckled Pigeon, White-browed Sparrow-Weaver) estimations were much more precise and accurate. Based on the line transect method, the linear population densities can be calculated by assuming that for most passerine species, Swallow-tailed Bee-eater Merops hirundineus, Pearl-spotted Owlet, 10 km of transect is roughly an equivalent of 50 ha, while for most non-passerines, Crimson-breasted Shrike Laniarius atrococcineus, Brubru, 10 km of transect can be roughly an equivalent of 100 ha. The density values are therefore only rough estimations representing minimal values. These values, which might be called relative densities, are good for internal comparisons between particular species, transects, and habitats. Such comparisons are especially justified if counts were conducted in the same period, time of the day, with a similar speed, and by the same researcher, as was in this study. In the future, more accurate estimations based on the repeated counts on transects or by means of the territory mapping method should be applied.
Sparrows and doves/pigeons constitute the main components of urban habitats in the following Namibian towns: Windhoek [16,17,18], Outapi [19], Ongwediva [20], Katima Mulio [21,22,23], Tsumeb [24], Swakopmund [25], Henties Bay [26], and Walvis Bay [27]. The same situation was recorded in towns in other southern African countries: e.g., Bloemfontein, South Africa [28,29], Bethlehem, South Africa [30], Maseru, Lesotho [31], Kasane, Botswana [32], and others [33,34]. The alien House Sparrow is a dominant species in all Namibian towns investigated, except for Katima Mulilo, where the indigenous Southern Grey-headed Sparrow Passer diffusus still dominates, and where it is, de facto, the only sparrow species breeding in the town [21,35]. In the coastal towns (Walvis Bay, Swakopmund, and Henties Bay), beside the House Sparrow, the Cape Sparrow was also found to be a dominant species [25,26,27] (Table 7).
Table 7. Dominant species (dominance value is given for each species) and parameters characterizing avian assemblages in Namibia. Dominance values higher than 5 are given in bold case; n/d = no data available.
|
Outapi |
Ongwadiva |
Katima Mulilo |
Henties Bay |
Swakop-mund |
Walvis Bay |
Windhoek |
|
|---|---|---|---|---|---|---|---|
|
Species |
|||||||
|
House Sparrow |
48.4 |
48.8 |
0.0 |
16.6 |
7.1 |
9.1 |
19.0 |
|
Cape Sparrow |
0.0 |
0.0 |
0.0 |
7.4 |
27.7 |
21.4 |
0.1 |
|
Grey-headed Sparrow |
0.0 |
0.0 |
10.6 |
0.0 |
0.0 |
0.0 |
0.0 |
|
Masked Weaver |
1.0 |
2.8 |
3.8 |
10.6 |
7.4 |
6.9 |
7.0 |
|
Laughing Dove |
2.5 |
11.3 |
10.2 |
29.4 |
20.1 |
12.9 |
10.0 |
|
Feral Pigeon |
3.9 |
0.0 |
0.4 |
0.0 |
13.8 |
18.7 |
6.8 |
|
Speckled Pigeon |
0.0 |
1.1 |
0.0 |
4.0 |
2.2 |
6.9 |
1.8 |
|
Red-eyed Bulbul |
2.5 |
4.7 |
0.0 |
0.0 |
0.9 |
0.4 |
7.5 |
|
Black-eyed Bulbul |
0.0 |
0.8 |
13.2 |
0.0 |
0.0 |
0.0 |
0.0 |
|
Little Swift |
0.0 |
0.0 |
1.4 |
0.0 |
0.0 |
0.4 |
9.5 |
|
African Palm Swift |
5.4 |
1.3 |
0.1 |
0.0 |
0.0 |
0.0 |
1.8 |
|
Common Waxbill |
0.0 |
0.0 |
0.0 |
14.6 |
10.2 |
12.2 |
0.0 |
|
Blue Waxbill |
12.0 |
9.2 |
6.1 |
0.0 |
0.0 |
0.0 |
0.8 |
|
Rosy-faced Lovebird |
0.6 |
0.0 |
0.0 |
7.1 |
0.0 |
0.0 |
0.8 |
|
Parameters |
|||||||
|
Number of species |
29 |
30 |
110 |
14 |
17 |
17 |
61 |
|
Cumulative Dominance |
67.8 |
69.3 |
35.7 |
n/d |
n/d |
65.2 |
59.9 |
|
Dominance Index |
0.60 |
0.60 |
0.24 |
n/d |
n/d |
0.40 |
0.29 |
|
Shannon Diversity Index |
2.13 |
2.01 |
3.39 |
n/d |
n/d |
2.21 |
1.26 |
|
Pielou’s Evenness Index |
0.63 |
0.59 |
0.81 |
n/d |
n/d |
0.76 |
0.31 |
|
Source |
19 |
23 |
24 |
26 |
25 |
27 |
This study |
Doves/pigeons are a dominant group in all Namibia towns, except for Outapi [19,35]. The probable reason for this unusual situation is a high population density of Pied Crows Corvus albus (non-breeding), which have fairly large roosting sites on local giant baobabs. The Feral Pigeon was recorded as a dominant species only in Windhoek and in coastal towns. Two other granivores were often dominant: the Blue Waxbill in northern towns (Outapi, Ondangwa, and Katima Mulilo), and the Common Waxbill Estrilda astrild in the coastal towns (Table 3). Other dominant species recorded in Namibian towns were Red-eyed Bulbul (Windhoek), Black-capped Bulbul Pycnonotus tricolor (Katima Mulilo), Rosy-faced Lovebird (Henties Bay), African Palm Swift (Outapi), and Little Swift (Windhoek) (Table 3).
In Bloemfontein, the proportion of granivores (71%) was even higher than in Windhoek (61%), with 15% insectivores and 14% frugivores in the former city [29]. However, in north-central Namibian towns, Outapi and Ongwadiva granivorous comprised 77% and 78%, while insectivorous 12% and 10% respectively [23,36]. Similarly, in Katima Mulilo, granivores comprised 69%, frugivores—18% and insectivores—11% [19,23]. The domination of granivores, especially sparrows and doves/pigeons, in urbanized habitats has also been well documented in most cities/towns in Europe [37]. The reason for such a situation is that seeds, nuts, grain, and grain products, which constitute the bulk of granivores’ diet, are often superabundant in urban environments, as these are often wasted by people as garbage.
The nesting guilds in Bloemfontein were dominated by tree/shrub nesting birds (61%); birds nesting on/in buildings comprised 36%; and all other—3% [29]. In two study plots in Katima Mulilo, birds nesting on trees and shrubs (61%, 59%) dominated over those nesting on/in buildings (17%, 34%) and in holes (22%, 7%) [19,23]. In Outapi and Ongwadiva, the proportion between trees/shrubs nesting and building nesting birds was almost equal [23,36]. High proportions of birds nesting on/in buildings in urban habitats are well known in European studies [37].
Both the number of species and the biodiversity index are much higher in Katima Mulilo than in Windhoek (110 vs. 61 species; 3.39 vs. 1.26, respectively). Also, the avian assemblage in Katima Mulilo was much more evenly distributed (0.81) than in Windhoek (0.31). In Bloemfontein [29], a town situated amidst grasslands of the Highveld, cumulative dominance was 71.2%, and the following species were dominants: Cape Sparrow Passer melanurus—28.5%, Speckled Pigeon—19.7%, Cape Turtle-Dove—6.2%, Laughing Dove—6.6%, and Little Swift—10.2% [29]. Granivores comprised 71%, insectivores—15% and frugivores—14%; tree/shrub nesting birds—61%, on/in buildings—36% and remaining—3% [29]. The similarity of Bloemfontein and Windhoek avian communities may result from the fact that both cities are located in treeless arid biomes. In the course of ever ever-increasing urbanization process, a new ecosystem was created in both cities, which can be termed as artificial woodland/savanna or urban forest [38]. The Speckled Pigeon, Laughing Dove, Cape Turtle-Dove, and Masked Weaver were dominant in all other southern African towns, where avian assemblages were quantified, i.e., in Bethlehem [30], Ladybrand [39], Maseru [31], Roma [19], and Kasane [32]. It is interesting to note that Cape Turtle-Dove was distinctively rare or absent in most Namibian towns, except in the far north-east. Most of the towns, where the Cape Turtle-Dove is rare, are situated in arid regions. However, at least in the Cuvelai Drainage System, where water is abundant, the Cape Turtle-Dove is common in the savanna, e.g., ref. [40], but still very rare in towns [41,42]. The comparison of population densities and dominances of particular bird species and their groups between cities presents only certain approximations, as different count methods and different research intensity were applied in each city. The population density indices are certainly more affected in those studies than dominance and indices values.
5. Conclusions
Urban green spaces in the city of Windhoek attract relatively high number of breeding birds. As in other urban habitats in other African cities, granivores are by far the most important feeding guild, but among nesting guilds, the most common are tree/shrub nesting birds, while in other urbanized habitats, birds nesting on/in buildings are the commonest. Both species richness and species diversity vary markedly between particular green spaces. Since the urban environment is being degraded mostly due to rapid development, there is an urgent need to monitor the environmental quality in towns and cities. Birds come to the picture simply as bioindicators of environmental health and therefore should focus more attention of urban planners, ecologists, and nature conservationists.
Appendix A
Table A1. Breeding bird communities (in descending order of the abundance) in five urban habitats in Windhoek, in August 2020. n—number of breeding pairs, d—linear density (pairs/10 km, %d—dominance (the percentage of the total number of breeding pairs of a given species in relation to the total number of all breeding pairs of all species recorded). The dominant species (at least 5%) in particular habitat are indicated with bold case. Guilds: fg—feeding guild (G—granivores, F—frugivores, I—insectivores, C—carnivores, V—herbivores); ng—nesting guilds (T—trees/shrubs, H—holes, B—buildings, G—grounds, V–herbaceous vegetation).
|
Species |
fg |
ng |
A, City Centre, 19.5 km |
B, Industrial Area, 19.4 km |
Ca, Eros 10.3 km |
Cb, Klein Windhoek, 16.2 km |
Cc, Olimpia/Suider. 17.4 km |
Total, 82.8 km |
|||||||||||||||
|---|---|---|---|---|---|---|---|---|---|---|---|---|---|---|---|---|---|---|---|---|---|---|---|
|
n |
d |
%d |
n |
d |
%d |
n |
d |
%d |
n |
d |
%d |
n |
d |
%d |
n |
d |
%d |
||||||
|
House Sparrow |
G |
B |
340 |
174.4 |
17.7 |
231 |
119.1 |
17.3 |
267 |
259.2 |
17.5 |
142 |
87.7 |
20.1 |
321 |
184.5 |
23.5 |
1301 |
157 |
18.96 |
|||
|
Laughing Dove |
G |
T |
108 |
55.4 |
5.6 |
114 |
58.8 |
8.5 |
168 |
163.1 |
11 |
100 |
61.7 |
14.2 |
198 |
113.8 |
14.5 |
688 |
83.1 |
10.02 |
|||
|
Little Swift |
I |
B |
315 |
161.5 |
16.4 |
126 |
64.9 |
9.4 |
115 |
111.7 |
7.5 |
0 |
0 |
0 |
97 |
55.7 |
7.1 |
653 |
78.9 |
9.51 |
|||
|
Red-eyed Bulbul |
F |
T |
103 |
52.8 |
5.3 |
72 |
37.1 |
5.4 |
142 |
137.9 |
9.3 |
66 |
40.7 |
9.3 |
141 |
81 |
10.3 |
524 |
63.3 |
7.64 |
|||
|
Southern Masked Weaver |
G |
T |
60 |
30.8 |
3.1 |
163 |
84 |
12.2 |
128 |
124.3 |
8.4 |
43 |
26.5 |
6.1 |
85 |
48.9 |
6.2 |
479 |
57.9 |
6.98 |
|||
|
Feral Pigeon |
G |
B |
323 |
165.6 |
16.8 |
64 |
33 |
4.8 |
65 |
63.1 |
4.3 |
11 |
6.8 |
1.6 |
2 |
1.1 |
0.1 |
465 |
56.2 |
6.78 |
|||
|
Speckled Pigeon |
G |
B |
109 |
55.9 |
5.7 |
45 |
23.2 |
3.4 |
78 |
75.7 |
5.1 |
52 |
32.1 |
7.4 |
31 |
17.8 |
2.3 |
315 |
38 |
4.59 |
|||
|
W.-b. Sparrow-Weaver |
G |
T |
44 |
22.6 |
2.3 |
69 |
35.6 |
5.2 |
103 |
100 |
6.7 |
22 |
13.6 |
3.1 |
62 |
35.6 |
4.5 |
300 |
36.2 |
4.37 |
|||
|
Rosy-faced Lovebird |
F |
B |
80 |
41 |
4.2 |
56 |
28.9 |
4.2 |
44 |
42.7 |
2.9 |
35 |
21.6 |
5 |
32 |
18.4 |
2.3 |
247 |
29.8 |
3.6 |
|||
|
Blue Waxbill |
G |
T |
31 |
15.9 |
1.6 |
30 |
15.5 |
2.2 |
70 |
68 |
4.6 |
46 |
28.4 |
6.5 |
47 |
27 |
3.4 |
224 |
27.1 |
3.26 |
|||
|
White-backed Mousebird |
F |
T |
49 |
25.1 |
2.5 |
57 |
29.4 |
4.3 |
62 |
60.2 |
4.1 |
25 |
15.4 |
3.5 |
15 |
8.6 |
1.1 |
208 |
25.1 |
3.03 |
|||
|
Red-headed Finch |
G |
T |
32 |
16.4 |
1.7 |
53 |
27.3 |
4 |
38 |
36.9 |
2.5 |
22 |
13.6 |
3.1 |
35 |
20.1 |
2.6 |
180 |
21.7 |
2.62 |
|||
|
Black-throated Canary |
G |
T |
26 |
13.3 |
1.3 |
30 |
15.5 |
2.2 |
34 |
33 |
2.2 |
24 |
14.8 |
3.4 |
50 |
28.7 |
3.7 |
164 |
19.8 |
2.39 |
|||
|
African Black Swift |
I |
B |
110 |
56.4 |
5.7 |
30 |
15.5 |
2.2 |
5 |
4.9 |
0.3 |
10 |
6.2 |
1.4 |
0 |
0 |
0 |
155 |
18.7 |
2.26 |
|||
|
African Palm Swift |
I |
T |
38 |
19.5 |
2 |
30 |
15.5 |
2.2 |
14 |
13.6 |
0.9 |
12 |
7.4 |
1.7 |
41 |
23.6 |
3 |
135 |
16.3 |
1.97 |
|||
|
Rufous-vented Tit-babbler |
I |
T |
21 |
10.8 |
1.1 |
20 |
10.3 |
1.5 |
34 |
33 |
2.2 |
12 |
7.4 |
1.7 |
41 |
23.6 |
3 |
128 |
15.5 |
1.87 |
|||
|
Grey Go-away-bird |
F |
T |
21 |
10.8 |
1.1 |
10 |
5.2 |
0.7 |
28 |
27.2 |
1.8 |
16 |
9.9 |
2.3 |
14 |
8 |
1 |
89 |
10.7 |
1.3 |
|||
|
Wattled Starling |
F |
T |
6 |
3.1 |
0.3 |
40 |
20.6 |
3 |
29 |
28.2 |
1.9 |
1 |
0.6 |
0.1 |
13 |
7.5 |
1 |
89 |
10.7 |
1.3 |
|||
|
Pale-winged Starling |
F |
B |
12 |
6.2 |
0.6 |
24 |
12.4 |
1.8 |
9 |
8.7 |
0.6 |
7 |
4.3 |
1 |
18 |
10.3 |
1.3 |
70 |
8.5 |
1.02 |
|||
|
Rock Maritn |
I |
B |
20 |
10.3 |
1 |
19 |
9.8 |
1.4 |
7 |
6.8 |
0.5 |
5 |
3.1 |
0.7 |
16 |
9.2 |
1.2 |
67 |
8.1 |
0.98 |
|||
|
Pied Barbet |
F |
H |
6 |
3.1 |
0.3 |
8 |
4.1 |
0.6 |
18 |
17.5 |
1.2 |
13 |
8 |
1.8 |
5 |
2.9 |
0.4 |
50 |
6 |
0.73 |
|||
|
Dusky Sunbird |
F |
T |
13 |
6.7 |
0.7 |
5 |
2.6 |
0.4 |
6 |
5.8 |
0.4 |
11 |
6.8 |
1.6 |
5 |
2.9 |
0.4 |
40 |
4.8 |
0.58 |
|||
|
Cape Glossy Starling |
F |
B |
1 |
0.5 |
0.1 |
1 |
0.5 |
0.1 |
6 |
5.8 |
0.4 |
10 |
6.2 |
1.4 |
16 |
9.2 |
1.2 |
34 |
4.1 |
0.5 |
|||
|
Pririt Batis |
I |
T |
4 |
2.1 |
0.2 |
9 |
4.6 |
0.7 |
4 |
3.9 |
0.3 |
6 |
3.7 |
0.8 |
11 |
6.3 |
0.8 |
34 |
4.1 |
0.5 |
|||
|
Black-chested Prinia |
I |
T |
3 |
1.5 |
0.2 |
3 |
1.5 |
0.2 |
6 |
5.8 |
0.4 |
0 |
0 |
0 |
17 |
9.8 |
1.2 |
29 |
3.5 |
0.42 |
|||
|
Red-faced Mousebird |
F |
T |
15 |
7.7 |
0.8 |
0 |
0 |
0 |
3 |
2.9 |
0.2 |
0 |
0 |
0 |
9 |
5.2 |
0.7 |
27 |
3.3 |
0.39 |
|||
|
Scarlet-chested Sunbird |
F |
T |
2 |
1 |
0.1 |
4 |
2.1 |
0.3 |
7 |
6.8 |
0.5 |
2 |
1.2 |
0.3 |
6 |
3.4 |
0.4 |
21 |
2.5 |
0.31 |
|||
|
Cape Wagtail |
I |
G |
7 |
3.6 |
0.4 |
1 |
0.5 |
0.1 |
4 |
3.9 |
0.3 |
3 |
1.9 |
0.4 |
5 |
2.9 |
0.4 |
20 |
2.4 |
0.29 |
|||
|
Helmeted Guineafowl |
G |
G |
1 |
0.5 |
0.1 |
1 |
0.5 |
0.1 |
13 |
12.6 |
0.9 |
1 |
0.6 |
0.1 |
0 |
0 |
0 |
16 |
1.9 |
0.23 |
|||
|
African Reed Warbler |
I |
V |
1 |
0.5 |
0.1 |
2 |
1 |
0.1 |
1 |
1 |
0.1 |
2 |
1.2 |
0.3 |
6 |
3.4 |
0.4 |
12 |
1.4 |
0.17 |
|||
|
Alpine Swift |
I |
B |
6 |
3.1 |
0.3 |
3 |
1.5 |
0.2 |
2 |
1.9 |
0.1 |
0 |
0 |
0 |
0 |
0 |
0 |
11 |
1.3 |
0.16 |
|||
|
Crimson-breasted Shirke |
I |
T |
1 |
0.5 |
0.1 |
1 |
0.5 |
0.1 |
4 |
3.9 |
0.3 |
2 |
1.2 |
0.3 |
1 |
0.6 |
0.1 |
9 |
1.1 |
0.13 |
|||
|
Swallow-tailed Bee-eater |
I |
H |
2 |
1 |
0.1 |
2 |
1 |
0.1 |
3 |
2.9 |
0.2 |
0 |
0 |
0 |
2 |
1.1 |
0.1 |
9 |
1.1 |
0.13 |
|||
|
Familiar Chat |
I |
B |
7 |
3.6 |
0.4 |
0 |
0 |
0 |
1 |
1 |
0.1 |
0 |
0 |
0 |
0 |
0 |
0 |
8 |
1 |
0.12 |
|||
|
Scaly-feathered Finch |
G |
T |
2 |
1 |
0.1 |
3 |
1.5 |
0.2 |
0 |
0 |
0 |
0 |
0 |
0 |
3 |
1.7 |
0.2 |
8 |
1 |
0.12 |
|||
|
Fork-tailed Drongo |
I |
T |
1 |
0.5 |
0.1 |
0 |
0 |
0 |
1 |
1 |
0.1 |
1 |
0.6 |
0.1 |
4 |
2.3 |
0.3 |
7 |
0.8 |
0.1 |
|||
|
Cape Turtle Dove |
G |
T |
1 |
0.5 |
0.1 |
1 |
0.5 |
0.1 |
0 |
0 |
0 |
0 |
0 |
0 |
2 |
1.1 |
0.1 |
4 |
0.5 |
0.06 |
|||
|
Cape White-eye |
F |
T |
0 |
0 |
0 |
0 |
0 |
0 |
0 |
0 |
0 |
0 |
0 |
0 |
3 |
1.7 |
0.2 |
3 |
0.4 |
0.04 |
|||
|
Cardinal Woodpecker |
I |
H |
1 |
0.5 |
0.1 |
0 |
0 |
0 |
1 |
1 |
0.1 |
0 |
0 |
0 |
1 |
0.6 |
0.1 |
3 |
0.4 |
0.04 |
|||
|
Egyptian Goose |
V |
G |
0 |
0 |
0 |
0 |
0 |
0 |
0 |
0 |
0 |
0 |
0 |
0 |
3 |
1.7 |
0.2 |
3 |
0.4 |
0.04 |
|||
|
Long-billed Crombec |
I |
T |
0 |
0 |
0 |
1 |
0.5 |
0.1 |
0 |
0 |
0 |
0 |
0 |
0 |
2 |
1.1 |
0.1 |
3 |
0.4 |
0.04 |
|||
|
Red-billed Firefinch |
G |
T |
1 |
0.5 |
0.1 |
1 |
0.5 |
0.1 |
1 |
1 |
0.1 |
0 |
0 |
0 |
0 |
0 |
0 |
3 |
0.4 |
0.04 |
|||
|
Scimitar Wood-hoopoe |
I |
H |
0 |
0 |
0 |
2 |
1 |
0.1 |
0 |
0 |
0 |
0 |
0 |
0 |
1 |
0.6 |
0.1 |
3 |
0.4 |
0.04 |
|||
|
African Hoopoe |
I |
H |
1 |
0.5 |
0.1 |
0 |
0 |
0 |
0 |
0 |
0 |
0 |
0 |
0 |
1 |
0.6 |
0.1 |
2 |
0.2 |
0.03 |
|||
|
Brubru |
I |
T |
0 |
0 |
0 |
1 |
0.5 |
0.1 |
0 |
0 |
0 |
0 |
0 |
0 |
1 |
0.6 |
0.1 |
2 |
0.2 |
0.03 |
|||
|
Mottled Swift |
I |
B |
0 |
0 |
0 |
0 |
0 |
0 |
2 |
1.9 |
0.1 |
0 |
0 |
0 |
0 |
0 |
0 |
2 |
0.2 |
0.03 |
|||
|
Namaqua Dove |
G |
T |
0 |
0 |
0 |
2 |
1 |
0.1 |
0 |
0 |
0 |
0 |
0 |
0 |
0 |
0 |
0 |
2 |
0.2 |
0.03 |
|||
|
Pearl-spotted Owl |
I |
H |
0 |
0 |
0 |
0 |
0 |
0 |
0 |
0 |
0 |
1 |
0.6 |
0.1 |
1 |
0.6 |
0.1 |
2 |
0.2 |
0.03 |
|||
|
Pied Crow |
C |
T |
1 |
0.5 |
0.1 |
0 |
0 |
0 |
0 |
0 |
0 |
0 |
0 |
0 |
1 |
0.6 |
0.1 |
2 |
0.2 |
0.03 |
|||
|
Red-billed Francolin |
G |
G |
0 |
0 |
0 |
2 |
1 |
0.1 |
0 |
0 |
0 |
0 |
0 |
0 |
0 |
0 |
0 |
2 |
0.2 |
0.03 |
|||
|
Short-toed Rock Thrush |
I |
B |
0 |
0 |
0 |
0 |
0 |
0 |
2 |
1.9 |
0.1 |
0 |
0 |
0 |
0 |
0 |
0 |
2 |
0.2 |
0.03 |
|||
|
Accipiter spp. |
C |
T |
0 |
0 |
0 |
0 |
0 |
0 |
1 |
1 |
0.1 |
0 |
0 |
0 |
0 |
0 |
0 |
1 |
0.1 |
0.01 |
|||
|
Bradfield’s Hornbill |
F |
H |
0 |
0 |
0 |
0 |
0 |
0 |
0 |
0 |
0 |
1 |
0.6 |
0.1 |
0 |
0 |
0 |
1 |
0.1 |
0.01 |
|||
|
Cape Penduline-tit |
I |
H |
0 |
0 |
0 |
1 |
0.5 |
0.1 |
0 |
0 |
0 |
0 |
0 |
0 |
0 |
0 |
0 |
1 |
0.1 |
0.01 |
|||
|
Spotted Thick-knee |
I |
G |
0 |
0 |
0 |
0 |
0 |
0 |
0 |
0 |
0 |
1 |
0.6 |
0.1 |
0 |
0 |
0 |
1 |
0.1 |
0.01 |
|||
|
Common Waxbill |
G |
T |
0 |
0 |
0 |
0 |
0 |
0 |
0 |
0 |
0 |
1 |
0.6 |
0.1 |
0 |
0 |
0 |
1 |
0.1 |
0.01 |
|||
|
Crowned Lapwing |
I |
G |
0 |
0 |
0 |
0 |
0 |
0 |
0 |
0 |
0 |
0 |
0 |
0 |
1 |
0.6 |
0.1 |
1 |
0.1 |
0.01 |
|||
|
Marico Flycatcher |
I |
T |
0 |
0 |
0 |
0 |
0 |
0 |
0 |
0 |
0 |
0 |
0 |
0 |
1 |
0.6 |
0.1 |
1 |
0.1 |
0.01 |
|||
|
White-tailed Shrike |
I |
T |
0 |
0 |
0 |
0 |
0 |
0 |
1 |
1 |
0.1 |
0 |
0 |
0 |
0 |
0 |
0 |
1 |
0.1 |
0.01 |
|||
|
Yellow Canary |
G |
T |
1 |
0.5 |
0.1 |
0 |
0 |
0 |
0 |
0 |
0 |
0 |
0 |
0 |
0 |
0 |
0 |
1 |
0.1 |
0.01 |
|||
|
Total |
1926 |
987.7 |
100 |
1337 |
689.2 |
100 |
1527 |
1483 |
100 |
706 |
435.8 |
100 |
1367 |
785.6 |
100 |
6863 |
828.9 |
100.00 |
|||||
Author Contributions
The author solely is responsible for conceptualization, methodology, analysis, investigation, writing of the manuscript and editing.
Ethics Statement
This article does not present research with ethical considerations and permits.
Informed Consent Statement
Not applicable.
Data Availability Statement
All other data produced in this study are provided in this manuscript.
Funding
This research received no external funding.
Declaration of Competing Interest
The author declares that he has no known competing financial interests or personal relationships that could have appeared to influence the work reported in this paper.
References
- Huang C, Yang J, Lu H, Huang H, Yu L. Green spaces as an indicator of urban health: Evaluating its changes in 28 mega-cities. Remote Sens. 2017, 9, 1266. doi:10.3390/rs9121266. [Google Scholar]
- Leveau LM, Ruggiero A, Matthews TJ, Isabel Bellocq MA. Global consistent positive effect of urban green area size on bird richness. Avian Res. 2019, 10, 30. doi:10.1186/s40657-019-0168-3. [Google Scholar]
- Aronson MF, Lepczyk CA, Evans KL, Goddard MA, Lerman SB, MacIvor JS, et al. Biodiversity in the city: Key challenges for urban green space management. Front. Ecol. Environ. 2017, 15, 189–196. doi:10.1002/fee.1480. [Google Scholar]
- Du Toit MJ, Cilliers SS, Dallimer M, Goddard M, Guenat S, Cornelius SF. Urban green infrastructure and ecosystem services in sub-Saharan Africa. Landsc. Urban Plan. 2018, 180, 249–261. doi:10.1016/j.landurbplan.2018.06.001. [Google Scholar]
- Antiri EO, Awuah HK, Salu P, Adoripore J, Boakye AE, Ansah EW. Impact of Urban Green on Population Health in SubSaharan Africa: A Scoping Review. J. Urban Health Bull. New York Acad. Med. 2025, 102, 830–847. doi:10.1007/s11524-025-00995-8. [Google Scholar]
- Kopij G. The Importance of Urban Greening Spaces for Avian Communities in an Urbanized Landscape. Land 2025, 14, 400. doi:10.3390/land14020400. [Google Scholar]
- Mensah CA. Urban green spaces in Africa: Nature and challenges. Int. J. Ecosyst. 2014, 4, 1–11. doi:10.5923/j.ije.20140401.01. [Google Scholar]
- Essel B. Depletion of urban green space and its adverse effect: A case of Kumasi, the former garden city of West-Africa. J. Environ. Ecol. 2017, 8, 1–10. doi:10.5296/jee.v8i2.11823. [Google Scholar]
- Appiah-Opoku S, Manu KK, Asibey MO, Amponsah O. Tragedy of urban green spaces depletion in selected sub-Sahara African major cities. J. Afr. Stud. Developm. 2023, 15, 46–61. doi:10.5897/JASD2023.0682. [Google Scholar]
- Nazombe K, Nambazo O. Monitoring and assessment of urban green space loss and fragmentation using remote sensing data in the four cities of Malawi from 1986 to 2021. Sci. Afr. 2023, 20, e01639. doi:10.1016/j.sciaf.2023.e01639. [Google Scholar]
- Fellowes M, Tryjanowski P, Aneoletto F. The Ecology and Biodiversity of Tropical Cities are as Important as they are Unknown. In Ecology of Tropical Cities, Volume I; Springer: Cham, Switzerland, 2025. doi:10.1007/978-3-031-48012-6_1. [Google Scholar]
- Muhoza JP, Zhou W. Urban green spaces in Africa: A bibliometric analysis. Environments 2024, 11, 68. doi:10.3390/environments11040068. [Google Scholar]
- Awoyemi AG, Ibanez-Alamo JD. Status of urban ecology in Africa: A systematic review. Landsc. Urban Plan. 2023, 233, 104707. doi:10.1016/j.landurbplan.2023.104707. [Google Scholar]
- Bibby CJ, Burgess ND, Hill DA. Bird Censuses Techniques; Academic Press: London, UK, 2012. [Google Scholar]
- Sutherland WJ. Ecological Census Techniques: A Handbook; Cambridge University Press: Cambridge, UK, 1996. [Google Scholar]
- Kopij G. Population densities of selected bird species in the city of Windhoek, Namibia. Berkut 2022, 31, 40–47. doi:10.5281/zenodo.10263781. [Google Scholar]
- Kopij G. Structure of breeding bird assemblages in the city of Windhoek, Namibia. Arxius Misc. Zool. 2023, 21, 19–38. doi:10.32800/amz.2023.21.0019. [Google Scholar]
- Kopij G. Effect of rainfall on the structure and population densities of birds breeding in a suburb of Windhoek, Namibia. Biologija 2023, 69, 1–11. doi:10.6001/biologija.2023.69.1.1. [Google Scholar]
- Kopij G. Population density and structure of birds breeding in an urban habitat dominated by large baobabs (Adansonia digitata), Northern Namibia. Biosys. Div. 2019, 27, 354–360. doi:10.15421/011947. [Google Scholar]
- Kopij G. Population density and structure of a breeding bird community in a suburban habitat in the Cuvelai drainage system, northern Namibia. Arxius Misc. Zool. 2021, 19, 313–320. doi:10.32800/amz.2021.19.0313. [Google Scholar]
- Kopij G. Birds of Katima Mulilo town, Zambezi Region, Namibia. Intern. Sci. Techn. J. Namib. 2016, 7, 85–102. Available online: https://www.researchgate.net/publication/307907529 (accessed on 1 September 2025).
- Kopij G. Structure of avian communities in a mosaic of built-up and semi-natural urbanised habitats in Katima Mulilo town, Namibia. Welwitschia Int. J. Agric. Sci. 2019, 1, 68–75. doi:10.32642/wijas.v1i0.1363. [Google Scholar]
- Kopij G. Structure of breeding bird community along the urban gradient in a town on Zambezi River, northeastern Namibia. Biologija 2020, 66, 1–9. doi:10.6001/biologija.v66i1.4185. [Google Scholar]
- Kopij G. Seasonal changes in the structure of an avian community in an urban habitat in northern Namibia. Biologija 2021, 67, 197–204. doi:10.6001/biologija.v67i4.4651. [Google Scholar]
- Kopij G. Provisional atlas of breeding birds of Swakopmund in the coastal Namib Desert. Lanioturdus 2018, 51, 2–12. Available online: https://www.researchgate.net/publication/326633715 (accessed on 1 September 2025).
- Kopij G. Provisional atlas of breeding birds of Hentjes Bay in the coastal Namib Desert. Nam. J. Environ. 2022, 6, C-6. doi:10.64640/03th5930. [Google Scholar]
- Kopij G. Provisional atlas of breeding birds of Walvis Bay in the coastal Namib Desert. Biologija 2023, 69, 251–261. doi:10.6001/biologija.2023.69.4.1. [Google Scholar]
- Kopij G. Breeding bird community of Bloemfontein city centre. Mirafra 1996, 13, 2–7. Available online: https://www.researchgate.net/publication/318317672 (accessed on 1 September 2025).
- Kopij G. Avian diversity in an urbanized South African grassland. Zool. Ecol. 2015, 25, 87–100. doi:10.1080/21658005.2015.1013744. [Google Scholar]
- Kopij G. Birds of Bethlehem, Free State province, South Africa. Mirafra 1997, 14, 5–12. Available online: https://www.researchgate.net/publication/318318027 (accessed on 1 September 2025).
- Kopij G. Birds of Maseru. NUL J. Res. 2000, 8, 104–151. https://www.researchgate.net/publication/318318083_Birds_of_Maseru (accessed on 1 September 2025). [Google Scholar]
- Kopij G. Atlas of Birds of Kasane, NE Botswana. Babbler 2018, 64, 3–15. Available online: https://www.researchgate.net/publication/336070376 (accessed on 1 September 2025).
- Kopij G. Bird communities of a suburb habitat in South African Highveld during the wet and dry season. Zesz. Nauk. AR Wrocław Zoot. 2004, 50, 205–211. Available online: https://www.researchgate.net/publication/286446871 (accessed on 1 September 2025).
- Kopij G. Avian diversity in ruderal and urbanized habitats in Lesotho. Berkut 2011, 20, 22–28. Available online: https://www.aetos.kiev.ua/berkut/berkut20/fauna20-4.pdf (accessed on 1 September 2025).
- Kopij G. Alien Birds in Sub-Saharan Africa: An Overview. Conservation 2025, 5, 16. doi:10.3390/conservation5020016. [Google Scholar]
- Kopij G. Population densities and community structure of birds breeding in a suburban wooded grassland in the Highveld of Lesotho. Vest. Zool. 2019, 53, 155–164. doi:10.2478/vzoo-2019-0016. [Google Scholar]
- Glutz von Blotzheim UN. (Eds.) Handbuch der Vögel Mitteleuropas; Aula-Verlag: Wiesbaden, Germany, 1966; Volume 1–15. [Google Scholar]
- Symes CT, Roller K, Howes C, Lockwood G, van Rensburg BJ. Grassland to urban forest in 150 years: Avifaunal response in an African metropolis. In Ecology and Conservation of Birds in Urban Environments; Springer International Publishing: Cham, Switzerland, 2017; pp. 309–341. [Google Scholar]
- Kopij G. Quantitative studies on birds breeding in Ladybrand, eastern Free State, South Africa. Zesz. Nuk. UP Wroc. Biol. Hod. Zwierz. 2009, 58, 121–127. Available online: https://www.researchgate.net/publication/286446869 (accessed on 1 September 2025).
- Kopij G. Status, distribution and numbers of birds in the Ogongo Game Park, north-central Namibia. Namib. J. Environ. 2023, 7, B-20. doi:10.64640/kh0ery94. [Google Scholar]
- Kopij G. Avian Assemblages in Urban Habitats in North–Central Namibia. Intern. Sci. Techn. J. Namibia 2014, 3, 64–81. Available online: https://www.researchgate.net/publication/286446507 (accessed on 1 September 2025).
- Kopij G. Structure of avian communities of suburbs of Rundu and Grootfontein, NE Namibia. Berkut 2021, 30, 20–24. Available online: https://aetos.kiev.ua/berkut/berkut30-1/berkut30-1-03.pdf (accessed on 1 September 2025).